The Cas4-Cas1-Cas2 complex mediates precise prespacer processing during CRISPR adaptation
- Iowa State University, United States
Figures
Figure 1 with 2 supplements
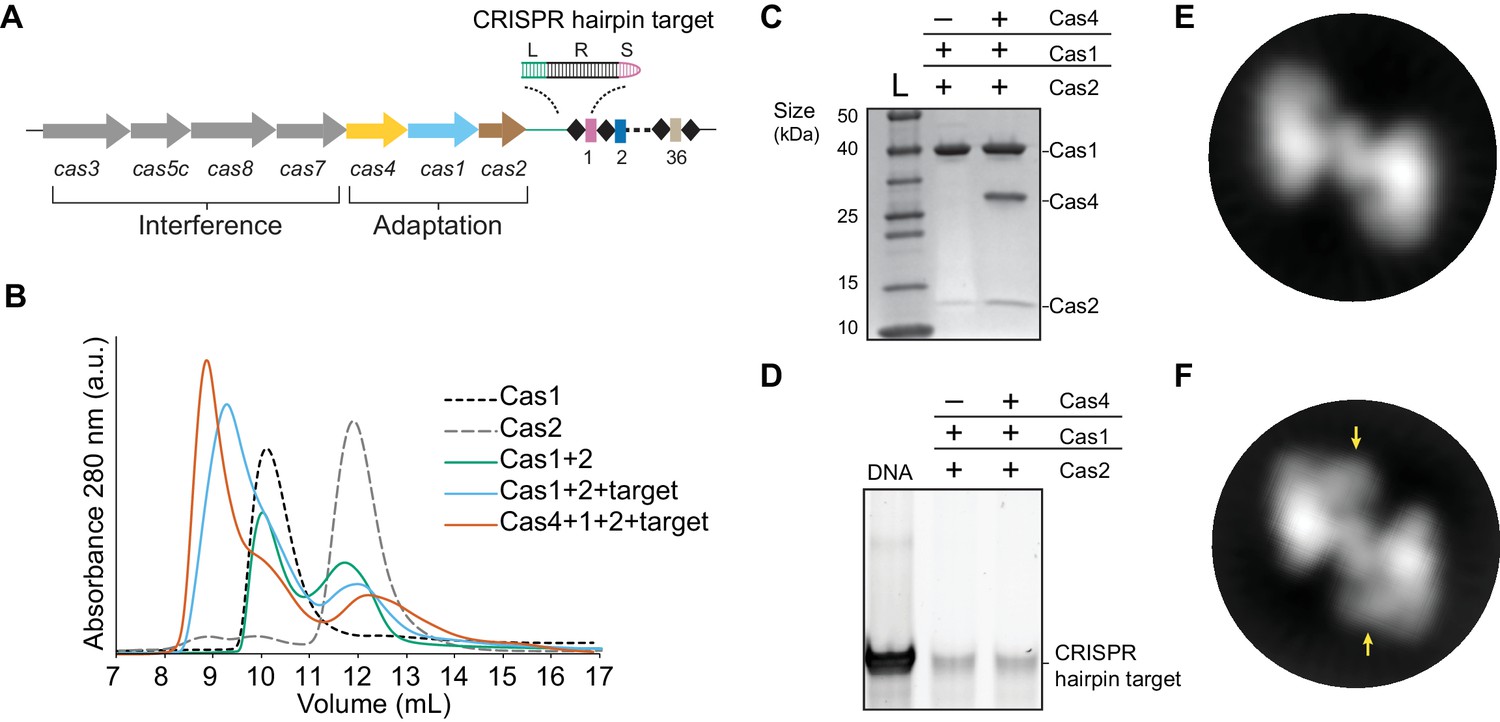
Complex formation of B. halodurans Cas1-Cas2 or Cas4-Cas1-Cas2 in the presence of CRISPR hairpin target.
(A) Overview of the cas genes and CRISPR locus found in the Bacillus halodurans type I-C system. Spacers are shown as rectangles, repeats are shown as diamonds, each cas gene is shown as an arrow and gene products involved in adaptation or interference are indicated. The CRISPR hairpin target used for this study contains a 10 bp leader (L, green), the full 32 bp repeat (R, black), and a 5 bp spacer (S, purple). (B) Size-exclusion chromatography (SEC) of various combinations of Cas1, Cas2, Cas4 and target DNA. (C) Coomassie-blue stained SDS-PAGE gel of proteins present in the earliest eluting peak fractions of SEC following complex formation. (D) SYBR Gold stained 10% PAGE gel of DNA present in the earliest eluting peak fractions of SEC following complex formation. (E) Representative 2D class average of the Cas1-Cas2 complex. (F) Representative 2D class average of the Cas4-Cas1-Cas2 complex. Extra density corresponding to Cas4 is indicated by arrows.
Figure 1—figure supplement 1
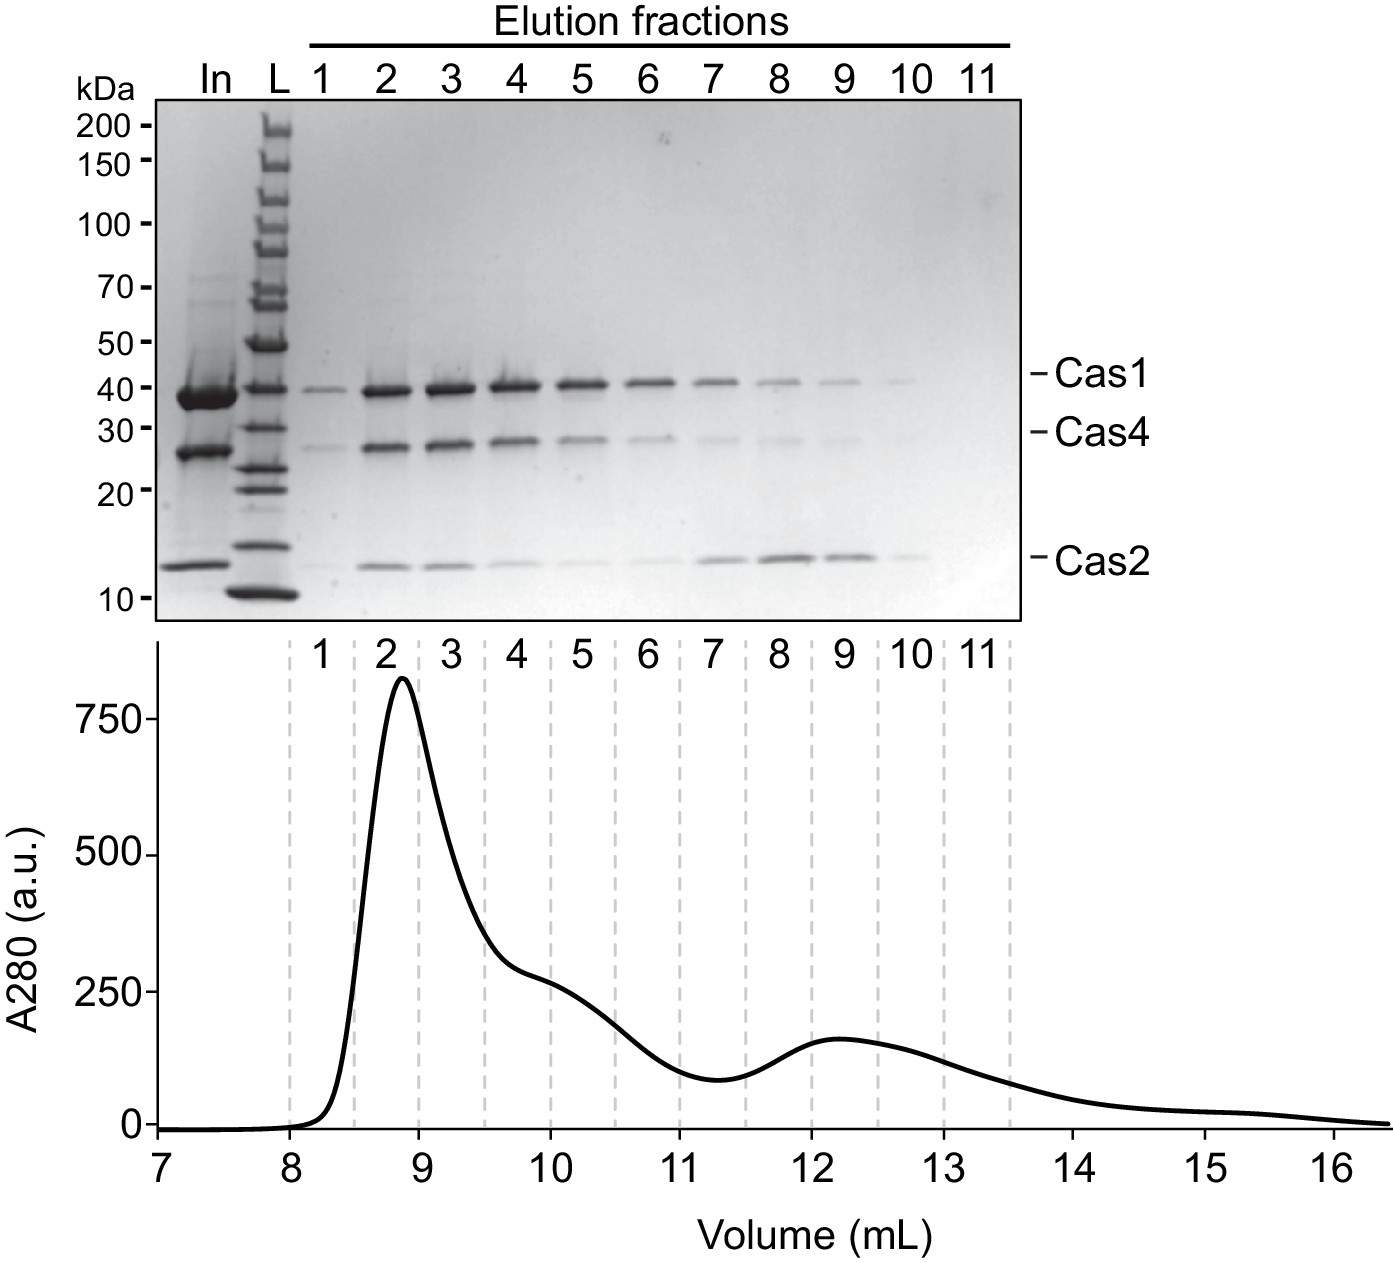
Analysis of Cas4-Cas1-Cas2 formation.
(A) Coomassie-blue stained SDS/PAGE gel of the fractions eluted from the size exclusion column when purifying the complex of Cas4-Cas1-Cas2 with the target DNA. The chromatogram is shown below to indicate where fractions eluted off the column.
Figure 1—figure supplement 2
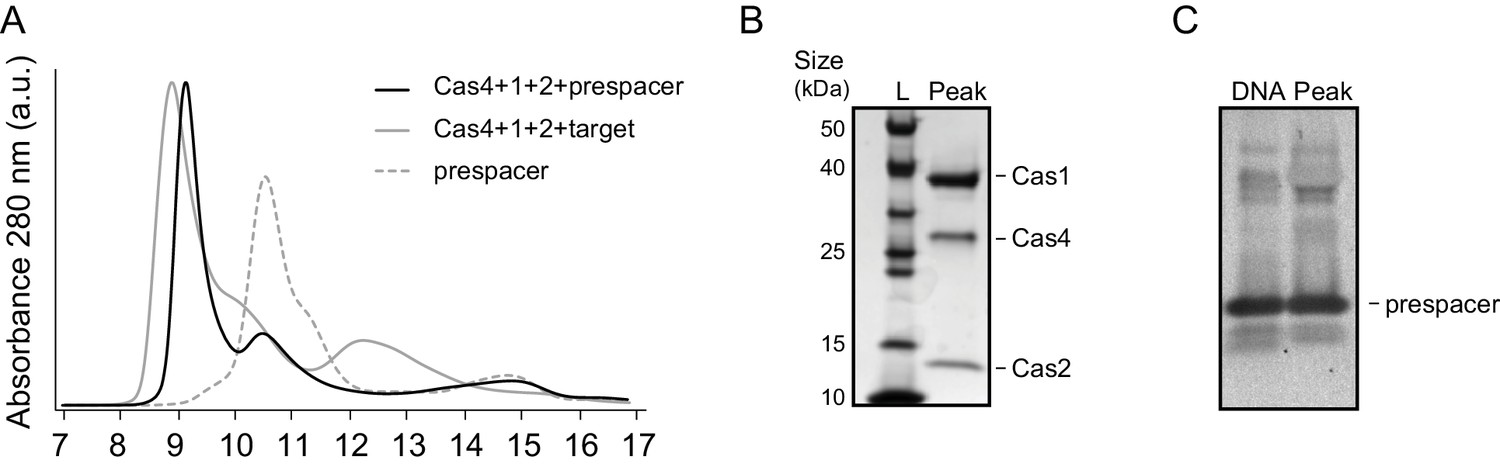
Formation of the Cas4-Cas1-Cas2 complex in the presence of prespacer DNA.
(A) Superdex 75 size exclusion chromatograms (SEC) for samples in which Cas4, Cas1 and Cas2 were incubated with either prespacer (24 bp duplex with 15-nt single-strand overhangs) or the CRISPR hairpin target (Figure 1A, gray solid line, the same trace is shown in Figure 1B). The prespacer alone was also run for reference, and the resulting chromatogram is shown as a dashed line. An additional peak observed in the Cas4 +Cas1+Cas2+prespacer chromatogram is due to excess DNA that was used during complex formation. (B) Coomassie-blue stained SDS-PAGE gel of proteins present in the earliest eluted peak fraction of Cas4+Cas1+Cas2+prespacer. (C) SYBR Gold stained 4–20% PAGE gel of DNA present in the peak fraction of Cas4+Cas1+Cas2+prespacer. The DNA lane is a prespacer sample prepared at the same concentration as the estimated amount of DNA in the peak fraction. The similarity in the two bands indicates that the expected concentration of DNA is present in the complex.
Figure 2 with 6 supplements
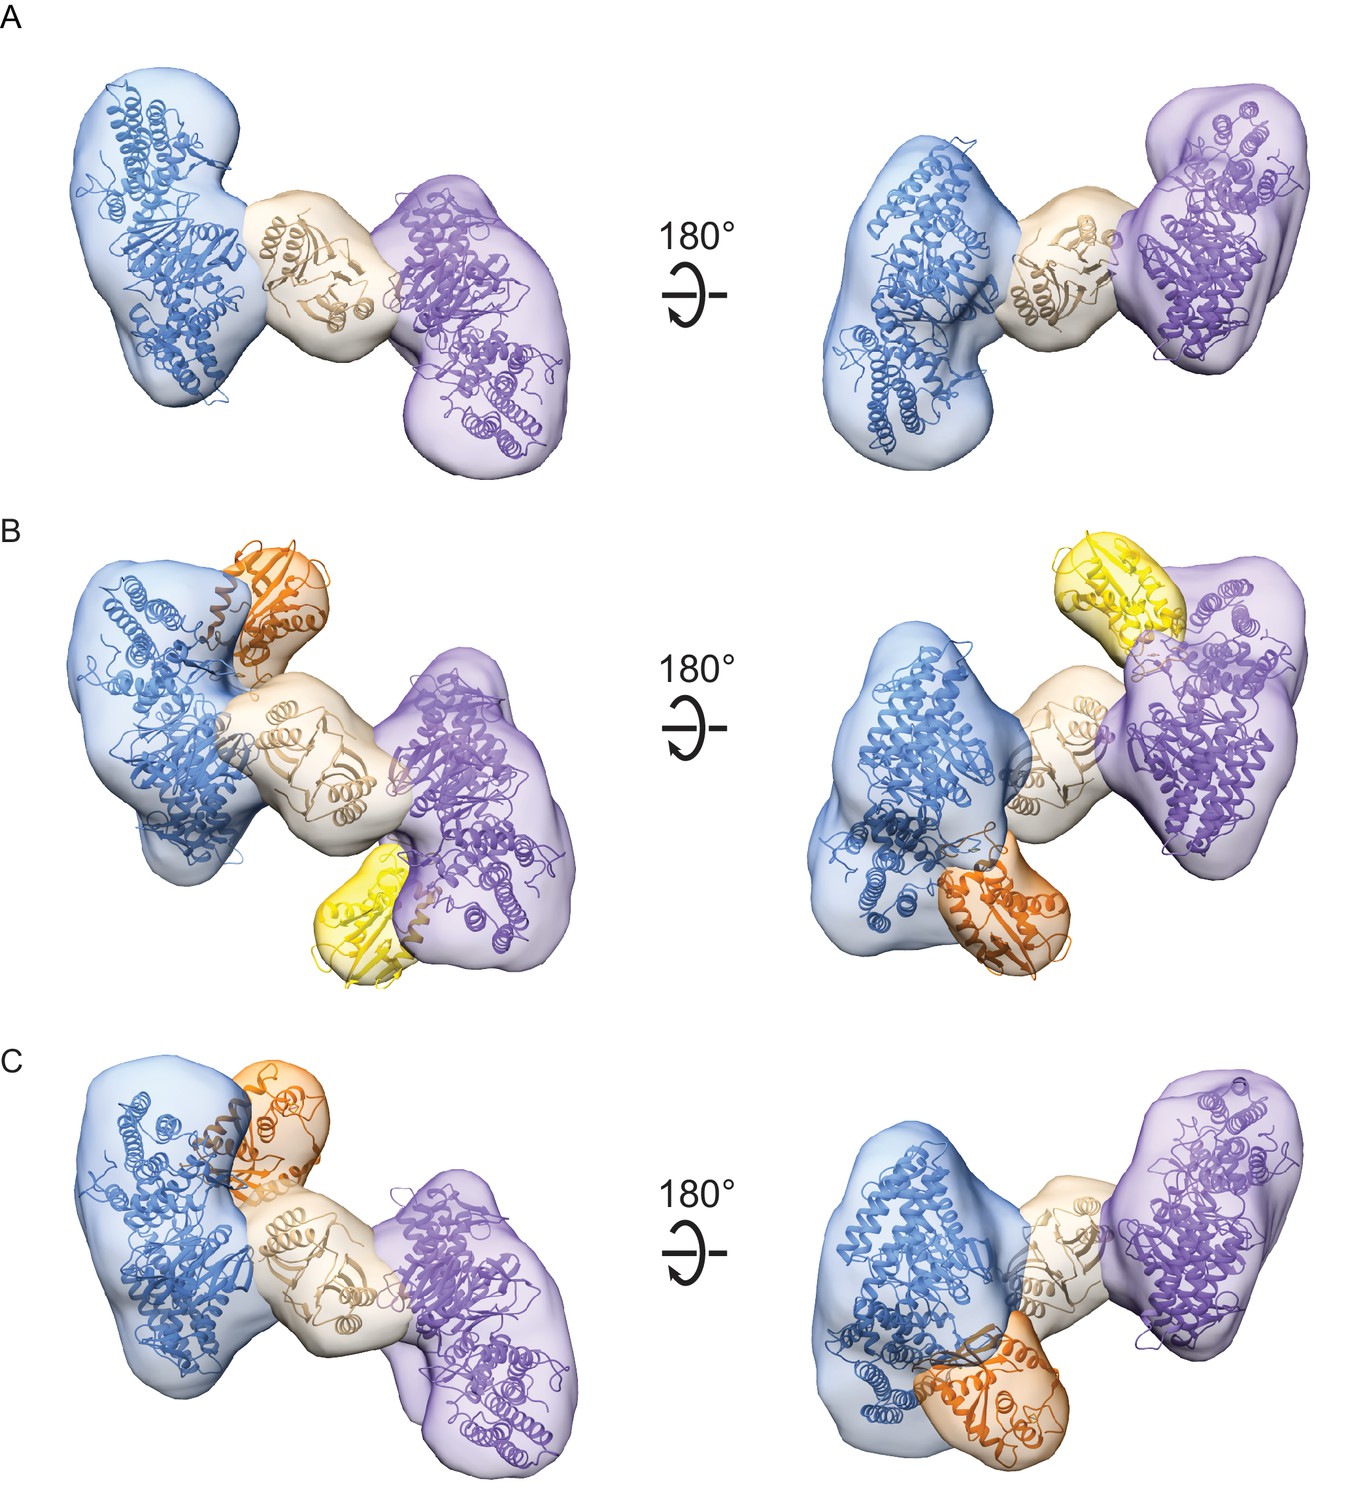
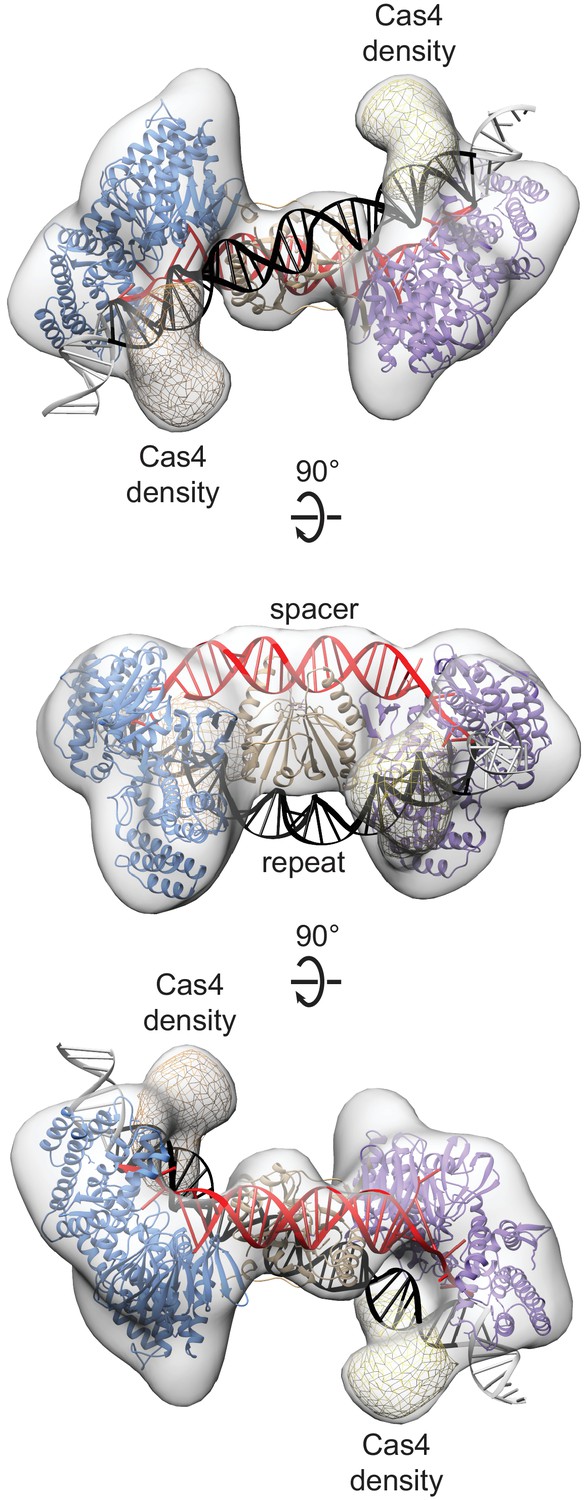
Architecture of Cas1-Cas2 and Cas4-Cas1-Cas2 complexes formed in the presence of CRISPR hairpin target DNA.
(A) Segmented density for Cas1-Cas2 reconstruction. Two copies of a structural model of BhCas1 dimer (see Materials and methods) were fit in the two assigned Cas1 densities (blue, purple). The crystal structure of BhCas2 (PDB 4ES3) was used for fitting to density assigned to Cas2 (tan) (Nam et al., 2012). (B–C) Segmented density for (B) symmetrical and (C) asymmetrical reconstructions of Cas4-Cas1-Cas2. BhCas1 and BhCas2 structural models are fit to segments and colored as in (A). Two copies of a structural model of BhCas4 are fit into assigned Cas4 densities in (B) (orange, gold). One copy of BhCas4 structural model is fit into assigned Cas4 density in (C) (orange).
Figure 2—figure supplement 1
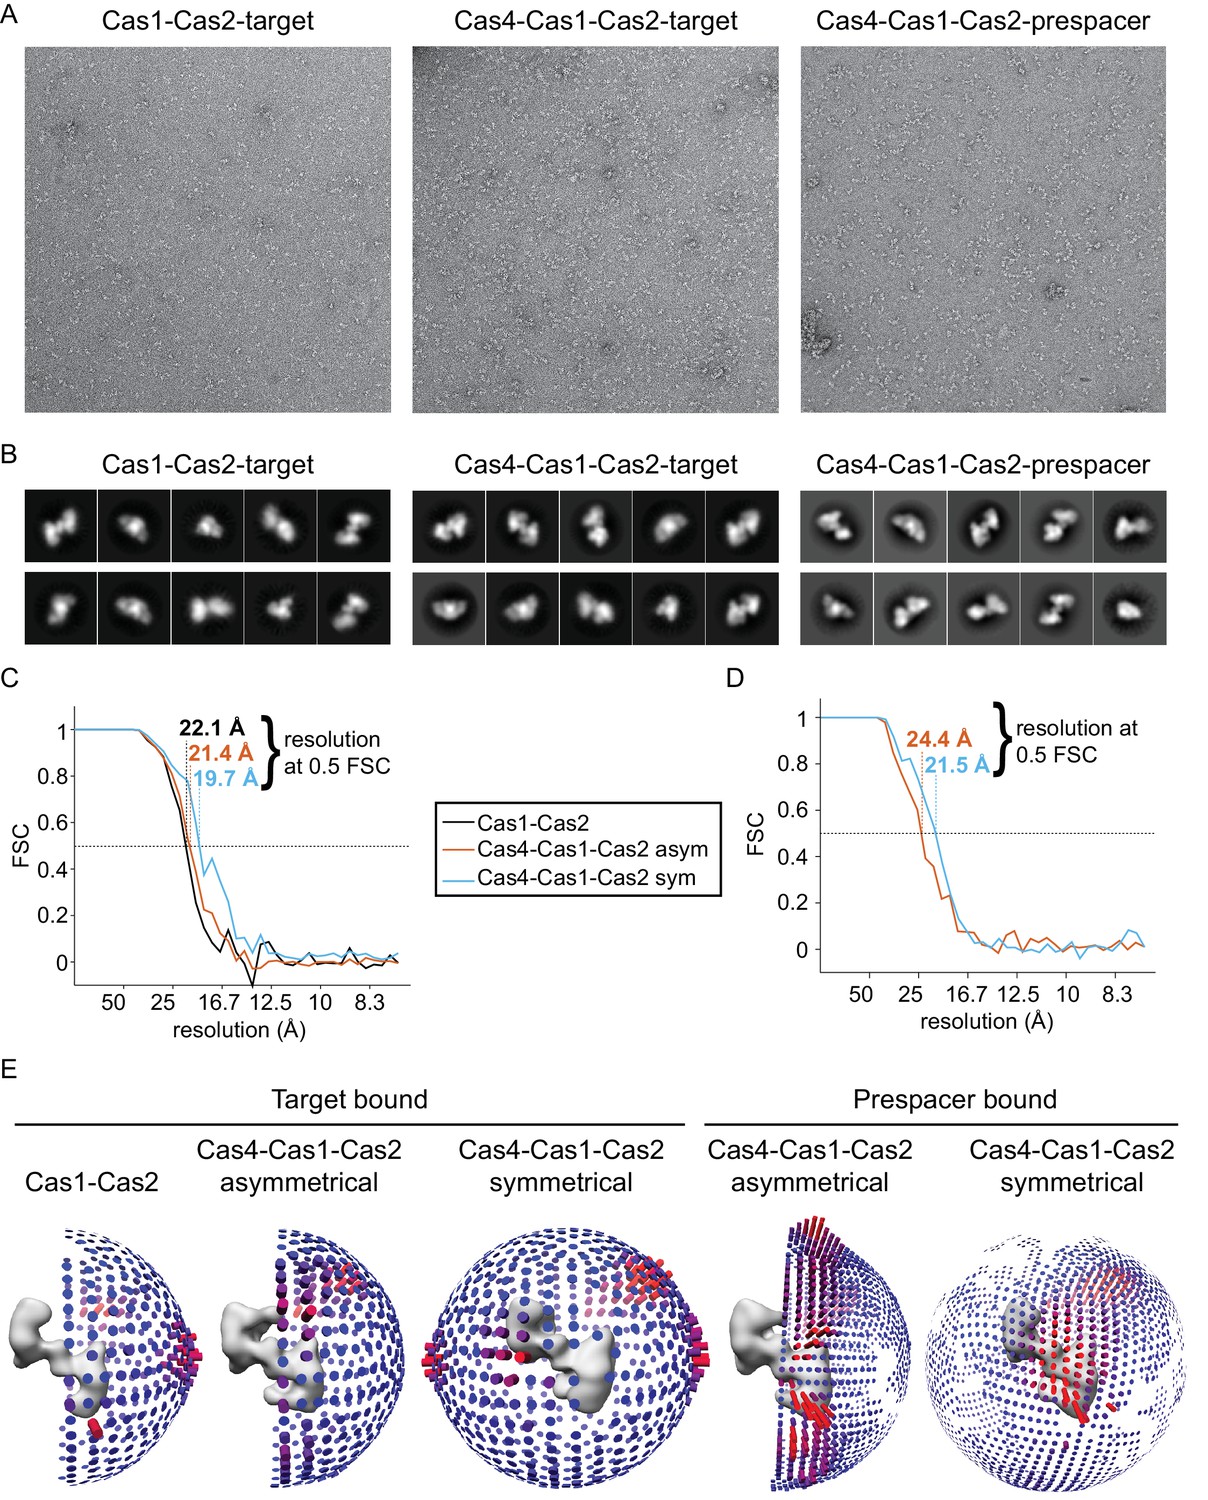
Single particle EM analysis of Cas1-Cas2 and Cas4-Cas1-Cas2.
(A) Representative raw micrographs of Cas1-Cas2 and Cas4-Cas1-Cas (with CRISPR hairpin target or prespacer bound) samples. (B) Representative two-dimensional class averages of Cas1-Cas2 and Cas4-Cas1-Cas2 (with CRISPR hairpin target or prespacer bound) samples. Box size is ~152 × 152 Å. (C) Fourier shell correlation curves for Cas1-Cas2 (black), asymmetrical Cas4-Cas1-Cas2 (red) and symmetrical Cas4-Cas1-Cas2 (blue) bound to CRISPR hairpin target DNA. The resolution using an FSC cutoff of 0.5 is indicated for each structure. (D) Fourier shell correlation curves for asymmetrical Cas4-Cas1-Cas2 (red) and symmetrical Cas4-Cas1-Cas2 (blue) bound to prespacer DNA. The resolution using an FSC cutoff of 0.5 is indicated for each structure. (E) Angular distributions for the final reconstruction for each complex. Cas1-Cas2 and symmetrical Cas4-Cas1-Cas2 complexes were refined with C2 symmetry.
Figure 2—figure supplement 2
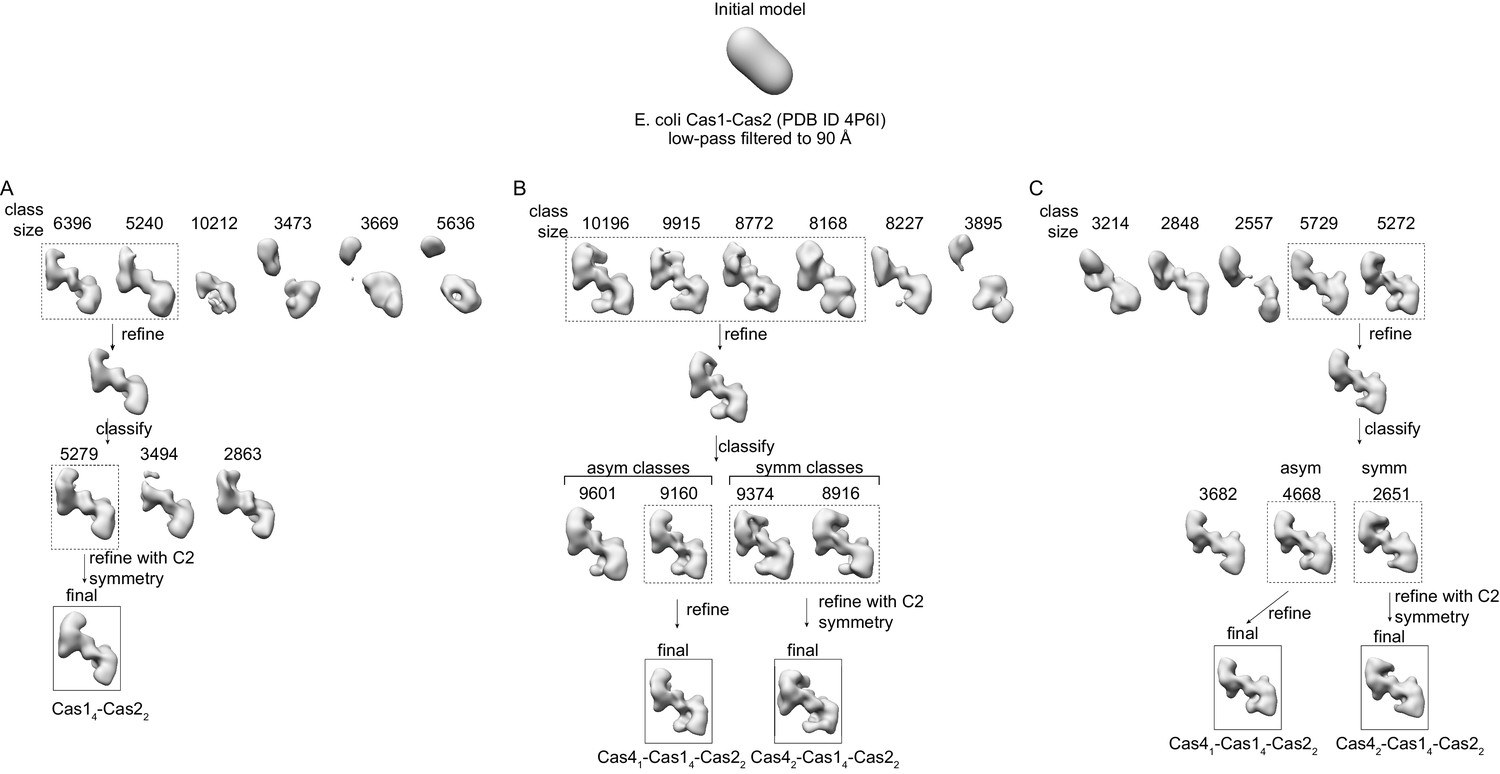
Three-dimensional classification of Cas1-Cas2 and Cas4-Cas1-Cas2.
The initial model used for 3D classifications is shown at top. The number of particles in each class is shown above each reconstruction. (A) Three-dimensional classes for Cas1-Cas2-target complex. The top row shows the first round of classification into six classes using the initial model. Particles from the 3D classes in the dashed box were combined and refined (second row). The particles were then subjected to a second round of classification into three classes using the refined structure filtered to 60 Å resolution as the starting model (third row). The 3D class in the dashed box was further refined while enforcing C2 symmetry (bottom row). (B) Three-dimensional classes for Cas4-Cas1-Cas2-target complex. The top row shows the first round of classification into six classes using the initial model. Particles from the 3D classes in the dashed box were combined and refined (second row). The particles were then subjected to a second round of classification into four classes using the refined structure filtered to 60 Å resolution as the starting model (third row). The asymmetrical 3D class in the dashed box was further refined with C1 symmetry, while the symmetrical 3D classes in the dashed box were further refined while enforcing C2 symmetry (bottom row). (C) Three-dimensional classes for Cas4-Cas1-Cas2-prespacer complex. The top row shows the first round of classification into five classes using the initial model. Particles from the 3D classes in the dashed box were combined and refined (second row). The particles were then subjected to a second round of classification into three classes using the refined structure filtered to 60 Å resolution as the starting model (third row). The asymmetrical 3D class in the dashed box was further refined with C1 symmetry, while the symmetrical 3D class in the dashed box was further refined while enforcing C2 symmetry (bottom row).
Figure 2—figure supplement 3
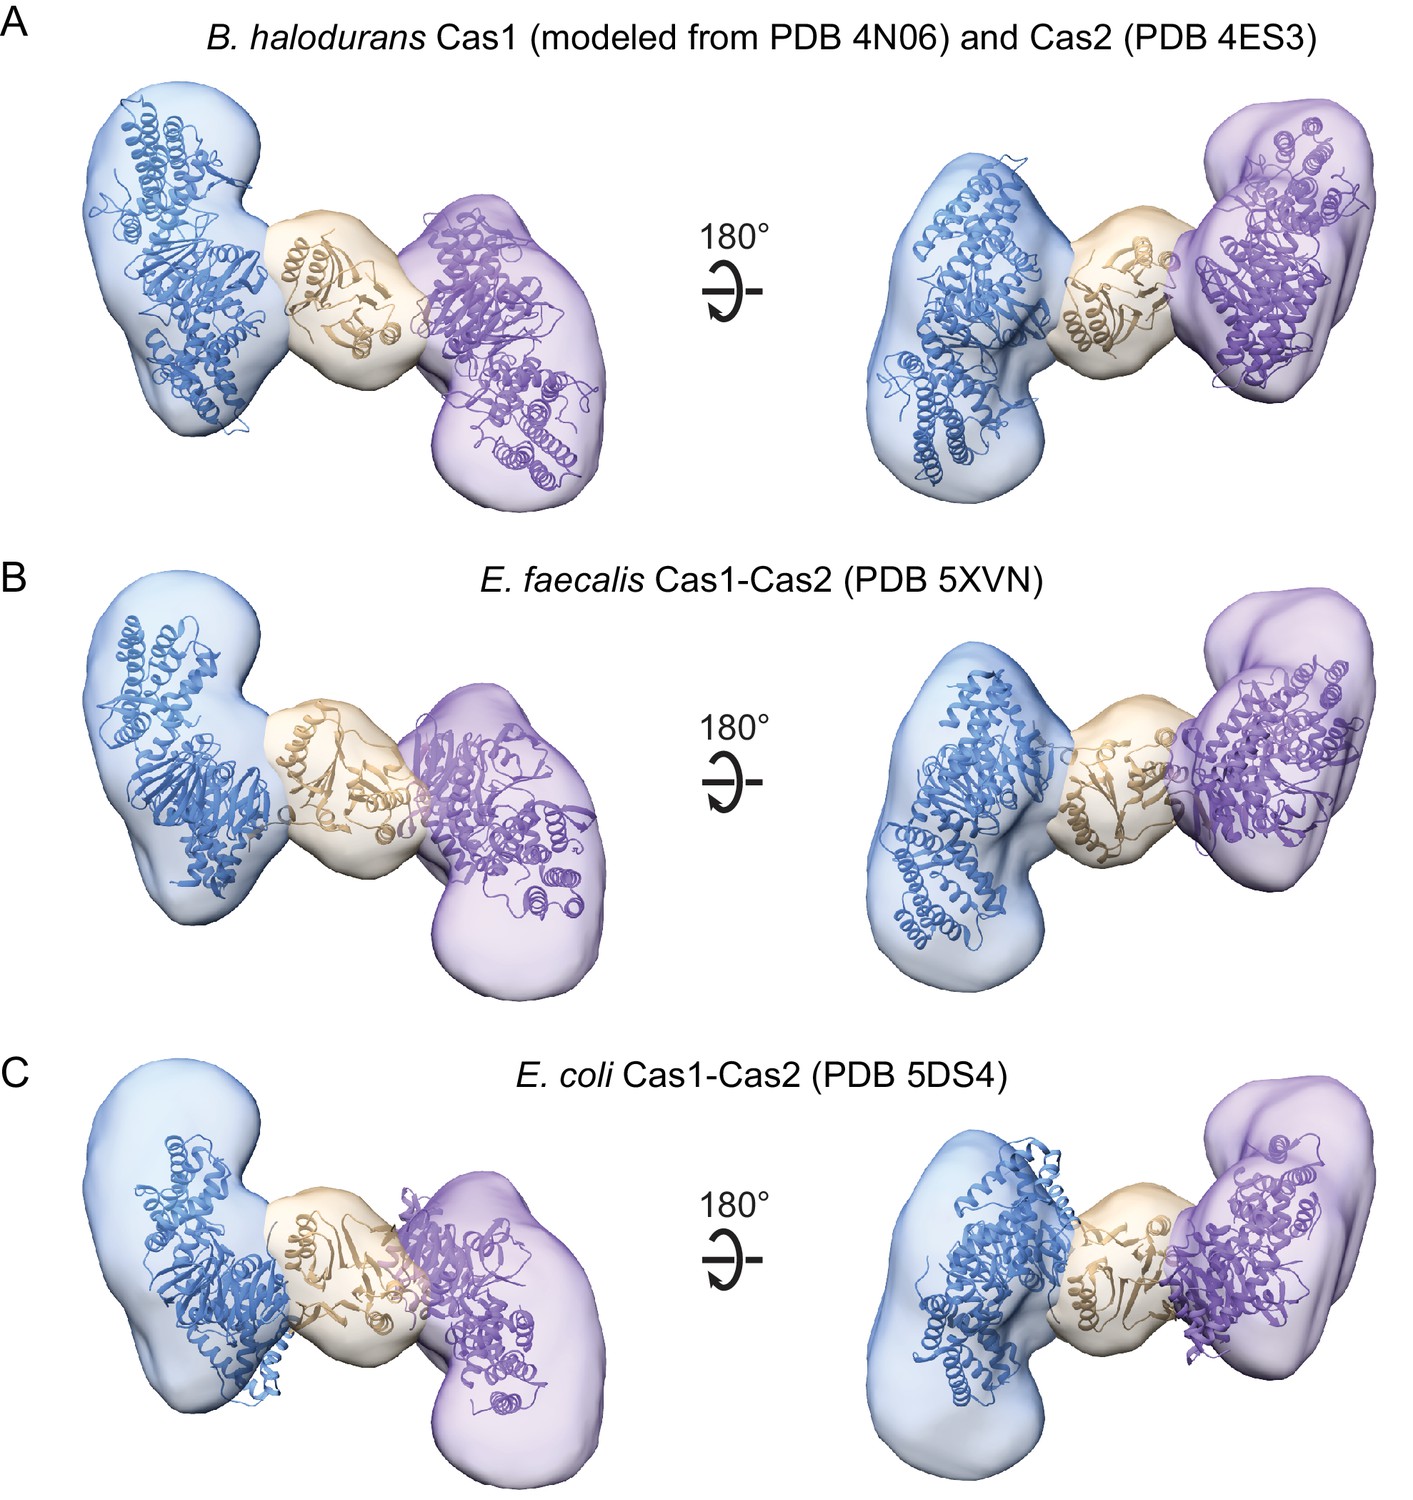
Modeling of Cas1-Cas2 structures.
(A) Structural model for B. halodurans Cas1 sequence and B. halodurans Cas2 X-ray crystal structure modelled into Cas1-Cas2 density using Fit in Segments package in UCSF Chimera (Pettersen et al., 2004; Pintilie et al., 2010). (B) X-ray crystal structure of E. faecalis Cas1-Cas2 fit to all segments (Xiao et al., 2017). (C) X-ray crystal structure of E. coli Cas1-Cas2 fit to all segments (Nuñez et al., 2015b). Two Cas1 dimers are in blue and purple, Cas2 is in tan.
Figure 2—figure supplement 4
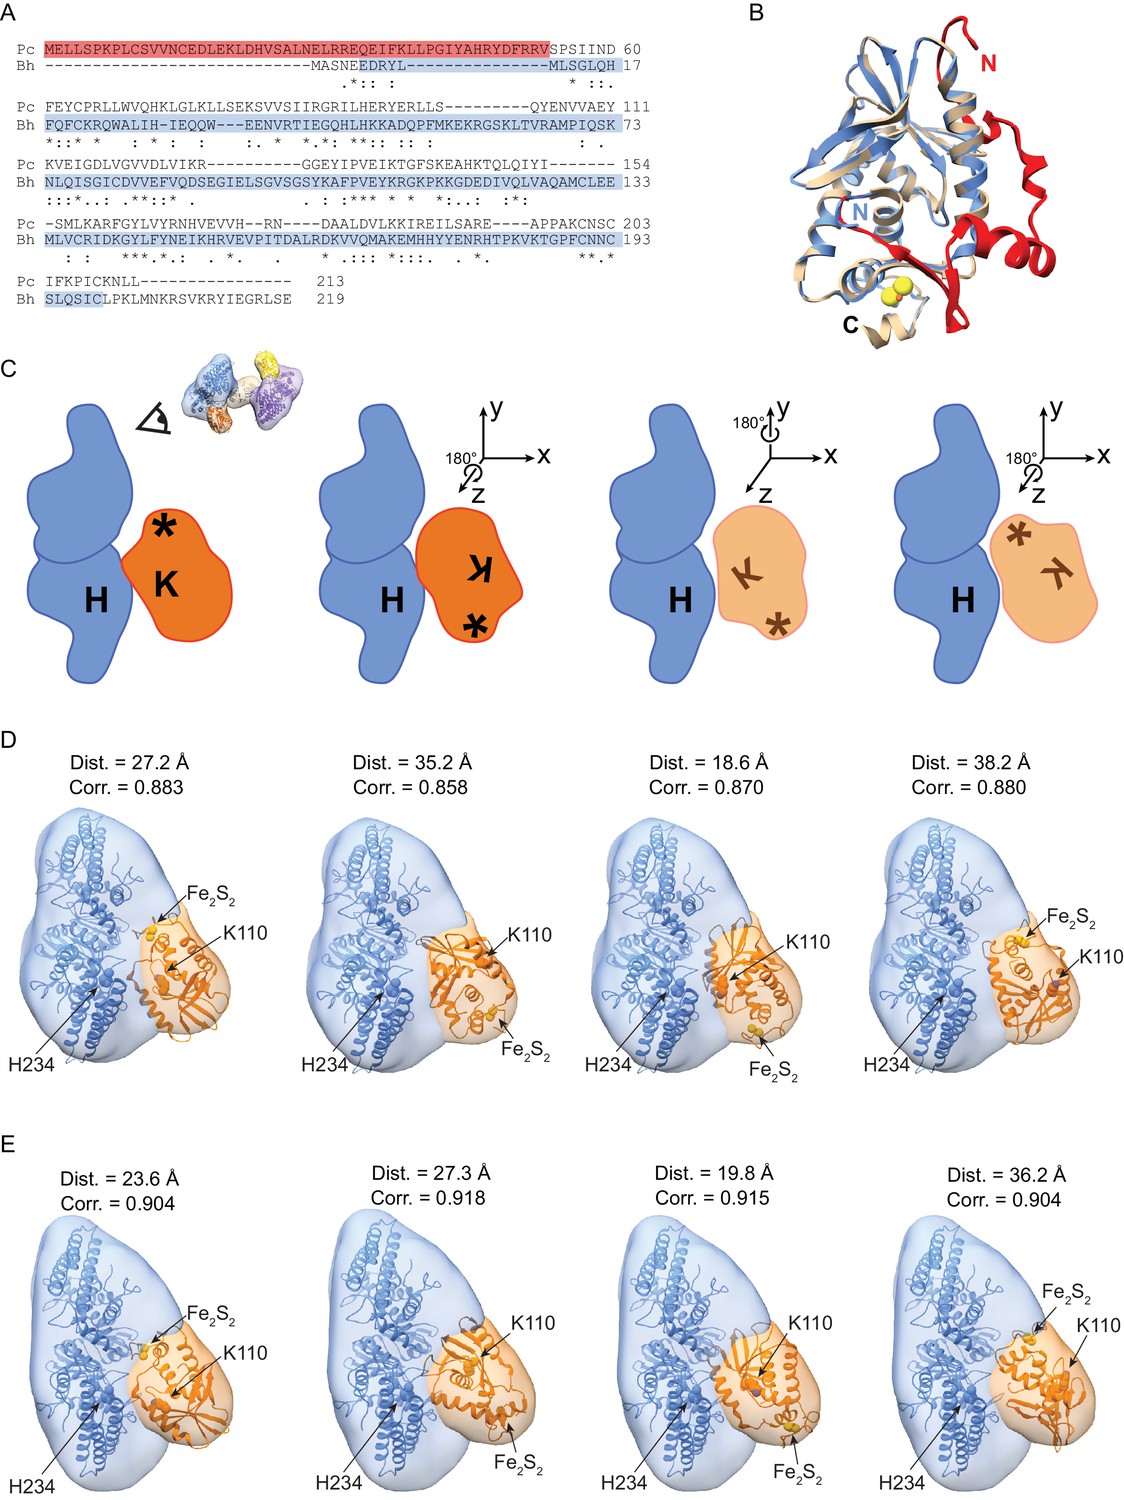
Modelling possible orientations of Cas4 within assigned density.
(A) Sequence alignment of P. calidifontis (Pc) and B. halodurans (Bh) Cas4 sequences. The sequence corresponding to the P. calidifontis N-terminal domain is highlighted in red. The sequence included in the predicted BhCas4 structural model is highlighted in blue (B) Crystal structure of PcCas4 (PDB 4R5Q, tan and red, [Lemak et al., 2014]) and structural model of BhCas4 (predicted using Phyre2 server [Kelley et al., 2015], blue). The N-terminal domain of PcCas4, which is not predicted to be present in BhCas4, is highlighted in red. The N- and C-termini of each model are labeled (Pc N-terminus is in red, Bh is in blue, both C-termini are in black). (C) Cartoon depicting four possible orientations of Cas4. Cas1 cartoon is in blue, Cas4 cartoon is in orange. H indicates Cas1 active site, K indicates Cas4 active site, and asterisk indicates Cas4 Fe2S2 cluster. The point-of-view with respect to the orientation shown in Figure 2 is depicted for the cartoon on the left. Cas4 rotates ~180° around either the z-axis or y-axis from one cartoon to the next, as depicted in the axes shown above Cas4. (D–E) Top four fits of Cas4 into segmented density from the (D) symmetrical Cas4-Cas1-Cas2-target complex and (E) asymmetrical Cas4-Cas1-Cas2-target complex. Fits reflect the possible orientations shown in cartoon within same column of (C). The Fe2S2 cluster and active site residues of Cas1 (H234) and Cas4 (K110) are indicated. The distance (Dist.) between alpha carbons of the two active site residues and cross-correlation value (Corr.) for each fit are indicated above each structural model.
Figure 2—figure supplement 5
Model of Cas1-Cas2 full-site integration product fit in symmetrical Cas4-Cas1-Cas2-target reconstruction.
The protein subunits of the crystal structure of E. faecalis Cas1-Cas2 bound to full-site intermediate (PDB 5XVP) were docked in the reconstruction (Xiao et al., 2017). Proteins are colored as in Figure 2. The prespacer is shown as a red ladder, the CRISPR repeat is shown as a black ladder, and the repeat flanking regions are shown as gray ladders. The segmented Cas4 density is shown in mesh. The Cas4 density lies along the same surface of Cas1 where the CRISPR is bound in the crystal structure.
Figure 2—figure supplement 6
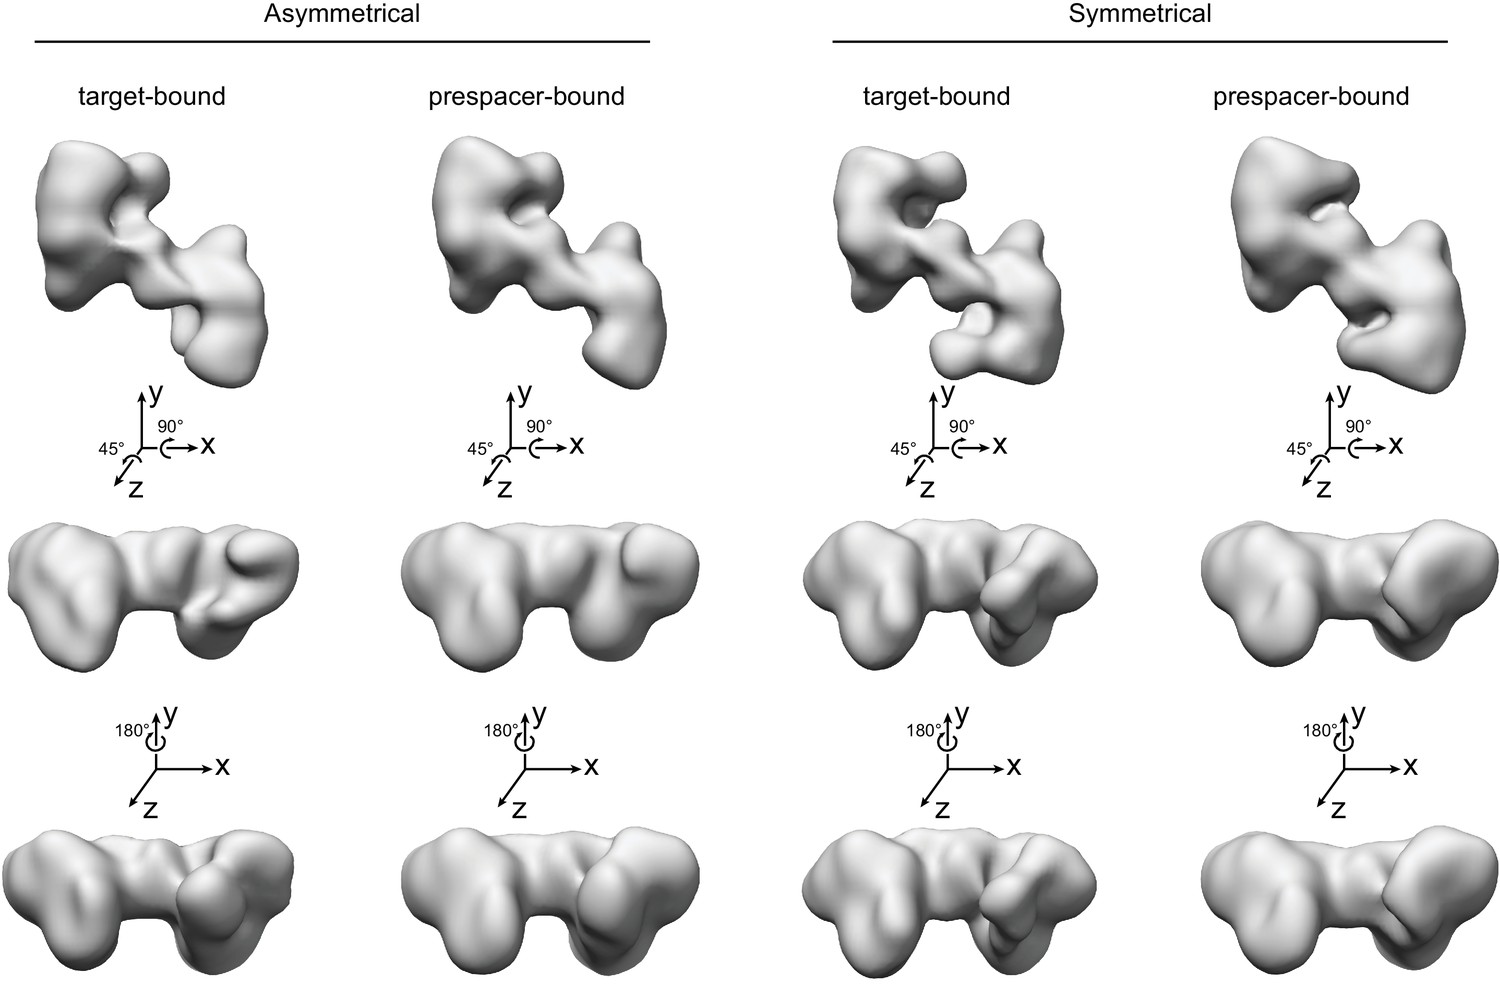
Comparison of Cas4-Cas1-Cas2 complexes formed in the presence of CRISPR hairpin target or prespacer DNA.
All volumes were set to a contour level of 0.2 in UCSF Chimera. The highest-resolution EM density (target-bound symmetrical complex) has the best-defined features out of all four volumes.
Figure 3 with 1 supplement
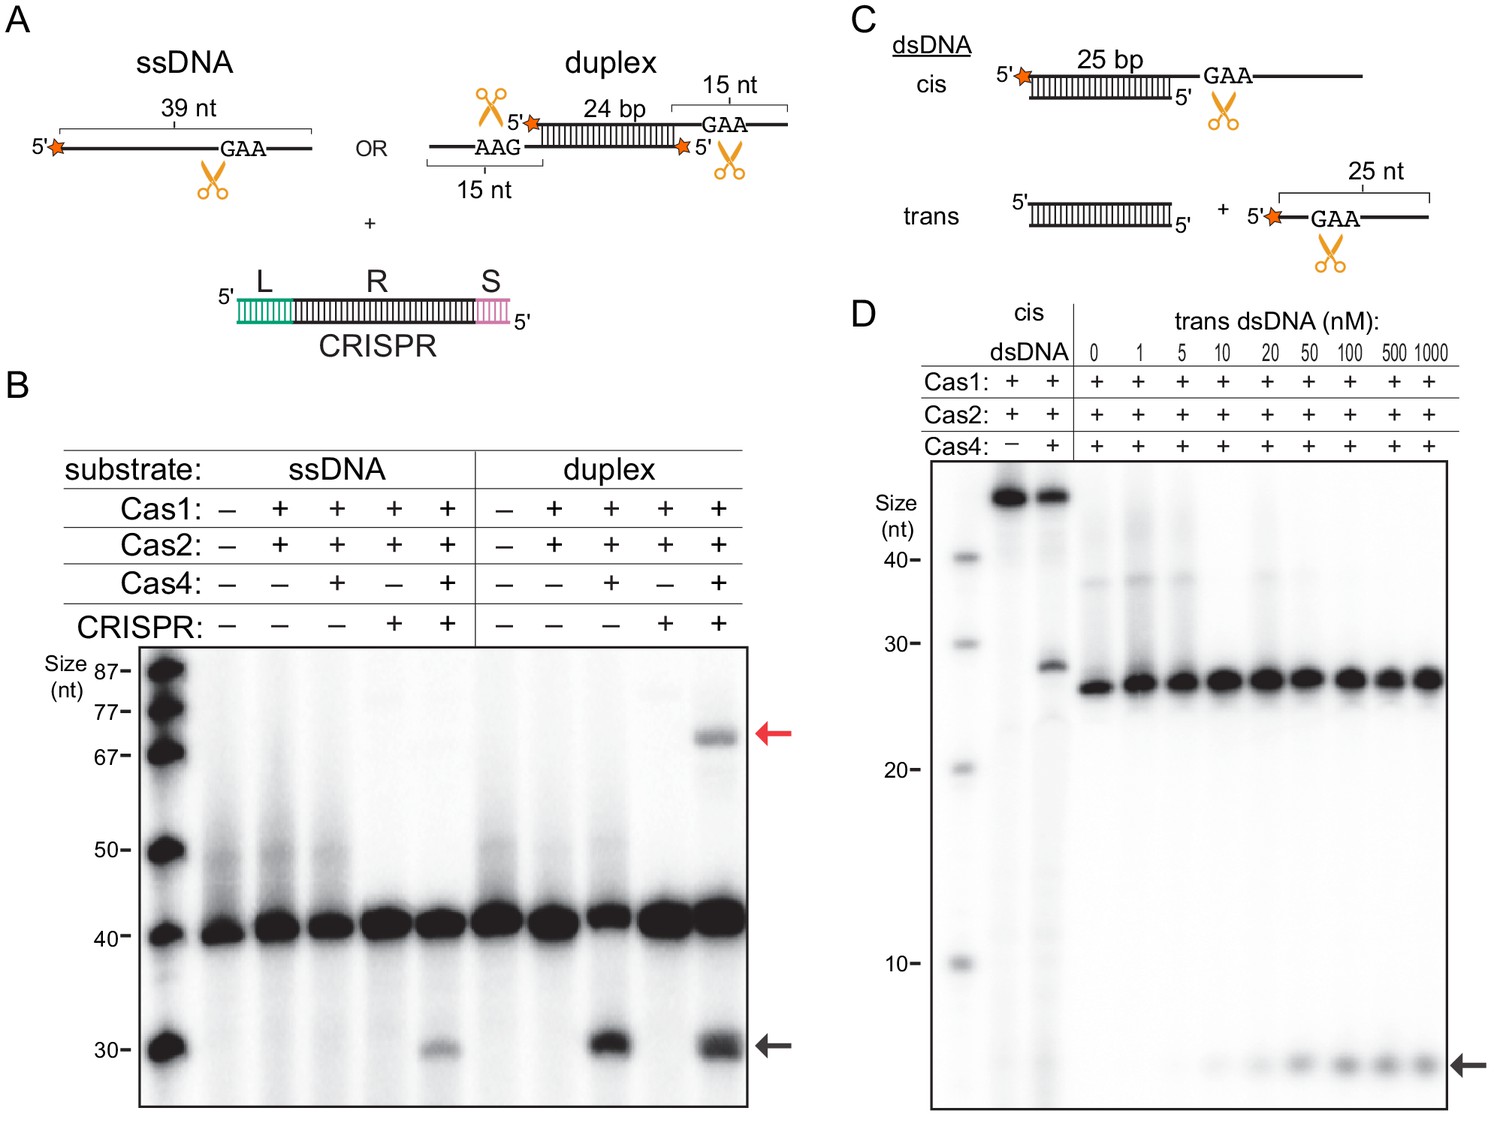
Single-stranded DNA processing by the Cas4-Cas1-Cas2 complex.
(A) Schematic of prespacer cleavage assay for (B). L indicates leader, R indicates repeat, S indicates spacer in the CRISPR DNA substrate. Radiolabel is indicated with a star. (B) Prespacer processing assay using ssDNA or duplex prespacer in the absence or presence of CRISPR DNA. Black arrow indicates the cleavage product. Red arrow indicates integration products following processing. (C) Schematic of cleavage assay using 25 nt single-stranded substrates provided in cis or in trans with a 25 bp duplex. (D) Cleavage assay using cis dsDNA or 25-nt ssDNA with titration of 25 bp duplex provided in trans.
Figure 3—figure supplement 1
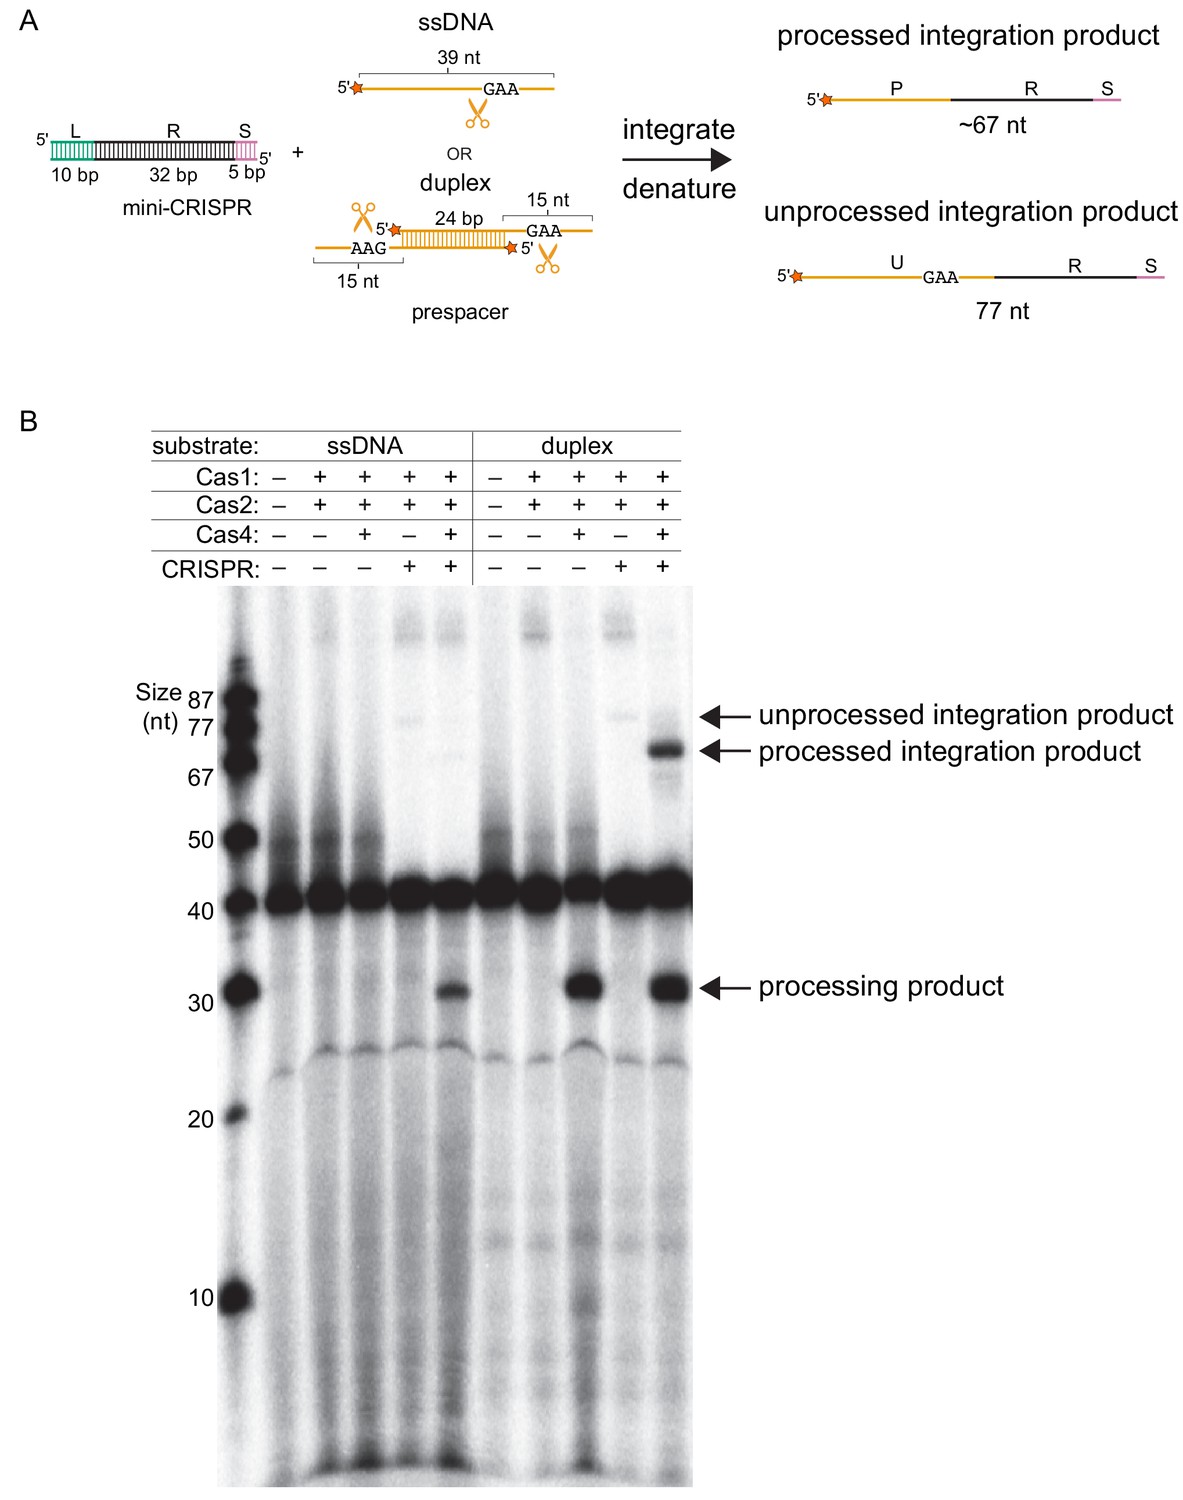
Integration of unprocessed and processed prespacers.
(A) Schematic of integration into the mini-CRISPR array. L – leader, R – repeat, S – spacer, P – processed prespacer following integration, U – unprocessed prespacer following integration. (B) Analysis of processing and integration products in the absence or presence of CRISPR DNA. The same gel is shown in Figure 3B. In this image, the contrast was increased to see the unprocessed integration products in the absence of Cas4.
Figure 4 with 1 supplement
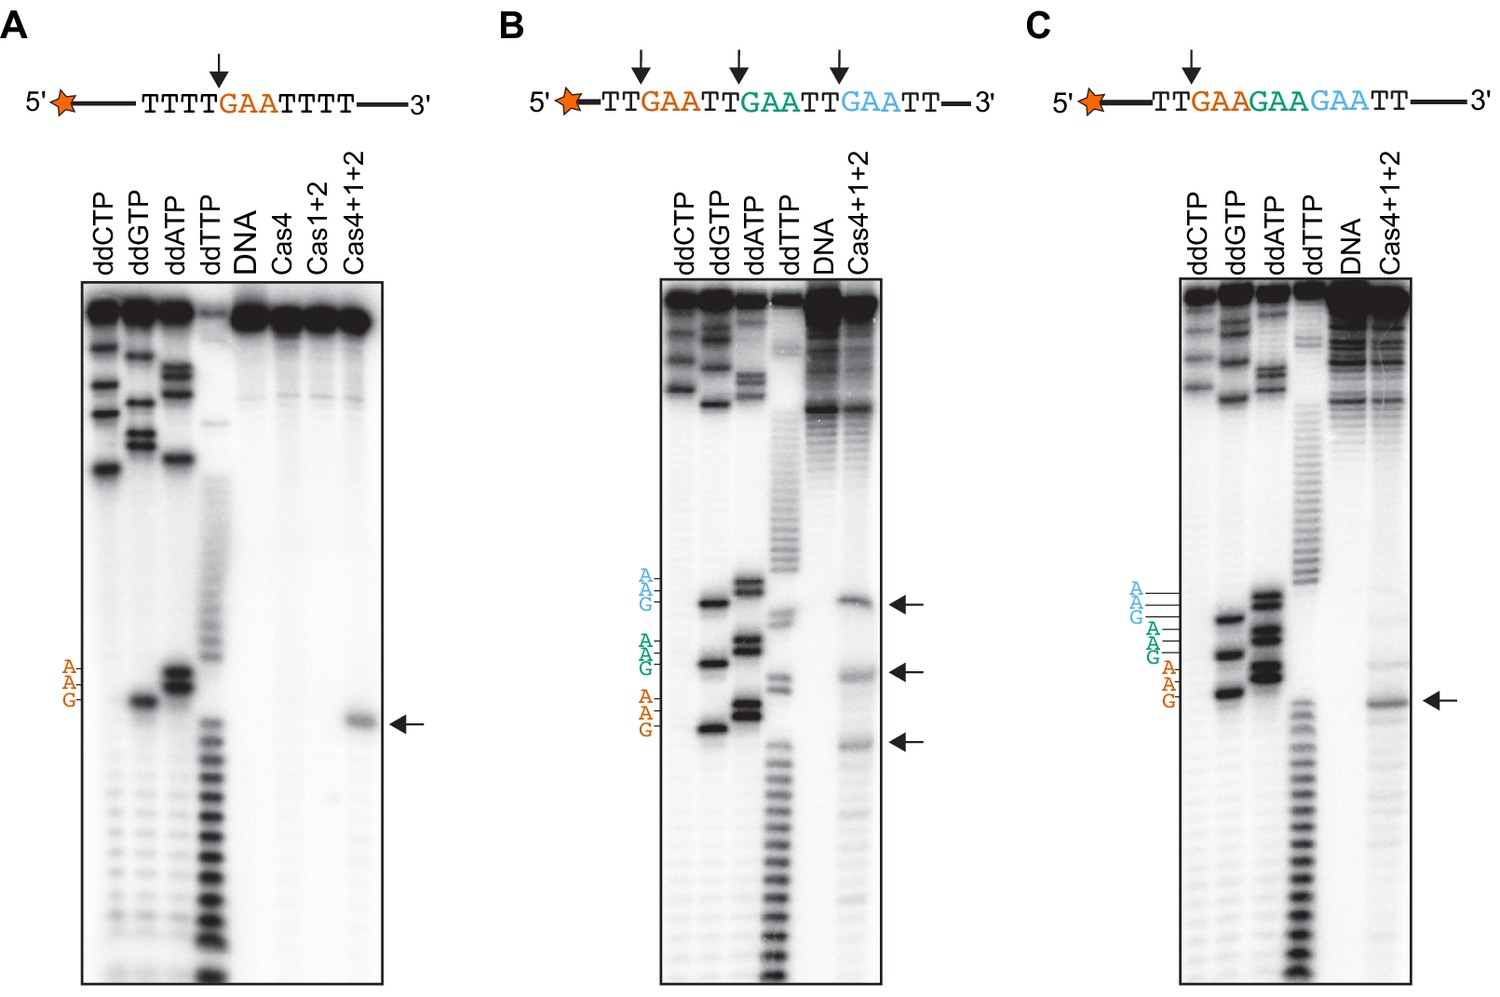
Cas4-Cas1-Cas2 processes directly upstream of PAM sites.
(A) Prespacer processing assay for ssDNA containing one PAM (GAA) site between T-rich sequences. (B) Prespacer processing assay for ssDNA containing three PAM sites with 2-nt intervals. (C) Prespacer processing assay with ssDNA containing three consecutive PAM sites. The first four lanes are Sanger sequencing reactions using the indicated ddNTP. The lane labeled DNA is a negative control reaction in which no proteins were added. Lanes labeled ‘Cas4’, ‘Cas1 + 2’ or ‘Cas4 + 1 + 2’ are reactions performed with the indicated proteins. Arrows indicate the predominant cleavage site.
Figure 4—figure supplement 1
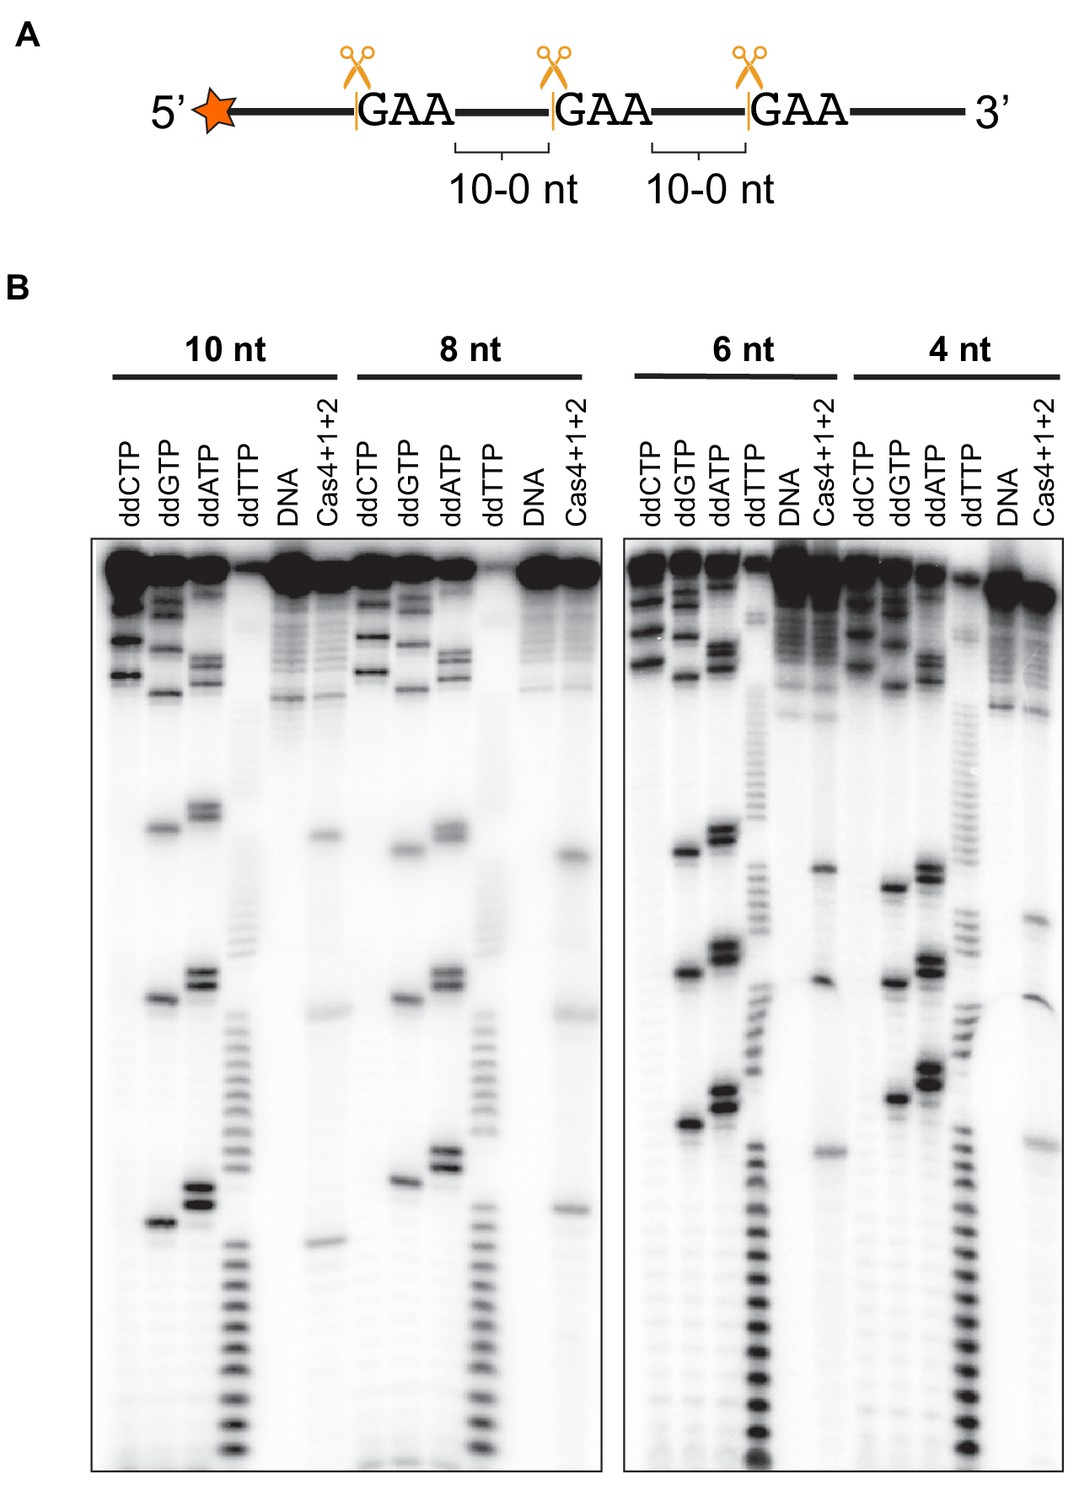
Cleavage of ssDNA with three PAMs.
(A) Schematic of ssDNA containing three PAM sites with 10, 8, 6, 4, 2, or 0-nt between the sites. (B) Cleavage assay with ssDNA substrates that have 10, 8, 6 or four nt between PAM sites. Sanger sequencing reaction lanes are labeled with the ddNTP used in the reaction. The lane labeled DNA is a negative control reaction in which no proteins were added. The ‘Cas4 + 1 + 2’ lane is a reaction containing all three proteins.
Figure 5 with 1 supplement

Cleavage of ssDNA substrates with different PAM-flanking regions.
(A) Substrate with AT-rich sequences upstream and downstream of the PAM. (B) Substrate with T-rich sequence upstream and random sequence downstream of PAM. (C) Substrate with random sequence upstream and T-rich sequence downstream of PAM. (D) Substrate with random sequence upstream and downstream of PAM. The first four lanes are Sanger sequencing reactions using the indicated ddNTP. The lane labeled DNA is a negative control reaction in which no proteins were added. Lanes labeled ‘Cas4’, ‘Cas1 + 2’ or ‘Cas4 + 1 + 2’ are reactions performed with the indicated proteins. Arrow indicates predominant cleavage site.
Figure 5—figure supplement 1
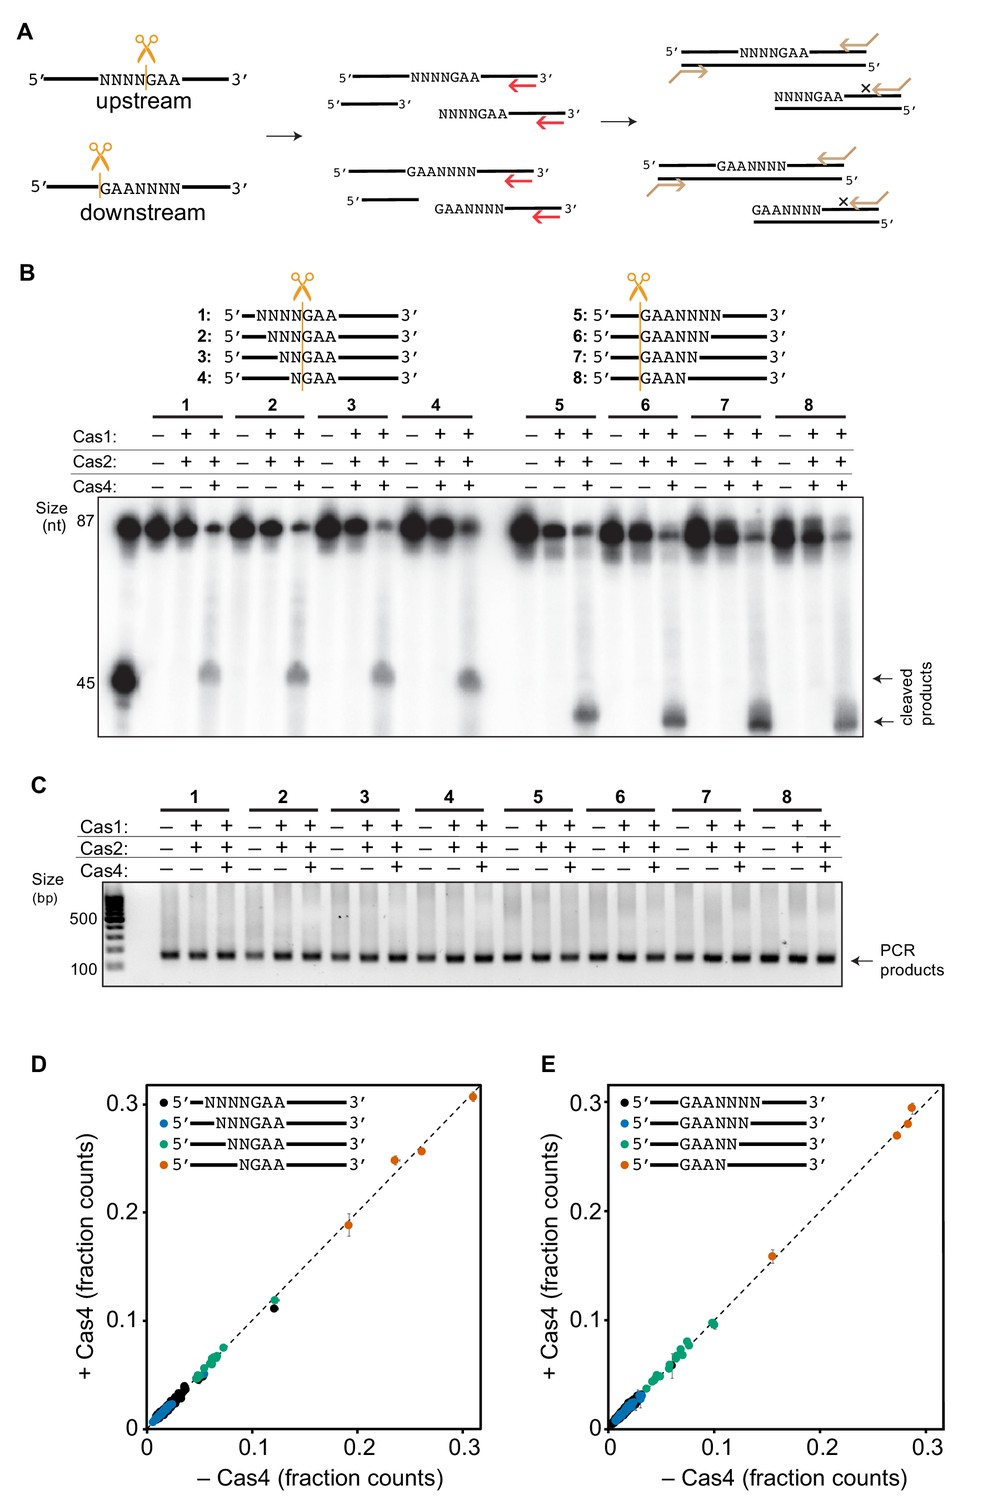
PAM-flanking sequence depletion assay.
(A) Schematic of processing assay. Red arrow indicates a primer used for primer extension assay and the orange arrows contain forward and reverse primers for PCR. (B) Prespacer processing assay using eight substrates containing between 1–4 degenerate nucleotides upstream or downstream of the PAM. Substrates are indicated by the numbers in the legend above the gel. (C) PCR products for DNA only, Cas1-Cas2 and Cas4-Cas1-Cas2. Substrates are indicated as numbers as in (B). (D–E) The fraction of counts for each degenerate sequence is plotted in the absence (x-axis) or presence (y-axis) of Cas4 for substrates with degenerate sequences (D) upstream or (E) downstream of the PAM. No significant differences were observed in the absence or presence of Cas4.
Figure 6

Processing of duplex prespacers with varied PAM positions in single-strand overhangs.
(A) Panel of substrates used in processing experiments. The 5ʹ-GAA-3ʹ PAM begins after 2, 4, 6 or eight nt from the end of the duplex. Radiolabel is indicated with an orange star. (B) Polyacrylamide gel image showing cleavage of substrates shown in (A). A second set of +Cas4 reactions were loaded in the last four lanes on the right for ease of comparison of product sizes. (C) Quantitation of percent cleaved for substrates shown in (A). The average of three replicates is shown, with error bars representing standard deviation.
Tables
Key resources table
| Reagent type (species) or resource | Designation | Source or reference | Identifiers | Additional information |
|---|---|---|---|---|
| Strain, strain background (Escherichia coli) | BL21 Star (DE3) | Thermo Fisher Scientific | C6010-03 | |
| Strain, strain background (Escherichia coli) | BL21 (DE3) | New England Biolabs | C2527I | |
| Recombinant DNA reagent | pET52b | EMD Millipore | 72554 | |
| Recombinant DNA reagent | pET52b/ His6 Cas4 | Lee et al., 2018 | N/A | |
| Recombinant DNA reagent | pSV272/ His6-MBP-TEV Cas1 | Lee et al., 2018 | N/A | |
| Recombinant DNA reagent | pSV272/ His6-MBP-TEV Cas2 | Lee et al., 2018 | N/A | |
| Recombinant DNA reagent | pRKSUF017 | Takahashi and Tokumoto, 2002 | N/A | |
| Commercial assay or kit | QIAprep Spin Miniprep Kit | Qiagen | #27106 | |
| Commercial assay or kit | Wizard SV Gel and PCR Clean-up system | Promega | #A9282 | |
| Commercial assay or kit | Wizard Plus SV minipreps DNA purification system | Promega | #A1460 | |
| Commercial assay or kit | HisPur Ni-NTA Spin columns | Thermo Fisher Scientific | #88224 | |
| Commercial assay or kit | HisPur Ni-NTA resin | Thermo Fisher Scientific | #88223 | |
| Commercial assay or kit | HiTrap SP HP | GE Healthcare | #7115201 | |
| Commercial assay or kit | HiTrap Heparin HP | GE Healthcare | #17-0407-03 | |
| Commercial assay or kit | HiLoad 16/600 Superdex 200 | GE Healthcare | #28989335 | |
| Commercial assay or kit | HiLoad 16/600 Superdex 75 | GE Healthcare | #28989333 | |
| Commercial assay or kit | Sequenase Version 2.0 DNA Sequencing Kit | Thermo Fisher Scientific | 707701KT | |
| Software, algorithm | Scipion | de la Rosa-Trevín et al., 2016 | scipion.i2pc.es | |
| Software, algorithm | Xmipp | Abrishami et al., 2013; Sorzano et al., 2013; Vargas et al., 2013 | xmipp.i2pc.es | |
| Software, algorithm | RELION | Scheres, 2012 | mrc-lmb.cam.ac.uk/reli | |
| Software, algorithm | RELION | Scheres, 2012 | on/index.php/Main_Page | |
| Software, algorithm | Phyre2 | Kelley et al., 2015 | sbg.bio.ic.ac.uk/phyre2/html/page.cgi?id = index | |
| Software, algorithm | Chimera | Pettersen et al., 2004 | cgl.ucsf.edu/chimera/ | |
| Software, algorithm | Segger | Pintilie et al., 2010 | cryoem.bcm.edu/cryoem/downloads/segger | |
| Other | Formvar/Carbon 400 mesh, Copper approx. grid hole size: 42 μm | Ted Pella, Inc. | 01754 F | |
| Other | Pyrobaculum calidifontis Cas4 | Lemak et al., 2014 | PDB: 4R5Q | Deposited data |
| Other | Archaeoglobus fulgidus Cas1 | Kim et al., 2013 | PDB: 4N06 | Deposited data |
| Other | Bacillus halodurans Cas2 | Nam et al., 2012 | PDB: 4ES3 | Deposited data |
| Other | Escherichia coli Cas1-Cas2 | Nuñez et al., 2014 | PDB: 4P6I | Deposited data |
| Other | Escherichia coli Cas1-Cas2-prespacer | Nuñez et al., 2015b | PDB: 5DS4 | Deposited data |
| Other | Enterococcus faecalis Cas1-Cas2-prespacer | Xiao et al., 2017 | PDB: 5XVN | Deposited data |
| Other | Enterococcus faecalis Cas1-Cas2-full site | Xiao et al., 2017 | PDB: 5XVP | Deposited data |
| Other | Bacillus halodurans Cas1-Cas2-target | This paper | EMDB-20127 | Deposited data |
| Other | Bacillus halodurans Cas4-Cas1-Cas2-target asymmetrical | This paper | EMDB-20128 | Deposited data |
| Other | Bacillus halodurans Cas4-Cas1-Cas2-target symmetrical | This paper | EMDB-20129 | Deposited data |
| Other | Bacillus halodurans Cas4-Cas1-Cas2-prespacer asymmetrical | This paper | EMDB-20130 | Deposited data |
| Other | Bacillus halodurans Cas4-Cas1-Cas2-prespacer symmetrical | This paper | EMDB-20131 | Deposited data |
| Chemical compound, drug | Agar | AMRESCO | #J637-1kg | |
| Chemical compound, drug | Carbenicillin disodium salt | RPI | #C46000-25.0 | |
| Chemical compound, drug | Kanamycin monosulfate | RPI | #K22000-25.0 | |
| Chemical compound, drug | Ampicillin | RPI | #A40040-100.0 | |
| Chemical compound, drug | Tetracycline HCl | RPI | #T17000-25.0 | |
| Chemical compound, drug | LB Broth (Miller) | Thermo Fisher Scientific | #BP1426-2 | |
| Chemical compound, drug | IPTG | RPI | #I56000-100.0 | |
| Chemical compound, drug | DTT | RPI | #D11000-100.0 | |
| Chemical compound, drug | Tryptone | RPI | #T60060-5000.0 | |
| Chemical compound, drug | Sodium chloride | AMRESCO | #7647–14.5 | |
| Chemical compound, drug | Yeast extract | Thermo Fisher Scientific | #BP1422-2 | |
| Chemical compound, drug | Agarose | Thermo Fisher Scientific | #BP160-500 | |
| Chemical compound, drug | HEPES | Thermo Fisher Scientific | #BP310-1 | |
| Chemical compound, drug | Sodium phosphate dibasic heptahydrate | Thermo Fisher Scientific | #S373-3 | |
| Chemical compound, drug | Glycerol | VWR analytical BDH | #BDH1172-4LP | |
| Chemical compound, drug | Imidazole | Thermo Fisher Scientific | #O31960599 | |
| Chemical compound, drug | PMSF | RPI | #P20270-25.0 | |
| Chemical compound, drug | Ferrous sulfate | Thermo Fisher Scientific | #I146-500 | |
| Chemical compound, drug | Ferric sulfate | Sigma | #F3388-250G | |
| Chemical compound, drug | L-Cysteine free base | MP Biomedicals | #194646 | |
| Chemical compound, drug | Manganese chloride tetrahydrate | Thermo Fisher Scientific | #M87-100 | |
| Chemical compound, drug | Potassium chloride | RPI | #D41000-2500.0 | |
| Chemical compound, drug | Brilliant blue R-250 | RPI | #B43000-50.0 | |
| Chemical compound, drug | 40% Acrylamide/Bis solution, 19:1 | Thermo Fisher Scientific | #BP1406-1 | |
| Chemical compound, drug | Urea | RPI | #U20200-25000.0 | |
| Chemical compound, drug | Boric acid | RPI | #B32050-5000.0 | |
| Chemical compound, drug | Tris | RPI | #T60040-5000.0 | |
| Chemical compound, drug | EDTA | Thermo Fisher Scientific | #BP120-1 | |
| Chemical compound, drug | 2X RNA loading dye | New England Biolabs | #B0363A | |
| Chemical compound, drug | T4 Polynucleotide Kinase | New England Biolabs | #M0201L | |
| Chemical compound, drug | [γ-32P]-ATP | Perkin Elmer | #BLU502A250UC | |
| Chemical compound, drug | Phenol:Chloroform:Isoamyl Alcohol (25:24:1) | Thermo Fisher Scientific | #15593049 |
Table 1
Oligonucleotides used in this study.
https://doi.org/10.7554/eLife.44248.020| Sequence (5ʹ → 3ʹ) | Description |
|---|---|
| GATTTTCGCTGTCGCACTCTTCATGGGTGCGTGGATTGAAAT ATTGAcgatagTCAATATTTCAATCCACGCACCCATGAAGAGTGC GACAGCGAAAATC | CRISPR hairpin target* |
| GATTTTCGCTGTCGCACTCTTCATGGGTGCGTGGATTGAAAT ATTGAGGTAGGTATTG | Mini-CRISPR array |
| CAATACCTACCTCAATATTTCAATCCACGCACCC ATGAAGAGTGCGACAGCGAAAATC | RC† |
| CGTAGCTGAGGACCACCAGAACAG TTTTGAATTTTTTTT | 15-nt 3ʹ overhang prespacer, 4-nt between duplex and PAM†† |
| CGTAGCTGAGGACCACCAGAACAG TTGAATTTTTTTTTT | 2-nt between duplex and PAM |
| CGTAGCTGAGGACCACCAGAACAG TTTTTTGAATTTTTT | 6-nt between duplex and PAM |
| CGTAGCTGAGGACCACCAGAACAG TTTTTTTTGAATTTT | 8-nt between duplex and PAM |
| CTGTTCTGGTGGTCCTCAGCTACG TTTTGAATTTTTTTT | RC of previous four oligos |
| GATTTTCGCTGTCGCACTCTTCATGGGTGCGTGGATTGAAATATTGA | CRISPR DNA substrate |
| TCAATATTTCAATCCACGCACCCATGAAGAGTGCGACAGCGAAAATC | RC |
| GCGTAGCTGAGGACCACCAGAACAGTTTTGAATTTTTTTTTTTTTTTTTT | 25-nt 3ʹ overhang prespacer |
| GCGTAGCTGAGGACCACCAGAACAG | 25 bp duplex |
| CTGTTCTGGTGGTCCTCAGCTACGC | RC |
| GCGTAGCTGAGGACCTTTTTTTTTTTTTGAATTTTTTTTTTTTTTCAGGT CGACAAGCTTG | T-rich ssDNA prespacer |
| CAAGCTTGTCGACCTGAAAAAAAAAAAAAATTCAAAAAAAAAAAAA GGTCCTCAGCTACGC | RC |
| CTAGTATGATCATGTCCAACGAATCAATACCTACCTCAATGAACGGAT | 48 bp duplex |
| ATCCGTTCATTGAGGTAGGTATTGATTCGTTGGACATGATCATACTAG | RC |
| GCGTAGCTGAGGACCTTTTTTTTTTTTTTTTTTGAATTGAATTGAA TTTTTTTTTTTTTTTTTTGACAAGCTTGCGACA | 3 PAM sites interspersed in 2-nt |
| TGTCGCAAGCTTGTCAAAAAAAAAAAAAAAAAATTCAATTCAATTCA AAAAAAAAAAAAAAAAAGGTCCTCAGCTACGC | RC |
| GCGTAGCTGAGGACCTTTTTTTTTTTTTTTTTTTTGAAGAAGAATTTTT TTTTTTTTTTTTTTTGACAAGCTTGCGACA | 3 PAM sites without spacing |
| TGTCGCAAGCTTGTCAAAAAAAAAAAAAAAAAAAATTCTTCTTCAAA AAAAAAAAAAAAAAAAAGGTCCTCAGCTACGC | RC |
| GCGTAGCTGAGGACCTTTTTTTTTTGAATTTTTTTTTTGAATTTT TTTTTTGAATTTTTTTTTTGACAAGCTTGCGACA | 3 PAM sites interspersed with 10-nt |
| TGTCGCAAGCTTGTCAAAAAAAAAATTCAAAAAAAAAATTCAAAAA AAAAATTCAAAAAAAAAAGGTCCTCAGCTACGC | RC |
| GCGTAGCTGAGGACCTTTTTTTTTTTTGAATTTTTTTTGAATTTTTTTT GAATTTTTTTTTTTTGACAAGCTTGCGACA | 3 PAM sites interspersed with 8-nt |
| TGTCGCAAGCTTGTCAAAAAAAAAAAATTCAAAAAAAATTCAAAAAAAA TTCAAAAAAAAAAAAGGTCCTCAGCTACGC | RC |
| GCGTAGCTGAGGACCTTTTTTTTTTTTTTGAATTTTTTGAATTTT TTGAATTTTTTTTTTTTTTGACAAGCTTGCGACA | 3 PAM sites interspersed with 6-nt |
| TGTCGCAAGCTTGTCAAAAAAAAAAAAAATTCAAAAAATTCAAAA AATTCAAAAAAAAAAAAAAGGTCCTCAGCTACGC | RC |
| GCGTAGCTGAGGACCTTTTTTTTTTTTTTTTGAATTTTGAATTTTGAA TTTTTTTTTTTTTTTTGACAAGCTTGCGACA | 3 PAM sites interspersed with 4-nt |
| TGTCGCAAGCTTGTCAAAAAAAAAAAAAAAATTCAAAATTCAAAA TTCAAAAAAAAAAAAAAAAGGTCCTCAGCTACGC | RC |
| GCGTAGCTGAGGACCTATATATATATATGAATATATATATATATA CAGGTCGACAAGCTTG | AT-rich ssDNA prespacer |
| CAAGCTTGTCGACCTGTATATATATATATATTCATATATATAT ATAGGTCCTCAGCTACGC | RC |
| GCGTAGCTGAGGACCTTGGTATTCAACAGAATTTTTTTTTTTTTTCA GGTCGACAAGCTTG | Non-T-rich upstream/T rich downstream ssDNA prespacer |
| CAAGCTTGTCGACCTGAAAAAAAAAAAAAATTCTGTTGAATACCAAG GTCCTCAGCTACGC | RC |
| GCGTAGCTGAGGACCTTTTTTTTTTTTTGAACTCGTATTCAACAG CAGGTCGACAAGCTTG | T-rich upstream/non T-rich downstream ssDNA prespacer |
| CAAGCTTGTCGACCTGCTGTTGAATACGAGTTCAAAAAAAAAAAAA GGTCCTCAGCTACGC | RC |
| GCGTAGCTGAGGACCTTGGTATTCAACAGAACTCGTATTC AACAGCAGGTCGACAAGCTTG | Non-T-rich up- and downstream ssDNA prespacer |
| CAAGCTTGTCGACCTGCTGTTGAATACGAGTTCTGTTGAATACCAA GGTCCTCAGCTACGC | RC |
| GCGTAGCTGAGGACC | Primer used for ddNTP Sanger sequencing |
| GCGTAGCTGAGGACCCGTGGCACCGACATGGCATTTTTNNNNGAA TTTTTGCTGGGCGCTAAGGGACAACTCCAGGTCGACAAGCTTG | NNNN on upstream region |
| GCGTAGCTGAGGACCCGTGGCACCGACATGGCAGTTTTTNNNGAA TTTTTGCTGGGCGCTAAGGGACAACTCCAGGTCGACAAGCTTG | NNN on upstream region |
| GCGTAGCTGAGGACCCGTGGCACCGACATGGCAGGTTTTTNNGAA TTTTTGCTGGGCGCTAAGGGACAACTCCAGGTCGACAAGCTTG | NN on upstream region |
| GCGTAGCTGAGGACCCGTGGCACCGACATGGCAGGCTTTTTNGAA TTTTTGCTGGGCGCTAAGGGACAACTCCAGGTCGACAAGCTTG | N on upstream region |
| GCGTAGCTGAGGACCCGTGGCACCGACATGGCATTTTTGAANNNN TTTTTGCTGGGCGCTAAGGGACAACTCCAGGTCGACAAGCTTG | NNNN on downstream region |
| GCGTAGCTGAGGACCCGTGGCACCGACATGGCATTTTTGAANNNTTTTT CGCTGGGCGCTAAGGGACAACTCCAGGTCGACAAGCTTG | NNN on downstream region |
| GCGTAGCTGAGGACCCGTGGCACCGACATGGCATTTTTGAANN TTTTTCAGCTGGGCGCTAAGGGACAACTCCAGGTCGACAAGCTTG | NN on downstream region |
| GCGTAGCTGAGGACCCGTGGCACCGACATGGCATTTTTGAAN TTTTTCATGCTGGGCGCTAAGGGACAACTCCAGGTCGACAAGCTTG | N on downstream region |
| CAAGCTTGTCGACCTG | Primer used for primer extension |
| TCGTCGGCAGCGTCAGATGTGTATAAGAGACAGCAAGCTTGTCGACCTG | Primer used for amplification-Forward |
| GTCTCGTGGGCTCGGAGATGTGTATAAGAGACAGGCGTAGCTGAGGACC | Primer used for amplification-Reverse |
-
*For CRISPR oligonucleotides, leader is in italics, repeat is in bold, and spacer is in plain uppercase font. For hairpin, the loop region is in lowercase.
†RC = reverse complement of previous oligonucleotide.
-
††For cleavage substrates, PAM sequences are underlined.
Additional files
-
Transparent reporting form
- https://doi.org/10.7554/eLife.44248.021
Download links
A two-part list of links to download the article, or parts of the article, in various formats.
Downloads (link to download the article as PDF)
Open citations (links to open the citations from this article in various online reference manager services)
Cite this article (links to download the citations from this article in formats compatible with various reference manager tools)
The Cas4-Cas1-Cas2 complex mediates precise prespacer processing during CRISPR adaptation
eLife 8:e44248.
https://doi.org/10.7554/eLife.44248


