Anatomical basis and physiological role of cerebrospinal fluid transport through the murine cribriform plate
- Pennsylvania State University, United States
Figures
Figure 1 with 1 supplement
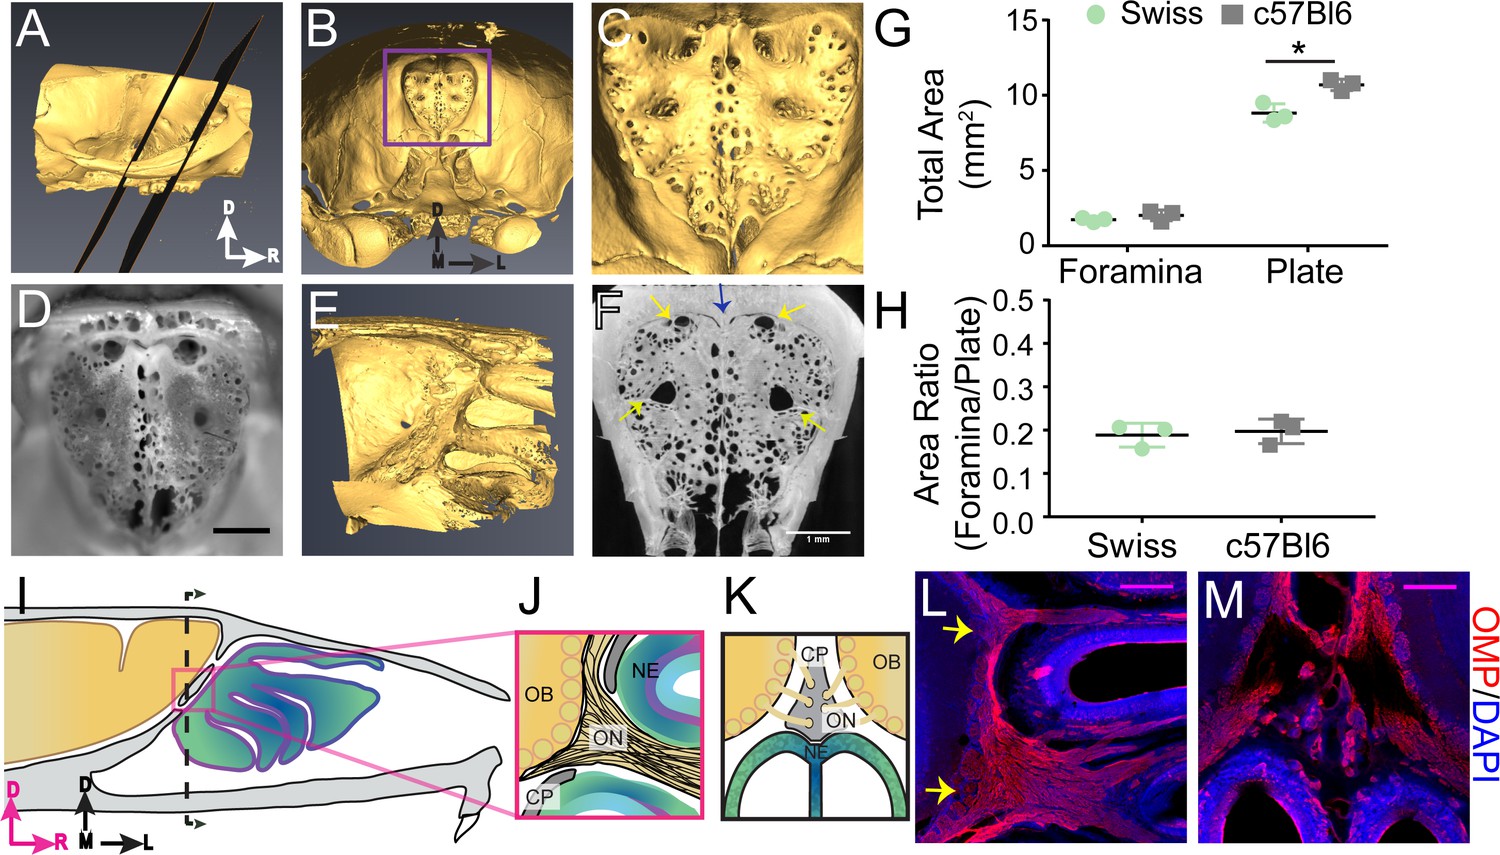
Structure of the calcified tissue of the cribriform plate and its relationship to olfactory sensory neuron axons.
For schematics: olfactory nerve (ON), neuroepithelium (NE), cribriform plate (CP), olfactory bulb (OB) and glomeruli (yellow circles). D = dorsal, R = rostral, M = medial, and L = lateral. (A) Sagittal view of a microCT scan of a mouse skull. Black planes bracket the area of the CP. (B) Anterior-looking view of the CP from microCT image. (C) Area indicated by purple box in (B). (D) Photograph of the CP from the same point of view as the CT reconstruction in (C). Scale bar 1 mm. E) Sagittal view of the OB and CP junction illustrating the curved structure of the CP. (F) Max intensity projection of a 1.67 mm thick section of the CP depicting the major foramina (yellow arrows) and crista galli (blue arrow). Scale bar 1 mm. (G–H) Mean ± standard deviation plotted. Circles and squares represent means of individual animals. (G) Left: Comparison of total foramina area between Swiss Webster and C57BL/6J mice: (t(4) = 1.32, p=0.256, n = 3 for each group, ttest2). Comparison of the total area of the CP between Swiss Webster and C57BL/6J mice: (t(4) = 4.55, p=0.021, n = 3 for each group, ttest2). (*p≤0.05). (H) Comparison of the ratio of the foramina area and CP area between Swiss Webster and C57BL/6J mice: (t(4) = 0.3891, p=0.7170, n = 3 for each group, ttest2). (I) Schematic of the sagittal plane of the mouse skull and brain showing the relationship of the OB and nerve junction to the CP. (J) Sagittal view of the area within the pink box in (I), depicting OSNs crossing the CP and terminating in the OB and glomeruli. (K) Coronal view of the black dashed line in (I) illustrating the location of the CP relative to the OBs and NE. (L–M) Immunofluorescent staining, OMP (red) and DAPI (blue). Scale bars 250 μm. (L) Sagittal plane, area depicted in (J), showing the two main OSN axon bundles (yellow arrows) that pass through the major foramina of the CP. (M) Coronal plane, area indicated in (K), showing OSN axon bundles that traverse the minor foramina of the CP along the crista galli.
Figure 1—figure supplement 1
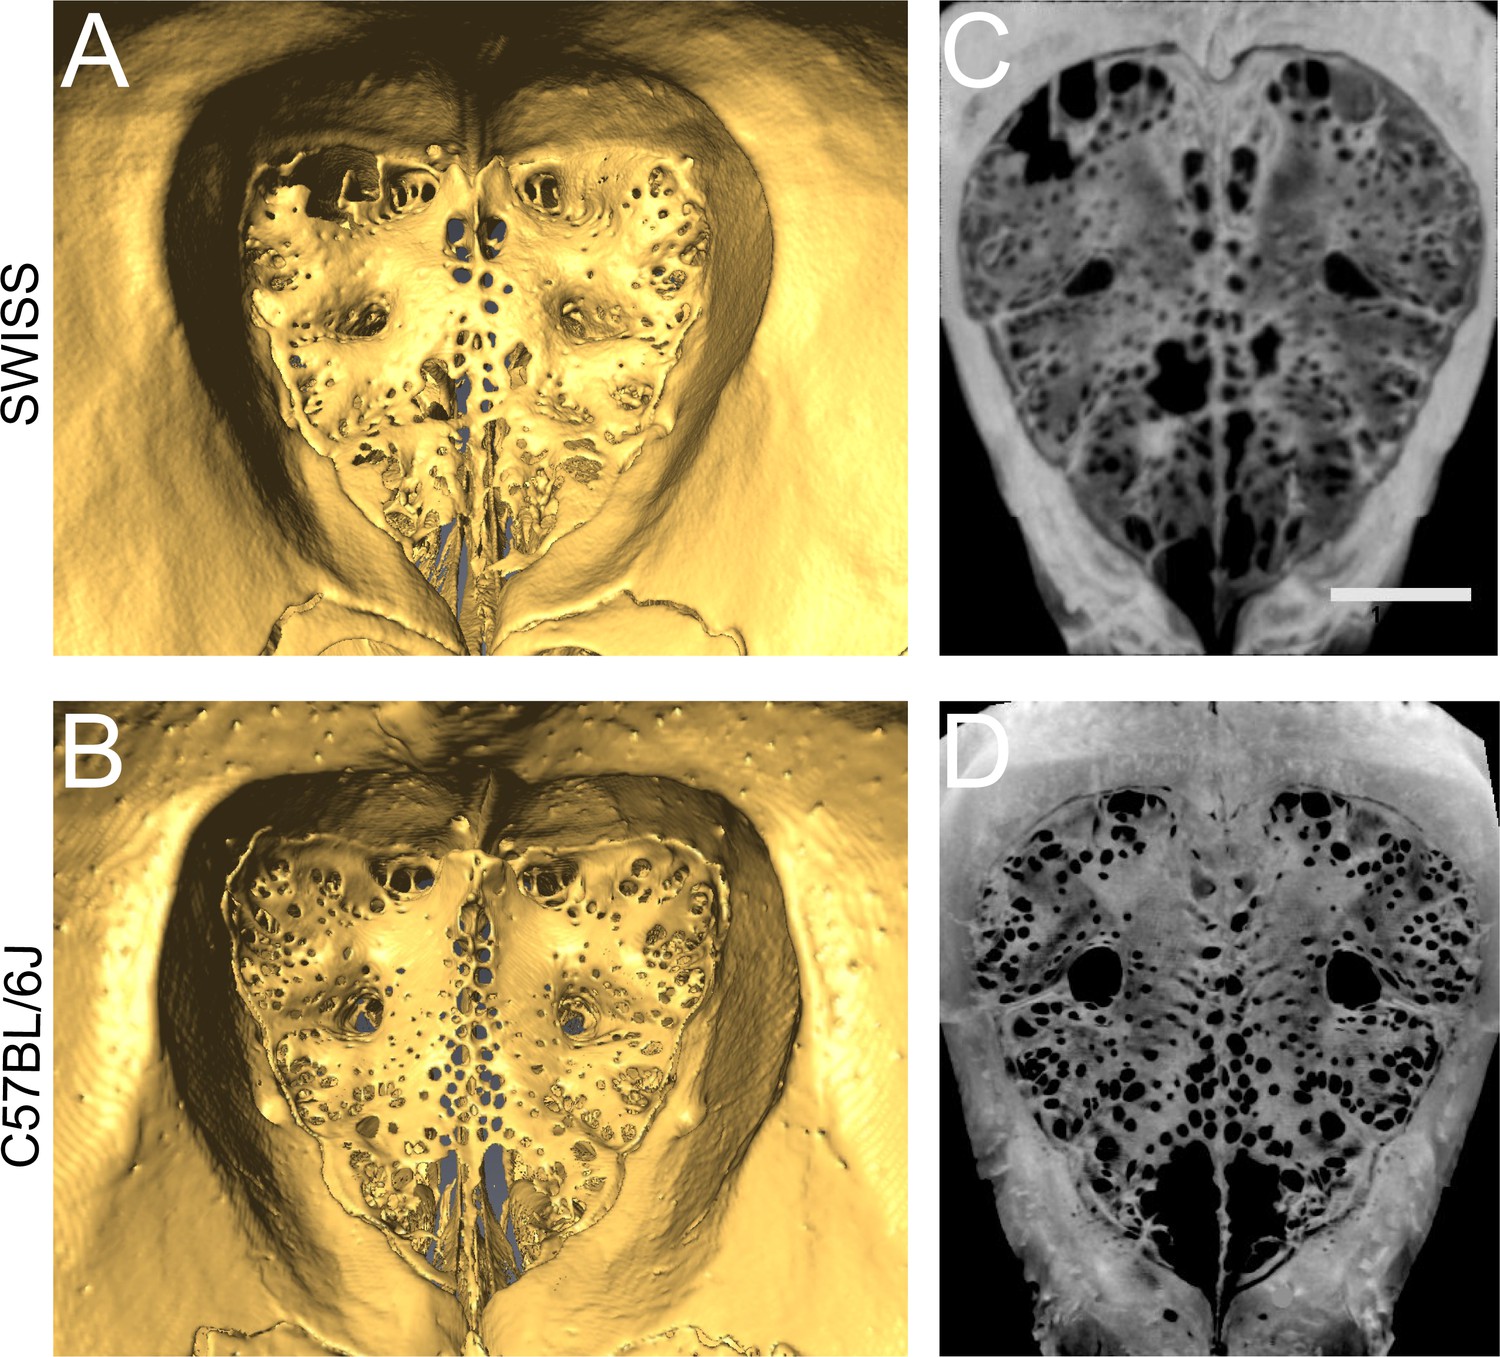
Cribriform plate morphology in Swiss Webster and C57BL/6J mice.
(A) Reconstructed microCT image of the anterior side of the CP of a Swiss Webster mouse, showing the perforated ridge along the centerline (crista galli). Four major foramen are observed laterally from the crista galli, with one dorsal and one medial foramen on each side of the midline. (B) Same as (A), except for a C57BL/6J mouse. (C) Max projection of the CP of a Swiss Webster mouse, note similarity to (A). Scale bar 1 mm. (D) Max projection of the CP of a C57BL/6J mouse, note similarity to (B). Note that the scans in (A) and (B) were taken with different scanners with different spatial resolutions: GE v|tome|x L 300 high-resolution nano/microCT scanner was used for all Swiss Webster mice, and an OMNI-X HD600 industrial microCT scanner was used for the C57BL/6J samples.
Figure 2 with 1 supplement
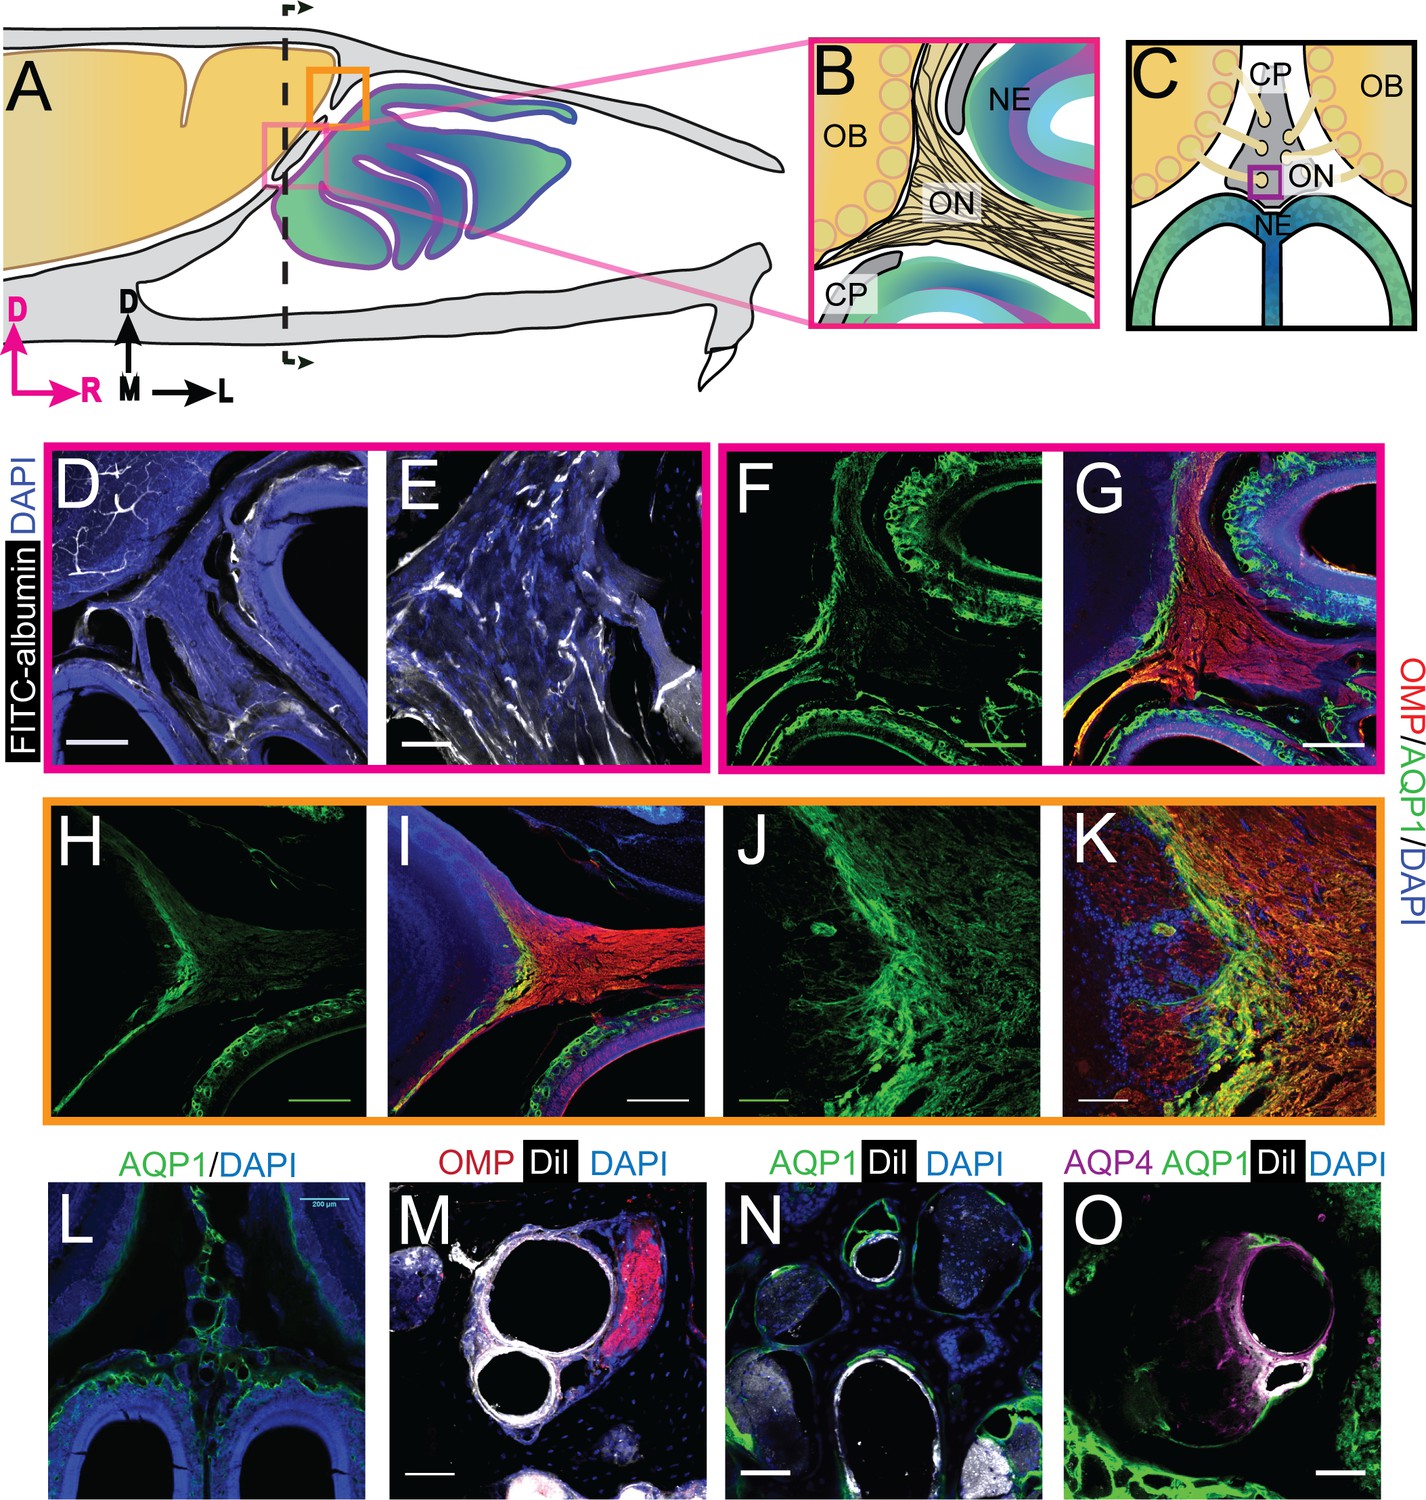
Aquaporin 1 and blood vessels are present in the cribriform plate and olfactory nerve junction.
For schematics: olfactory nerve (ON), neuroepithelium (NE), cribriform plate (CP), olfactory bulb (OB) and glomeruli (yellow circles). D = dorsal, R = rostral, M = medial, and L = lateral). (A) Schematic of the sagittal plane of the mouse skull and brain showing the relationship of the OB and nerve junction to the CP. (B) Sagittal view of the area within the pink box in (A), depicting OSNs crossing the CP and terminating in the OB and glomeruli. (C) Coronal view of the black dashed line in (A) illustrating the location of the CP relative to the OBs and NE. D) Area depicted by the pink box in (A), showing the presence of FITC-albumin filled blood vessels (white) along the medial ON. (E) Magnified area of (D). (F–O) Immunofluorescent staining, OMP (red), AQP1 (green), AQP4 (purple), DiI (white), and DAPI (blue). (F–G) Area depicted by the pink box in (A), showing the expression of AQP1 (F) at the junction of the OB and medial ON and in the lamina propria of the NE. (H–I) Area depicted by the orange box in (A), showing the expression of AQP1 at the junction of the OB and lateral ON and in the lamina propria of the NE. (J–K) Magnified area of (H–I). (L) AQP1 expression, in the area indicated in (C), is present in the lining of the smaller foramina along the midline of the crista galli, on the olfactory nerve layer of the OB, and in the lamina propria of the NE. (M–O) DiI-labeled endothelial cells of blood vessels traversing the smaller foramina of the CP alongside ONs (M) and lined with AQP-1 (N–O) or AQP-4 (O), area indicated by purple box in (C). (D, F–I, L) Scale bars 250 μm. (E, J–K, M–O) Scale bars 50 μm.
Figure 2—figure supplement 1
Localization of aquaporins at the olfactory nerve and bulb junction.
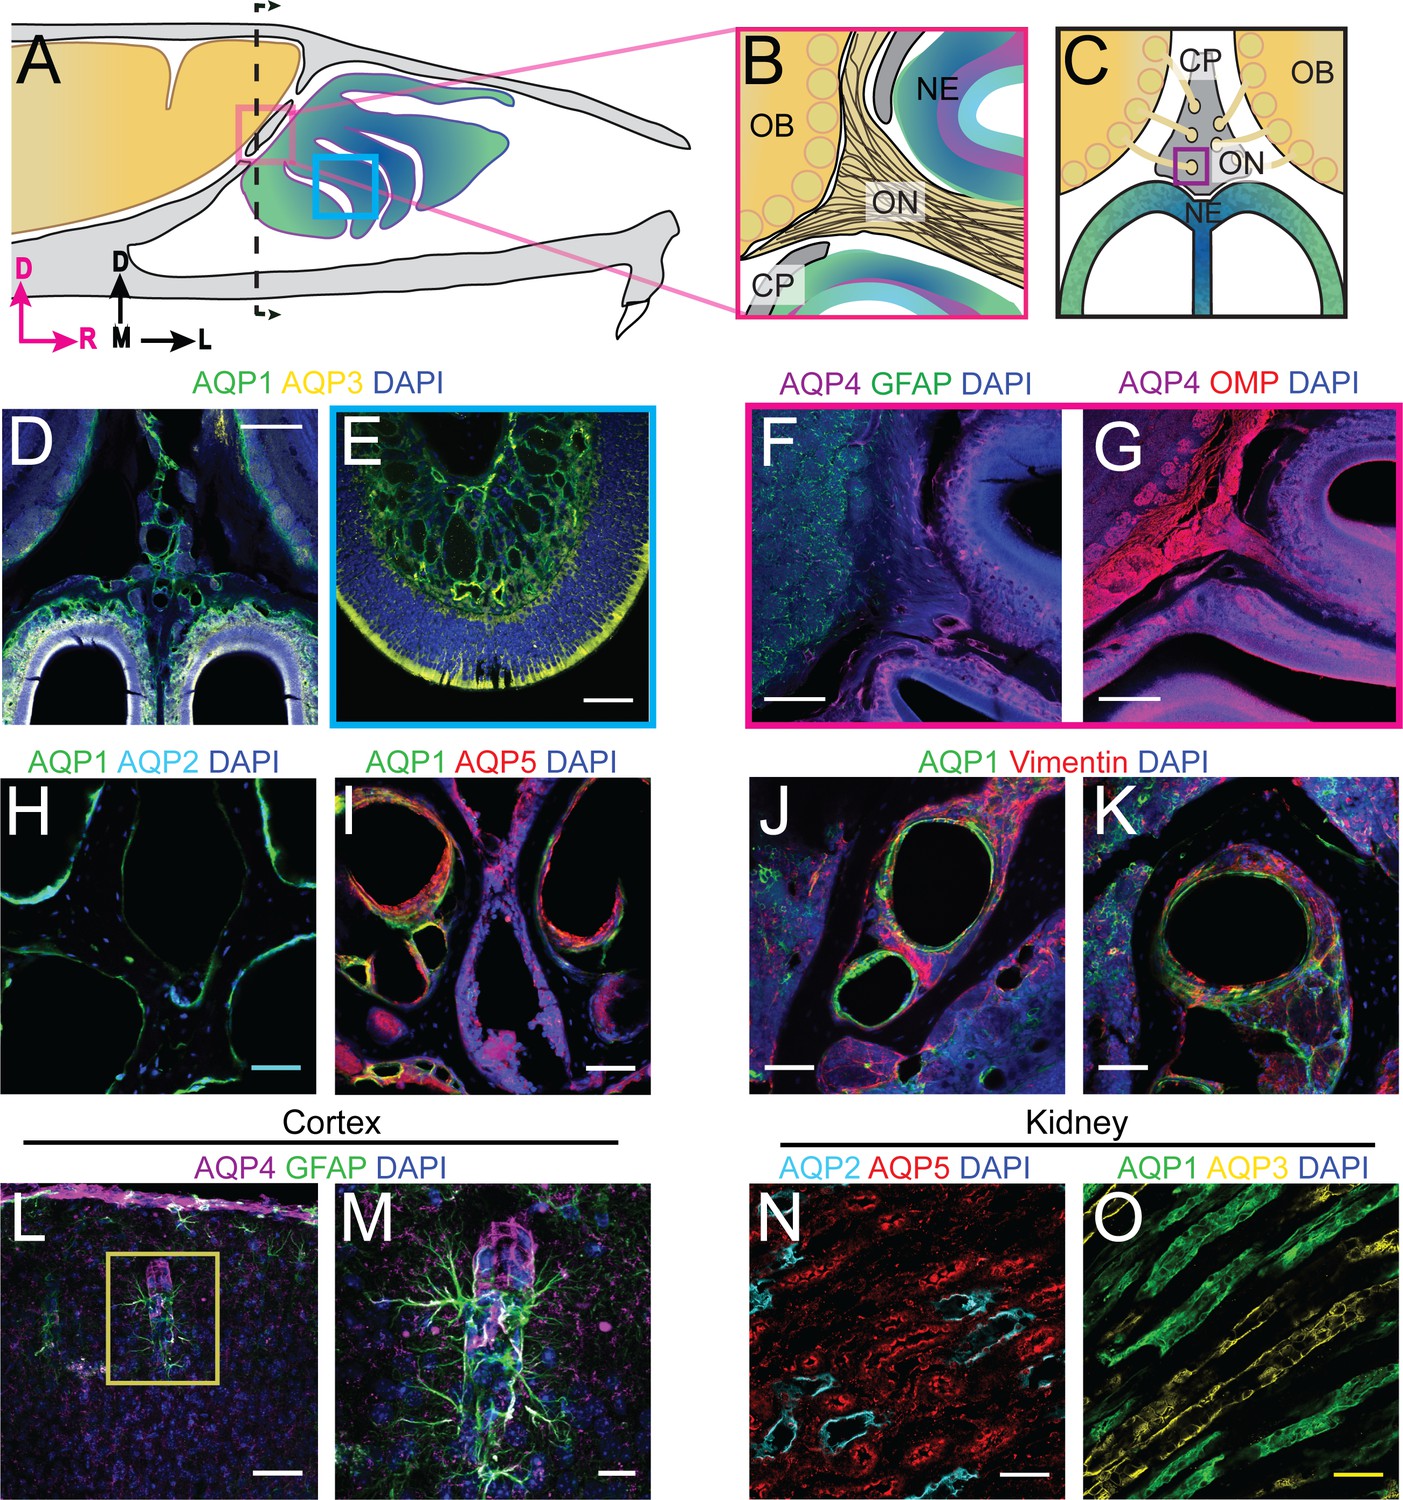
For schematics: olfactory nerve (ON), neuroepithelium (NE), cribriform plate (CP), olfactory bulb (OB) and glomeruli (yellow circles). D = dorsal, R = rostral, M = medial, and L = lateral. (A) Schematic of the sagittal plane of the mouse skull and brain, showing the relationship of the OB and nerve junction to the CP. (B) Sagittal view of the area within the pink box in (A), depicting OSNs crossing the CP and terminating in the OB and glomeruli. (C) Coronal view of the black dashed line in (A) illustrating the location of the CP relative to the OBs and NE. (D) Immunofluorescent staining of area in (C), demonstrating the expression of AQP1, but not AQP3, along the periphery of the OB and lining the foramina of the CP. Both AQP1 and AQP3 were observed lining the lamina propria of the NE. (E) Area depicted by the blue box in (A), expression of AQP1 and AQP3 lining the lamina propria of the NE. (F–G) AQP4 (magenta), GFAP (green), OMP (red), and DAPI (blue). Examining the expression of AQP4 at the junction of the medial OB and ON and the lamina propria of the NE. (F) Expression of AQP4 is observed lining the lamina propria of the NE and co-localizing with GFAP along the ON. (G) Expression of AQP4 is observed lining the lamina propria of the NE and not co-localizing with OMP. (H–K) Area indicated by purple box in (C). (H) Expression of AQP4 (magenta) is observed lining foramina of the CP. (I) Expression of AQP1 (green) and AQP2 (light blue) in foramina of the CP. (J–K) AQP1 (green) and Vimentin (red) are expressed by different cell types in the foramina of the CP. L–M) Co-localization of AQP4 (magenta) and GFAP (green) on astrocytic end feet in the cortex. (M) Area indicated by yellow box in (L). (N–O) Immunofluorescent staining of mouse kidney tissue. (N) Expression of AQP2 (light blue) and AQP5 (red) in the renal cortex of the kidney. O) Expression of AQP1 (green) and AQP3 (yellow) in the renal medulla of the mouse kidney. (D–G) Scale bars 250 μm. (H–K, L, N–O) Scale bars 50 μm. (M) Scale bar 20 μm.
Figure 3 with 2 supplements
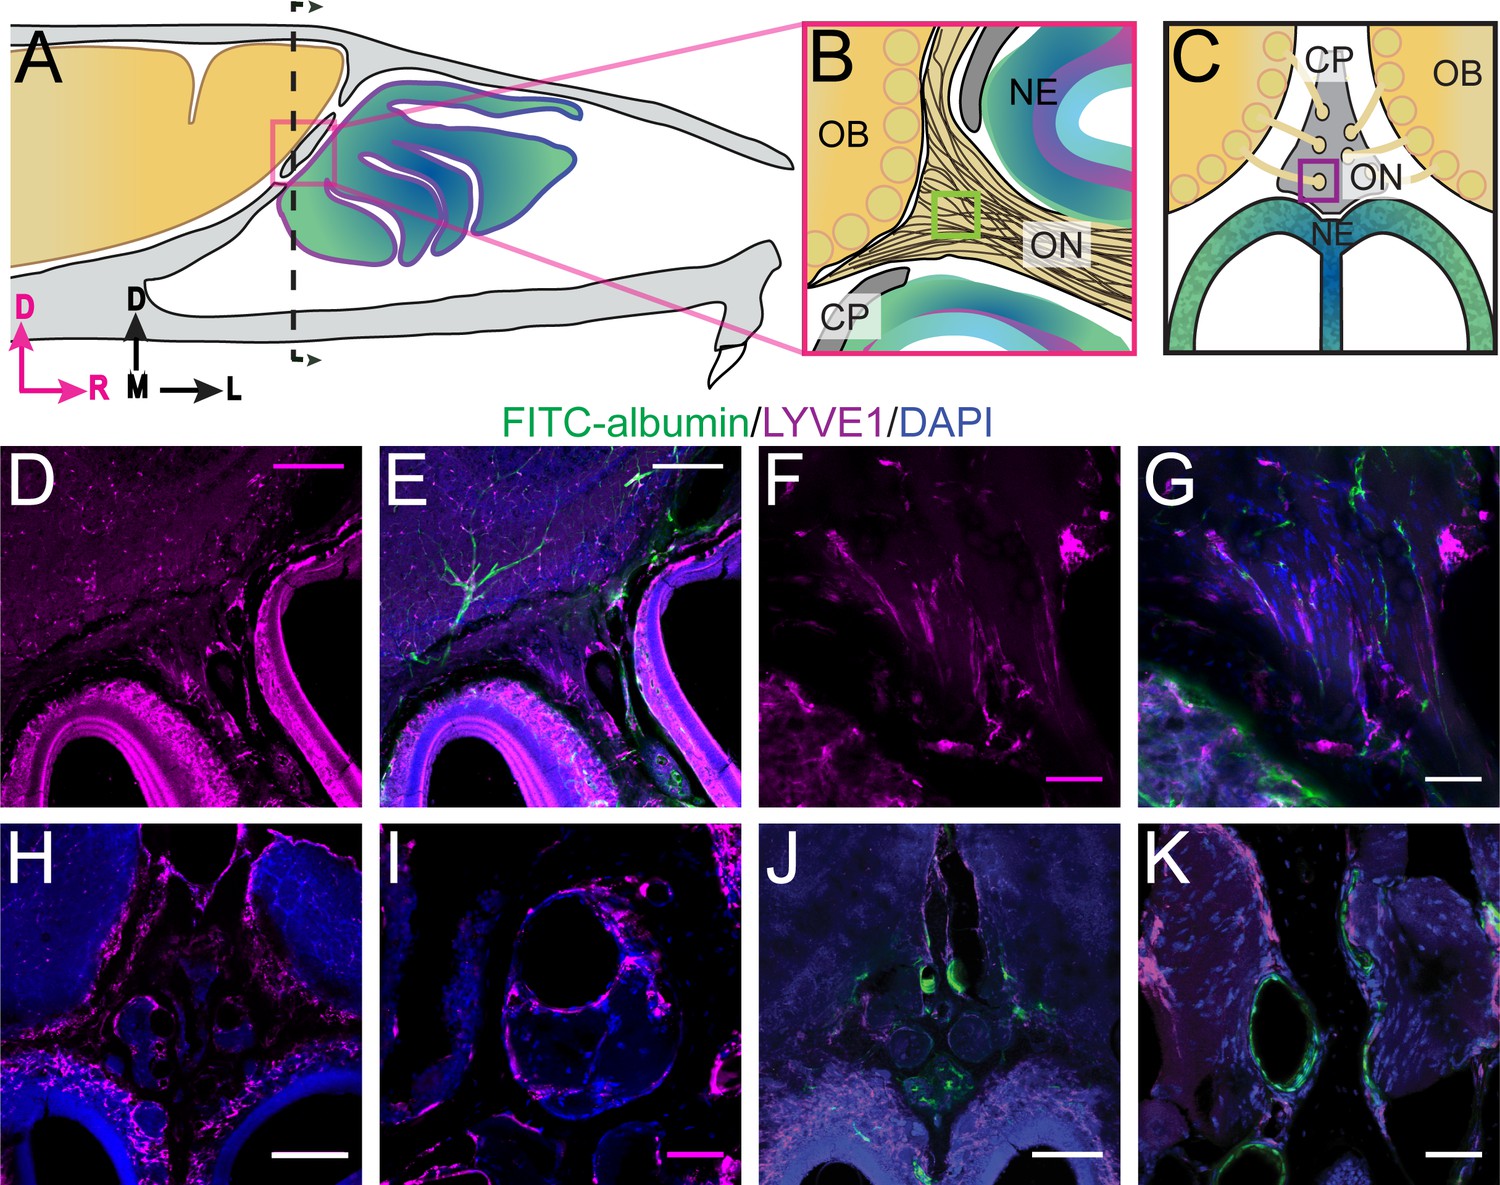
Localization of lymphatic vessels at the cribriform plate and olfactory bulb junction.
For schematics: olfactory nerve (ON), neuroepithelium (NE), cribriform plate (CP), olfactory bulb (OB) and glomeruli (yellow circles). D = dorsal, R = rostral, M = medial, and L = lateral. (A) Schematic of the sagittal plane of the mouse skull and brain showing the relationship of the OB and nerve junction to the CP. (B) Sagittal view of the area within the pink box in (A), depicting OSNs crossing the CP and terminating in the OB and glomeruli. (C) Coronal view of the black dashed line in (A) illustrating the location of the CP relative to the OBs and NE. (D–K) Immunofluorescent staining: LYVE1 (magenta), FITC-albumin (green), and DAPI (blue) in LYVE1-tdtomato mice. (D–E) Localization of LYVE1+ vessels along the medial olfactory nerve, sagittal area indicated in (B), depicting LYVE1+/FITC-albumin negative vessels (putative lymphatic vessels) running parallel to the olfactory nerve. (F–G) Area indicated by green box in (B), magnified area of (D–E). (H) Localization of LYVE1+ vessels in the nasal epithelium and traversing the CP, coronal area indicated in (C). (I) Area indicated by purple box in (C), magnified area of (H), depicting LYVE1+ vessels traversing foramina of the CP. (J) Localization of LYVE1+ vessels and blood vessels (labeled with FITC-albumin) in the nasal epithelium and traversing the CP, coronal area indicated in (C). (K) Area indicated by purple box in (C), magnified area of (H), depicting only blood vessels (labeled with FITC-albumin) traversing foramina of the CP. (D–E, H, J) Scale bars 250 μm. (F–G, I, K) Scale bars 50 μm.
Figure 3—figure supplement 1

Lymphatic vessels in lymph nodes and dura express LYVE1, as do non-lymphatic vessels and cells in the brain.
(A–D) LYVE1-GFP (Ai6) mice were used for these experiments. (A–B) Superficial lymph nodes in the neck: DiI (white) and LYVE1 (magenta). No cross-labeling is observed between DiI+ blood vessels and LYVE1+ lymphatic vessels. (C–D) Dura: DiI (white), LYVE1 (yellow), and DAPI (blue). (E) Schematic of the sagittal view of the mouse brain showing the ROIs for (F–I). (F–I) LYVE1-tdtomato (Ai14) mice were used for these experiments. FITC-albumin filled LYVE1-tdtomato mice. LYVE1 (magenta), FITC-albumin (green), and DAPI (blue). F–G) A penetrating vessel (FITC-albumin filled) with LYVE1+ vascular endothelial cells (F) in the upper layers of the cortex, area indicated by the blue box in (A). (H–I) A non-vascular cell of unknown type expressing LYVE1 in the frontal cortex (H), area indicated by orange box in (A). (A–B) Scale bar 500 μm. C–D, H–I) Scale bar 250 μm. (F–G) Scale bar 50 μm.
Figure 3—figure supplement 2
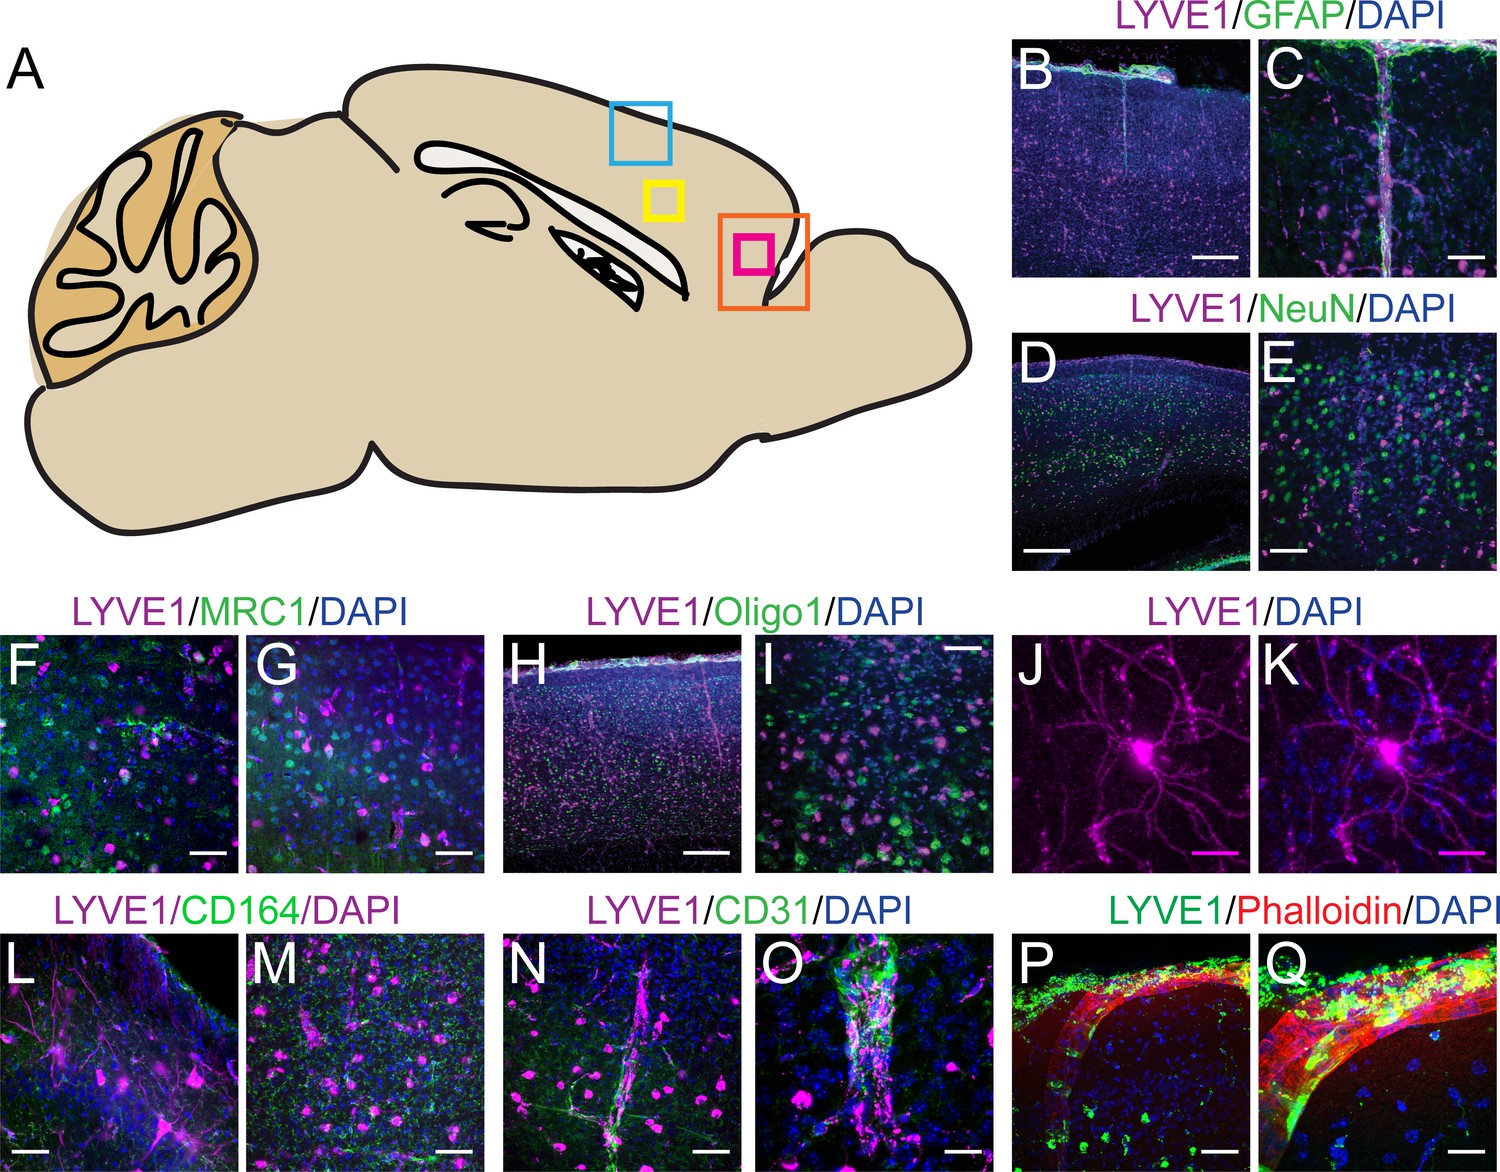
LYVE1 expression in the murine brain is not cell-type specific.
(A) Schematic of the sagittal view of the mouse brain showing the ROIs for (B–Q). (B–Q) Immunofluorescence staining of GFAP, NeuN, MRC1, Oligo1, CD164, CD31, or Phalloidin in a LYVE1-GFP (Ai6) mouse in the cortex, in the area indicated by the blue box in (A), unless specified. (B) No overlap was observed between GFAP+ and LYVE1+ cells. (C) Zoomed in area in (B). (D) No overlap was observed between NeuN+ and LYVE1+ cells. (E) Zoomed in area in (D). (F) Minimal overlap was observed between MRC1+ and LYVE1+ cells in the area indicated by the pink box in (A). (G) Minimal overlap was observed between MRC1+ and LYVE1+ cells in the area indicated by the yellow box in (A). (H) No overlap was observed between Oligo1+ and LYVE1+ cells. (I) Zoomed in area in (H). (J–K) LYVE1+ cell of unknown type, area indicated by yellow box in (A). (L) No overlap was observed between CD164+ and LYVE1+ cells in the area indicated by the pink box in (A). (M) No overlap was observed between CD164+ and LYVE1+ cells in the area indicated by the yellow box in (A). (N) Overlap was observed between CD31+ and LYVE1+ cells in the area indicated by the blue box in (A). (O) Zoomed in area in (N). (P) Overlap was observed between Phalloidin and LYVE1+ cells in the area indicated by the blue box in (A). (Q) Zoomed in area in (N). (B, D, H) Scale bar 250 μm. (C, E–G, I, L–N, P) Scale bar 50 μm. (J–K) Scale bar 25 μm. (O, Q) Scale bar 20 μm.
Figure 4
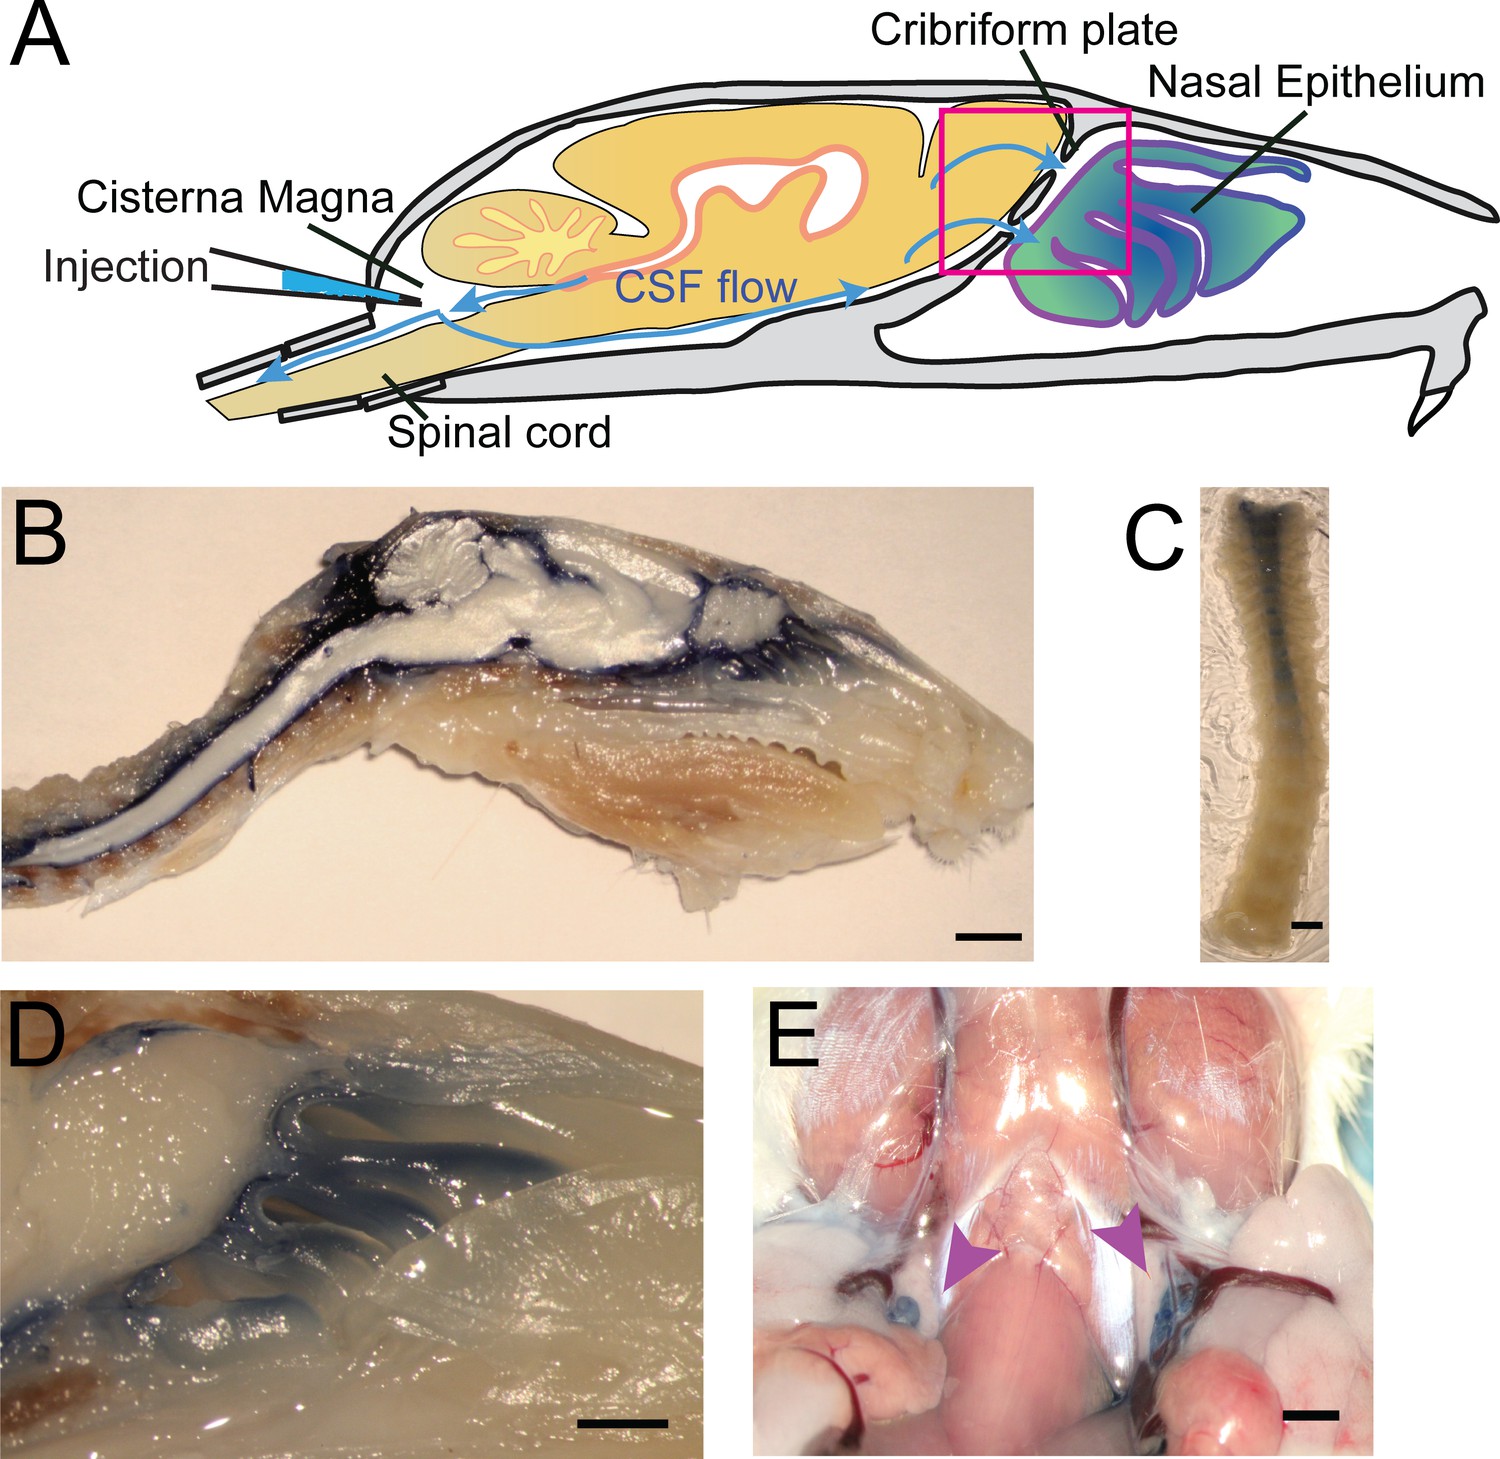
Visualization of CSF flow into the nasal cavity and spinal column by injection of Evans blue dye into the cisterna magna.
(A) Schematic of the sagittal plane of the mouse skull and brain depicting the flow of CSF (blue arrows) and location of EB injection into the cisterna magna. (B) Sagittal, midline cut of a decalcified skull and spinal column after a cisterna magna EB injection. Scale bar 3 mm. (C) A decalcified and SeeDB-cleared spinal column (cut between C2 and C3, with C3 at the top of the picture) after a cisterna magna EB injection. Scale bar 2 mm. D) Area depicted by pink box in (A), showing drainage of EB dye across the CP into the nasal cavity. Scale bar 1 mm. (E) Localization of EB dye in the deep cervical lymph nodes (purple arrows) after a cisterna magna EB injection. Scale bar 1 mm.
Figure 5 with 1 supplement
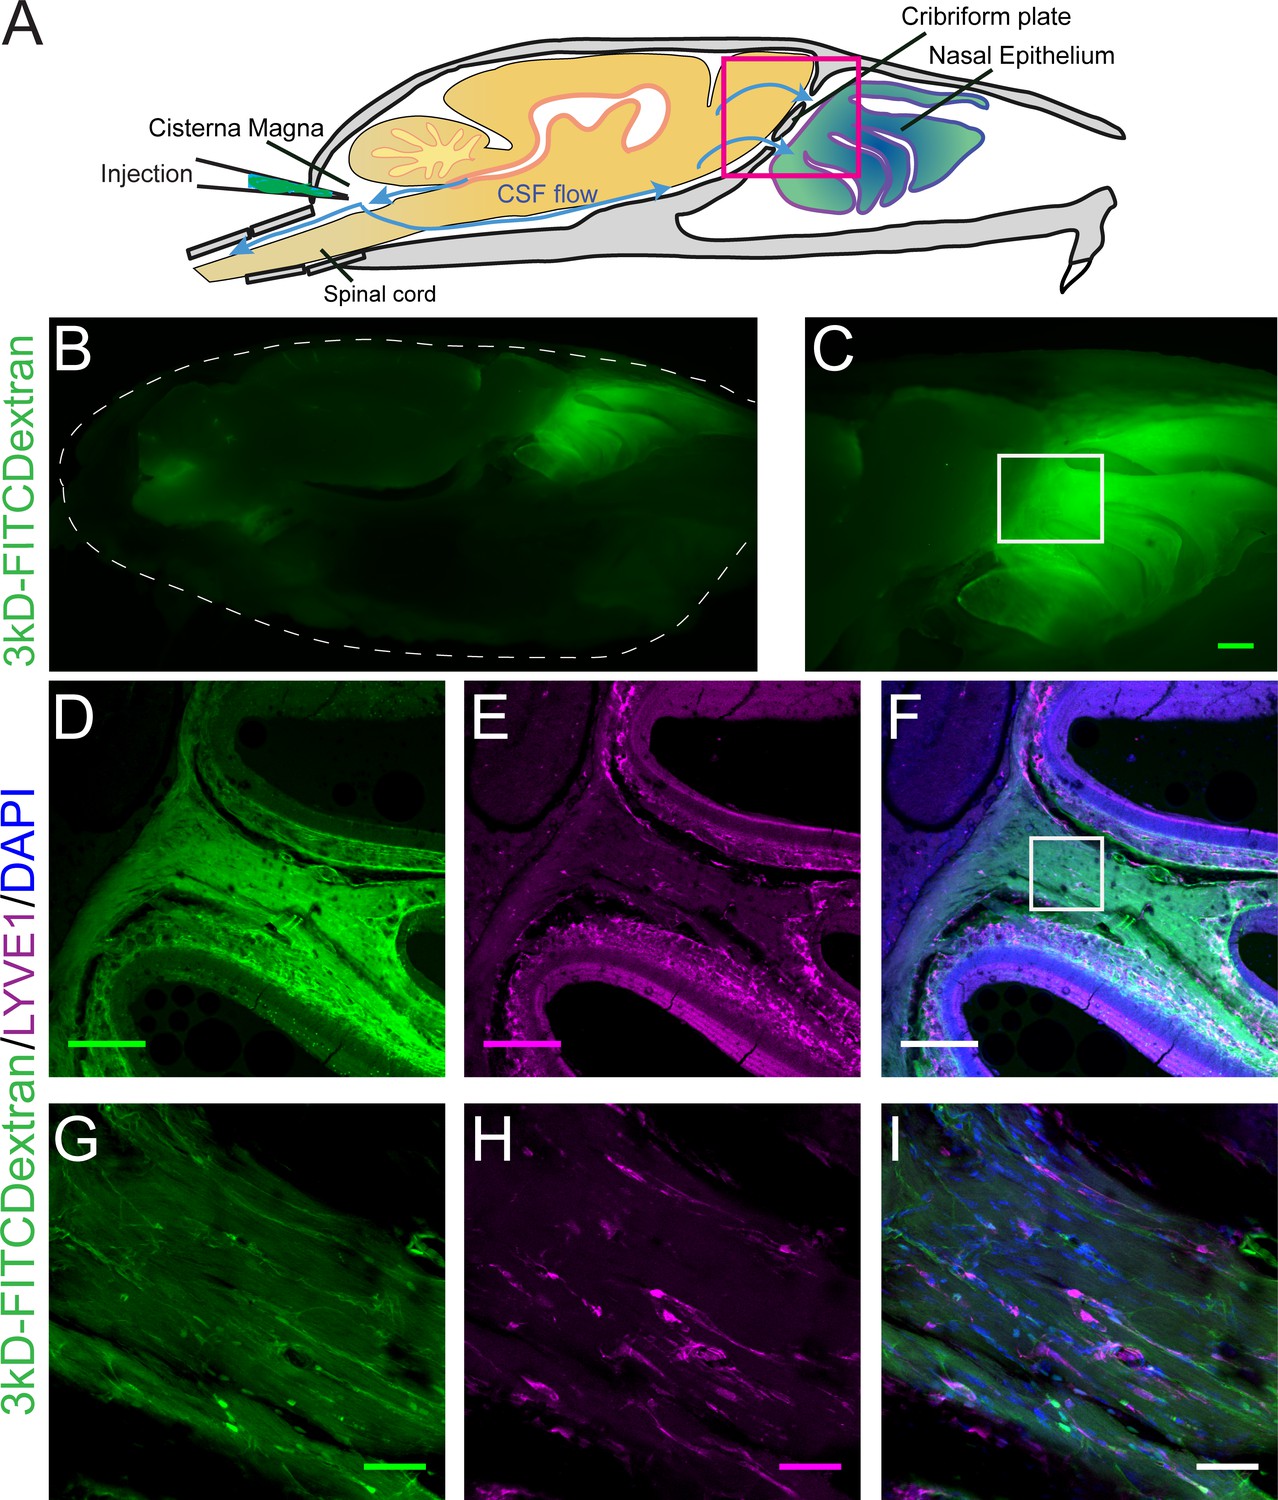
Visualization of CSF flow into the nasal cavity by injection of 3kDa-FITCDextran into the cisterna magna.
(A) Schematic of the sagittal plane of the mouse skull and brain depicting the flow of CSF (blue arrows) and location of 3kDa-FITCDextran injection into the cisterna magna. (B–I) Fluorescent images of a mouse skull and brain 35 min after a 3kDa-FITCDextran (green) cisterna magna injection. (B) Skull outlined by white dashed lines. 3kDa-FITCDextran is observed in the cisterna magna and the nasal cavity. (C) Area indicated by pink box in (A). FITC 3kD-Dextran is observed in the nasal cavity. Scale bar 500 μm. (D–I) Fluorescent images of a mouse skull and brain 35 min after a 3kDa-FITCDextran (green) cisterna magna injection into a LYVE1-tdTomato (Ai14) mouse. LYVE1 (magenta) and DAPI (blue). (D–F) Area indicated by white box in (C). 3kDa-FITCDextran is observed draining into the nasal cavity along the olfactory nerve. LYVE1+ vessels are observed running parallel to the olfactory nerve. Scale bar 250 μm (G-I) Area indicated by white box in (F). 3kD-FITCDextran is observed moving along and through LYVE1+ vessels. Scale bar 50 μm.
Figure 5—figure supplement 1
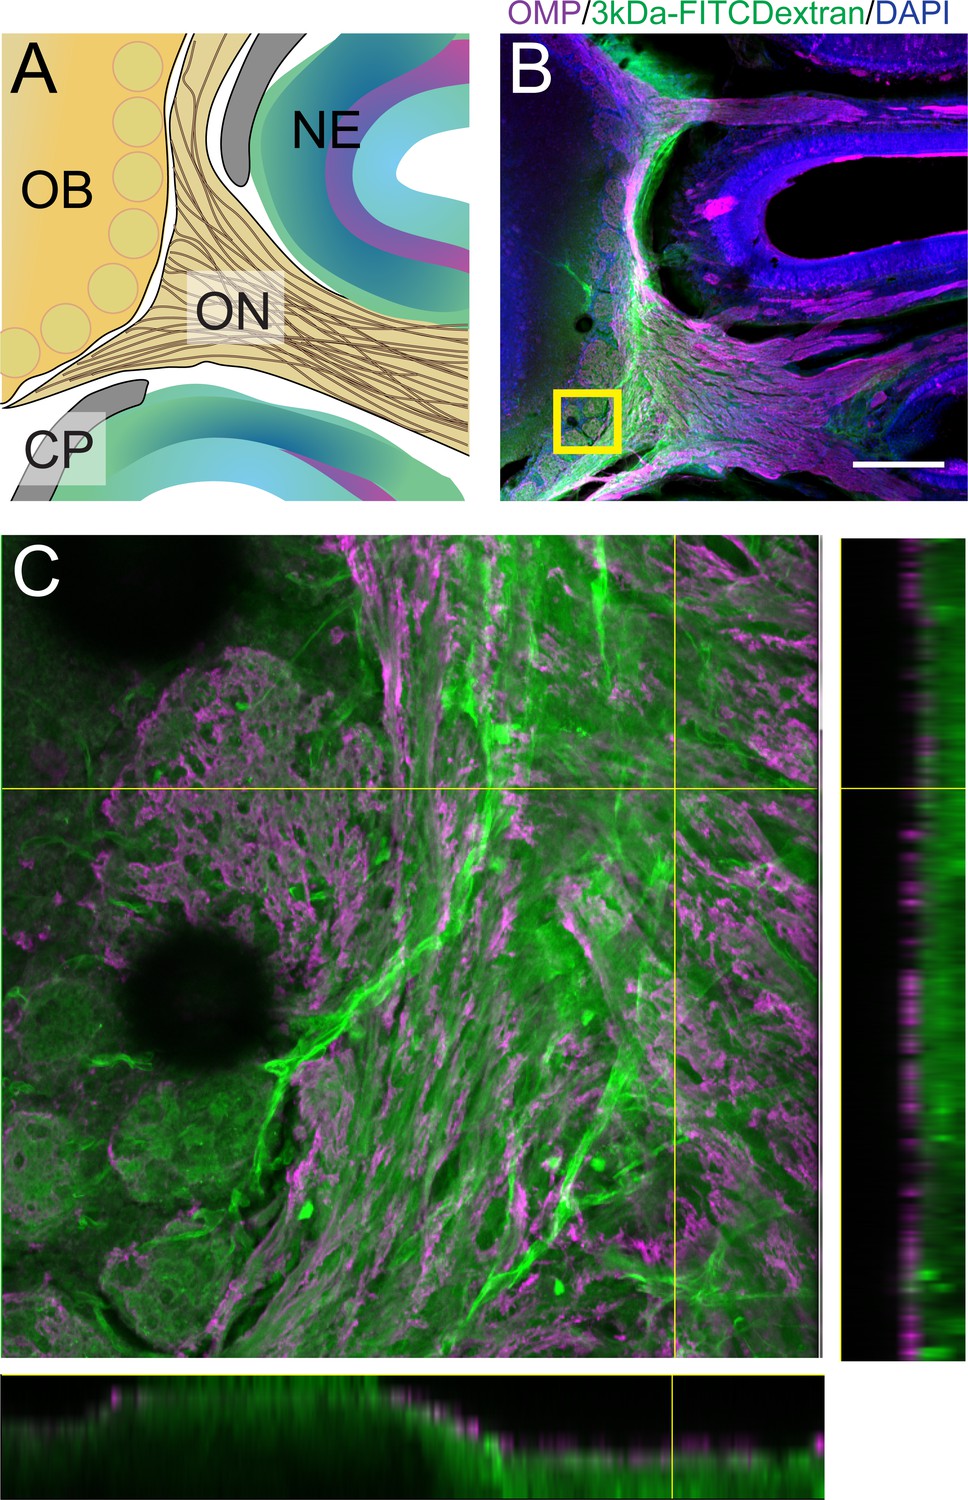
Anatomic route of olfactory bulb injected 3kDa-FITCDecxtran dye.
For schematics: olfactory nerve (ON), neuroepithelium (NE), cribriform plate (CP), olfactory bulb (OB) and glomeruli (yellow circles). (A) Sagittal view of the mouse skull and brain depicting OSNs crossing the CP and terminating in the OB and glomeruli. (B) Immunofluorescent staining of area in (A), after an injection of 3kDa-FITCDextran injected into the olfactory bulb. OMP+ OSNs (magenta) and the dye (green) are observed crossing the CP into the nasal cavity. Scale bar 250 µm. (C) Stacked image of the area depicted by yellow box in (B). Orthogonal views of the stack are shown: right panel (YZ) view and bottom panel (XZ) view.
Figure 6 with 2 supplements
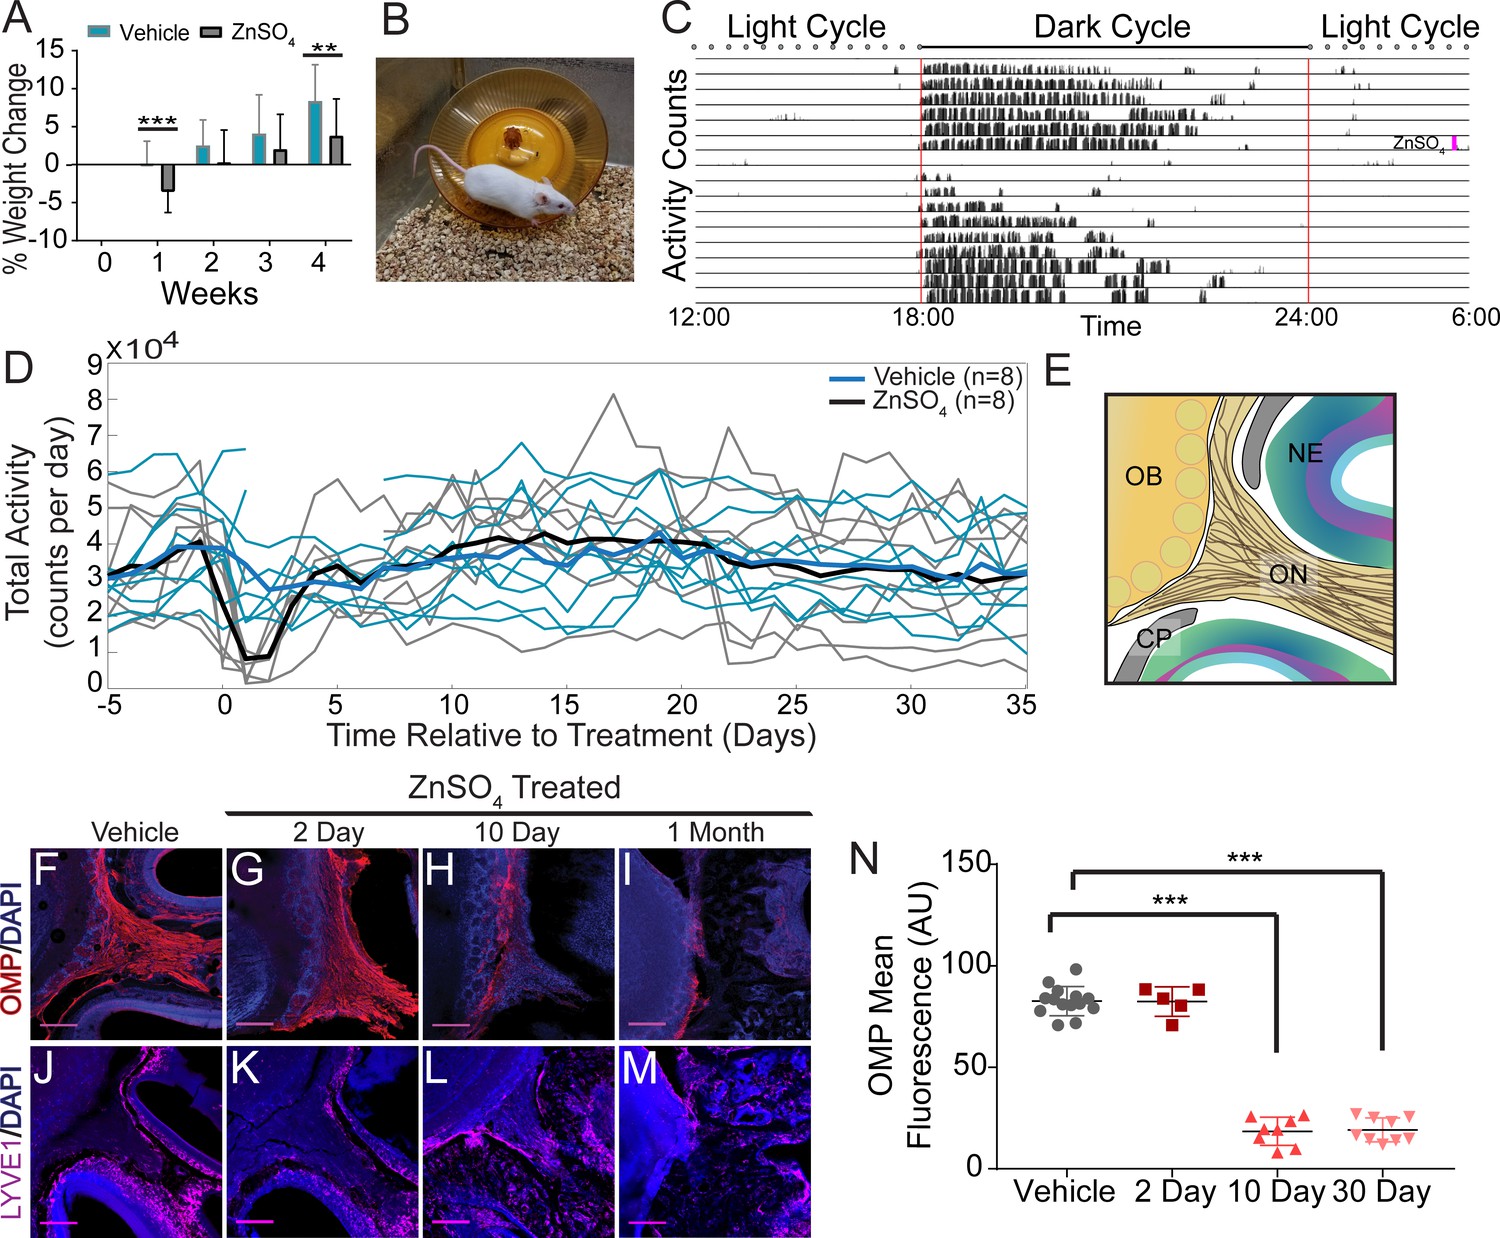
Effects of ZnSO4 treatment on behavior and olfactory sensory nerve axons.
(A) Percent weight loss of vehicle (blue) and ZnSO4 treated (black) mice after treatment. There was a significant difference in weight of ZnSO4-treated mice compared to control mice 1 week (p=0.001, n = 17 for vehicle and n = 25 for treated, ttest2) and 4 weeks (p=0.004, n = 17 for vehicle and n = 25 for treated, ttest2) after treatment. Mean ± standard deviation plotted. **p≤0.01 ***p≤0.001 (B) Photo of a Swiss Webster mouse on the running wheel. (C) Actogram of the activity of a single mouse before and after ZnSO4 treatment. Treatment time indicated by pink line. (D) Individual counts of total wheel activity per day (vehicle = blue, ZnSO4treated = gray), bold line is the mean of each group. No significant difference observed between groups (p=0.5189, KSTAT = 0.3750, n = 8 for each group, K-S test). (E) Schematic: sagittal plane depicting OSNs crossing the CP and synapsing onto the OB and glomeruli (yellow circles). (F–M) Immunofluorescent staining of area depicted in (E), OMP (red), LYVE1 (magenta) and DAPI (blue). Scale bar 250 μm. (F, J) Vehicle Control. (G, K) Two days after ZnSO4 treatment. (H, L) Ten days after ZnSO4 treatment. (I, M) Thirty days after ZnSO4 treatment. Swiss Webster mice were used for (F–I) and LYVE1-GFP (Ai6) mice were used for (J–M). (N) Quantification of OMP signal fluorescence for vehicle (n = 14) mice compared to 2 (t(8) = 0.1429, p=0.8898, n = 5, post-hoc ttest2), 10 (t(13) = 15.71, p≤0.001, n = 8, post-hoc ttest2) and 30 (t(13) = 25.39, p≤0.001, n = 9, post-hoc ttest2) days after ZnSO4 treatment. Mean ± standard deviation plotted. Circles, triangles, and squares represent means of individual animals. ***p≤0.001.
Figure 6—figure supplement 1

ZnSO4-treatment causes olfactory bulb degeneration.
(A) Comparison of the area of olfactory bulb for vehicle and ZnSO4-treated 2 days (t(5) = 0.0073, p=0.9945, n = 3 for vehicle and n = 4 treated, post-hoc ttest2), 10 days (t(12) = 6.46, p≤0.001, n = 7 for each group, post-hoc ttest2), and 30 days (t(12) = 6.712, p≤0.001, n = 7 for each group, post-hoc ttest2) after treatment. Mean ± standard deviation plotted. (B) Quantification of the OMP mean fluorescence of vehicle–treated mice. No significant differences were observed (F(2, 16)=0.02775, p=0.9727, 2 day n = 5, 10 day n = 8, 30 day n = 6, one-way ANOVA) showing a lack of olfactory degeneration. Mean ± standard deviation plotted. Circles, squares, and triangles represent means of individual animals. (C–F) Thionin-nissl staining 30 days post-ZnSO4 treatment of Swiss Webster and C57BL/6J vehicle mice (C–D) and 30 days post ZnSO4-treated mice (E–F). Note increased space between OB and CP and change in morphology of the neuroepithelium in ZnSO4-treated mice. Scale bar 1 mm.
Figure 6—figure supplement 2
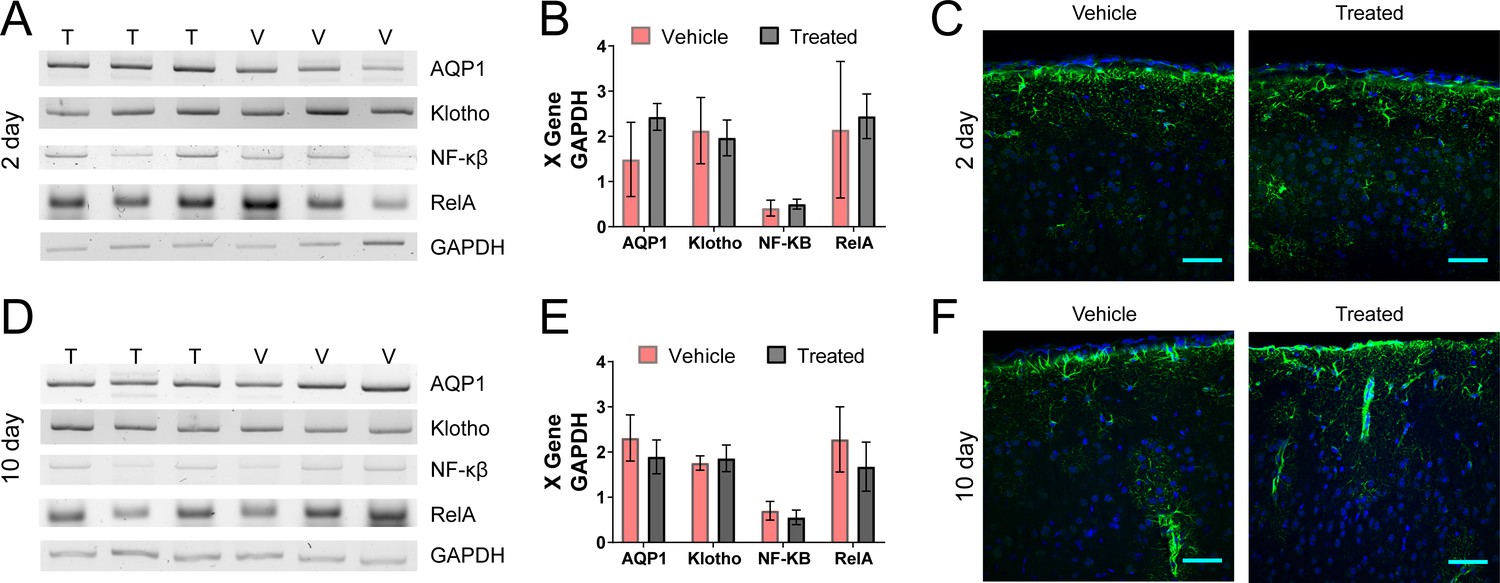
Genetic and histological assays show no inflammatory response in the brain or choroid plexus to ZnSO4 treatment.
(A–D) AQP1, Klotho, NF-κβ, or RelA mRNA detected in the ventricle and choroid plexus of ZnSO4-treated and vehicle control mice. mRNA was extracted from adult choroid plexus tissue, converted to cDNA, and normalized based on GAPDH expression. (A) PCR products of ZnSO4 treated and vehicle control mice 2 days after treatment depicted by pictures of the agarose gels after amplification with the specific primers. (B) Normalization of mRNA expression by GAPDH expression (n = 3 each group). No significant difference (n = 3 for each group, ttest2) in expression was observed for all proteins assessed between ZnSO4-treated and vehicle mice: AQP1 (p=0.1347), Klotho (p=0.7550), NF-κβ (p=0.4990), or RelA (p=0.7623). (C) Immunofluorescence staining of GFAP (green) and DAPI (blue) in the mouse cortex. Left panel vehicle and right panel 2 days after ZnSO4 treatment. No inflammatory response (GFAP) is observed 2 days after ZnSO4 treatment, as compared to vehicle control. Scale bar 50 µm. (D) PCR products of ZnSO4 and vehicle control mice 10 days after treatment depicted by pictures of the of the agarose gels after amplification with the specific primers. (E) Normalization of mRNA expression by GAPDH expression (n = 3 each group, ttest2). No significant difference was observed for all proteins assessed between ZnSO4 treated and vehicle mice: AQP1 (p=0.3158), Klotho (p=0.6276), NF-κβ (p=0.3803), or RelA (p=0.3097). (F) Immunofluorescence staining of GFAP (green) and DAPI (blue) in the mouse cortex. Left panel vehicle and right panel 10 day ZnSO4 treated. No inflammatory response (GFAP) is observed 10 days after ZnSO4 treatment, compared to vehicle control. Scale bar 50 µm.
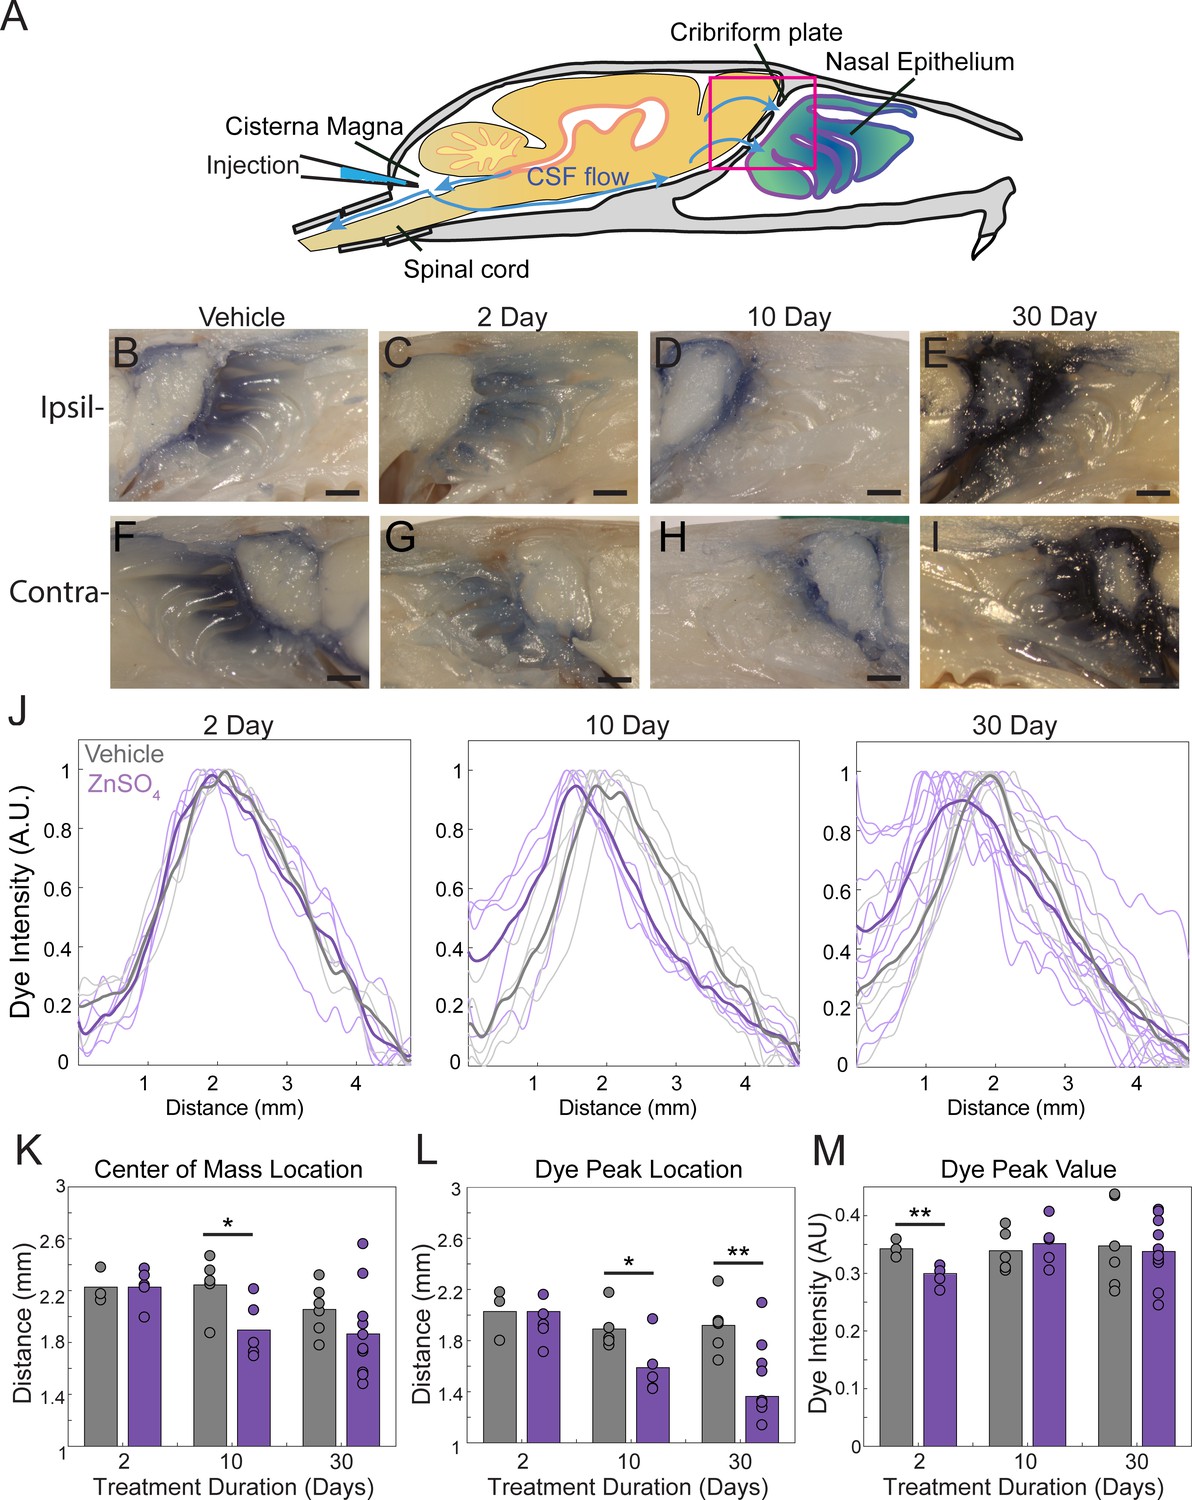
Figure 7 with 1 supplement
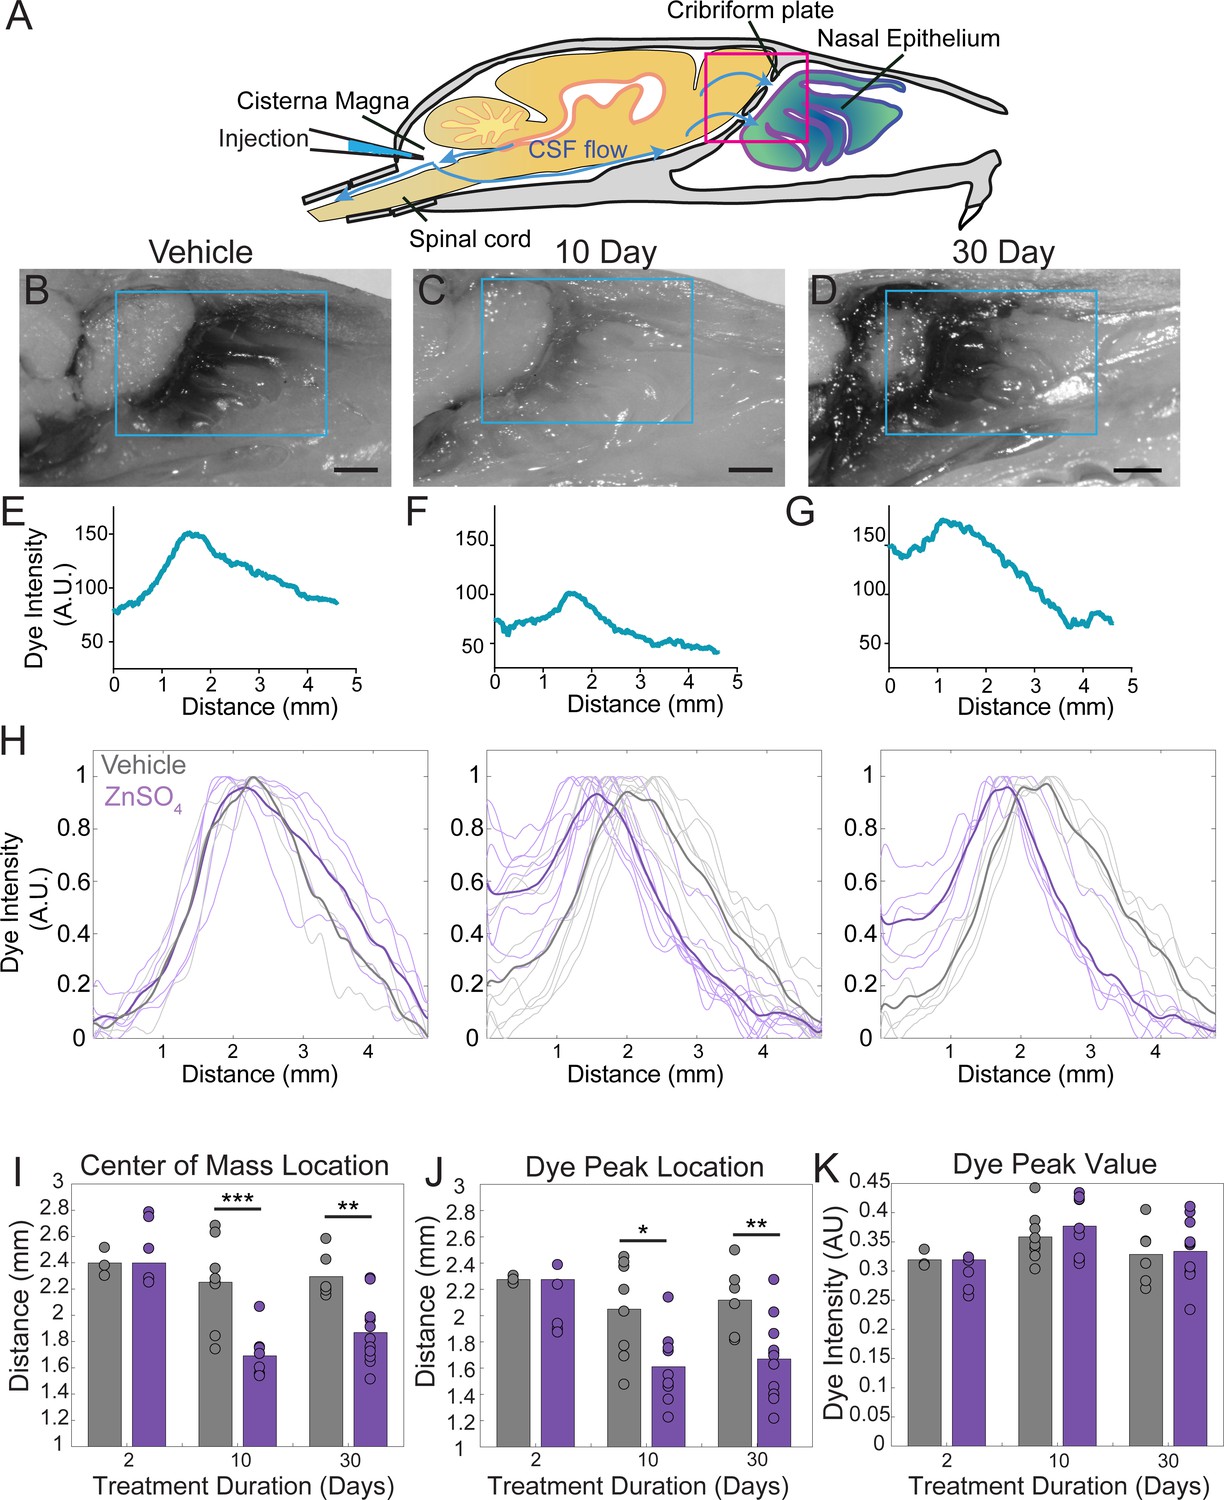
ZnSO4 treatment decreases CSF outflow through the cribriform plate ipsilateral to treatment.
(A) Sagittal view schematic depicting direction of CSF flow and location of a cisterna magna injection of Evans blue. (B–D) Sagittal view of decalcified and cut skull for imaging after Evans blue injection, area indicated by pink box in (A). ROI indicated by blue box. Scale bar 1 mm. (B) Vehicle control. (C) 10 days after ZnSO4 treatment. (D) 30 days after ZnSO4 treatment. (E–G) Plot of the intensity of the Evans blue dye as a function rostral-caudal distance. (E) Vehicle control, ROI of area measured indicated by blue box in (B). (F) 10 day ZnSO4 treated, ROI of area measured indicated by blue box in (C). (G) 30 days after ZnSO4 treatment, ROI of area measured indicated by blue box in (D). (H) Comparison of all dye curves of all vehicle- (gray) and ZnSO4-treated (purple) groups for each time point after treatment: 2 day, n = 3 vehicle and n = 5 treated. 10 day, n = 5 for each group. 30 day, n = 6 vehicle and n = 11 for treated. Means plotted as bold lines. (I–K) Mean is plotted as height of bar. Circles represent individual animals. (I) Mean of the center of mass location of the dye curve plotted for vehicle- and ZnSO4-treated animals 2 (t(6) = 0.7489, p=0.4822, n = 3 vehicle and n = 5 treated, post-hoc ttest2), 10 (t(15) = −4.4921, p=0.0004, n = 5 for each group, post-hoc ttest2), and 30 ((t(15) = −3.7539, p=0.0019, n = 6 vehicle and n = 11 for treated, post-hoc ttest2) days after treatment. J) Mean dye peak location plotted for vehicle and ZnSO4-treated animals 2 (t(6) = −1.5082, p=0.1822, n = 3 vehicle and n = 5 treated, post-hoc ttest2), 10 (t(15) = −2.8064, p=0.0133, n = 5 for each group, post-hoc ttest2), and 30 (t(15) = −3.0014, p=0.0089, n = 6 vehicle and n = 11 for treated, post-hoc ttest2) days after treatment. (K) Maximum dye peak value plotted for vehicle and ZnSO4-treated animals 2 (t(6) = −1.4187, p=0.2058, n = 3 vehicle and n = 5 treated, post-hoc ttest2), 10 (t(15) = 0.7982, p=0.4372, n = 5 for each group, post-hoc ttest2), and 30 (t(15) = 0.2052, p=0.8402, n = 6 vehicle and n = 11 for treated, post-hoc ttest2) days after treatment. *p≤0.05 **p≤0.01. ***p≤0.001.
Figure 7—figure supplement 1
ZnSO4 treatment impacts CSF outflow on the side contralateral to treatment.
(A) Sagittal view of the skull depicting direction of CSF flow and location of cisterna magna injection of EB. (B–E) Sagittal view of decalcified and cut skull of the ipsilateral side for imaging after EB injection in the cisterna magna, area indicated by black box in (A). (F–I) Contralateral side of ZnSO4 treatment. Scale bar 1 mm. (B, F) Vehicle control. (C, G) 2 days post-ZnSO4 treatment. (D, H) 10 days post-ZnSO4 treatment. (E, I) 30 days post-ZnSO4 treatment. (J) Comparison of all dye intensity curves of all vehicle (gray) and ZnSO4 treated (purple) animals for each treatment duration: 2 day, n = 3 vehicle and n = 5 treated. 10 day, n = 5 for each group. 30 day, n = 6 vehicle and n = 11 for treated. Means of the group plotted as thicker lines. (K–M) Mean is plotted as height of bar. Circles represent individual animals. (K) Mean center of mass of the dye intensity on the side contralateral to the treatment for vehicle- and zinc-treated animals after 2 (t(6) = −0.0290, p=0.9978, n = 3 vehicle and n = 5 treated, post-hoc ttest2), 10 (t(8) = 2.4522, p=0.0398, n = 5 for each group, post-hoc ttest2), and 30 (t(15) = 1.2746, p=0.2218, n = 6 vehicle and n = 11 for treated, post-hoc ttest2) days of treatment. (L) Mean dye peak location of the contralateral side plotted for vehicle- and zinc-treated animals after 2 (t(6) = 0.6881, p=0.5171, n = 3 vehicle and n = 5, post-hoc ttest2), 10 (t(8) = 2.4056, p=0.0428, n = 5 for each group, post-hoc ttest2), and 30 (t(15) = 3.4097, p=0.0039, n = 6 vehicle and n = 11 for treated, post-hoc ttest2) days of treatment. (M) Maximum dye peak value of the contralateral side plotted for vehicle and ZnSO4-treated animals after 2 (t(6) = −3.8517, p=0.0084, n = 3 vehicle and n = 5 treated, post-hoc ttest2), 10 (t(8) = 0.5298, p=0.6107, n = 5 for each group, post-hoc ttest2), and 30 (t(15) = −0.3148, p=0.7573, n = 6 vehicle and n = 11 for treated, post-hoc ttest2) days of treatment. *p≤0.05. **p≤0.01.
Figure 8
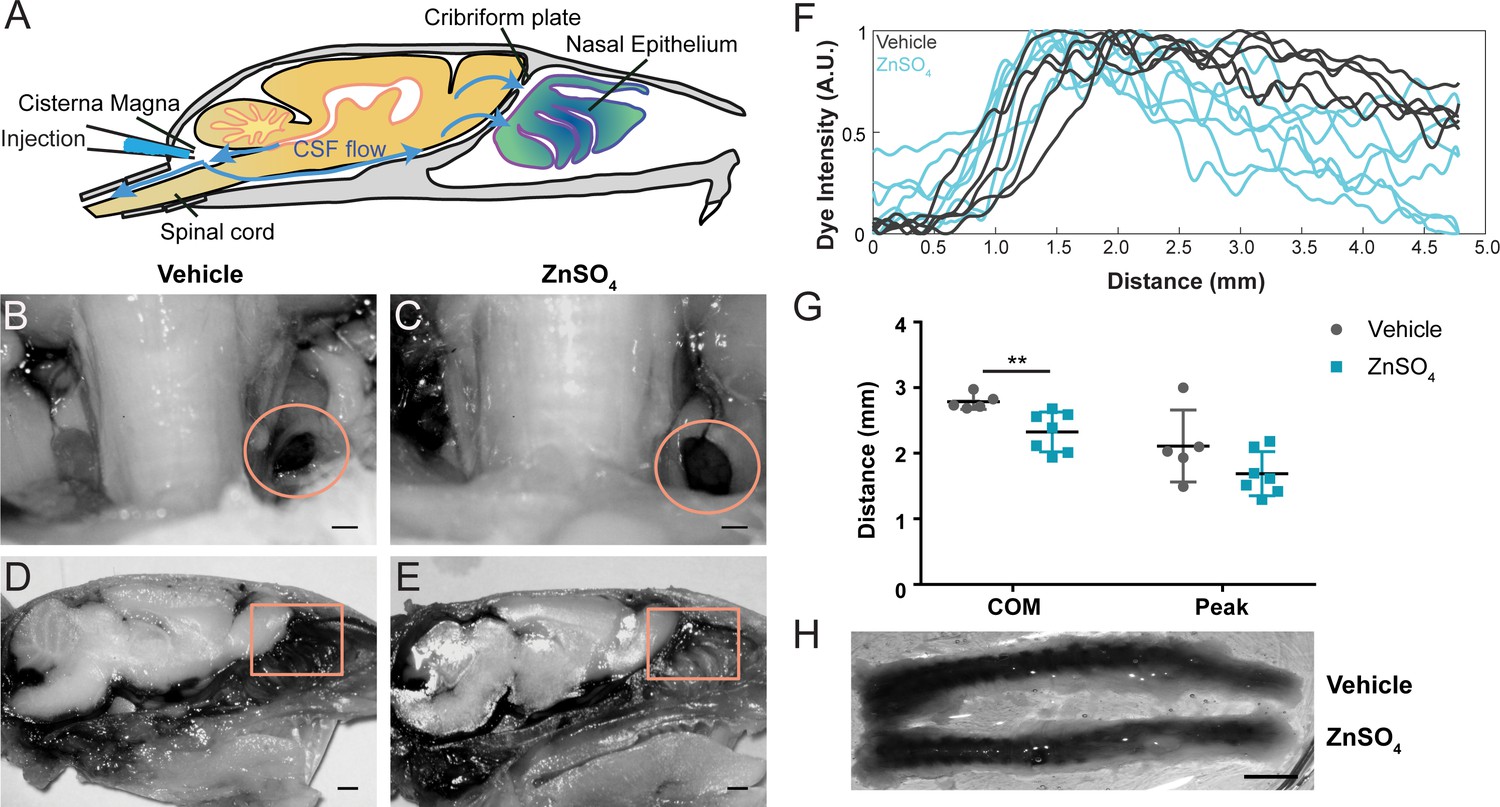
Longer-duration dye injections show ZnSO4 treatment blocks CSF flow across the cribriform plate.
(A) Sagittal view of the skull depicting direction of CSF flow and location of cisterna magna injection of EB. (B–C) Localization of EB dye in the deep cervical lymph nodes (orange circles) after a cisterna magna EB injection. Scale bar 500 µm. (B) Vehicle control. (C) 30 days after ZnSO4 treatment. (D–E) Sagittal view of decalcified and cut skull of the ipsilateral side for imaging after EB injection in the cisterna magna. ROI indicated by orange box. Scale bar 1 mm. (D) Vehicle control. (E) 30 days after ZnSO4 treatment. (F) Plot of the intensity of the Evans blue dye as a function rostral-caudal distance for vehicle (gray) and ZnSO4-treated (blue) groups 30 days after treatment. ROI indicated by orange box in (D–E). (G) Mean of the center of mass (t(10) = −3.2015, p=0.0095, n = 5 vehicle and n = 7 treated, post-hoc ttest2) and dye peak (t(10) = −1.6604, p=0.1278, n = 5 vehicle and n = 7 treated, post-hoc ttest2) location of the curve plotted for vehicle- and ZnSO4-treated animals 30 days after treatment. (H) Vehicle (top) and 30 days after ZnSO4 treatment (bottom) decalcified and SeeDB cleared spinal columns after cisterna magna EB injection. Scale bar 500 mm.
Figure 9
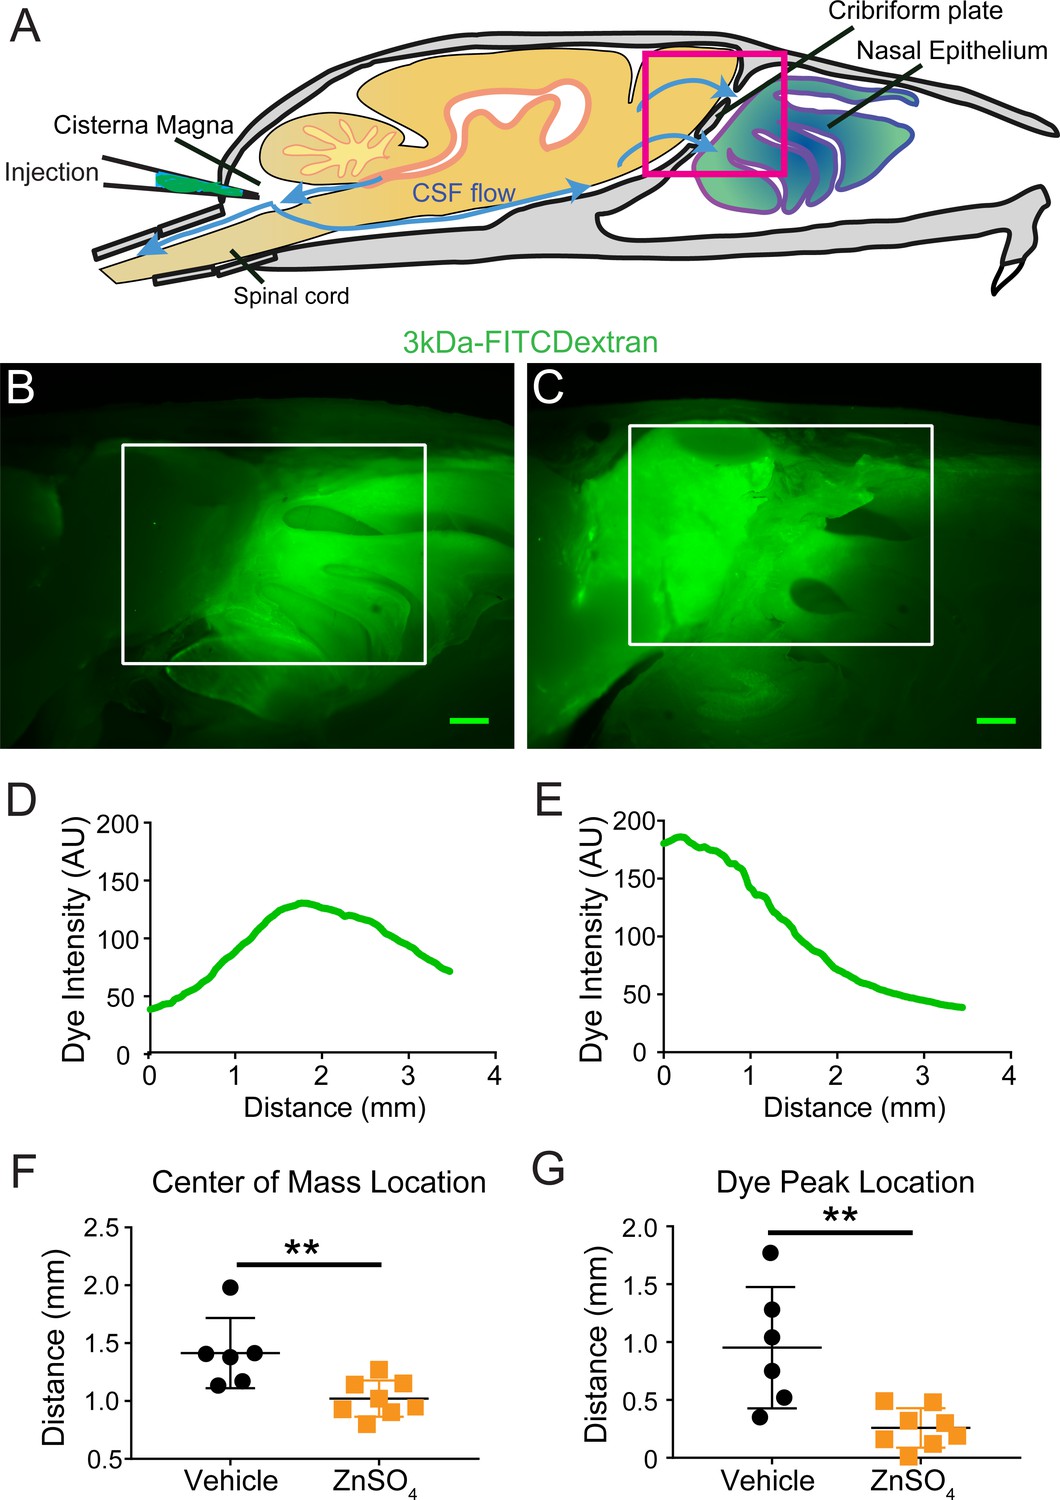
Visualization of effects of intranasal ZnSO4 treatment on CSF flow with 3kDa-FITC Dextran.
(A) Schematic of a sagittal view of the skull, depicting direction of CSF flow and location of cisterna magna injection of 3kDa-FITCDextran. (B–C) Sagittal view of decalcified and cut skull for imaging after FITC-dextran injection, area indicated by pink box in (A). Scale bar 500 µm. (B) Vehicle control. (C) 10 day ZnSO4 treated. (D–E) Plot of the intensity of the 3kDa-FITC Dextran dye as a function of rostral-caudal distance. (D) Vehicle control, ROI of area measured indicated by white box in (B). (E) 10 days after ZnSO4 treatment, ROI of area measured indicated by white box in (C). (F–G) Mean ± standard deviation plotted. Circles and squares represent means of individual animals. (F) Comparison of the center of mass location of the dye peak between the vehicle (black) and ZnSO4 (orange) treated groups (t(12) = −3.1805, p=0.0079, n = 6 vehicle and n = 8 treated, post-hoc ttest2). (G) Comparison of the location of the dye peak between the vehicle (black) and ZnSO4 (orange) treated groups (t(12) = −3.5384, p=0.0041, n = 6 vehicle and n = 8 treated, post-hoc ttest2). **p≤0.01. Note that the time between cisterna magna injection and sacrifice was different in the FITC-dextran and EB injections (35 vs. 20 min respectively) due to the different molecular weights of the dyes.
Figure 10
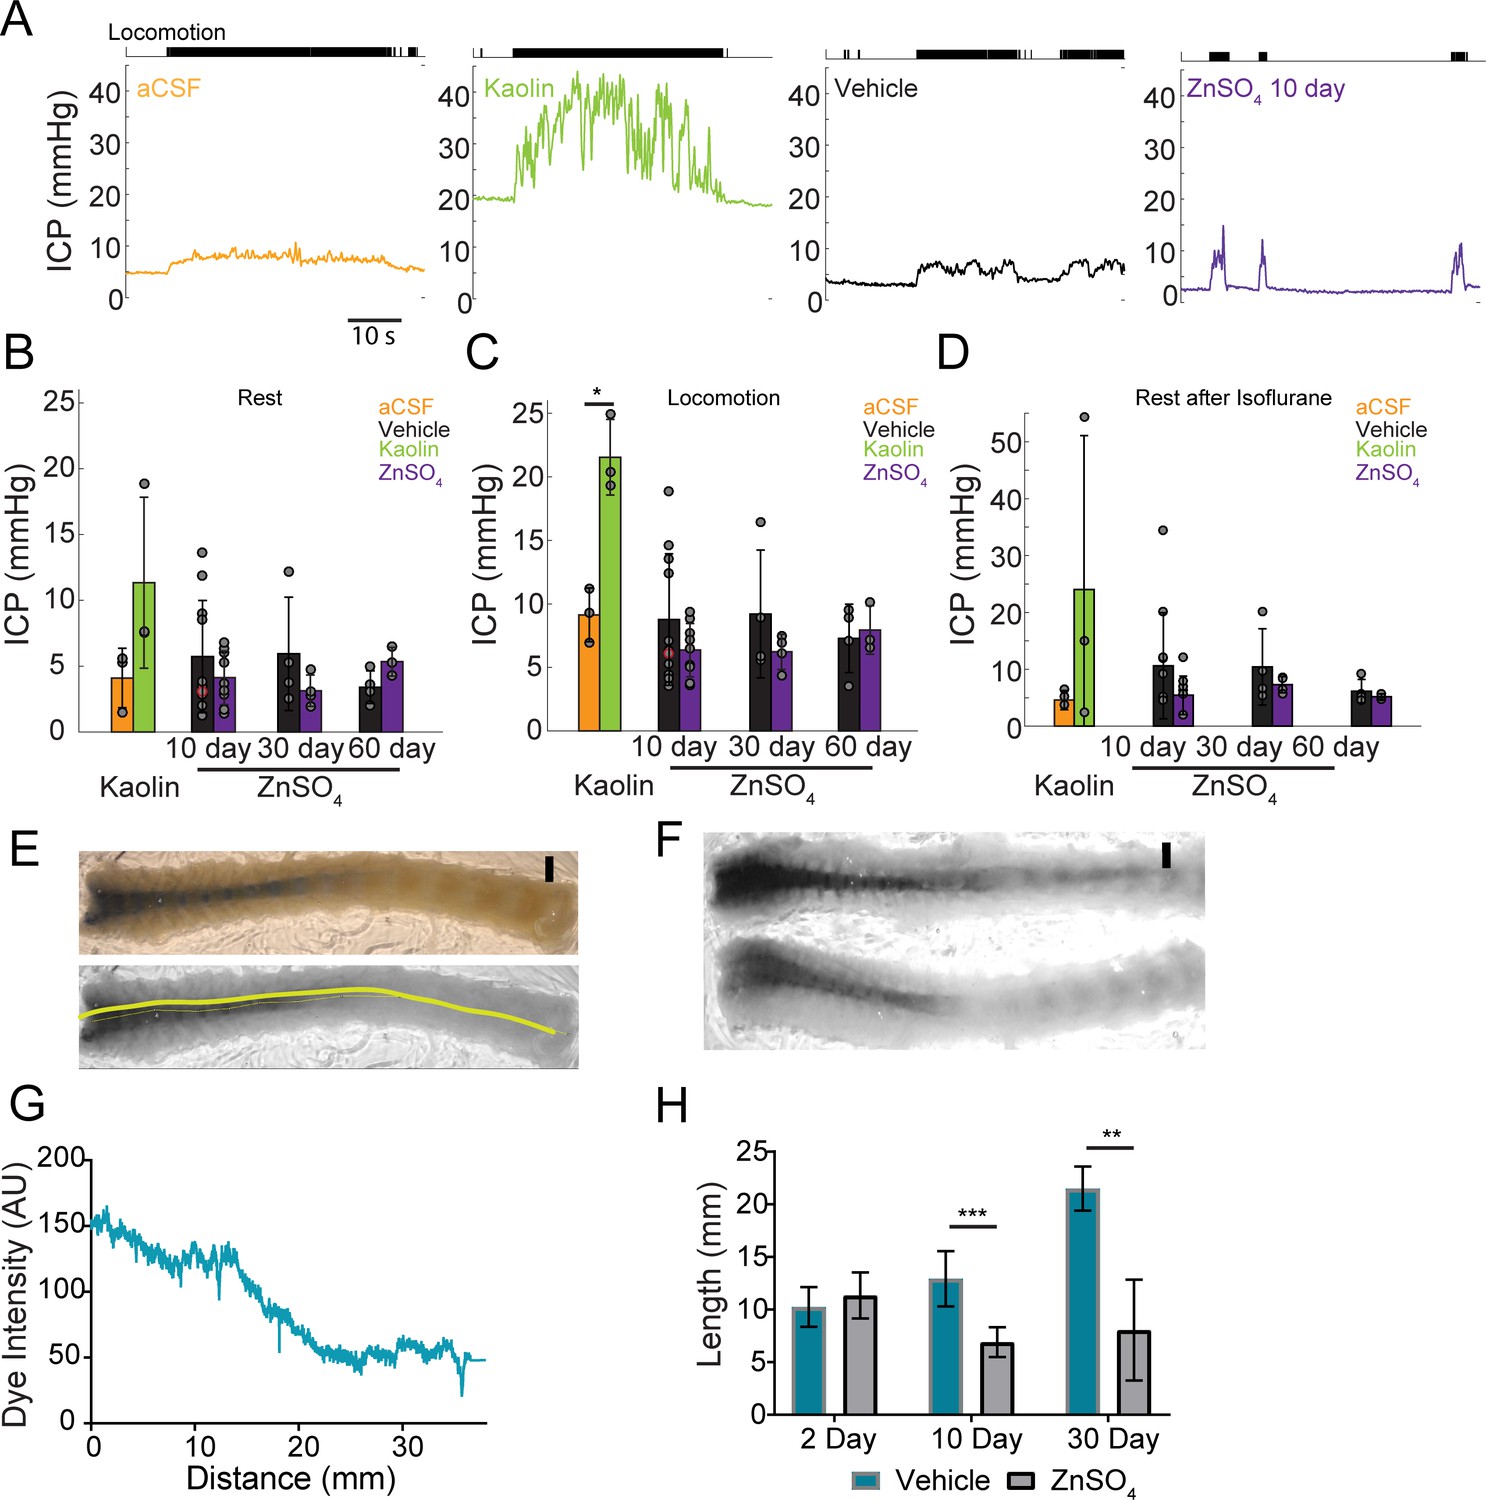
Intranasal ZnSO4 treatment does not affect ICP but decreases CSF movement down the spinal column.
(A) Left panel, example trace showing intracranial pressure (ICP) change during a locomotion bout in an animal that has been injected with aCSF in the cisterna magna. The ICP becomes elevated slightly over baseline when the animal moves, consistent with previous results (Gao and Drew, 2016). The tick marks in the upper panel indicates locomotion events, defined as times where the treadmill acceleration exceeds a thereshold (Huo et al., 2014). Subsequent panels show ICP change during locomotion in animals injected with Kaolin, vehicle control, or ZnSO4 treatment, respectively. (B–D) Mean ± standard deviation plotted. Circles represent individual animals. (B) Mean of each group of ICP during rest (1 hr after isoflurane) after kaolin injection (Kaolin) and 10, 30, and 60 days after treatment (ZnSO4). The orange shaded circle indicates the same animal showing in (A). (C) Same as (B) but for ICP during locomotion. Comparison of ICP during locomotion for aCSF and kaolin injected mice (t(4) = 5.88, p=0.0042, n = 3 for each group, ttest2). (D) Same as (B) but for stationary (resting) periods in the 2 min immediately after the cessation of isoflurane. (B–D) No statistically significant differences were observed between ZnSO4-treated and control animal at rest or during locomotion for all treatment durations (Table 2). (E) Top panel: A decalcified and SeeDB-cleared spinal column after a cisterna magna EB injection. Bottom panel: Red channel only displaying the trace (yellow line) used for quantifying pixel intensity. Scale bar 2 mm. (F) Vehicle (top) and 10 days after ZnSO4 treatment (bottom) decalcified and SeeDB cleared spinal columns after cisterna magna EB injection. (G) Trace obtained and graphed to display dye intensity of EB along the spinal column (distance) quantified after cisterna magna injections. (H) Comparisons of the distance of dye movement along the spinal column after an EB cisterna magna injection in mice intranasally treated with vehicle or ZnSO4, 2 (t(5) = 0.6921, p=0.5197, n = 3 vehicle and n = 4 treated, ttest2), 10 (t(12) = 5.069, p=0.00028, n = 8 vehicle and n = 6 treated, ttest2), and 30 days (t(9) = 4.571, p=0.00134, n = 3 vehicle and n = 8 treated, ttest2), after treatment. Mean ± standard deviation plotted. *p≤0.05 **p≤0.01 ***p≤0.001.
Tables
Table 1
Two-way ANOVA statistics for all Evans blue cisterna magna injections.
d.o.f. = degrees of freedom. CoM = center of mass, PL = peak location, PV = peak value. All significant p values are bolded (p≤0.05).
| Evans blue drainage | |||||
|---|---|---|---|---|---|
| F | d.o.f. | P | Side | Parameters | Parameters |
| 5.45 | 2 | 0.0086 | IPSI | CoM | Interaction: duration * type |
| 0.49 | 2 | 0.6144 | IPSI | PL | Interaction: duration * type |
| 0.61 | 2 | 0.5494 | IPSI | PV | Interaction: duration * type |
| 11.05 | 2 | 0.0002 | IPSI | CoM | effect: duration |
| 13.16 | 1 | 0.0009 | IPSI | CoM | effect: type |
| 3.63 | 2 | 0.0365 | IPSI | PL | effect: duration |
| 13.72 | 1 | 0.0007 | IPSI | PL | effect: type |
| 5.27 | 2 | 0.0098 | IPSI | PV | effect: duration |
| 0 | 1 | 0.9497 | IPSI | PV | effect: type |
| 1.06 | 2 | 0.3601 | CONTRA | CoM | Interaction: duration * type |
| 2.08 | 2 | 0.1435 | CONTRA | PL | Interaction: duration * type |
| 0.79 | 2 | 0.4645 | CONTRA | PV | Interaction: duration * type |
| 2.93 | 2 | 0.0694 | CONTRA | CoM | effect: duration |
| 3.84 | 1 | 0.0596 | CONTRA | CoM | effect: type |
| 4.19 | 2 | 0.0253 | CONTRA | PL | effect: duration |
| 10.64 | 1 | 0.0028 | CONTRA | PL | effect: type |
| 0.73 | 2 | 0.49 | CONTRA | PV | effect: duration |
| 0.67 | 1 | 0.4188 | CONTRA | PV | effect: type |
Table 2
Mixed model ANOVA statistics for intracranial pressure (ICP) measurements.
For each time point, statistics were calculated for the comparison of the vehicle and treated animal groups. d.o.f. = degrees of freedom.
| Mixed model ANOVA vehicle vs. ZnSO4 treated | ||||||
|---|---|---|---|---|---|---|
| N(vehicle) | N(treated) | Effect | F | d.o.f. | P | |
| 10 day | 11 | 10 | treatment | 1.26 | 37 | 0.268 |
| locomotion | 7.95 | 0.0077 | ||||
| isoflurane | 3.38 | 0.0827 | ||||
| 30 day | 4 | 4 | treatment | 3.3 | 13 | 0.0922 |
| locomotion | 7.32 | 0.018 | ||||
| isoflurane | 0.57 | 0.4786 | ||||
| 60 day | 4 | 3 | treatment | 1.7 | 11 | 0.2183 |
| locomotion | 11.47 | 0.0061 | ||||
| isoflurane | 0.58 | 0.4812 | ||||
Key resources table
| Reagent type (species) or resource | Designation | Source or reference | Identifiers | Additional information |
|---|---|---|---|---|
| Strain, strain background (M. musculus) | Strain: C57BL/6J | Jackson Laboratory | Stock No: 000664; RRID:IMSR_JAX:000664 | |
| Strain, strain background (M. musculus) | Strain: LYVE1Cre.GFP | Jackson Laboratory | Stock No: 012601; RRID:IMSR_JAX:012601 | |
| Strain, strain background (M. musculus) | Strain: Ai6 (RCL-ZsGreen) | Jackson Laboratory | Stock No: 007906; RRID:IMSR_JAX:007906 | |
| Strain, strain background (M. musculus) | Strain: Ai14 (RCL-tdT)-D | Jackson Laboratory | Stock No: 007914; RRID:IMSR_JAX:007914 | |
| Strain, strain background (M. musculus) | Strain: Swiss Webster (CFW) | Charles River | Strain Code: 024; RRID:IMSR_CRL:24 | |
| Antibody | Rabbit polyclonal anti-Aquaporin 1 | Santa Cruz Biotechnology | Cat# sc-20810; RRID:AB_2056824 | IF (1:250) |
| Antibody | Mouse monoclonal anti-Aquaporin 1 | Santa Cruz Biotechnology | Cat# sc-25287; RRID:AB_626694 | IF (1:250) |
| Antibody | Goat polyclonal anti-Aquaporin 2 | Santa Cruz Biotechnology | Cat# sc-9882; RRID:AB_2289903 | IF (1:250) |
| Antibody | Goat polyclonal anti-Aquaporin 3 | Santa Cruz Biotechnology | Cat# sc-9885; RRID:AB_2227514 | IF (1:250) |
| Antibody | Mouse monoclonal anti-Aquaporin 4 | Santa Cruz Biotechnology | Cat# sc-32739; RRID:AB_626695 | IF (1:250) |
| Antibody | Rabbit polyclonal anti-Aquaporin 5 | Santa Cruz Biotechnology | Cat# sc-28628; RRID:AB_2059871 | IF (1:250) |
| Antibody | Rat monoclonal anti-CD31 | Santa Cruz Biotechnology | Cat# sc-18916; RRID:AB_627028 | IF (1:250) |
| Antibody | Mouse monoclonal anti-CD164 | Santa Cruz Biotechnology | Cat# sc-271179; RRID:AB_10613973 | IF (1:250) |
| Antibody | Mouse monoclonal anti-Oligo1 | Santa Cruz Biotechnology | Cat# sc-166257; RRID:AB_2157524 | IF (1:250) |
| Antibody | Mouse monoclonal anti-Vimentin | Santa Cruz Biotechnology | Cat# sc-373717; RRID:AB_10917747 | IF (1:250) |
| Antibody | Rabbit polyclonal anti-GFAP | Abcam | Cat# ab7260; RRID:AB_10917747 | IF (1:500) |
| Antibody | Rabbit polyclonal anti-MRC1 | Abcam | Cat# ab64693; RRID:AB_1523910 | IF (1:500) |
| Antibody | Goat polyclonal anti-OMP | WAKO | Cat# 544–10001-WAKO; RRID:AB_664696 | IF (1:500) |
| Antibody | Mouse monoclonal anti-NeuN | Millipore | Cat# MAB377; RRID:AB_2298772 | IF (1:250) |
| Chemical compound, drug | DiI | Invitrogen | Cat# D282 | |
| Chemical compound, drug | Rhodamine Phalloidin | Invitrogen | Cat# R415 | (1:1000) |
| Chemical compound, drug | Albumin–fluorescein isothiocyanate conjugate (FITC-albumin) | Sigma | Cat# A9771 | |
| Chemical compound, drug | Formic Acid | Sigma | Cat# F0507 | |
| Chemical compound, drug | Fructose | Sigma | Cat# F0127 | |
| Chemical compound, drug | Kaolin | Sigma | Cat# K7375 | |
| Chemical compound, drug | α-thioglycerol | Sigma | Cat# M1753 | |
| Chemical compound, drug | Dextran, Fluorescein,3000 MW, Anionic, Lysine Fixable (3kDa-FITCDextran) | ThermoFisher Scientific | Cat# D3306 | |
| Chemical compound, drug | Zinc Sulfate (ZnSO4) | ThermoFisher Scientific | Cat# AC389802500 | |
| Chemical compound, drug | aCSF | Tocris Bioscience | Cat# 3525 | |
| Software, algorithm | Wheel Manager Software | MedAssociates | RRID:SCR_014296 |
Additional files
-
Transparent reporting form
- https://doi.org/10.7554/eLife.44278.022
Download links
A two-part list of links to download the article, or parts of the article, in various formats.
Downloads (link to download the article as PDF)
Open citations (links to open the citations from this article in various online reference manager services)
Cite this article (links to download the citations from this article in formats compatible with various reference manager tools)
Anatomical basis and physiological role of cerebrospinal fluid transport through the murine cribriform plate
eLife 8:e44278.
https://doi.org/10.7554/eLife.44278


