Plant–necrotroph co-transcriptome networks illuminate a metabolic battlefield
- Kansas State University, United States
- University of California, Davis, United States
- University of Colorado, United States
- University of Copenhagen, Denmark
Figures
Figure 1
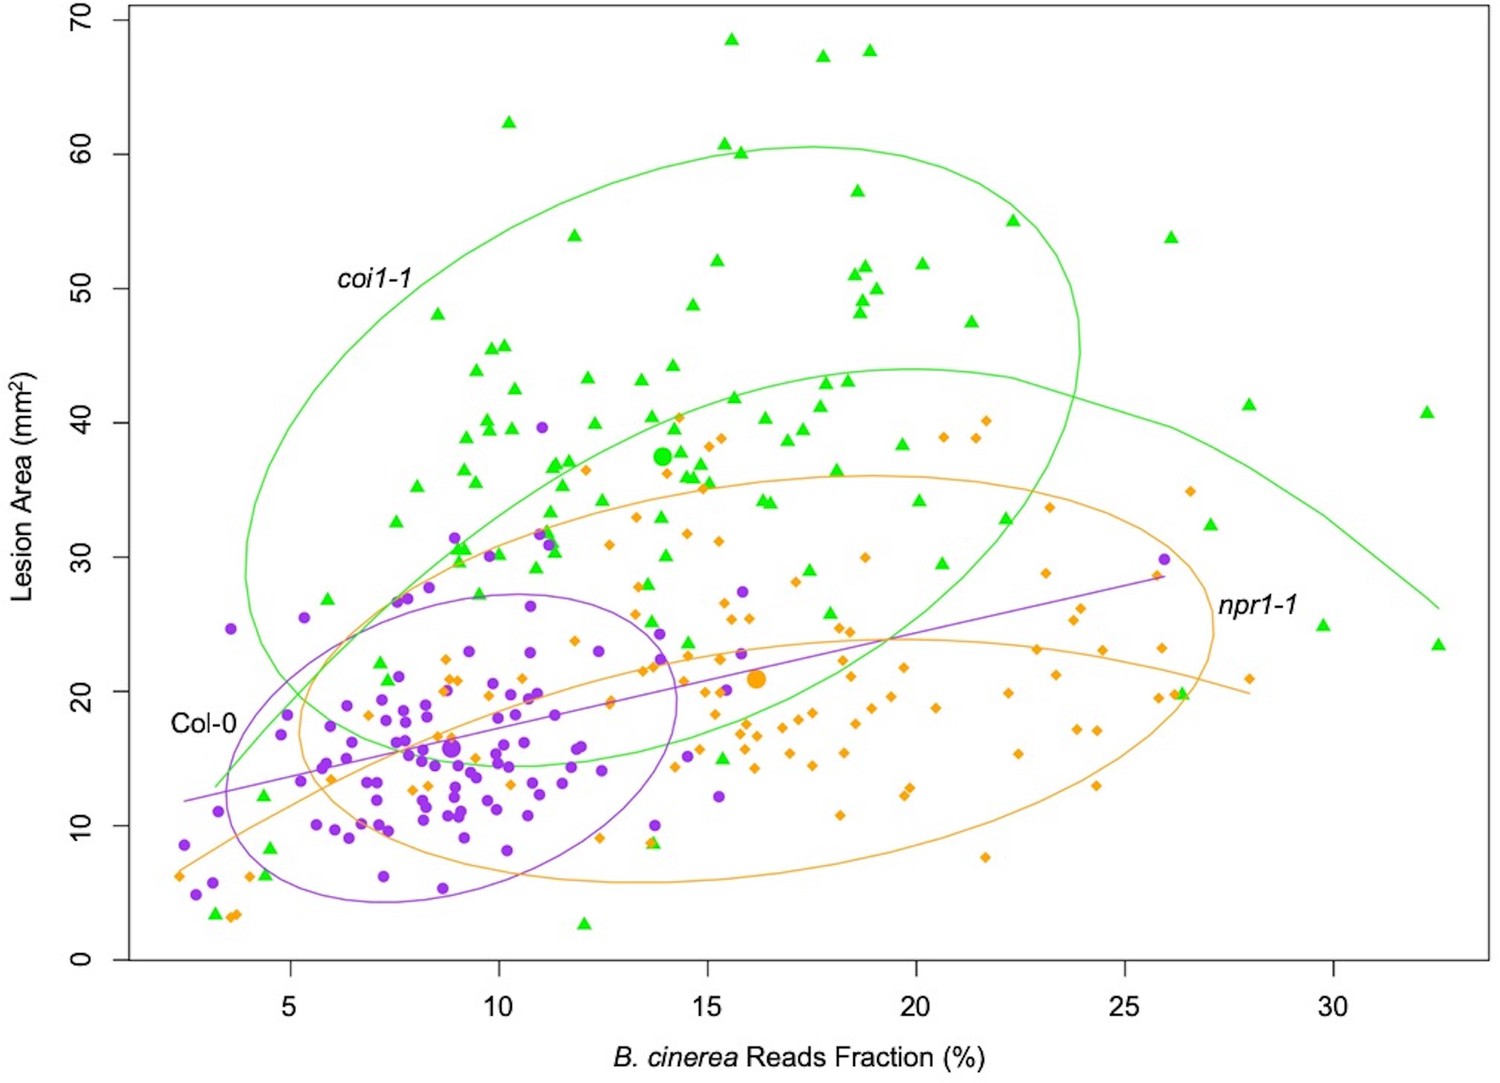
Correlation between earlier estimated B. cinerea biomass and later lesion area.
Model-corrected lesion area means were estimated using the linear model on the six replicates data from three Arabidopsis genotypes at 72 hr post-infection with 96 B. cinerea isolates. Estimated biomass of B. cinerea was calculated using the linear model-corrected fraction of B. cinerea mapped reads against total mapped reads to Arabidopsis and B. cinerea reference genomes. RNA-Seq analysis was conducted at 16 hr post-infection for each pathosystem. Three Arabidopsis genotypes are wild-type Col-0 (purple dot), jasmonate insensitive mutant coi1-1 (green triangle), and salicylic acid insensitive mutant npr1-1 (orange diamond). The 90% confidence ellipse intervals are plotted for each Arabidopsis genotype for references. Quadratic regression lines are: Col-0: y = −0.00059×2+0.729 x+10.037, p=0.0016, adjusted R2 = 0.1101; coi1-1: y = −0.117×2+4.44 x – 0.1585, p=3.914e-07, adjusted R2 = 0.2562; npr1-1: y = −0.0579×2+2.26 x+1.673, p=0.0001, adjusted R2 = 0.161.
-
Figure 1—source data 1
Model-corrected means of estimated B. cinerea biomass.
B. cinerea biomass of 96 isolates infection on Arabidopsis genotypes was estimated using the fraction of uniquely mapped reads against B05.10 reference genome. Three Arabidopsis genotypes are wild-type Col-0, jasmonate insensitive mutant coi1-1, and salicylic acid insensitive mutant npr1-1.
- https://doi.org/10.7554/eLife.44279.004
Figure 2
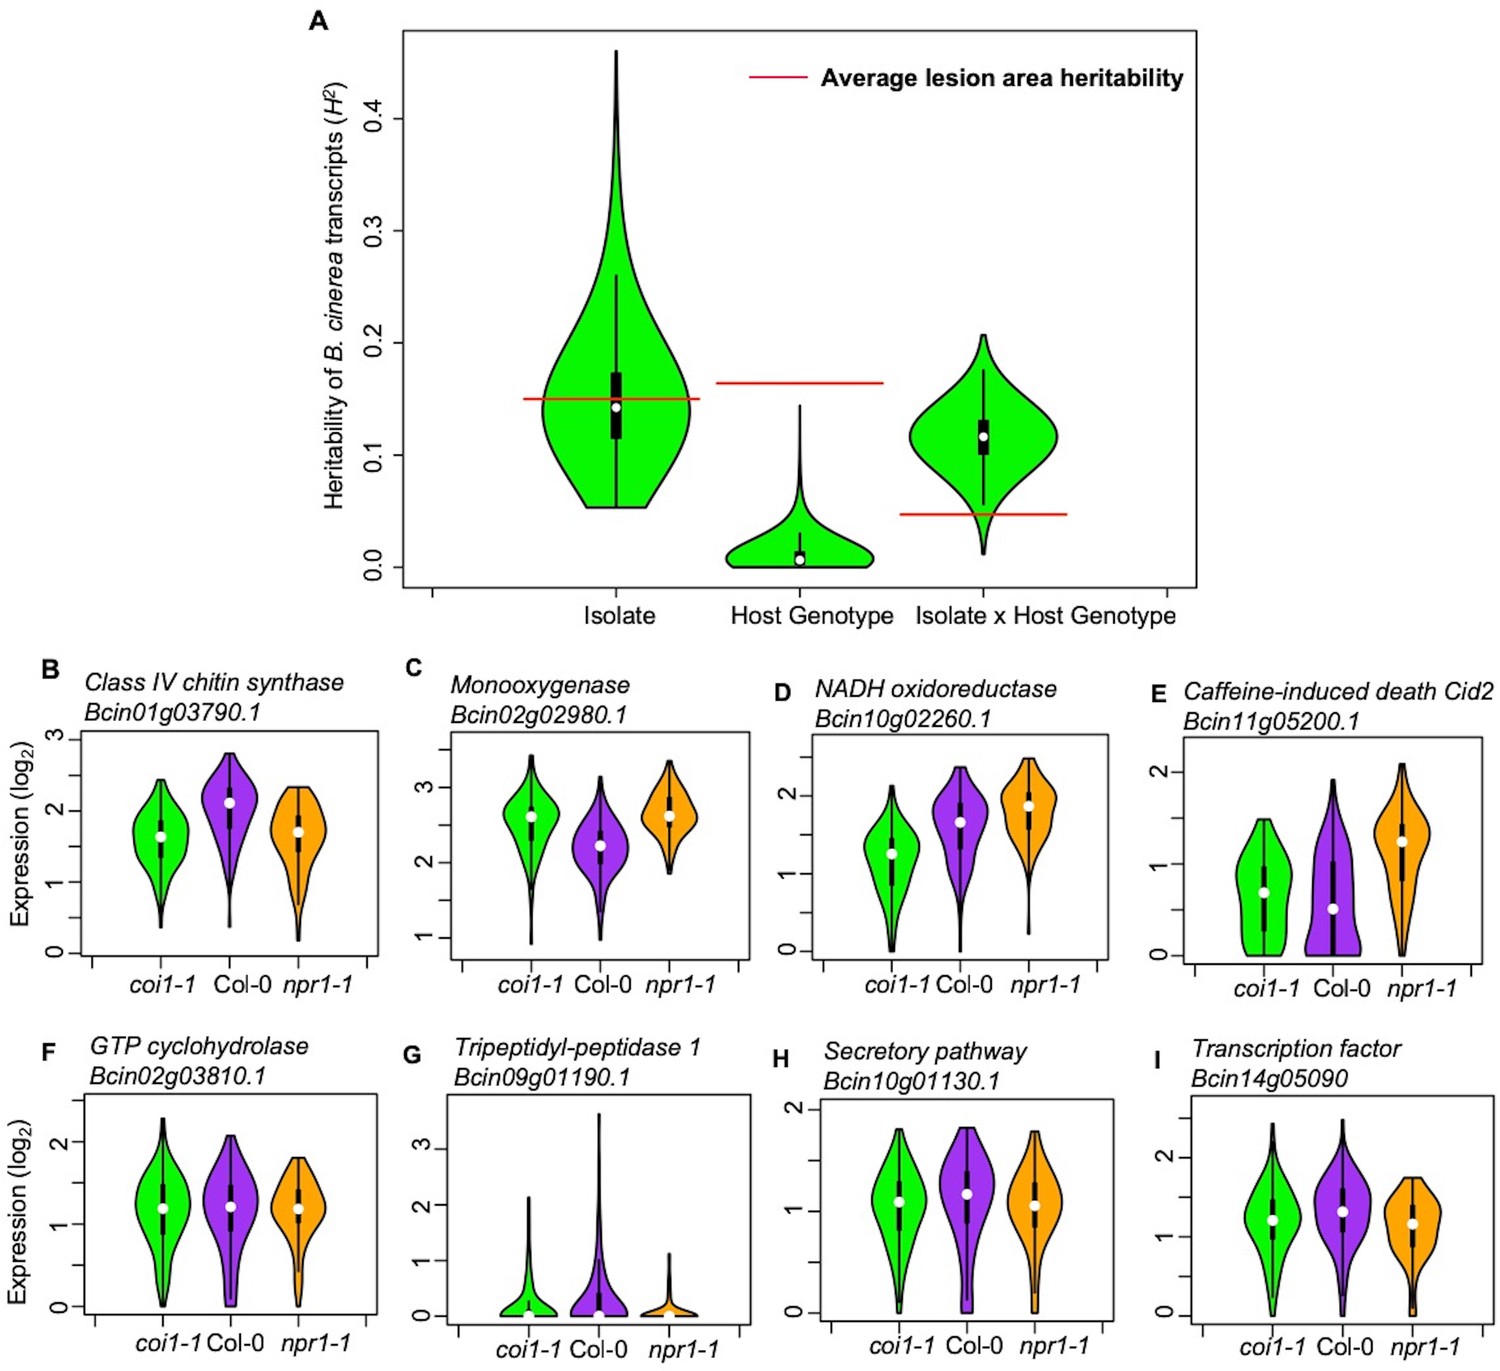
Transcriptomic responses of B. cinerea on Arabidopsis are controlled by genetic variation in pathogen population, host genotypes, and their interaction.
(A) Distribution of broad-sense heritability (H2) of B. cinerea transcripts contributed by genetic variation in the B. cinerea, Arabidopsis genotypes, and the interaction between pathogen and host. Violin plots illustrating the distribution of H2 for transcripts from 96 B. cinerea isolates infecting on Arabidopsis genotypes. Heritability is partitioned across the different sources, 96 pathogen genotypes = ‘Isolate’, plant genotypes Col-0, coi1-1 and npr1-1 plant genotypes = ‘Host’, and the corresponding interaction. The transcriptomic analysis was conducted by sequencing mRNA extracted from B. cinerea infected Arabidopsis leaves at 16 hr post-infection. Red lines indicate the average broad-sense heritability values of lesion area caused by isolates, Arabidopsis genotypes, and their interaction. (B) to (E) Expression profiles of B. cinerea transcripts significantly influenced by host genotypes. The model-corrected means (log2) for B. cinerea transcript were used for plotting. The Arabidopsis genotypes, wild-type Col-0 (purple), jasmonate insensitive mutant coi1-1 (green), and salicylic acid mutant npr1-1 (orange), are shown on the x axis. B. cinerea transcripts are: (B) Bcin01g03790.1, class IV chitin synthase; (C) Bcin02g02980.1, Monooxygenase; (D) Bcin10g02260.1, NADH oxidoreductase; (E) Bcin11g05200.1, caffeine-induced death Cid2; (F) to (I) Expression profiles of B. cinerea transcripts significantly influenced by the interaction between pathogen and host genotypes. (F) Bcin02g03810.1, GTP cyclohydrolase; (G) Bcin09g01190.1, Tripeptidyl-peptidase 1; (H) Bcin10g01130.1, in secretory pathway; (I) Bcin14g05090.1, a transcription factor.
-
Figure 2—source data 1
Model-corrected means of B. cinerea transcripts.
A table of model-corrected least-square means of B. cinerea transcripts from 96 isolates infection on Arabidopsis wild-type Col-0, jasmonate insensitive mutant coi1-1, and salicylic acid insensitive mutant npr1-1.
- https://doi.org/10.7554/eLife.44279.006
-
Figure 2—source data 2
Standard errors of B. cinerea transcripts.
A table of model-corrected standard errors of B. cinerea transcripts infection on Arabidopsis wild-type Col-0, jasmonate insensitive mutant coi1-1, and salicylic acid insensitive mutant npr1-1.
- https://doi.org/10.7554/eLife.44279.007
-
Figure 2—source data 3
GLM deviance tables and broad-sense heritability of B. cinerea transcripts.
Summary of deviance tables derived from generalized linear model and estimated broad-sense heritability (H2) for B. cinerea transcripts. All significance values are corrected by false discovery rate.
- https://doi.org/10.7554/eLife.44279.008
-
Figure 2—source data 4
Top 100 heritability of B. cinerea transcripts.
Broad-sense heritability (H2) of individual B. cinerea transcript contributed by pathogen, host and their interaction were estimated. Three Arabidopsis genotypes are wild-type Col-0, jasmonate insensitive mutant coi1-1, and salicylic acid insensitive mutant npr1-1.
- https://doi.org/10.7554/eLife.44279.009
Figure 3 with 1 supplement
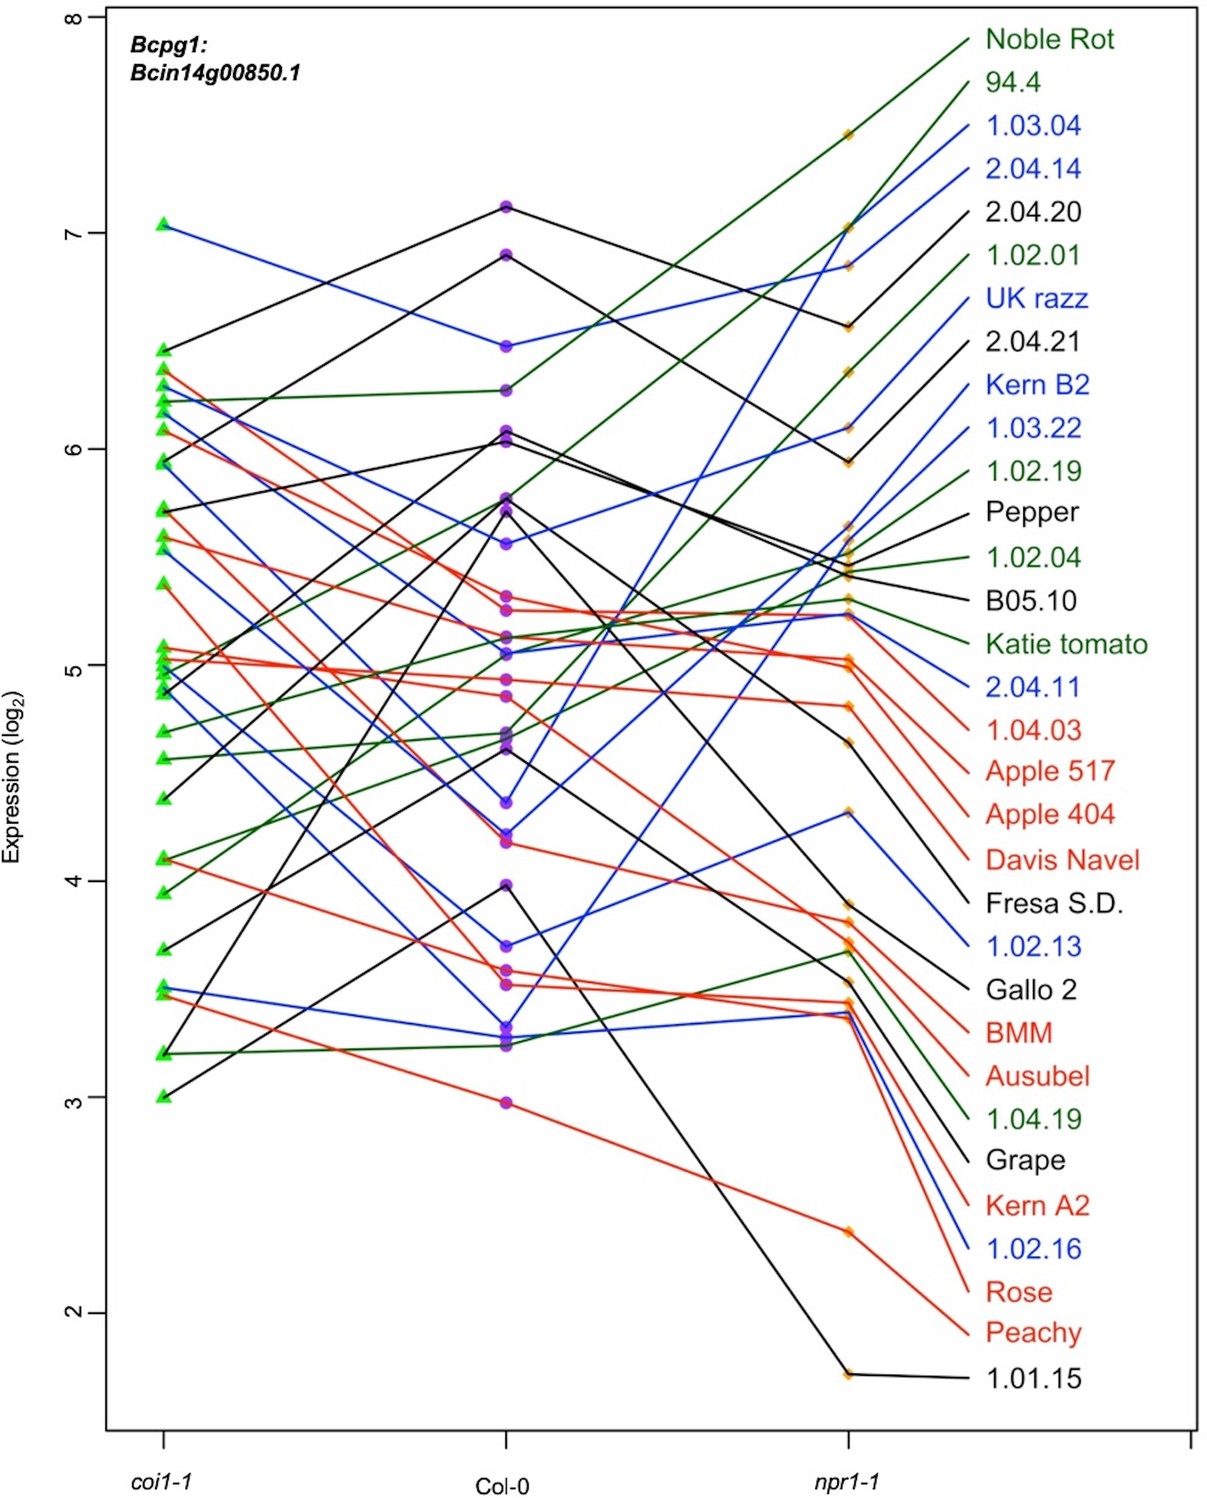
Expression profiles of an endopolygalacturonase gene Bcpg1 from diverse B. cinerea isolates across Arabidopsis genotypes.
Rank plot shows the relationship of Bcpg1 expression from 32 diverse B. cinerea isolates (right) across three Arabidopsis genotypes (x axis). Three Arabidopsis genotypes are wild-type Col-0 (purple dot), jasmonate insensitive mutant coi1-1 (green triangle), and salicylic acid mutant npr1-1 (orange diamond). The model-corrected means (log2) for the transcript of Bcpg1 (Bcin14g00850.1) encoding an endopolygalacturonase gene are utilized for plotting. The transcript expression levels from the same isolate across three Arabidopsis genotypes are connected with a colored line. The names of 32 isolates are represented with the same colored lines as induced Bcpg1 expression levels. Black lines indicate the expression levels of Bcpg1 are higher in coi1-1 and npr1-1 than in Col-0. Red lines indicate the higher expression levels of Bcpg1 in coi1-1 but lower in npr1-1. Blue lines indicate the highest expression levels of Bcpg1 are in Col-0. Dark green lines indicate the higher expression levels of Bcpg1 in npr1-1 but lower in coi1-1.
-
Figure 3—source data 1
Spearman’s rank correlation between lesion area and B. cinerea transcripts abundance.
A table of spearman’s rank correlation coefficiency between lesion area and B. cinerea transcripts accumulation across three Arabidopsis genotypes or under individual genotypes. Three Arabidopsis genotypes are wild-type Col-0, jasmonate insensitive mutant coi1-1, and salicylic acid insensitive mutant npr1-1.
- https://doi.org/10.7554/eLife.44279.012
Figure 3—figure supplement 1
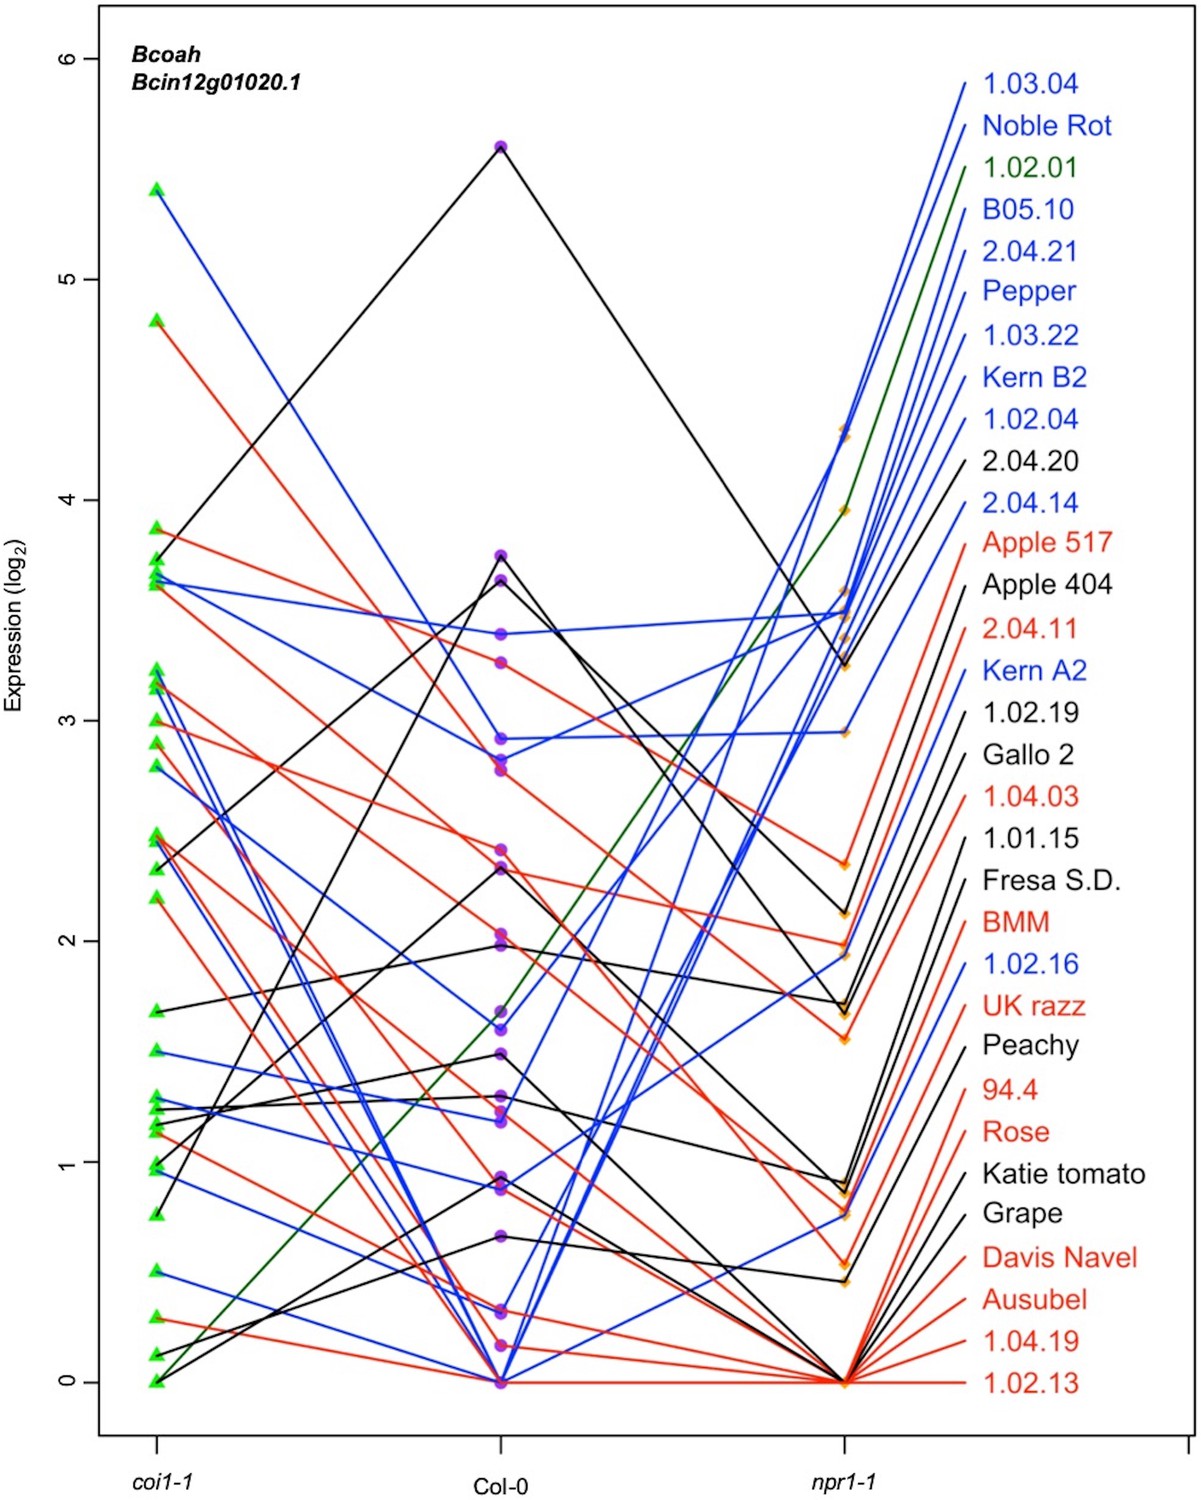
Expression profiles of an oxaloacetate hydrolase gene Bcoah from diverse B. cinerea isolates across Arabidopsis genotypes.
Rank plot shows the relationship of Bcoah expression from 32 diverse B. cinerea isolates (right) across three Arabidopsis genotypes (x axis). Three Arabidopsis genotypes are wild-type Col-0 (purple dot), jasmonate insensitive mutant coi1-1 (green triangle), and salicylic acid mutant npr1-1 (orange diamond). The model-corrected means (log2) for the transcript of Bcoah (Bcin12g01020.1) encoding an oxaloacetate hydrolase gene are utilized for plotting. The transcript expression levels from the same isolate across three Arabidopsis genotypes are connected with a colored line. The names of 32 isolates are represented with the same colored lines as induced Bcoah expression levels. Black lines indicate the expression levels of Bcoah are higher in coi1-1 and npr1-1 than in Col-0. Red lines indicate the higher expression levels of Bcoah in coi1-1 but lower in npr1-1. Blue lines indicate the highest expression levels of Bcoah are in Col-0. Dark green lines indicate the higher expression levels of Bcoah in npr1-1 but lower in coi1-1.
Figure 4
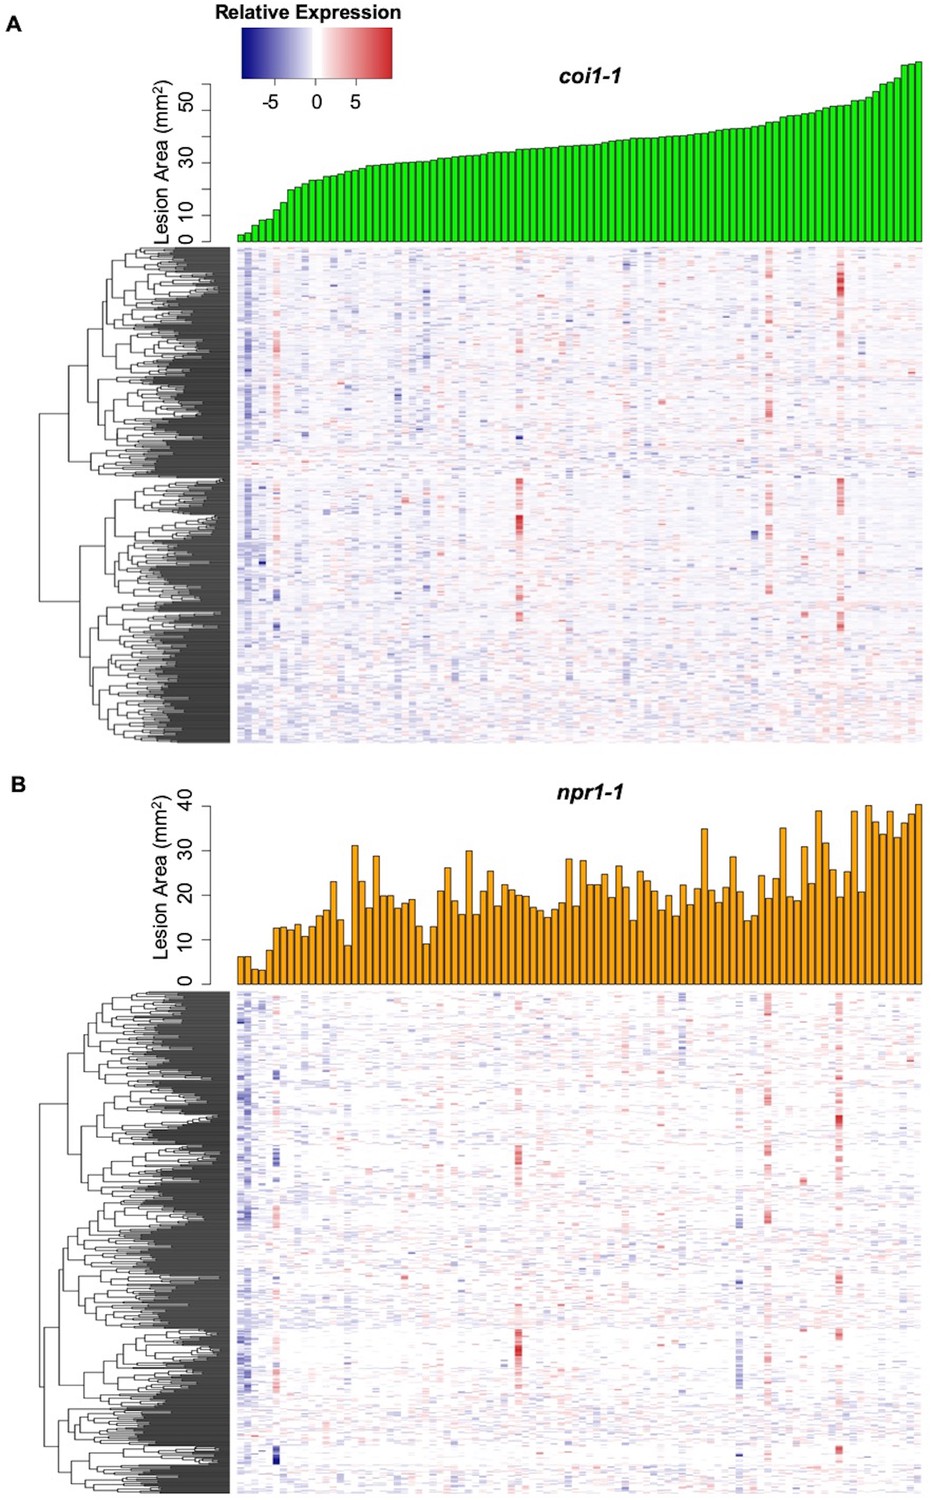
Interaction effects of host genotypes and pathogen isolates on B. cinerea transcriptome.
Hierarchical clustering of relative expression of 500 genes from 96 B. cinerea isolates infection on Arabidopsis mutants coi1-1 (A) or npr1-1 (B) are plotted based on pairwise comparison of pathogen gene expression under Col-0. The 500 B. cinerea genes with highest broad-sense heritability (H2) of host X pathogen were used for analysis. Lesion area induced by 96 isolates are compared under coi1-1 (green bar plot) and npr1-1 (orange bar plot).
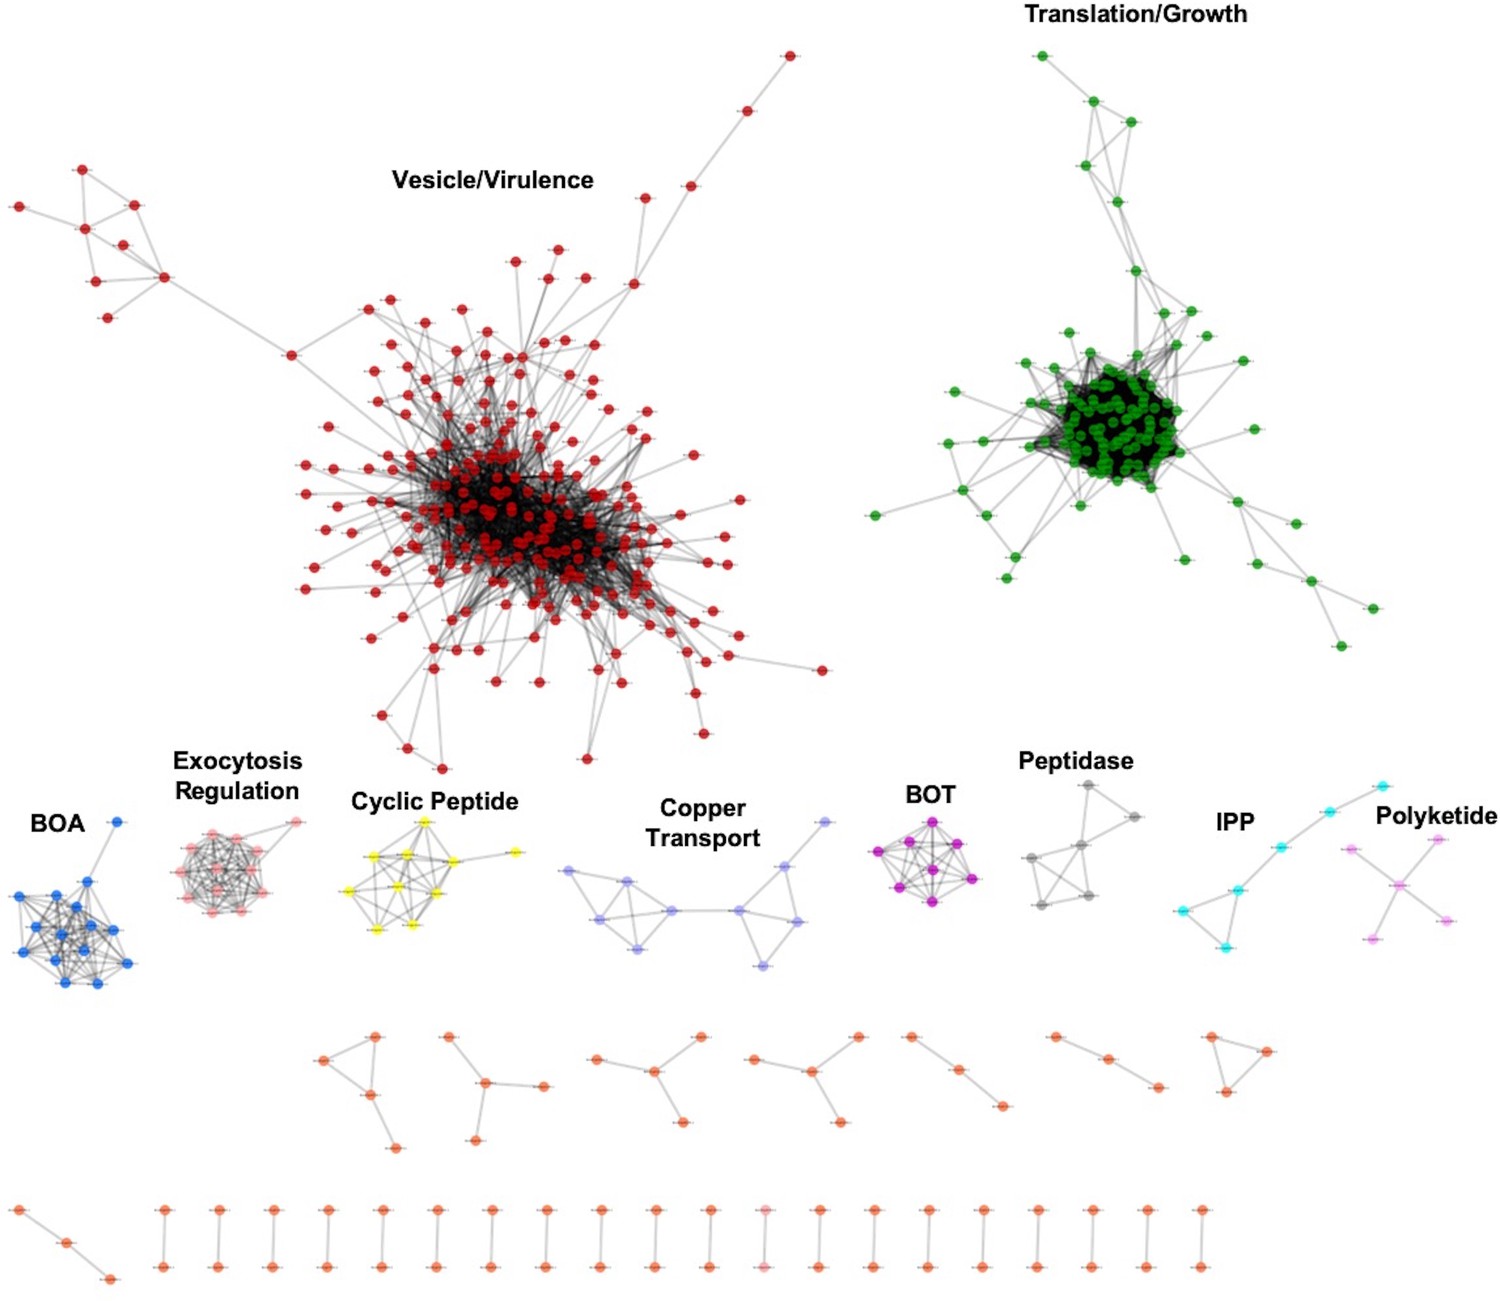
Figure 5 with 1 supplement

Gene co-expression networks identified from B. cinerea transcriptomic responses to Arabidopsis wild-type Col-0 immunity.
Ten gene co-expression networks (GCNs) with more than five nodes were identified from 96 B. cinerea isolates infecting on Arabidopsis wild-type Col-0. The similarity matrix is computed using Spearman’s rank correlation coefficient. Nodes with different colors represent B. cinerea genes condensed in GCNs with different biological functions. Edges represent the Spearman’s rank correlation coefficients between gene pairs. Trans- and cis-GCNs means GCNs are regulated by trans- and cis-regulatory elements, respectively. GCNs were named after their biological functions, which were determined by hub and bottleneck genes within each network. GCNs are: vesicle/virulence (red), translation/growth (green), exocytosis regulation (pink), cyclic peptide (yellow), peptidase (gray), isopentenyl pyrophosphate (IPP, turquoise), polyketide (violet), botcinic acid (BOA, blue), copper transport (slate blue), botrydial (BOT, purple).
-
Figure 5—source data 1
Gene list of B. cinerea gene co-expression networks.
Tables of B. cinerea genes identified by B. cinerea gene co-expression networks (GCNs) during 96 isolates infection on Arabidopsis wild-type Col-0, jasmonate insensitive mutant coi1-1, and salicylic acid insensitive mutant npr1-1.
- https://doi.org/10.7554/eLife.44279.016
Figure 5—figure supplement 1
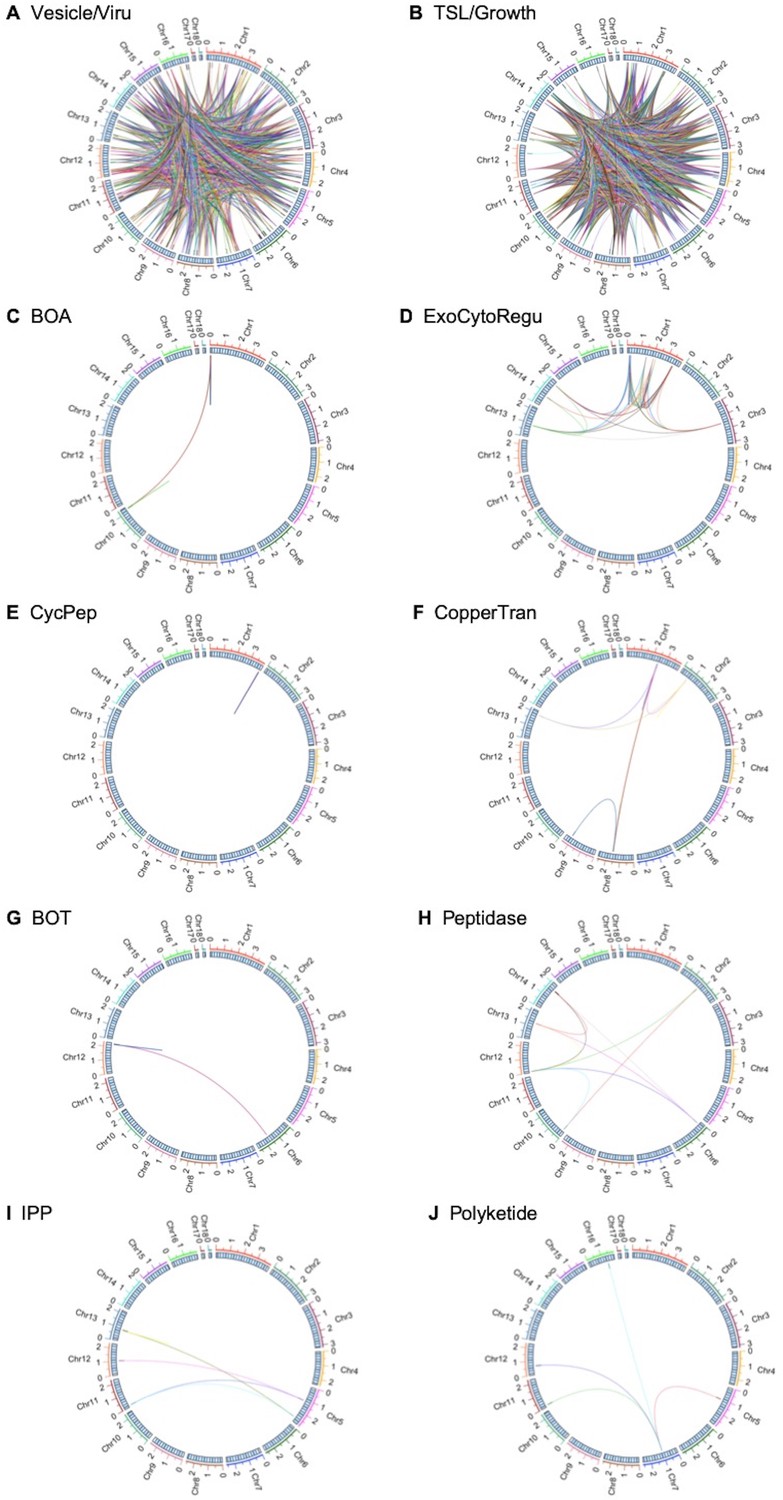
Genomic location of B. cinerea gene co-expression networks.
The circle diagrams showed the genome-wide distribution of gene pairs identified by B. cinerea gene co-expression networks (GCNs) under Arabidopsis wild-type Col-0. (A) to (J) Genomic locations of gene pairs identified by GCNs: (A) Vesicle/virulence, (B) translation/growth, (C) botcinic acid (BOA), (D) exocytosis regulation, (E) cyclic peptide, (F) copper transport, (G) botrydial (BOT), (H) peptidase (gray), (I) isopentenyl pyrophosphate (IPP), (G) polyketide. The rings show 18 B. cinerea chromosomes on a Mb scale. Genomic locations of co-expressed gene pairs are connected by the colored lines.
Figure 6
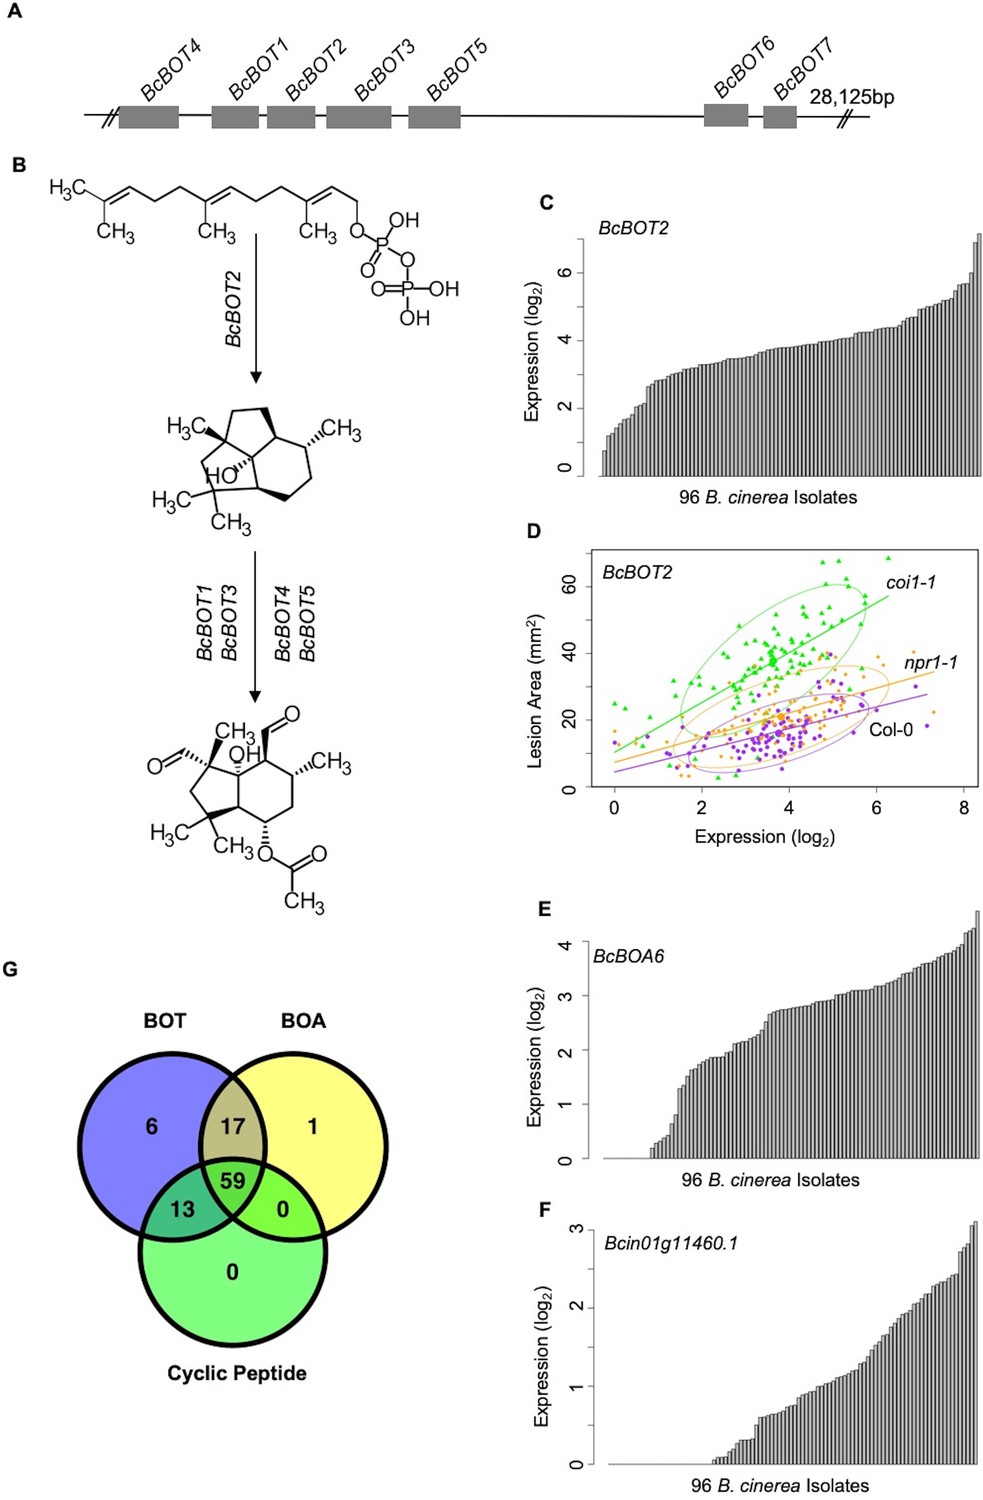
Variation of transcripts accumulation for secondary metabolites production across diverse B. cinerea isolates.
Expression profiles of genes responsible for botrydial, botcinic acid, cyclic peptide production across 96 isolates under Arabidopsis wild-type Col-0 are shown. (A) Schematic shows the genomic locus of seven botrydial (BOT) biosynthesis genes clustered together. Exons are represented by gray boxes. Introns and intergenic regions are represented by the grey line. Seven BOT genes are: BcBOT1, BcBOT3 and BcBOT4, encoding a cytochrome P450 monooxygenase, respectively; BcBOT2 encoding a sesquiterpene cyclase; BcBOT5 encoding an acetyl transferase; BcBOT6 encoding a Zn(II)2Cys6 transcription factor, BcBOT7 encoding a dehydrogenase reductase. (B) BOT biosynthesis pathway in B. cinerea. (C) Bar plots compare expression variation of BcBOT2 across 96 B. cinerea isolates in responding to Arabidopsis wild-type Col-0 immunity. The model-corrected means (log2) of transcripts were used for plotting. (D) Scatter plot illustrates the positive correlations between lesion area and accumulation of BcBOT2 transcript across the 96 isolates in response to varied Arabidopsis immunities. Model-corrected lesion area means were estimated for three Arabidopsis genotypes at 72 hr post-infection with 96 B. cinerea isolates. The three Arabidopsis genotypes are labeled next to the confidence ellipse curves: wild-type Col-0 (purple dot), jasmonate insensitive mutant coi1-1 (green triangle), and salicylic acid mutant npr1-1 (orange diamond). The 90% confidence ellipse intervals are plotted for each Arabidopsis genotype for reference. Linear regression lines: Col-0: y = 3.2532 x+4.4323, p=1.008e-10, Adjusted R2 = 3.3537; coi1-1: y = 7.4802 x+10.3289, p=7.895e-15, adjusted R2 = 0.4700; npr1-1: y = 3.7086 x+7.3487, p=2.425e-11, adjusted R2 = 0.3726. (E) and (F) Bar plots compare expression variation of BcBOA6 in botcinic acid (BOA) pathway and Bcin01g11460. in cyclic peptide pathway across 96 B. cinerea isolates in response to Arabidopsis wild-type Col-0 immunity. (G) Venn diagram illustrates the number of B. cinerea isolates with the ability to induce BOT, BOA, and cyclic peptide.
Figure 7 with 4 supplements

Comparison of plasticity of B. cinerea gene co-expression network under vaired host immunity.
B. cinerea gene co-expression networks (GCNs) of vesicle/virulence (red) and translation/growth (green) identified under three Arabidopsis genotypes are compared. Three Arabidopsis genotypes are wild-type Col-0, jasmonate insensitive mutant coi1-1, and salicylic acid mutant npr1-1. Nodes marked with red and green colors represent B. cinerea genes condensed in GCNs with different biological functions. The same node condensed in GCNs across three Arabidopsis genotypes was marked with same color. Nodes specificaly condensed in GCNs under two mutants coi1-1 and npr1-1 background are marked with orange color. Edges represent the Spearman’s rank correlation coefficients between gene pairs.
Figure 7—figure supplement 1
Gene co-expression networks identified from B. cinerea transcriptomic responses to Arabidopsis wild-type Col-0 immunity.
B. cinerea gene co-expression networks (GCNs) were identified from 96 B. cinerea isolates infecting on Arabidopsis wild-type Col-0. The similarity matrix is computed using Spearman’s rank correlation coefficient. All co-expressed gene pairs with correlation greater than 0.85 were shown. Nodes with different colors represent B. cinerea genes condensed in GCNs with different biological functions. Edges represent the Spearman’s rank correlation coefficients between gene pairs. GCNs were ordered as number of nodes within each network. GCNs were named after their biological functions, which were determined by hub and bottleneck genes within each network: vesicle/virulence (red), translation/growth (green), botcinic acid (BOA, blue), exocytosis regulation (pink), cyclic peptide (yellow), copper transport (slate blue), botrydial (BOT, purple), peptidase (gray), isopentenyl pyrophosphate (IPP, turquoise), polyketide (violet).
Figure 7—figure supplement 2
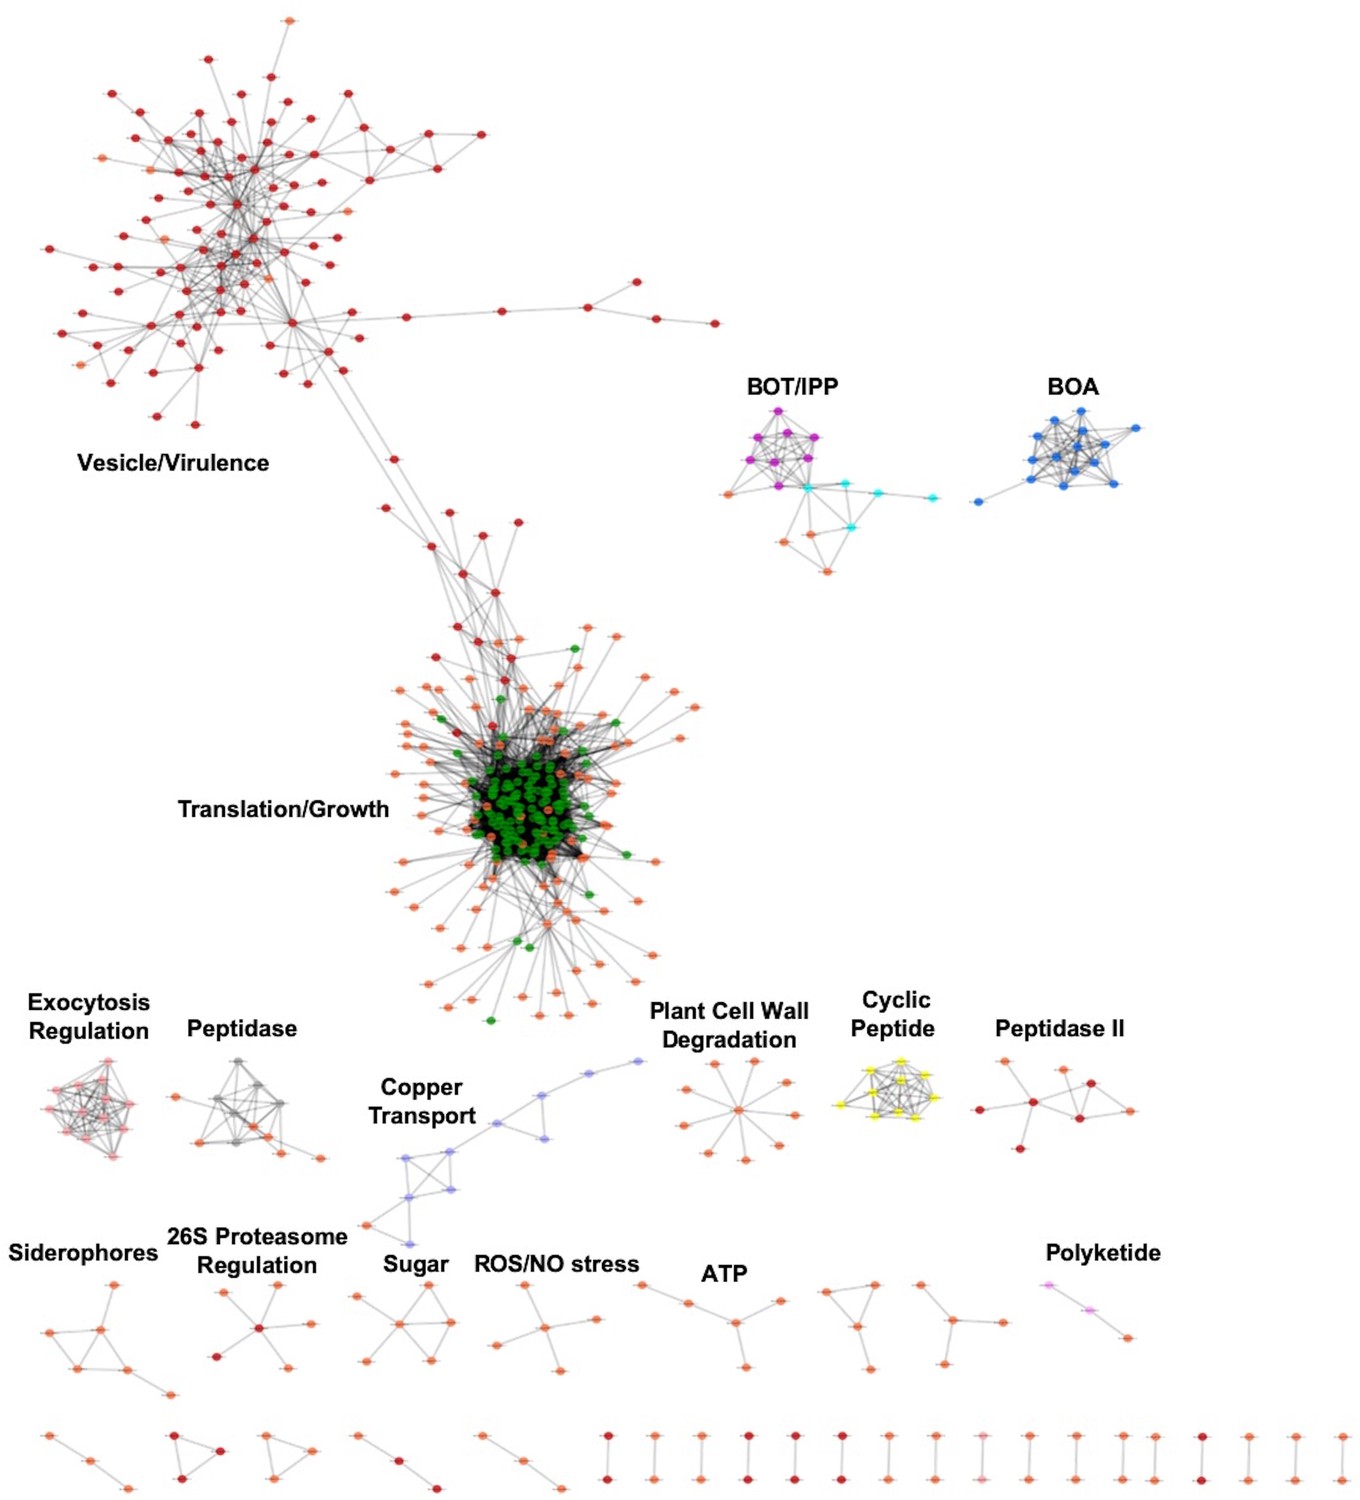
Gene co-expression networks identified from B. cinerea transcriptomic responses to Arabidopsis jasmonate-compromised immunity.
B. cinerea gene co-expression networks (GCNs) were identified from 96 B. cinerea isolates infecting on Arabidopsis jasmonate insensitive mutant coi1-1. The similarity matrix is computed using Spearman’s rank correlation coefficient. All co-expressed gene pairs with correlation greater than 0.8 were shown. Nodes with different colors represent B. cinerea genes condensed in GCNs with different biological functions. Nodes were marked with same color as under Arabidopsis wild-type Col-0 background. Nodes specificaly condenced in GCNs under Arabidopsis mutant coi1-1 background are marked with orange color. Edges represent the Spearman’s rank correlation coefficients between gene pairs. GCNs were ordered as number of nodes within each network. GCNs were named after their biological functions, which were determined by hub and bottleneck genes within each network: vesicle/virulence (red/orange), translation/growth (green/orange), botrydial/isopentenyl pyrophosphate (BOT/IPP, blue/turquoise/orange), botcinic acid (BOA, blue), exocytosis regulation (pink), peptidase (gray/orange), copper transport (slate blue/orange), plant cell wall degradation (orange), cyclic peptide (yellow), peptidase II (red/orange), siderophores (orange), 26S proteasome regulated protein degradation (red/orange), sugar, ROS/NO stress (orange), ATP (orange), polyketide (violet/orange).
Figure 7—figure supplement 3
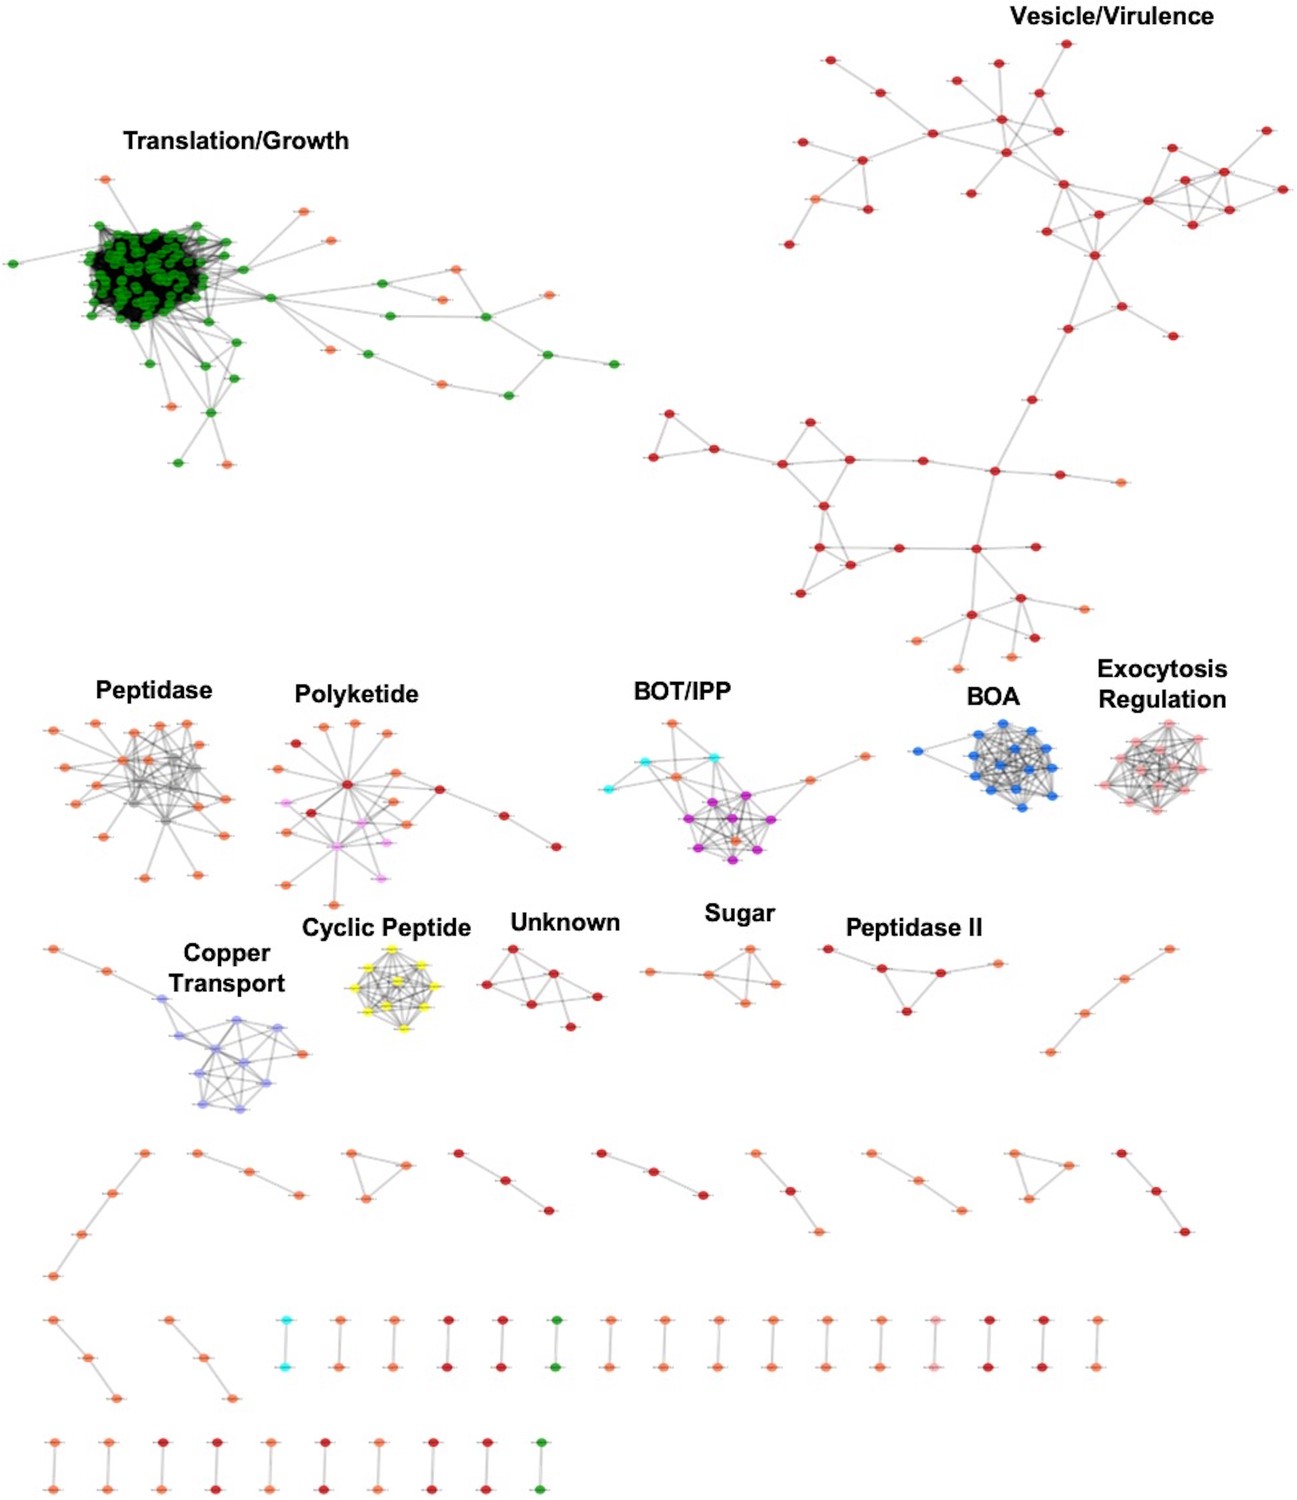
Gene co-expression networks identified from B. cinerea transcriptomic responses to Arabidopsis salicylic acid-compromised immunity.
B. cinerea gene co-expression networks (GCNs) were identified from 96 B. cinerea isolates infecting on Arabidopsis salicylic acid insensitive mutant npr1-1. The similarity matrix is computed using Spearman’s rank correlation coefficient. All co-expressed gene pairs with correlation greater than 0.8 were shown. Nodes with different colors represent B. cinerea genes condensed in GCNs with different biological functions. Nodes were marked with same color as under Arabidopsis wild-type Col-0 background. Nodes specificaly condenced in GCNs under Arabidopsis mutant npr1-1 background are marked with orange color. Edges represent the Spearman’s rank correlation coefficients between gene pairs. GCNs were ordered as number of nodes within each network. GCNs were named after their biological functions, which were determined by hub and bottleneck genes within each network: translation/growth (green/orange), vesicle/virulence (red/orange), peptidase (gray/orange), polyketide (violet/orange), botrydial/isopentenyl pyrophosphate (BOT/IPP, blue/turquoise/orange), botcinic acid (BOA, blue), exocytosis regulation (pink), copper transport (slate blue/orange), cyclic peptide (yellow), unknown (red), sugar (orange), peptidase II (red/orange).
Figure 7—figure supplement 4
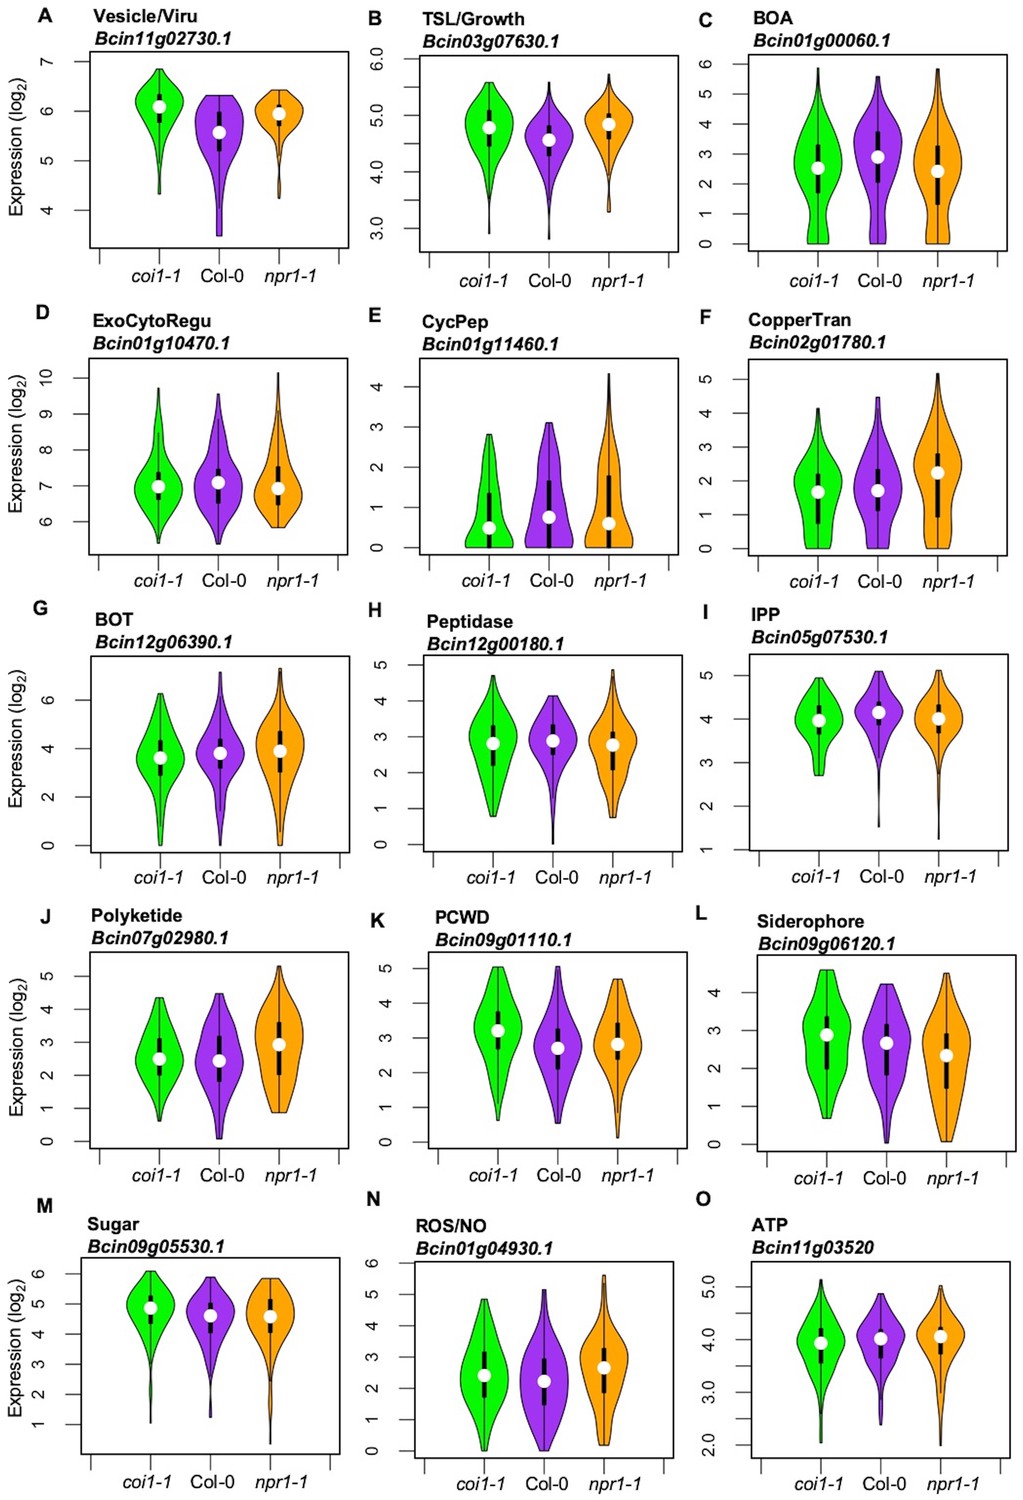
Plasticity in expression profiles of genes identified by B. cinerea gene co-expression networks under varied Arabidopsis immunities.
Violin plots of (A) to (O) show the expression profiles of B. cinerea genes in response to variation of Arabidopsis immunity. Genes shown are condensed in B. cinerea gene co-expression networks (GCNs). The model-corrected means (log2) for B. cinerea transcript were used for plotting. The Arabidopsis genotypes, wild-type Col-0 (purple), jasmonate insensitive mutant coi1-1 (green), and salicylic acid mutant npr1-1 (orange), are shown on the x axis.
Figure 8 with 1 supplement
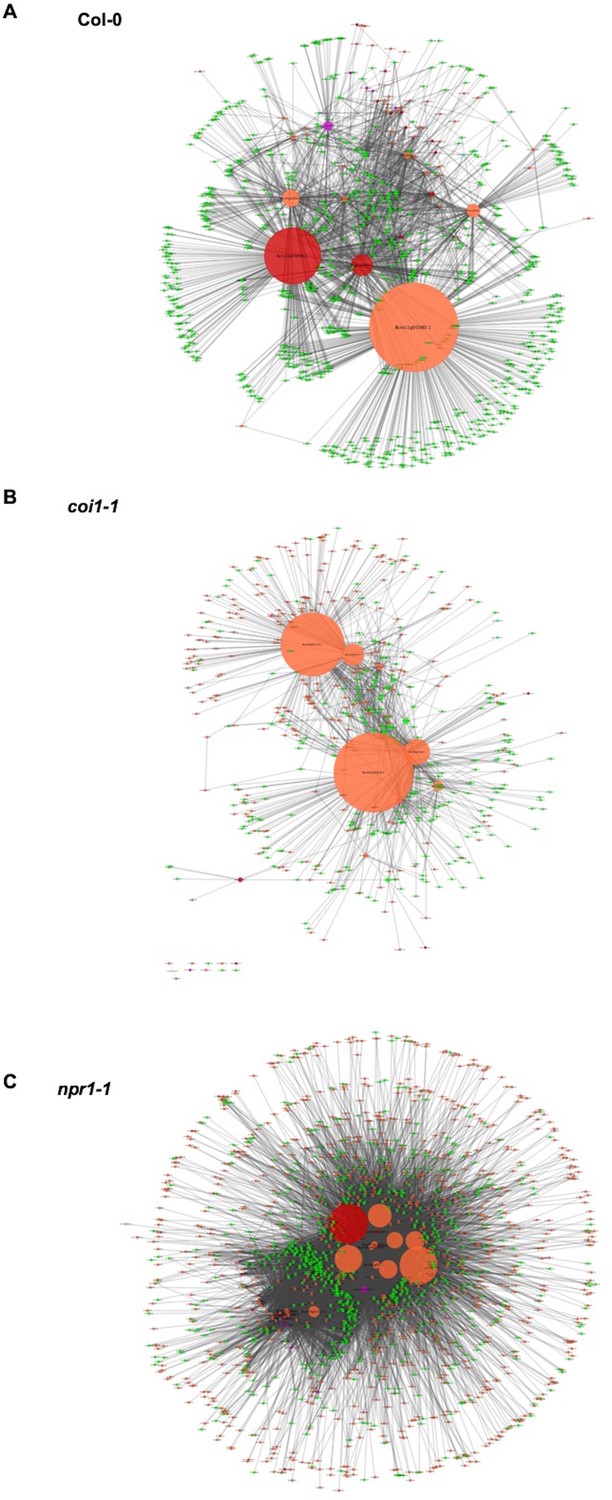
Cross-kingdom Arabidopsis-B. cinerea gene co-expression networks.
Networks showing the co-expression connectivity between Arabidopsis and B. cinerea genes within three Arabidopsis genotypes are shown. (A) shows connectivity within Arabidopsis wild-type Col-0, (B) shows connectivity within the Arabidopsis jasmonate insensitive mutant coi1-1, and (C) shows connectivity within the Arabidopsis salicylic acid insensitive mutant npr1-1. Within each connectivity plot, orange and green nodes show transcripts from B. cinerea and Arabidopsis, respectively. Nodes with red and violet colors represent the B. cinerea transcripts that were found to be members of the B. cinerea membrane/vesicle virulence network and BOT network, respectively. Node size shows the number of interactions with a specific gene. The connectivity between the nodes was derived using Spearman’s rank correlation analysis.
-
Figure 8—source data 1
Gene list of cross-kingdom Arabidopsis-B. cinerea gene co-expression networks.
Tables of Arabidopsis and B. cinerea genes identified by co-transcriptome gene co-expression networks (GCNs) during 96 isolates infection on Arabidopsis wild-type Col-0, jasmonate insensitive mutant coi1-1, and salicylic acid insensitive mutant npr1-1.
- https://doi.org/10.7554/eLife.44279.025
Figure 8—figure supplement 1
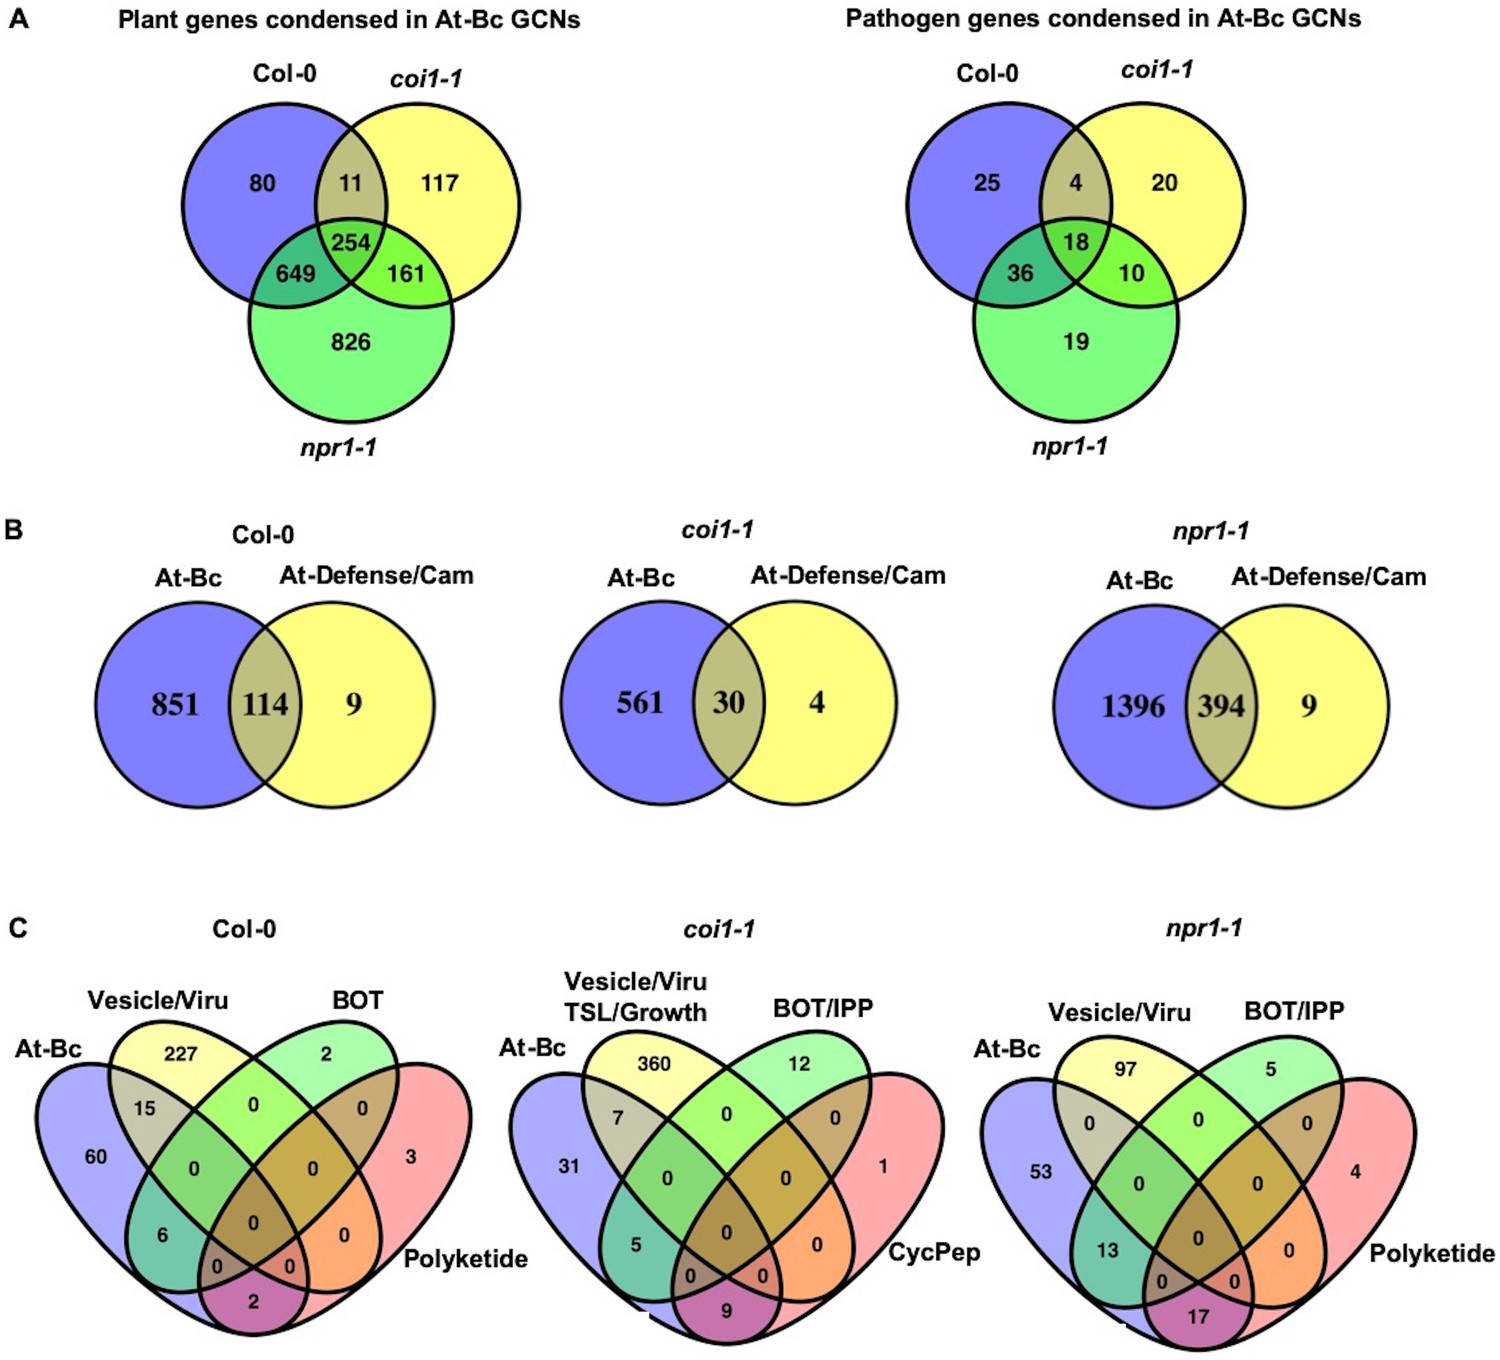
Associations between gene co-expression networks identified from co- and single-transcriptome.
Venn diagram highlights: (A) the overlap of plant (left) and pathogen (right) genes condensed in Arabidopsis-B. cinerea gene co-expression networks (GCNs) across three Arabidopsis genotypes, (B) the overlap of plant genes in Arabidopsis-B. cinerea GCNs and Arabidopsis GCNs across three genotypes, (C) the overlap of pathogen genes in Arabidopsis-B. cinerea GCNs and B. cinerea GCNs across three genotypes.
Figure 9 with 2 supplements
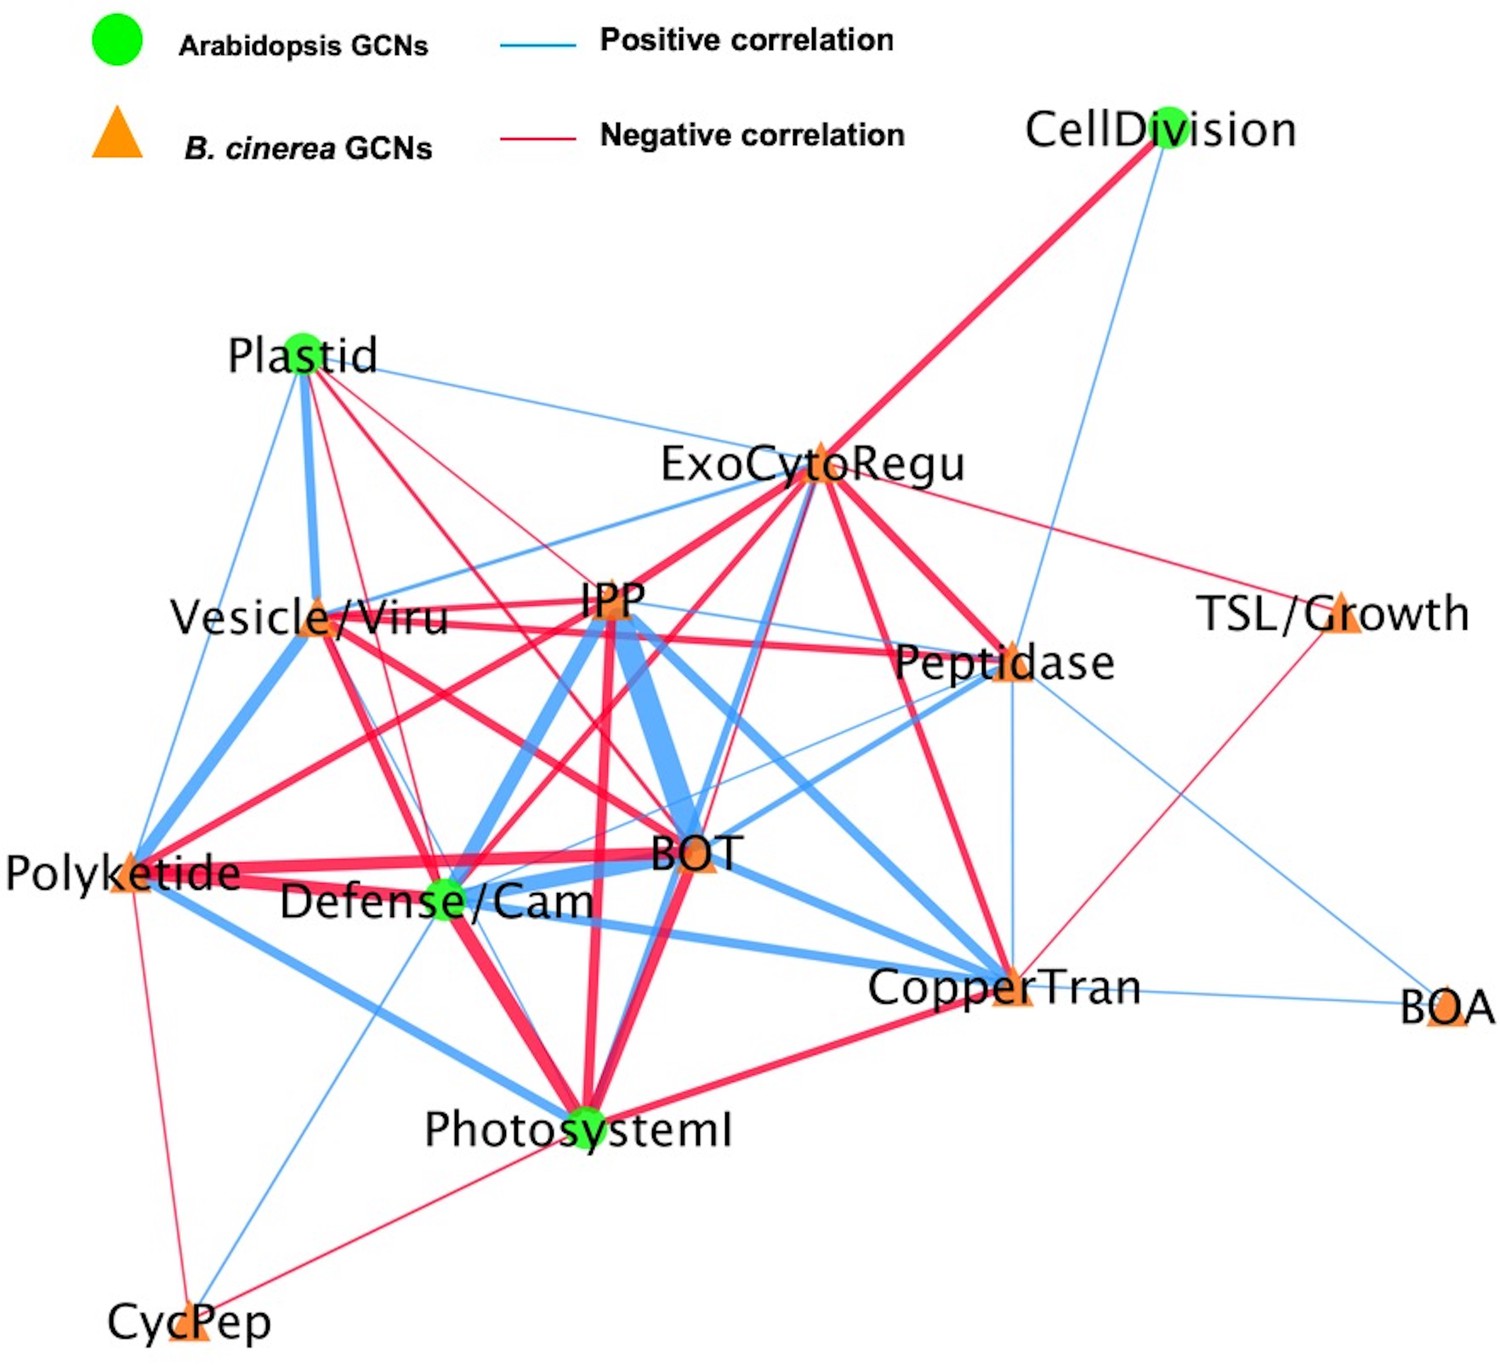
A dual interaction network reveals links between Arabidopsis immunity and B. cinerea virulence.
A dual interaction network was constructed using gene co-expression networks (GCNs) from Arabidopsis and B. cinerea co-transcriptome. The first eigenvectors were derived from individual GCNs and used as input to calculate Spearman’s rank correlation coefficiency between GCN pairs. Green dots and orange triangles represent Arabidopsis immune- and B. cinerea virulence-GCNs, respectively. Blue and red lines (edges) represent the positive and negative Spearman’s rank correlation coefficients between GCN pairs, respectively. The thickness of line signifies the correlational strength.
Figure 9—figure supplement 1
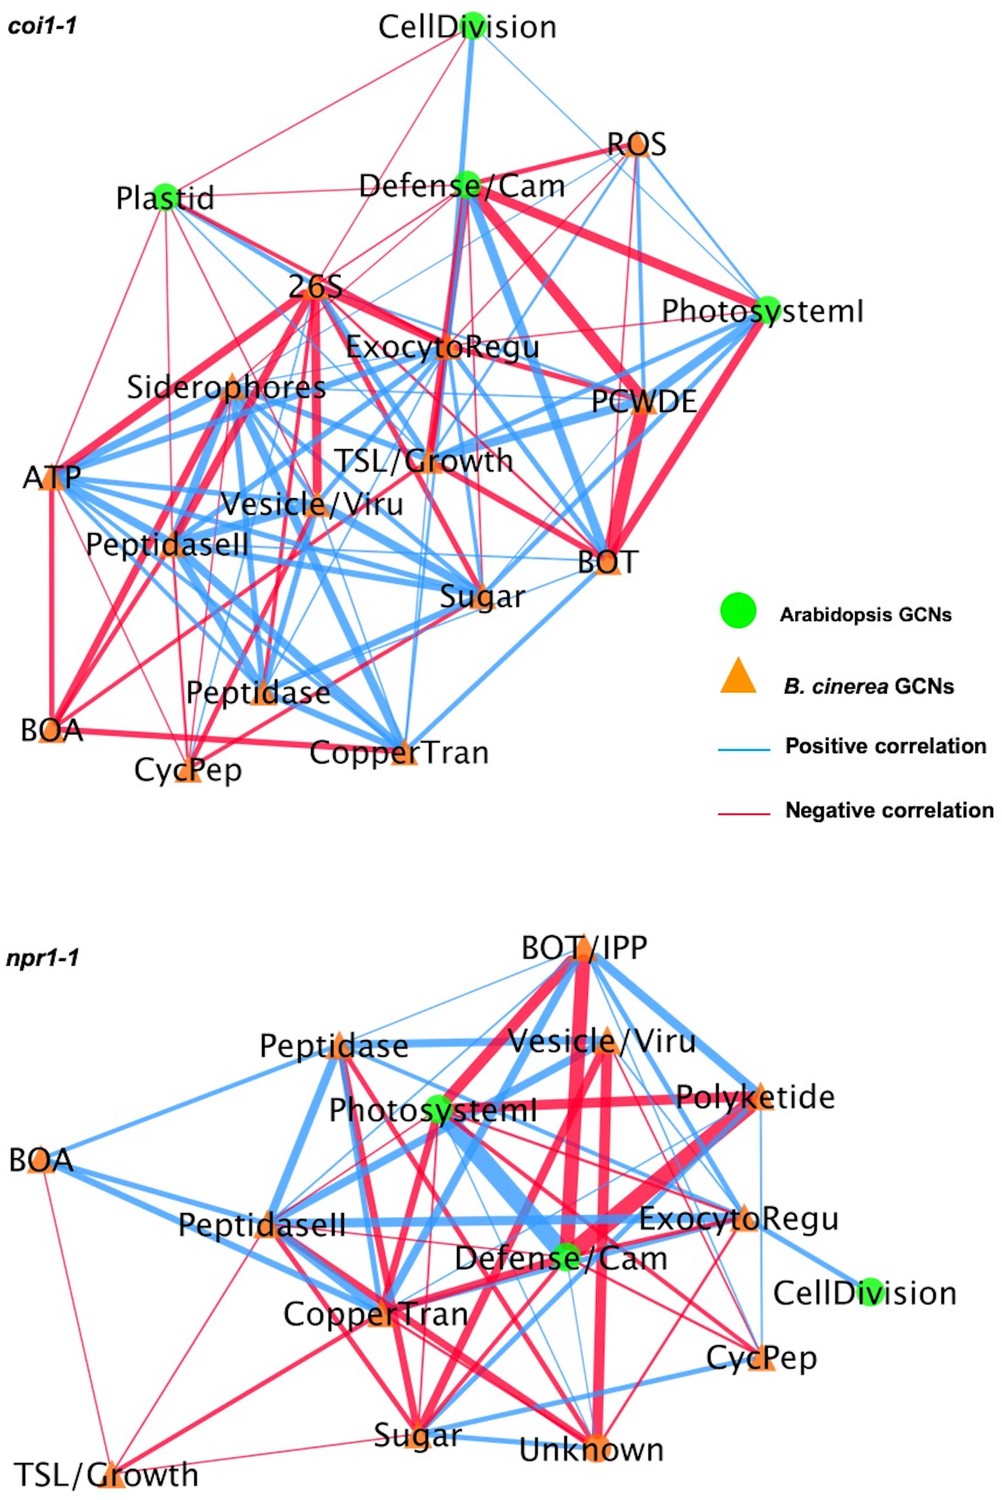
Dual networks reveal links between Arabidopsis immunity and B. cinerea virulence under coi1-1 and npr1-1.
Dual interaction networks were constructed using gene co-expression networks (GCNs) from Arabidopsis and B. cinerea co-transcriptome under JA-insensitive mutant coi1-1 and SA-insensitive mutant npr1-1, respectively. The first eigenvectors were derived from individual GCNs and used as input to calculate Spearman’s rank correlation coefficiency between GCN pairs. Green dots and orange triangles (nodes) represent Arabidopsis immune- and B. cinerea virulence-GCNs, respectively. Blue and red lines (edges) represent the positive and negative Spearman’s rank correlation coefficients between GCN pairs, respectively. The thickness of line signifies the correlational strength.
Figure 9—figure supplement 2
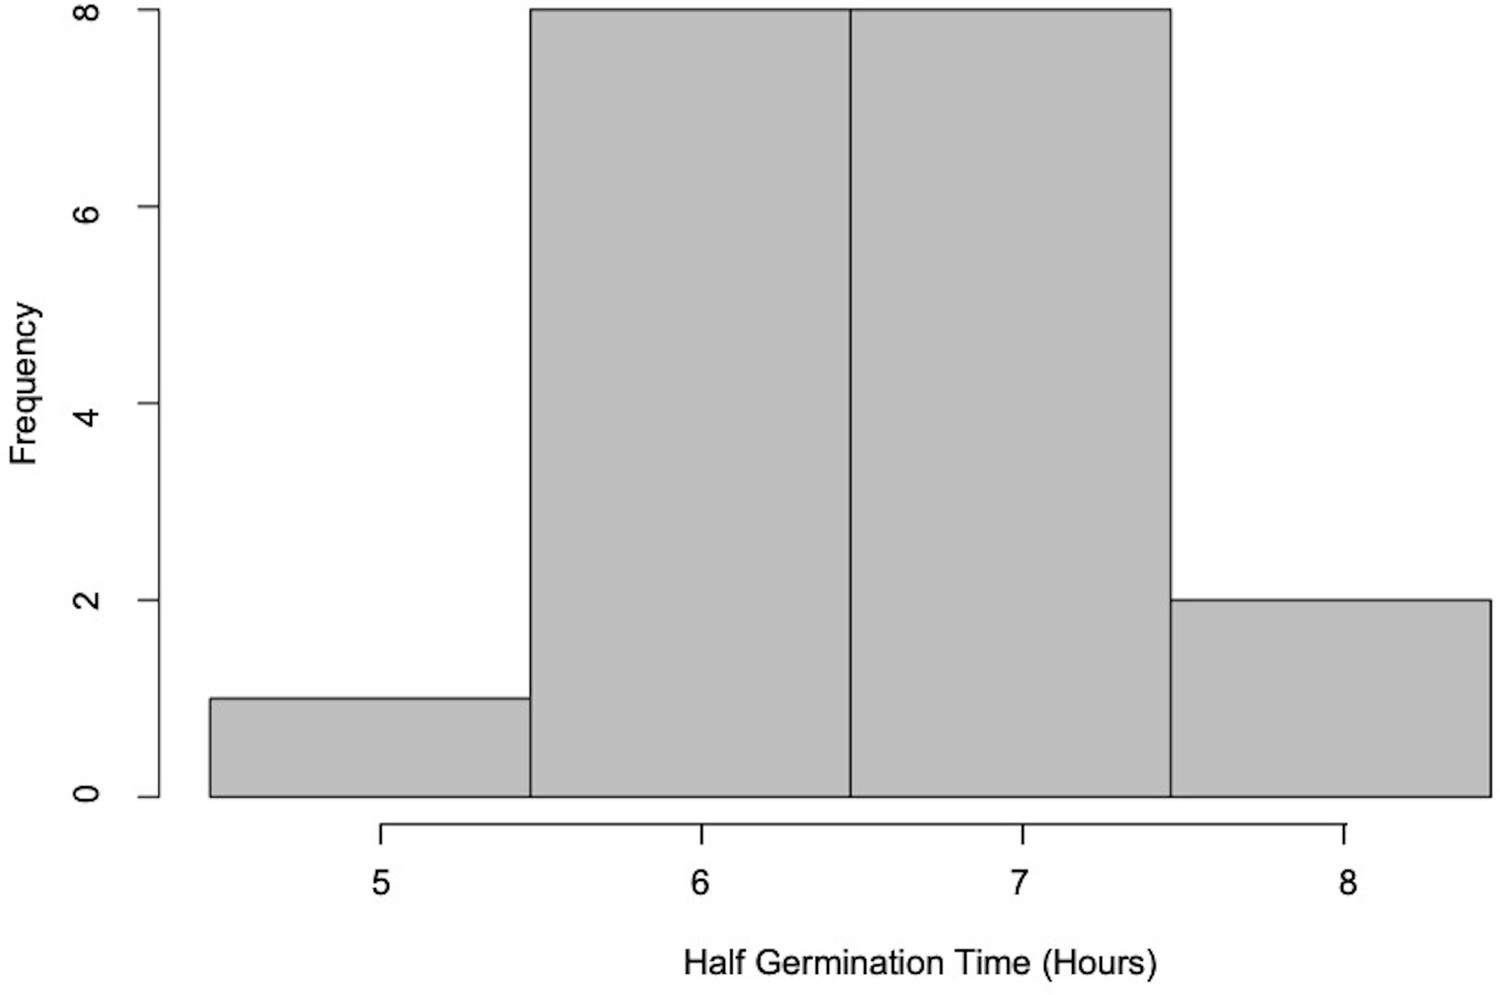
Variation of B.
cinerea spore germination time under in vitro condition.
Additional files
-
Supplementary file 1
Topology traits of B. cinerea in planta gene co-expression networks.
- https://doi.org/10.7554/eLife.44279.029
-
Supplementary file 2
ANOVA table of lesion area and B. cinerea pathways.
A mixed linear model was fitted to test lesion area and B. cinerea pathways responsible for botrydial (BOT), botcinic acid (BOA), and cyclic peptide (CycPep) produced under three Arabidopsis genotypes. The lesion area data used in the model were GLM corrected least square means induced by 96 B. cinerea isolates. Model-corrected means of transcripts from 96 B. cinerea isolates were z-scaled and used in ANOVA. Df is the degrees of freedom for a term within the model. SS is the Sum of Squares variation. MS is the Mean of Squared variation. F value is derived from the F statistic and P-value indicates the statistical significance for a given term within the model. Significance of differences are shown as p<0.001 ‘***’, 0.01‘**’ and 0.05 ‘*’.
- https://doi.org/10.7554/eLife.44279.030
-
Supplementary file 3
ANOVA tables of B. cinerea gene co-expression networks.
Mixed linear models were fitted to individual B. cinerea (Bc) gene co-expression networks (GCNs) and variation of host genotypes and Arabidopsis (At) GCNs. Variation was estimated among host genotypes and first eigenvectors from four individual Arabidopsis GCNs. Df is the degrees of freedom for a term within the model. SS is the Sum of Squares variation. MS is the Mean of Squared variation. F value is derived from the F statistic and P-value indicates the statistical significance for a given term within the model. Significance of difference are shown as p<0.001 ‘***’, 0.01‘**’ and 0.05 ‘*’.
- https://doi.org/10.7554/eLife.44279.031
-
Supplementary file 4
ANOVA tables of Arabidopsis gene co-expression networks.
Linear mixed models were fitted to individual Arabidopsis (At) gene co-expression networks (GCNs) and variation of host genotypes and ten B. cinerea (Bc) GCNs. Variation was estimated among host genotypes and first eigenvectors from individual B. cinerea GCNs. Df is the degrees of freedom for a term within the model. SS is the Sum of Squares variation. MS is the Mean of Squared variation. F value is derived from the F statistic and P-value indicates the statistical significance for a given term within the model. Significance of difference are shown as p<0.001 ‘***’, 0.01‘**’ and 0.05 ‘*’.
- https://doi.org/10.7554/eLife.44279.032
-
Supplementary file 5
Topology traits of cross-kingdom Arabidopsis-B. cinerea gene co-expression networks.
Three Arabidopsis genotypes are wild-type Col-0, jasmonate insensitive mutant coi1-1, and salicylic acid insensitive mutant npr1-1.
- https://doi.org/10.7554/eLife.44279.033
-
Supplementary file 6
Analysis of potential impact of germination variation.
To test if germination may influence the observed network to lesion connections, we estimated germination using the first principal component of genes linked to germination in Leroch et al. (2013). We then estimated the value of this principal component in the isolates grown on the three host genotypes and conducted a linear model to compare how this eigengene links to virulence. Using a linear model with and without this germination eigengene, we compared the link of the 10 B. cinerea transcript networks to lesion size with and without the germination eigengene vector in the model.
- https://doi.org/10.7554/eLife.44279.034
-
Transparent reporting form
- https://doi.org/10.7554/eLife.44279.035
Download links
A two-part list of links to download the article, or parts of the article, in various formats.
Downloads (link to download the article as PDF)
Open citations (links to open the citations from this article in various online reference manager services)
Cite this article (links to download the citations from this article in formats compatible with various reference manager tools)
Plant–necrotroph co-transcriptome networks illuminate a metabolic battlefield
eLife 8:e44279.
https://doi.org/10.7554/eLife.44279


