A novel L1CAM isoform with angiogenic activity generated by NOVA2-mediated alternative splicing
- IEO, European Institute of Oncology IRCCS, Italy
- Consiglio Nazionale delle Ricerche, Italy
- University of Pavia, Italy
- Università degli Studi di Roma "Foro Italico", Italy
- Università degli Studi di Pavia, Italy
- FIRC Institute of Molecular Oncology, Italy
- The Barcelona Institute of Science and Technology, Spain
- Universitat Pompeu Fabra, Spain
- Institució Catalana de Recerca i Estudis Avançats, Spain
- Gene Tools LLC, United States
- IRCCS-Istituto di Ricerche Farmacologiche Mario Negri, Italy
- Karolinska Institutet, Sweden
- IRCCS San Raffaele Scientific Institute, Italy
- Uppsala University, Sweden
Figures
Figure 1 with 1 supplement
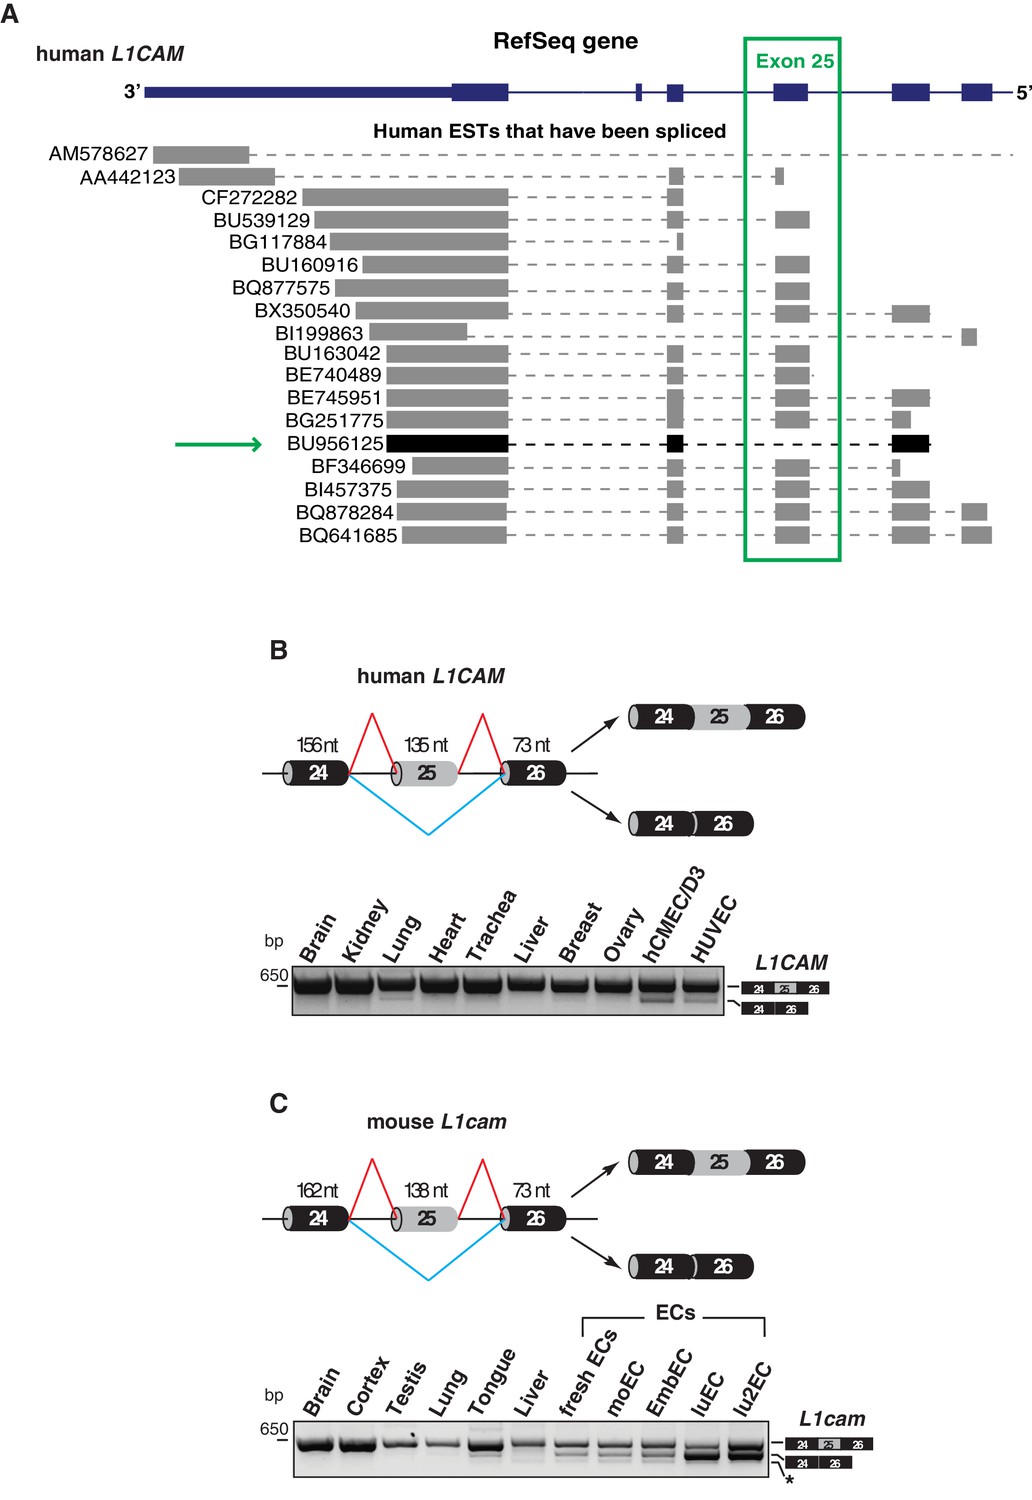
Alternative splicing of L1CAM exon 25.
(A) 3’ region of human L1CAM gene and AS variants that are present as ESTs (data from UCSC Genome Browser). The green box indicates exon 25. The green arrow shows an EST with the skipping of exon 25. The annotation of human L1CAM exon 25 refers to RefSeq transcript NM_00425 and is consistent with the previous literature (Mikulak et al., 2012). (B) Upper panel: schematic diagram of the human L1CAM genomic region containing the AS exon 25 (grey box). Black boxes = constitutive exons; thin lines = introns. Red and blue lines indicate the two possible AS reactions, and the two resulting isoforms are shown on the right. Lower panel: RT-PCR analysis of AS of the human L1CAM exon 25 in different human tissues and in two EC lines (hCMEC/D3 and HUVEC). (C) Scheme of AS events of the mouse L1cam exon 25 and RT-PCR analysis in mouse tissues, ECs freshly purified from mouse lung and mouse EC lines (moEC, EmbEC, luEC and lu2EC). Asterisk indicates an additional band (more evident in moEC and EmbEC) corresponding to a novel transcript deleted of exons 25, 26 and 27.
Figure 1—figure supplement 1
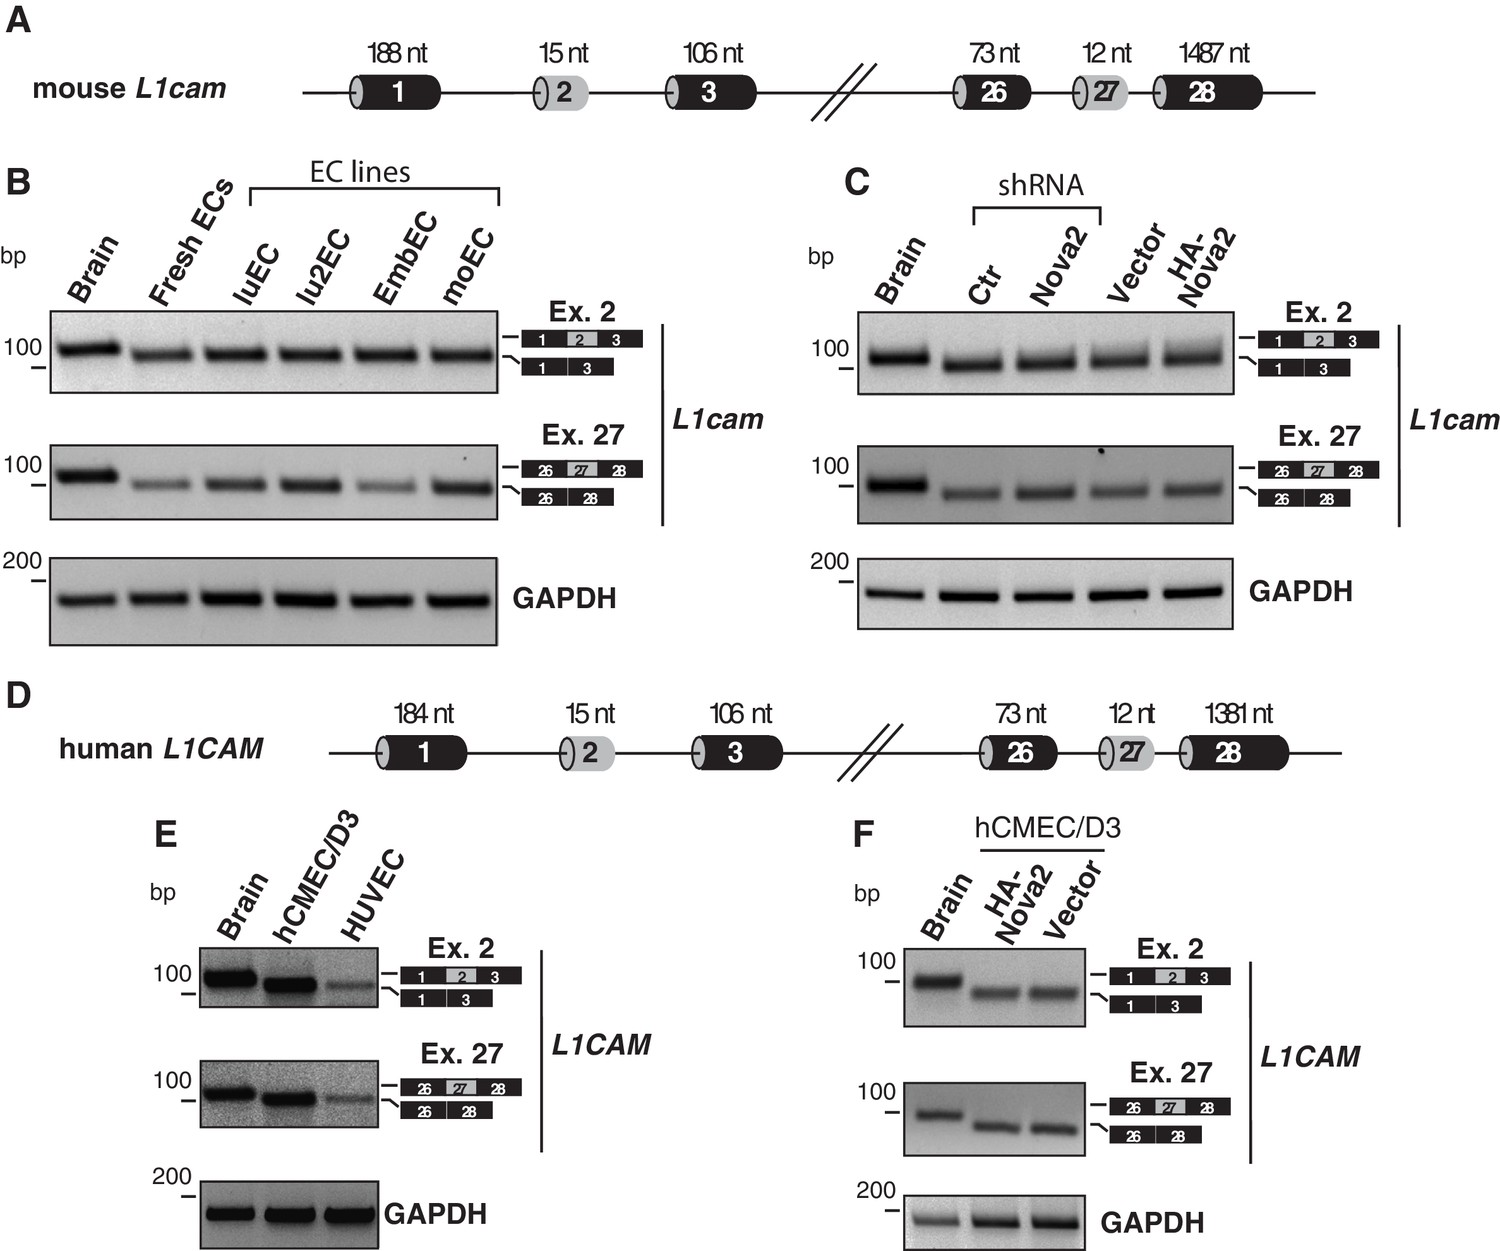
L1cam splicing in mouse and human ECs.
(A) Scheme of the L1cam mouse genomic regions comprising the AS exons 2 and 27 (grey boxes). Black boxes = constitutive exons; thin lines = introns. (B) RT-PCR analysis of the AS of mouse L1cam exons 2 and 27 in whole mouse embryo brain (E15.5), freshly purified mouse lung ECs and mouse EC lines (luEC, lu2EC, EmbEC and moEC). GAPDH served as loading control. (C) RT-PCR analysis of the AS of mouse L1cam exons 2 and 27 in mouse embryo brain (E15.5) and in moEC either depleted for endogenous NOVA2 or overexpressing HA-tagged NOVA2. No differences in the inclusion of exons 2 and 27 were detected upon genetic manipulation of NOVA2. (D) Scheme of the L1CAM human genomic regions comprising the AS exons 2 and 27 (grey boxes). Black boxes = constitutive exons; thin lines = introns. (E–F) Splicing of the human L1CAM exons 2 and 27 in human brain, in human EC lines (hCMEC/D3 and HUVEC) and in hCMEC/D3 stably overexpressing HA-tagged NOVA2. Ectopic overexpression of NOVA2 had no effect on AS of exons 2 or 27.
Figure 2 with 1 supplement
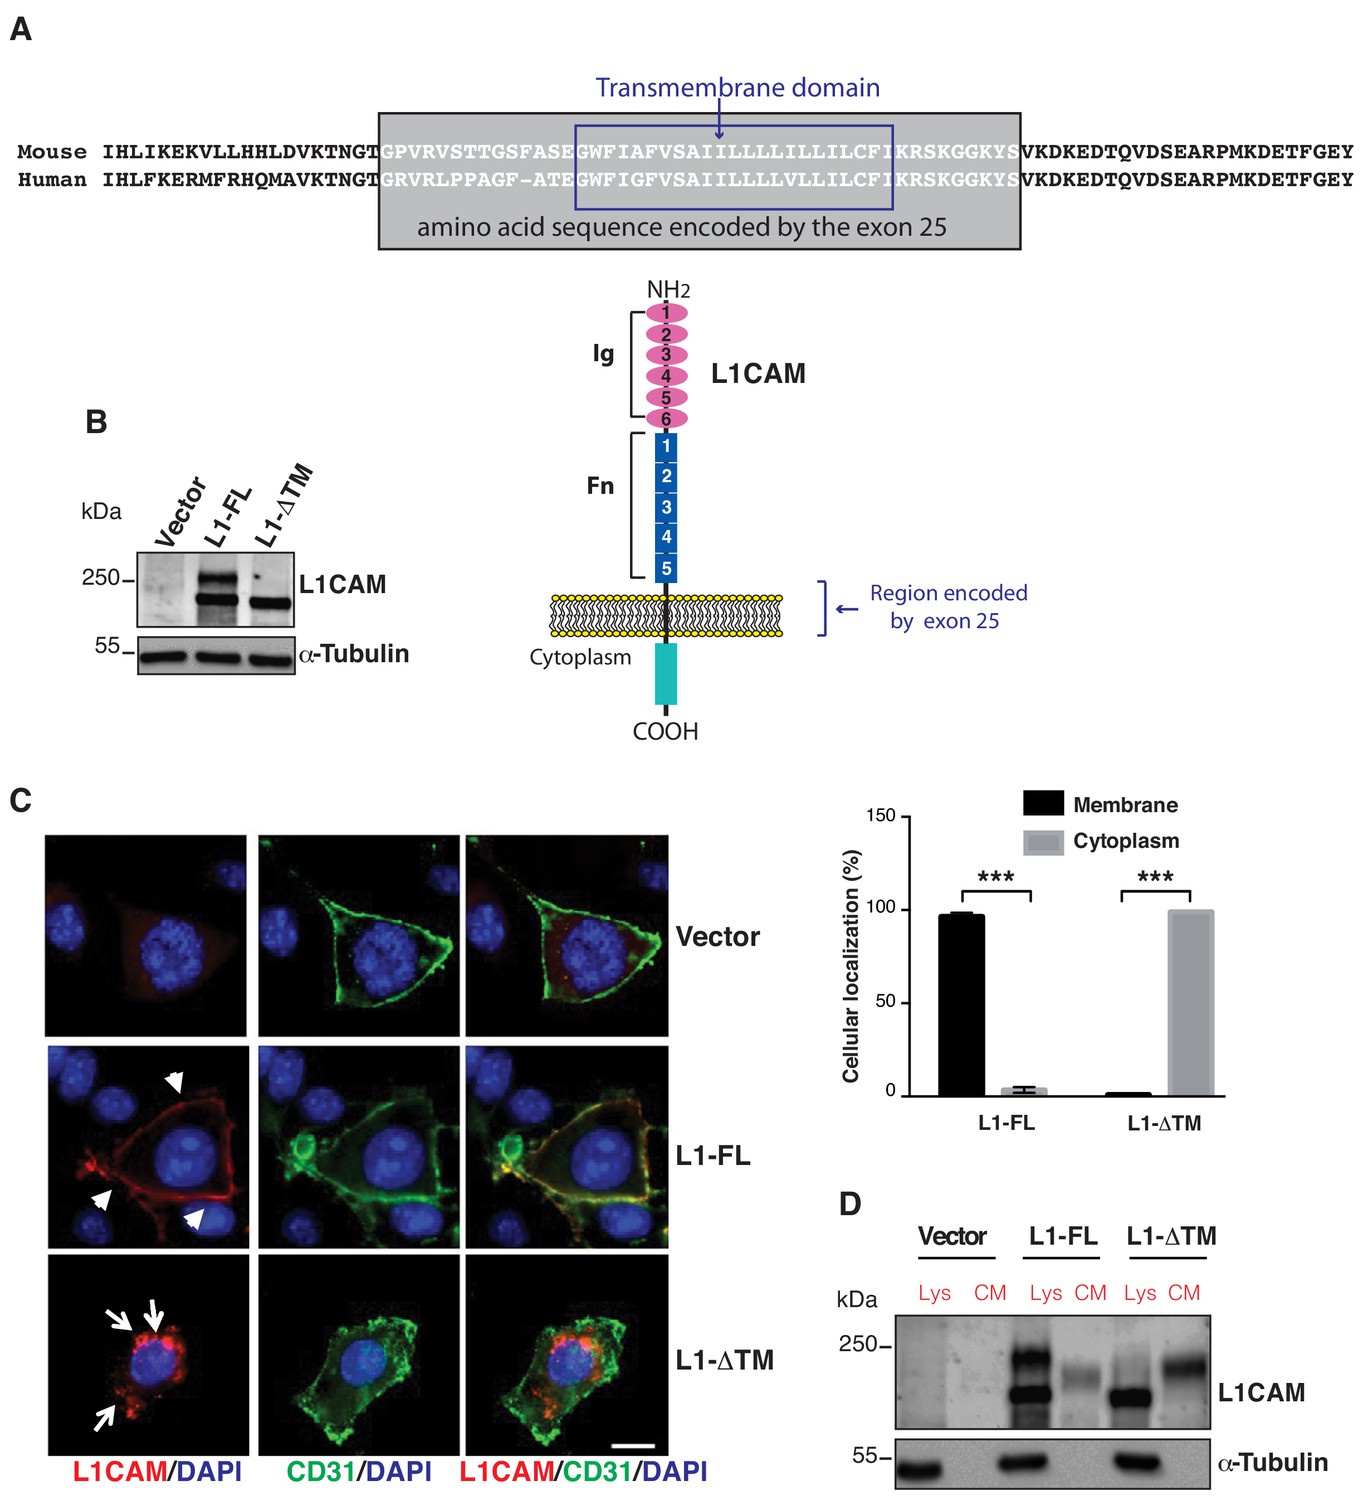
Expression, cell surface localization and release of L1CAM isoforms.
(A) The amino acid sequence of the mouse and human L1CAM region across the membrane. The transmembrane domain (blue rectangle), with 91% identity between mouse and human, and the sequence encoded by exons 25 (grey rectangle) are indicated. Bottom: schematic structure of L1CAM, showing the six Ig domains (Ig) and the five FN type-III repeats (Fn) in the extracellular portion. (B) Immunoblotting for L1CAM on lysates from moEC stably over-expressing the L1CAM isoforms (L1-FL or L1-ΔTM) or the empty vector (Vector). Immunoblotting for α-Tubulin served as loading control. (C) Representative images from the immunofluorescence analysis of L1CAM (red) and the endothelial cell surface marker CD31 (green) on moEC overexpressing either L1-FL or L1-ΔTM (confocal sections, z axis; scale bar 10 μm). Arrowheads show L1-FL localization at the cell surface, while arrows show the cytosolic localization of L1-ΔTM. The graph (right panel) shows the quantitation of the cellular localization of the two L1CAM isoforms. Values represent means ±SD from five different fields in each condition. Comparisons between experimental groups were done with two-sided Student’s t-test; ***p<0.001. (D) Immunoblotting for L1CAM on lysates (Lys) and conditioned media (CM) from moEC stably overexpressing either L1-FL or L1-ΔTM. Equal amounts of protein extracts and volumes of CM derived from equal numbers of producing cells (see Materials and methods) were analysed.
Figure 2—figure supplement 1
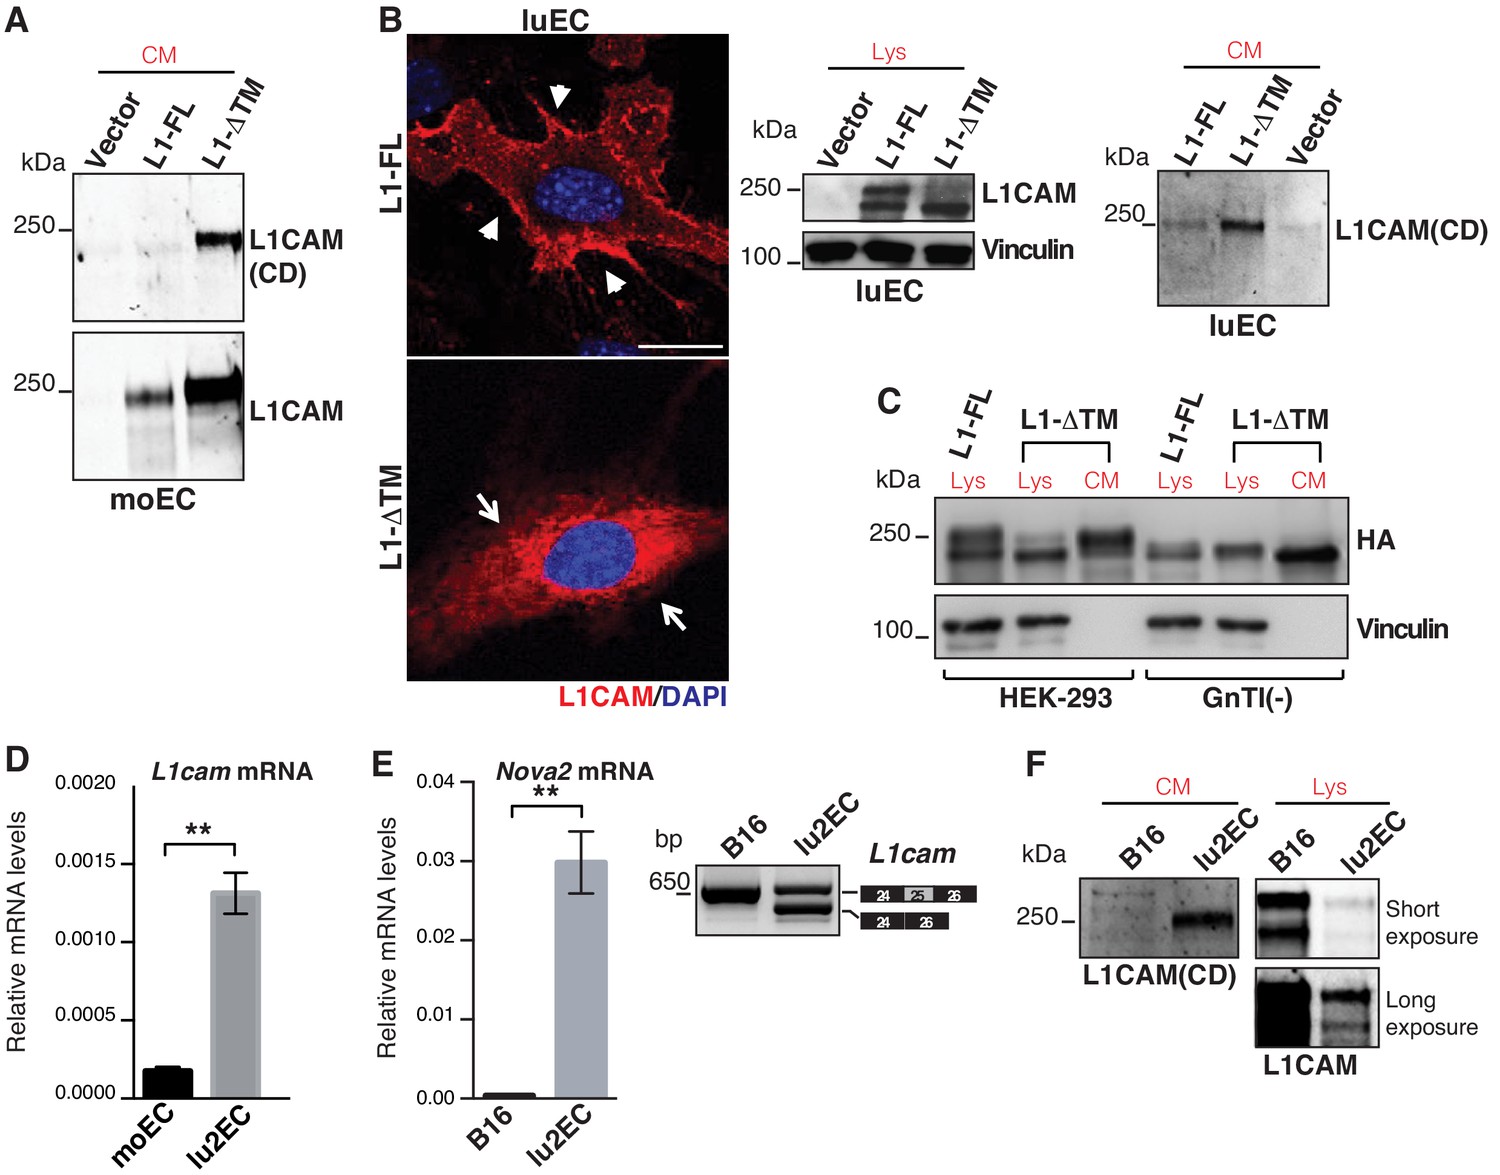
Characterization of L1-ΔTM isoform.
(A) Immunoblotting of conditioned media (CM) derived from moEC transduced with empty vector, L1-FL or L1-ΔTM was performed with antibodies that specifically recognize the cytoplasmic domain (CD, top panel) or the extracellular portion of L1CAM (bottom panel). (B) Confocal immunofluorescence and immunoblotting of cell lysates (Lys) and CM from luEC stably overexpressing L1CAM isoforms or the empty vector (Vector). Scale bar: 20 μm. (C) Wild-type or N-acetylglucosaminyltransferase I-deficient HEK293 cells [GnTI(-)] were transiently transfected with HA-tagged L1-FL or L1-ΔTM. Lysates (Lys) and CM were then immunoblotted for HA tag and vinculin. (D) L1cam expression levels in moEC compared to lu2EC. (E) Consistent with the expression of Nova2 (left), lu2EC exhibited the AS of L1cam exon 25 (right), while this was not the case in B16 melanoma cells, which do not express Nova2. Data indicate means ± SD (n = 2). **p<0.01. (F) Immunoblotting of CM derived from lu2EC and B16 with the antibody against L1CAM cytoplasmic domain. Lysates (Lys) of the same cells were also analyzed to detect cell-associated L1CAM; two different exposures of the membrane filter are shown to visualize endogenous L1CAM in lu2EC.
Figure 3 with 1 supplement
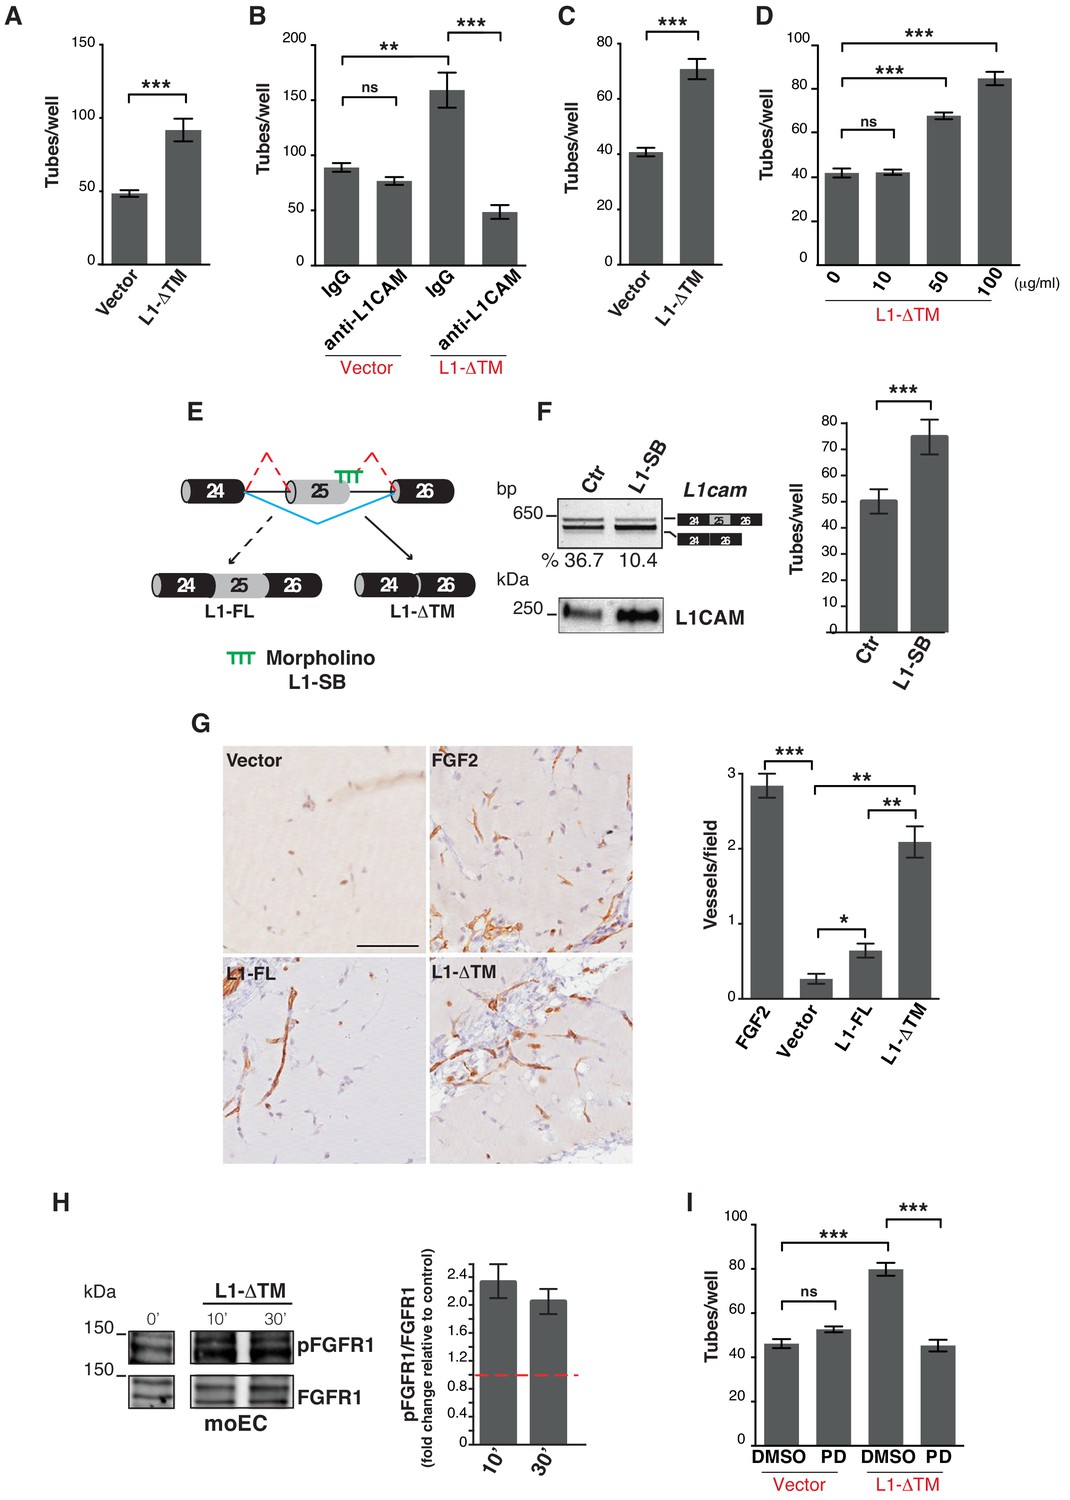
L1-ΔTM stimulates angiogenesis in an autocrine/paracrine fashion.
(A) Quantitation of tube formation by transduced moEC. (B) Transduced moEC were subjected to tube formation assays in the presence of either anti-L1CAM clone 324 or a control, irrelevant antibody (IgG). (C) Quantitation of tube formation by parental moEC treated with CM from moEC transduced either with the empty vector (Vector) or with L1-ΔTM. (D) Quantitation of tube formation assays on moEC untreated or treated with increasing concentrations of recombinant L1-ΔTM. (E) Schematic illustration of the mechanism of action of the morpholino oligonucleotide (L1–SB), which binds to the exon 25/intron 25 junction of L1cam, thus preventing the recruitment of the spliceosome and, hence, impairing the inclusion of exon 25. (F) lu2EC transfected with either an irrelevant morpholino (Ctr) or with L1-SB were analyzed by RT-PCR for the AS of L1cam exon 25 (left, top panel), whereas CM from the same cells were analyzed in immunoblotting with the L1CAM antibody (left, bottom panel). Parental moEC were subjected to tube formation assays in the presence of CM from Ctr- or L1-SB-transfected lu2EC (right panel). (G) Representative images and quantitation of vessel density in matrigel plugs pre-mixed with the CM from ECs transduced with either the empty vector (Vector), L1-FL or L1-ΔTM, and then implanted subcutaneously into C57Bl/6 mice (n = 3 mice/group). Matrigel plugs containing FGF2 served as positive control. Scale bar, 100 μm. Right panel: CD31+ vessels were counted in five different fields. (H) Left panels: immunoblots for phospho-FGFR1 (pFGFR1) and total FGFR1 (FGFR1) on serum-starved moEC left untreated or treated with recombinant L1-ΔTM (20 μg/ml) for 10 or 30 min. The blots were obtained from the same gel, the white line between the blots indicates the removal of intervening lanes. Right panel: FGFR1 phosphorylation in three biological replicates was quantitated by calculating the ratio between phospho-FGFR1 and total FGFR1. Data are normalized against the basal phosphorylation in untreated cells (indicated by the red dashed line). (I) moEC transduced with the empty vector (Vector) or with L1-ΔTM were subjected to tube formation assays in the presence of either the FGFR1 inhibitor PD173074 (PD) or DMSO as a control. For each analysis, data are expressed as means ± SEM from three independent experiments. Comparisons between experimental groups were done with two-sided Student’s t-tests; **p<0.01, ***p<0.001.
Figure 3—figure supplement 1
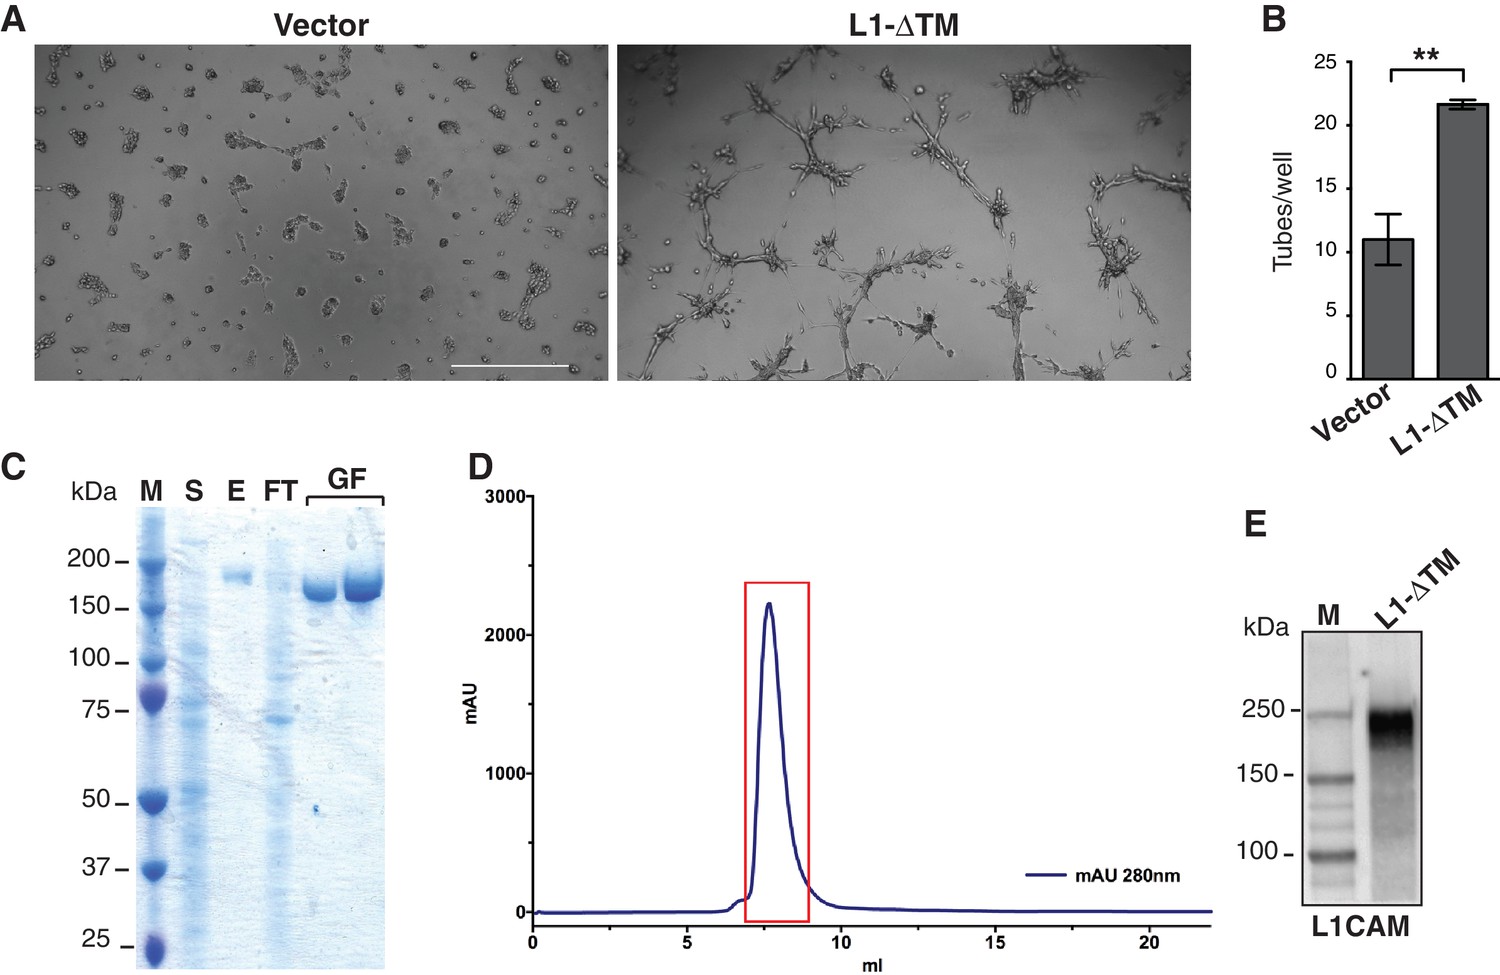
Functional characterization of L1-ΔTM isoform and production of purified recombinant L1-ΔTM.
(A) Representative images of tube formation in Matrigel by moEC transduced either with the empty vector (Vector) or with L1-ΔTM. Scale bar, 200 μm. (B) Tube formation by parental luEC treated with CM from luEC transduced with either the empty vector (Vector) or L1-ΔTM. Data indicate means ±SEM calculated from three independent experiments (n = 3). Comparisons between experimental groups were done with two-sided Student’s t-test. **p<0.01. (C) SDS-PAGE analysis of L1-ΔTM purification. M = marker; S = supernatant from L1-ΔTM-expressing cells; E = eluted sample from StrepTrap column; FT = flow through (unbound fraction from StrepTrap HP column); GF = two L1-ΔTM-containing fractions obtained after size-exclusion chromatography. (D) Size-exclusion chromatogram of L1-ΔTM. The chromatogram shows the absorbance at 280 nm (blue) recorded during elution of purified L1-ΔTM from a Superdex 200 10–300 column (GE Healthcare). The area shown in the red box contains the fractions pooled and used in the in vitro experiments with moEC. (E) After tag removal, purified recombinant L1-ΔTM protein was analyzed by immunoblotting with an anti-L1CAM antibody.
Figure 4 with 3 supplements

L1-ΔTM production is regulated by NOVA2 in ECs.
(A) The mouse L1cam cassette, encompassing exons 24, 25 and 26, with the intervening intronic sequence was used to generate the p-L1 wild-type (WT) minigene. Mutated minigenes (Mut3 and Mut5) were generated by mutations in either three or all five NOVA-binding sites in exon 25 (YCAY repeats were mutated to ACAY). Boxes = exons; thin lines = introns; pCMV = promoter; BGHpA = polyadenylation sequence; red arrows indicate the annealing positions of the primers used for RT-PCR. (B) AS of transcripts of the WT minigene upon co-transfection of HeLa cells with either HA-NOVA2, T7-hnRNP A1 (T7–A1), or the empty vector. The ectopic expression of NOVA2 and hnRNP A1 was confirmed by western blotting with anti-HA and anti-T7 antibodies, respectively. (C) AS of transcripts from the WT and mutated minigenes in co-transfected HeLa cells. The histogram shows the ratio between skipping and inclusion of L1cam exon 25. Data indicate means ± SEM calculated from five independent experiments (n = 5). Tukey’s multiple comparisons or two-sided Student’s t-test were used for comparisons between experimental groups; *p<0.05; **p<0.01. (D) L1cam mouse genomic region comprising the AS exon 25 (grey box). Black boxes = constitutive exons; thin lines = introns; blue dot = YCAY cluster within exon 25 predicted to function as NOVA2-binding site. Bottom diagrams illustrate the inclusion (left) or the NOVA2-induced skipping of exon 25 (right). (E) AS of mouse L1cam exon 25 as determined by RT-PCR in moEC stably overexpressing HA-tagged NOVA2 cDNA. (F) AS of mouse L1cam exon 25 in moEC transduced with an shRNA against Nova2 or with a control shRNA (Ctr). The percentage of exon inclusion was calculated as described in Materials and methods and is shown below the gels. (G) CLIP was performed in moEC with anti-NOVA2 or control IgG. NOVA2-bound RNA was analyzed by RT-qPCR with L1cam primers E25 (annealing to the YCAY cluster), E2 (annealing to the exon 2), I2 (annealing to the intron 2), E26 (annealing to exon 26), I26 (annealing to the intron 26) and I27 (annealing to the intron 27 and exon 28). Binding of NOVA2 was calculated as % of input (see Materials and methods). Black arrows in the top diagram show the annealing position of the three primer sets. Data are expressed as means ± SEM calculated from three independent experiments (n = 3). ***p<0.001.
Figure 4—figure supplement 1
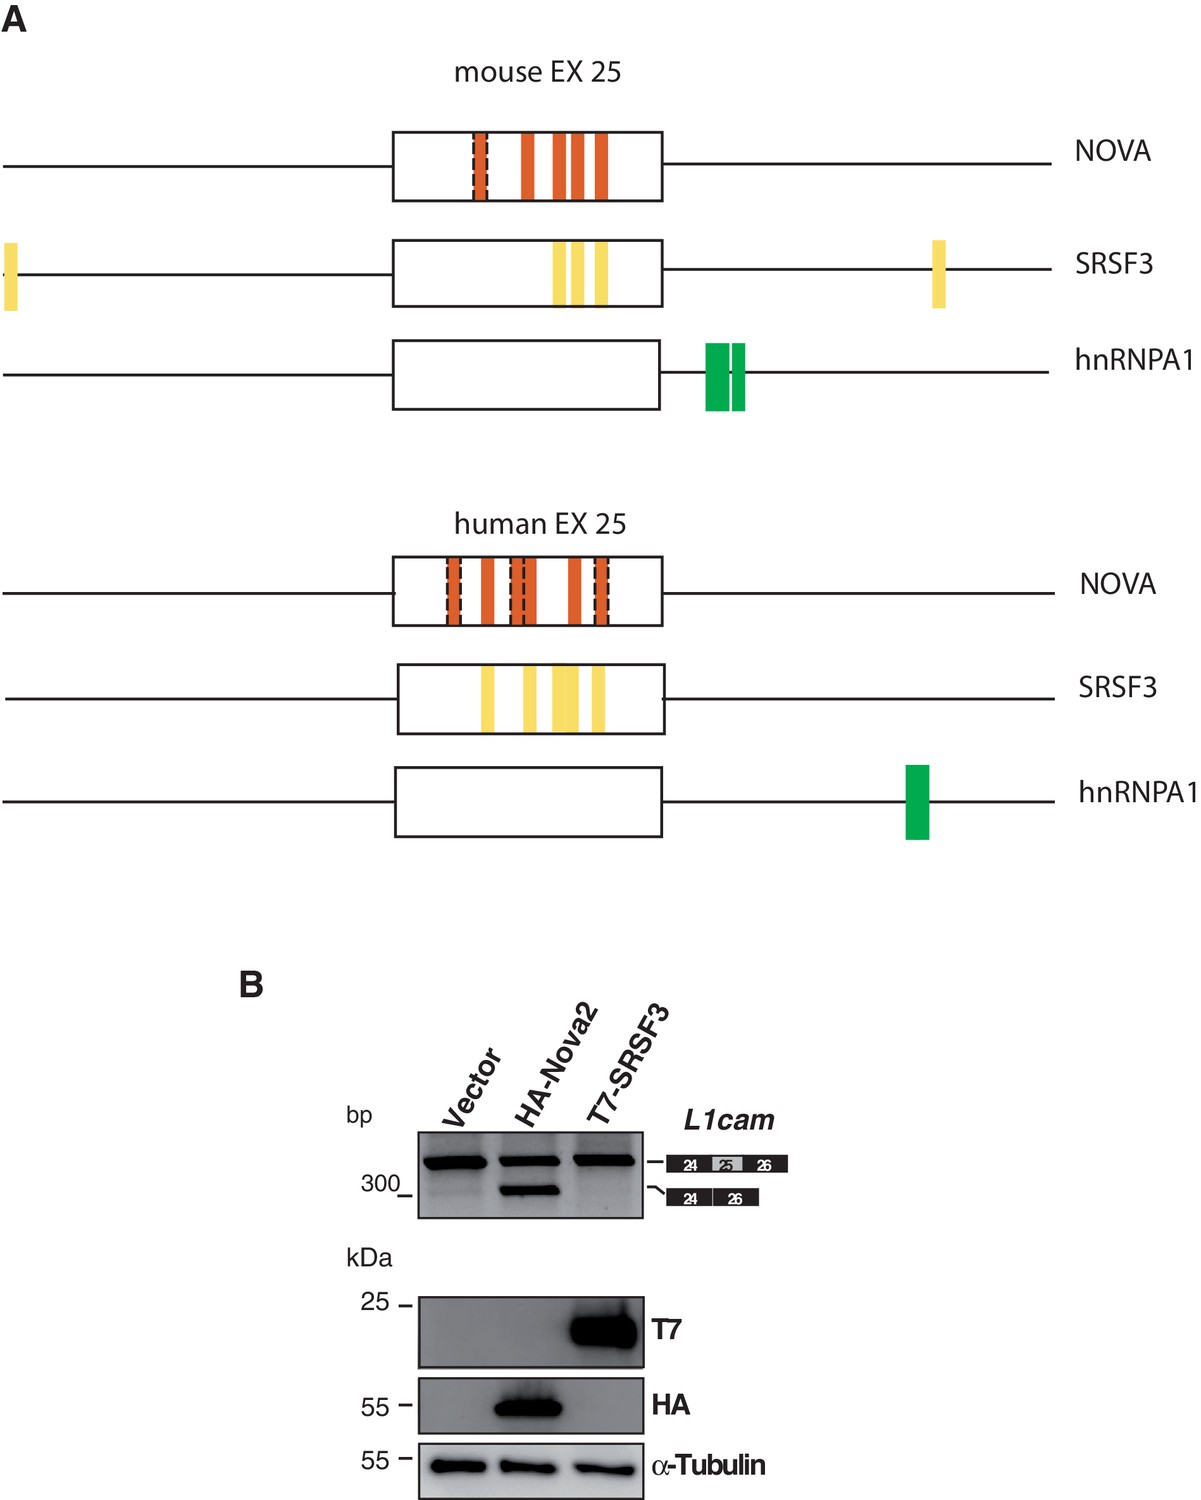
Evaluation of candidate SRFs on L1cam splicing.
(A) The L1cam mouse genomic region which encompasses exon 25 plus 200 nt upstream and 200 nt downstream was analysed with the SFmap program (http://sfmap.technion.ac.il/). The latter identified putative binding motifs for NOVA, SRSF3 and hnRNP A1. The following parameters were used: i) the presence of clusters of putative binding sites for SRFs that displays high binding affinity (score between 0,9 and 1; p≤0.005); ii) the evolutionary conservation of the identified motifs between the mouse and human gene; iii) the predicted ability of SRFs to promote exon 25 skipping. Dashed boxes indicate additional YCAY motifs identified by manual inspection based on the reported features of NOVA-binding sites (Ule et al., 2006) (B) AS of the p-L1 wild-type (WT) minigene co-transfected in HeLa cells with HA-NOVA2, T7-SRSF3 or the empty vector. The ectopic expression of each SRF was confirmed by western blotting with the indicated antibodies. Alpha-Tubulin was used as loading control.
Figure 4—figure supplement 2
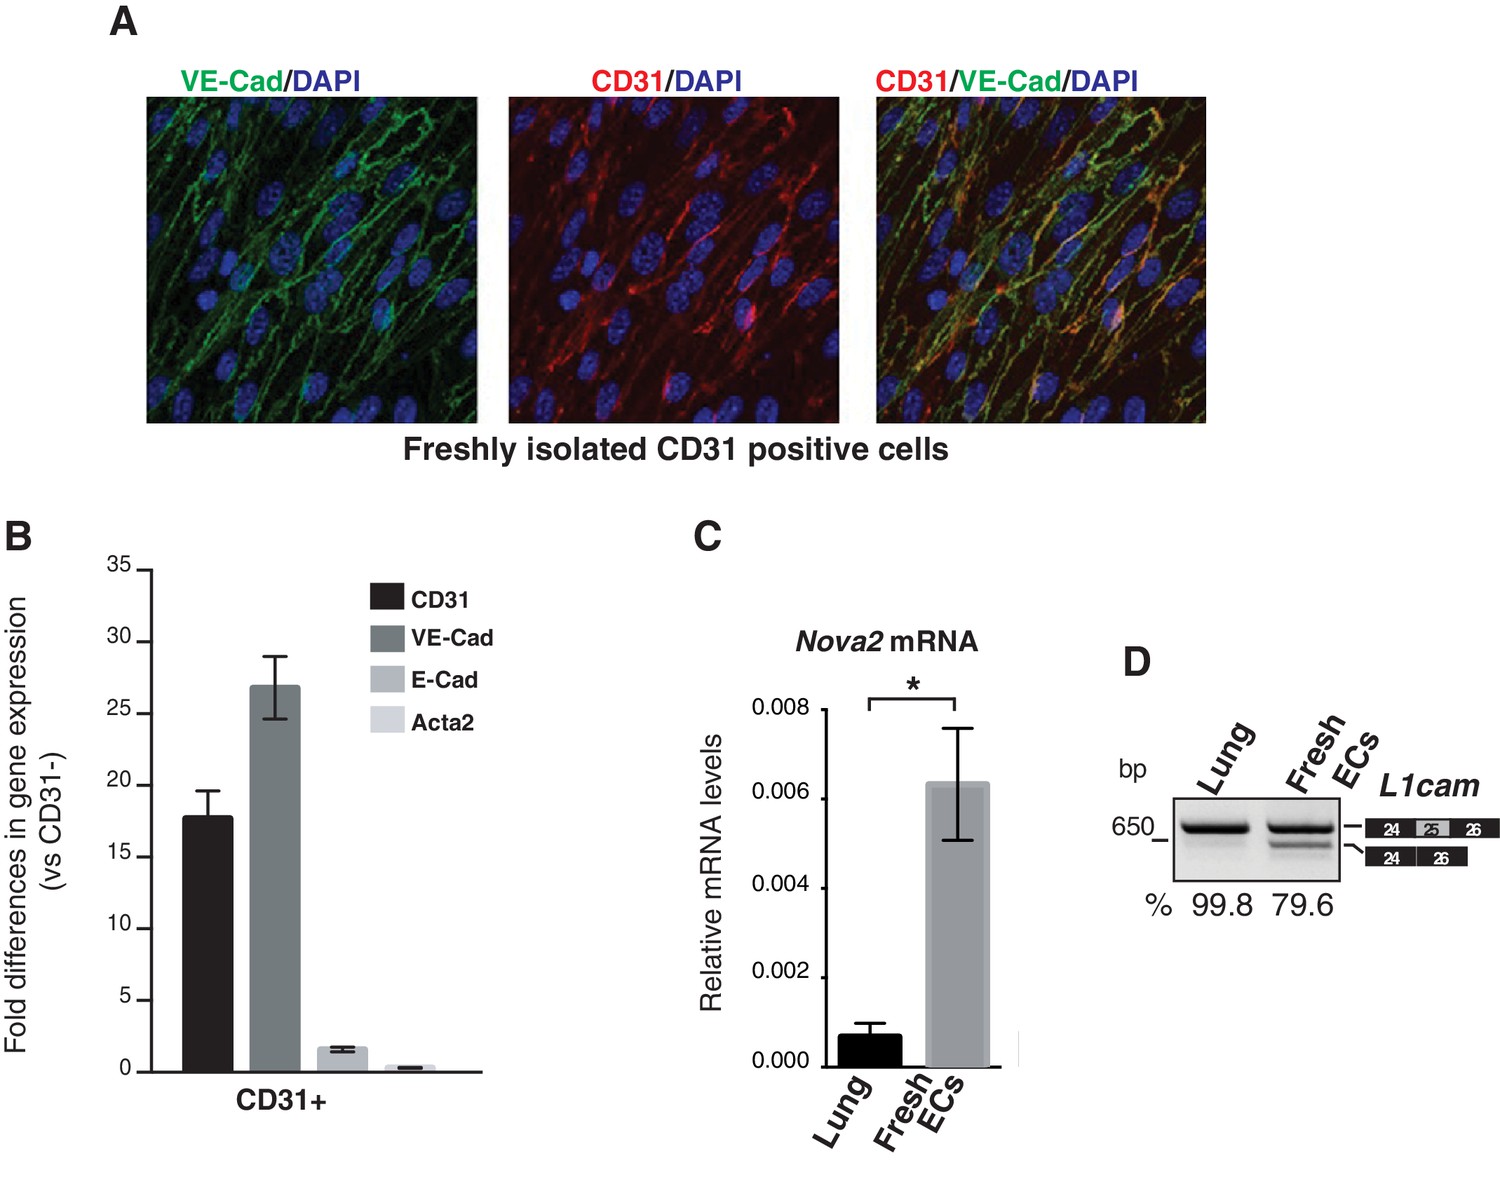
Nova2 expression levels and AS of L1cam in freshly purified mouse ECs.
(A) To validate the endothelial nature and assess the purity of mouse lung-derived ECs, CD31-positive cells (CD31+) were analyzed by immunofluorescence for the expression of the endothelial markers CD31 and VE-cadherin. Over 99% cells were positive for CD31 and VE-cadherin. (B) Expression levels of endothelial markers and non-endothelial markers (E-cadherin and Acta2) was also evaluated by RT-qPCR by comparing freshly purified CD31+ cells with their CD31- counterpart. A dramatic enrichment for endothelial markers, but not for E-cadherin and Acta2 was observed in CD31+ cells. The RT-qPCR was performed with the following assays from Applied Biosystems: CD31, assay no. mm00476702_m1; VE-cadherin, assay no. mm00486938_m1; E-cadherin, assay no. mm00486906_m1; Acta2, assay no. mm01546133_m1. (C, D) Nova2 mRNA expression levels (C) and AS of L1cam exon 25 (D) in whole mouse adult lung and in freshly purified lung ECs from mouse. The percentage of exon inclusion (the ratio between the L1cam transcripts containing exon 25 and total) was calculated from agarose gel quantification obtained by ImageJ program. All PCR products were verified by sequencing. Data indicate means ±SEM calculated from three independent experiments (n = 3). *p<0.05.
Figure 4—figure supplement 3
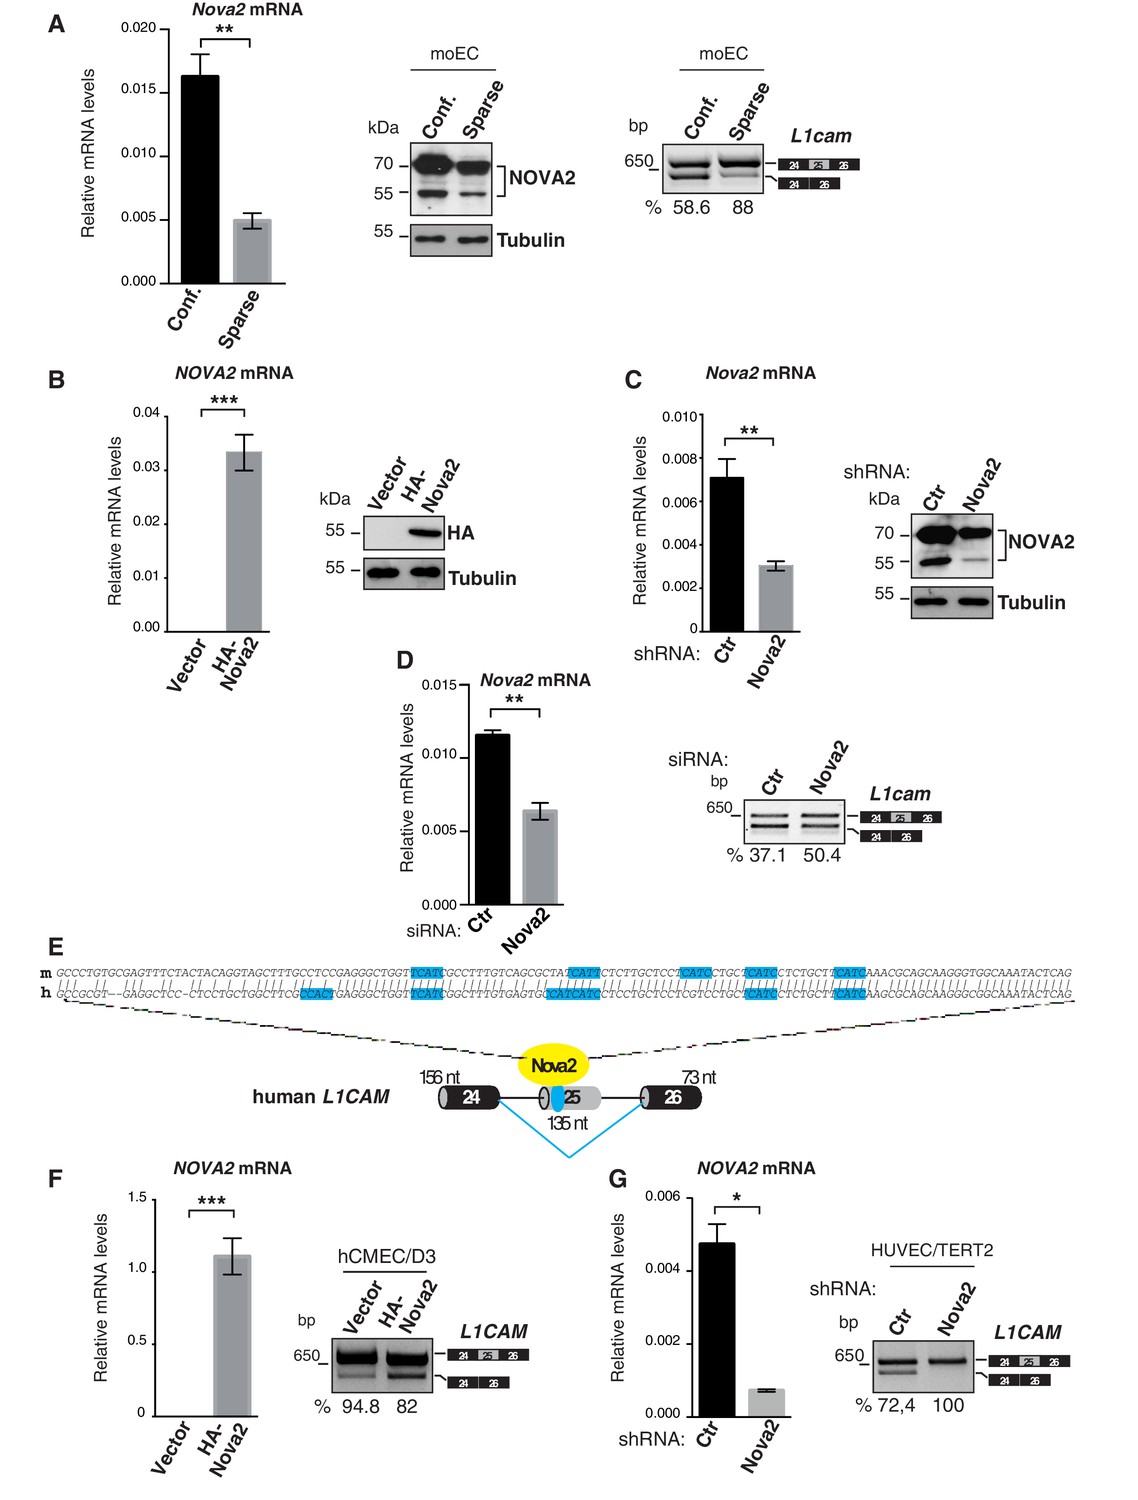
Density-dependent expression and genetic manipulation of Nova2 in mouse ECs and NOVA2-mediated splicing of L1CAM in human ECs.
(A) The expression of Nova2 mRNA (left) and protein (middle) is lower in moEC grown as sparse cells than as confluent monolayers (Conf). Accordingly, the skipping of L1cam exon 25 is reduced in sparse moEC as determined by RT-qPCR (right). (B) After transduction with HA-tagged NOVA2, moEC were cultured as sparse cells. Overexpression of HA-NOVA2 was verified at the mRNA (left) and at the protein levels (right). (C) After stable shRNA-mediated depletion of NOVA2, moEC were cultured as confluent monolayers. Both RT-qPCR and immunoblotting confirmed the down-regulation of endogenous NOVA2. Unlike ectopically expressed NOVA2, endogenous NOVA2 appeared as a double band as previously reported (Saito et al., 2016). (D) Nova2 expression and AS of L1cam exon 25 in control (Ctr) or Nova2-knockdown lu2EC (analyzed after reaching confluence). (E) Nucleotide alignment of human (h) and mouse (m) L1CAM exon 25 (top) and schematic representation of the human exon 25 with its flanking regions (bottom). The NOVA2-binding sites (YCAY motifs) are shown in blue. (F, G) NOVA2 mRNA expression levels and AS of L1CAM exon 25 in human ECs (hCMEC/D3) transduced with HA-tagged NOVA2 cDNA or the empty vector (F) and in HUVEC/TERT2 transfected with a siRNA against NOVA2 or with a control siRNA (G). The percentages of exon inclusion (the fraction of L1CAM transcripts containing exon 25 over total L1CAM) are indicated below the gel images. In all histograms, data indicate means ±SEM calculated from three independent experiments (n = 3); ***p<0.001; **p<0.01; *p<0.05.
Figure 5 with 2 supplements
L1CAM and NOVA2 are co-expressed in ovarian cancer vessels.
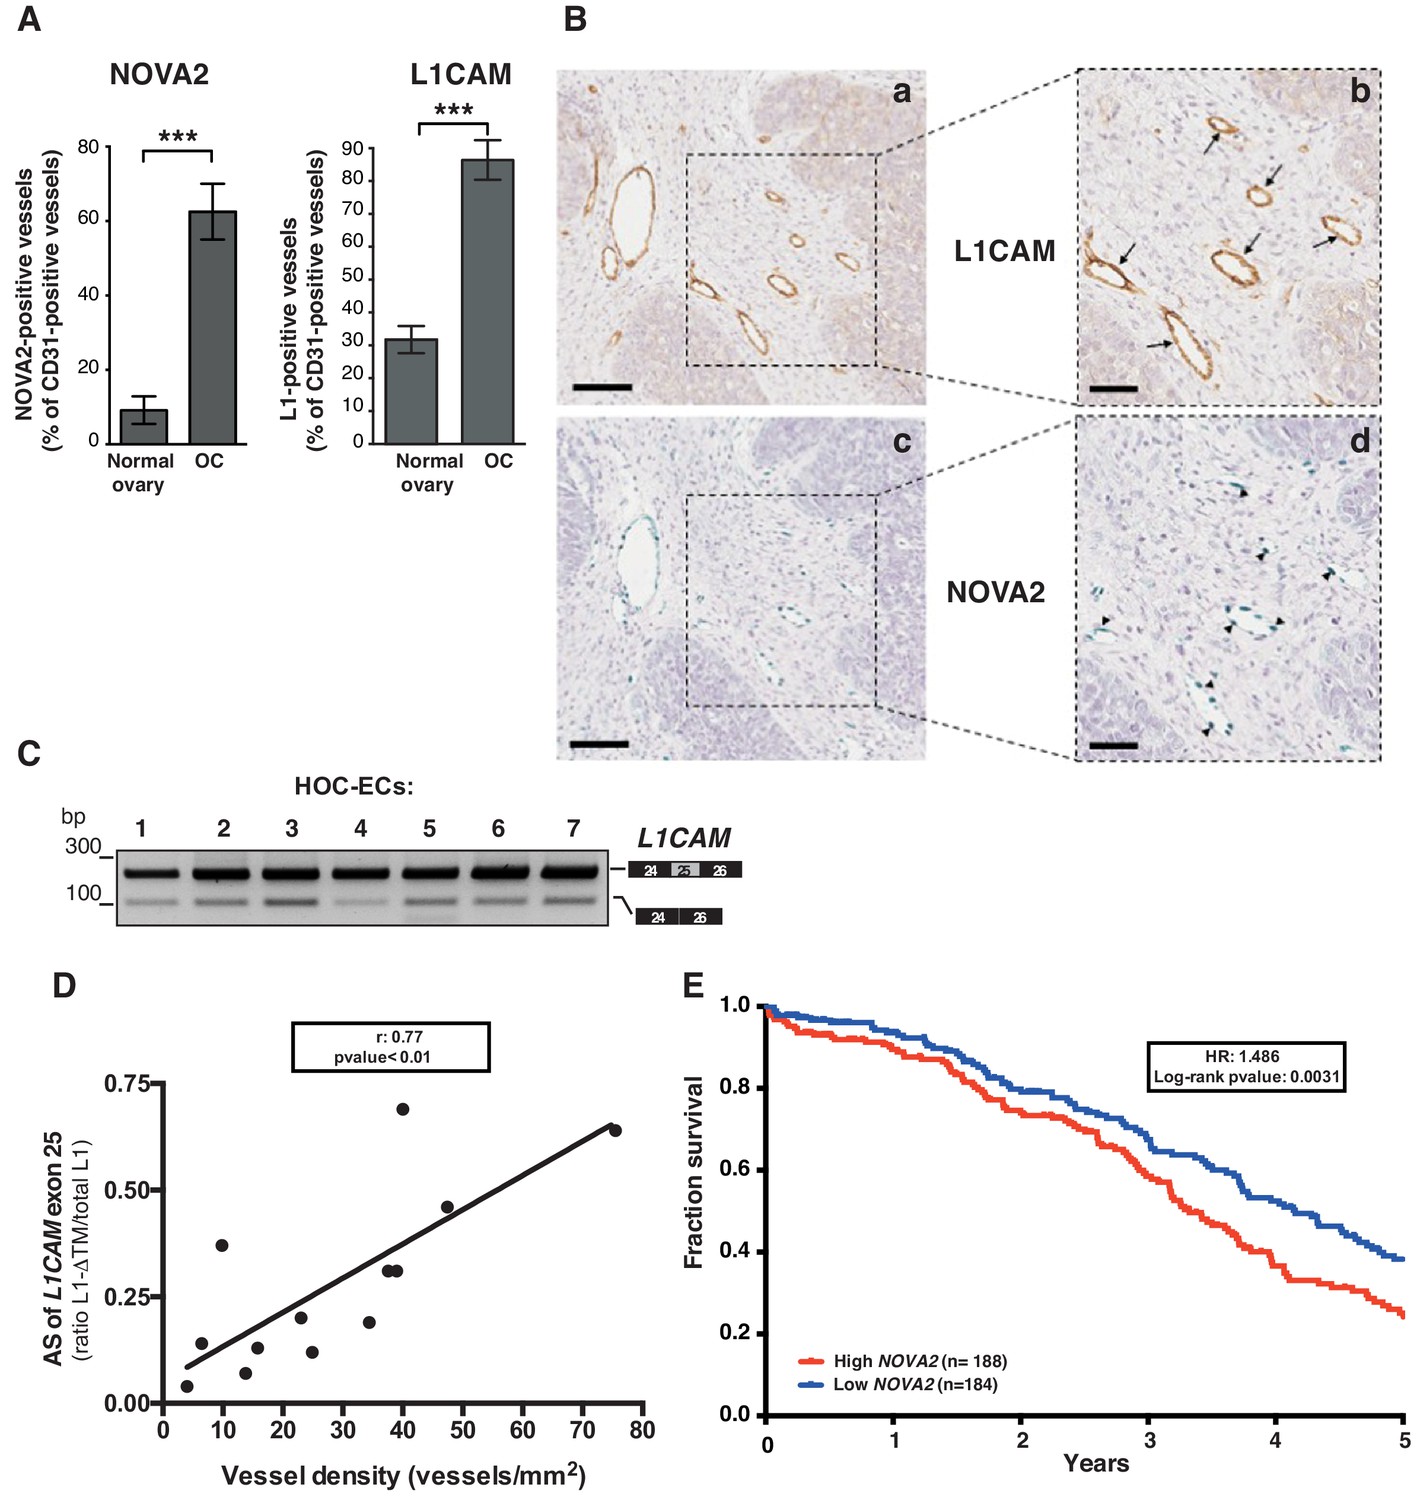
(A) Quantification of NOVA2- and L1CAM-positive vessels in healthy ovaries (n = 5) and high-grade serous ovarian cancer (OC) (n = 5). Data are expressed as the percentage of vessels positive for either NOVA2 (left) or L1CAM (right) over the total of CD31-positive vessels, and are shown as means ± SEM. Comparisons between experimental groups were done with two-sided Student’s t-test; ***p<0.001. (B) Serial sections of OC samples were stained for L1CAM (brown) or NOVA2 (green). Arrows indicate L1CAM-positive vessels (panels a and b), and arrowheads indicate NOVA2 staining in EC nuclei (panels c and d). The right panels (b, d) show higher magnification of the areas delimited by dashed boxes. Scale bars: 100 μm, panels a and c; 50 μm, panels b and d. (C) AS of the human L1CAM exon 25 in seven EC batches purified and cultured from human ovarian carcinoma (HOC-ECs). (D) The skipping of L1CAM exon 25 was measured in OC samples (n = 13) as the ratio between L1-ΔTM and total L1CAM (determined by gel quantitation of RT-PCR products; see Figure 5—figure supplement 2). Microvessel density was measured in the same samples by CD31 staining and correlated with the AS of L1CAM exon 25. (E) Kaplan-Meier plot of overall survival in OC patients classified according to NOVA2 expression (red curve, high expression; blue curve, low expression).
Figure 5—figure supplement 1
Expression of NOVA2 in OC and healthy ovarian vessels.
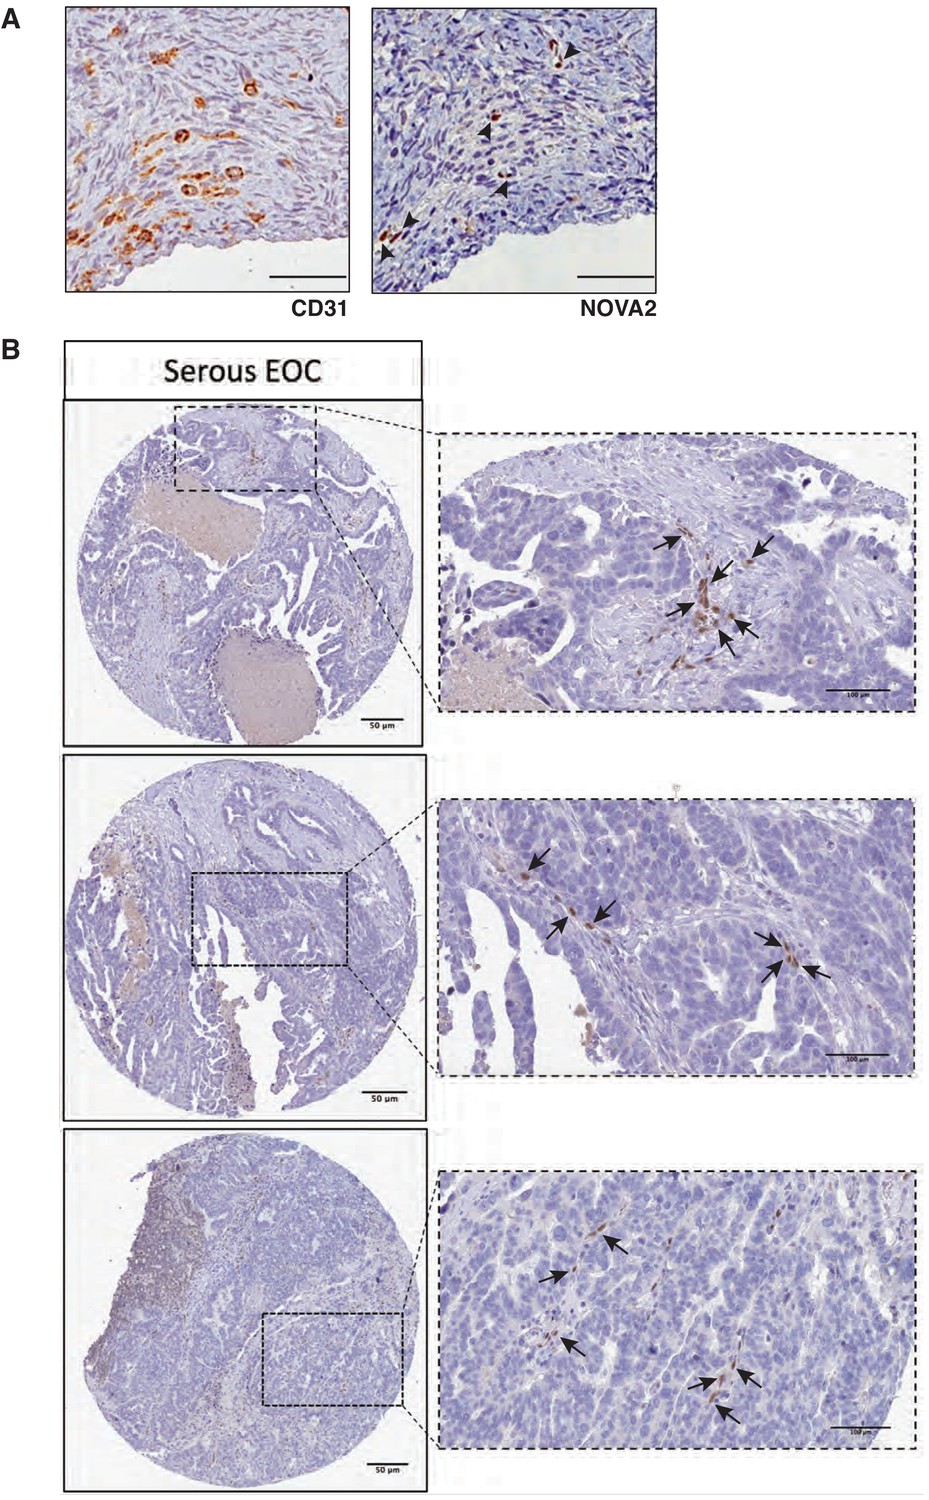
(A) Representative images of immunohistochemistry for the vessel marker CD31 (left) or NOVA2 (right) in serial sections of healthy human ovary. Among the numerous CD31-positive vessels, only a few exhibited expression and nuclear localization of NOVA2 (arrowheads). Scale bars, 50 μm. (B) Representative images of immunohistochemical staining for NOVA2 in OC samples from the Human Protein Atlas project. Images were downloaded at https://www.proteinatlas.org/ENSG00000104967-NOVA2/pathology/tissue/ovarian+cancer#Location available from v18.proteinatlas.org. Arrows indicate the NOVA2-positive nuclei of vascular ECs. Scale bars, 50 μm in low-magnification pictures, 100 μm in high-magnification pictures.
Figure 5—figure supplement 2
Co-localization of NOVA2 and L1CAM in OC vasculature and L1CAM splicing in OC samples.
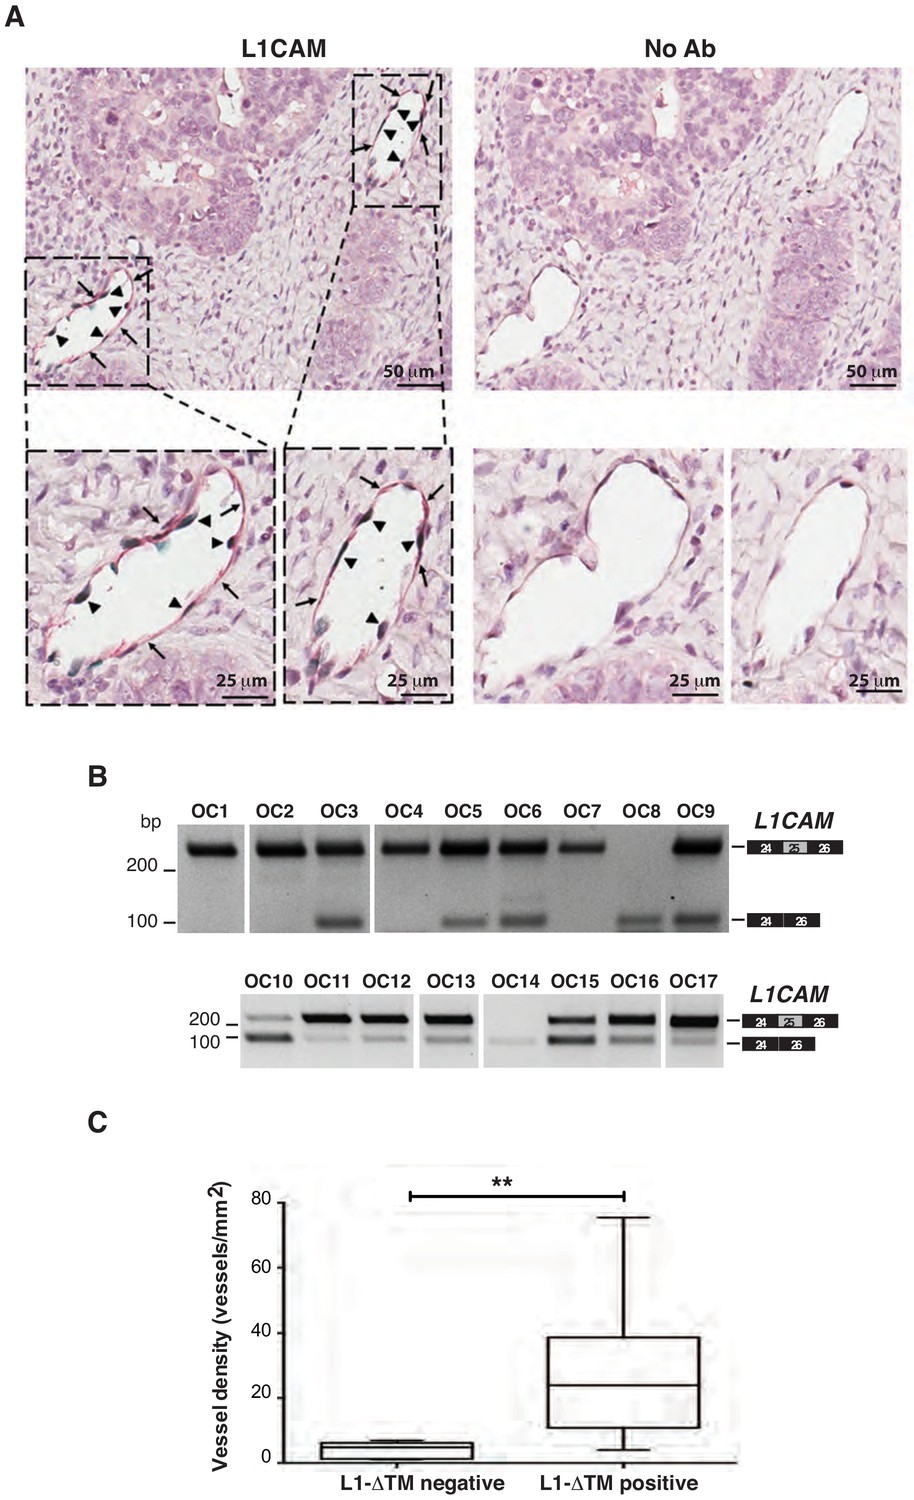
(A) Representative images of double immunohistochemistry for L1CAM (red) and NOVA2 (green) on human OC tissue sections (left panels). Consecutive sections were stained with no primary antibodies to assess background staining (right panels). Arrows indicate L1CAM-positive endothelium while arrowheads indicate NOVA2-positive EC nuclei within the same vessels. (B) AS of the human L1CAM exon 25 in 17°C samples. Intervening lanes have been removed as indicated by the white gaps. (C) Microvessel density was measured in OC samples (n = 17) previously stratified by RT-PCR into L1-ΔTM-positive and negative. Comparisons between experimental groups were done with two-sided Student’s t-test; *p<0.05.
Author response image 1

L1-ΔTM promotes endothelial tube formation.
Parental moEC were subjected to tube formation assays in the presence of the CM from moEC transduced with either the empty vector, L1-FL or L1- ΔTM. The CM from L1- ΔTM-expressing cells exhibited higher in vitroangiogenic potential than that from L1-FL- expressing cells or from control cells. **p<0.01; *p<0.05.
Author response image 2
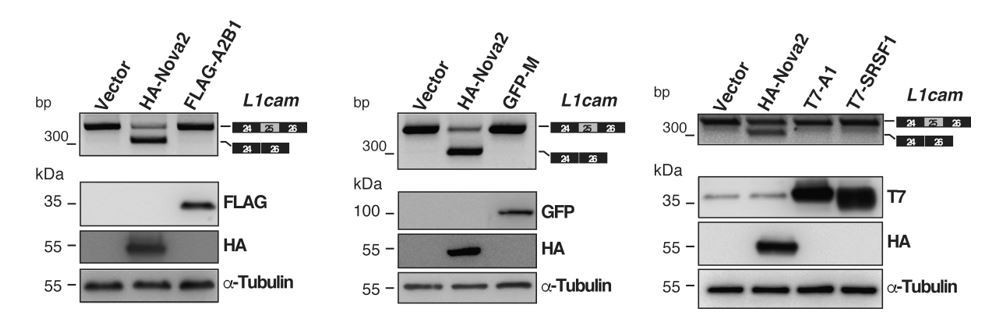
Evaluation of candidate splicing regulatory factors (SRFs) on L1cam splicing.
AS of the p-L1 wild- type WT minigene co-transfected in HeLa cells with either HA-NOVA2, FLAG-hnRNP A2B1 (FLAG-A2B1), GFP- hnRNP M (GFP-M) or the empty vector. Top panels show that, in contrast to NOVA2, none of the other SRFs affected the splicing of L1cam exon 25. Bottom panels show the ectopic expression of each SRF as revealed by western blotting with the indicated antibodies (α-Tubulin as loading control).
Videos
Video 1
L1-ΔTM promotes EC tube formation.
Time-lapse videomicroscopy of tube formation on moEC transduced either with the empty vector (A) or with L1-ΔTM (B).
Additional files
-
Supplementary file 1
Primers used in RT-PCR, RT-qPCR and cloning experiments.
- https://doi.org/10.7554/eLife.44305.017
-
Supplementary file 2
Information regarding the re-analysis of AS events affected by Nova2 depletion in ECs.
The table format corresponds to the default output table from vast-tools. Event_ID corresponds to the AS event identifier used in vast-tools and VastDB. Coordinate: coordinates are referred to NCBI37/mm9 genome assembly. Full_coordinate: full set of genomic coordinates of the AS event. AS_Type: Alt3/Alt5, alternative splice site acceptor/donor selection; IR, intron retention; AltEx, cassette alternative exons (including micro-exons when length ≤27 nt). For each sample, two columns provide AS information as obtained from vast-tools (PSI, Endoth_Nova2_cont/_KD-PSI and quality scores, Endoth_Nova2_cont/_KD-Q). Further details can be obtained at: https://github.com/vastgroup/vast-tools/blob/master/README.md#combine-output-format.
- https://doi.org/10.7554/eLife.44305.018
-
Transparent reporting form
- https://doi.org/10.7554/eLife.44305.019
Download links
A two-part list of links to download the article, or parts of the article, in various formats.
Downloads (link to download the article as PDF)
Open citations (links to open the citations from this article in various online reference manager services)
Cite this article (links to download the citations from this article in formats compatible with various reference manager tools)
A novel L1CAM isoform with angiogenic activity generated by NOVA2-mediated alternative splicing
eLife 8:e44305.
https://doi.org/10.7554/eLife.44305


