Cryo-EM structures and functional characterization of the murine lipid scramblase TMEM16F
- University of Zurich, Switzerland
- University of Groningen, Netherlands
Figures
Figure 1 with 1 supplement
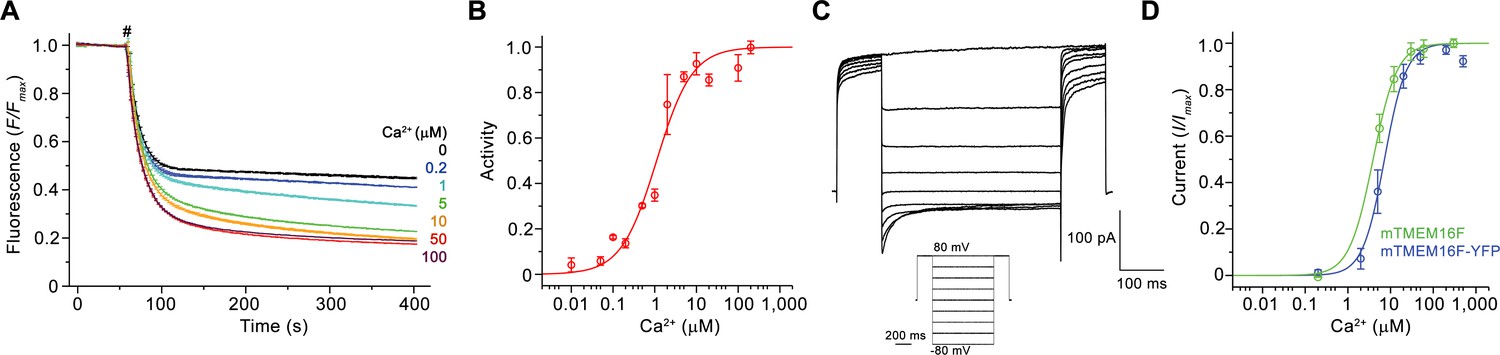
Functional characterization of mTMEM16F.
(A) Ca2+-dependence of scrambling activity in mTMEM16F-containing proteoliposomes. Traces depict fluorescence decrease of tail-labeled NBD-PE lipids after addition of dithionite (#) at different Ca2+ concentrations. Data show averages of three technical replicates. (B) Ca2+ concentration-response relationship of mTMEM16F scrambling (EC50 = 1.1 μM, n = 1.0). Data show mean of six independent experiments from three protein reconstitutions. (C) Representative current traces at 200 μM Ca2+ recorded from inside-out patches excised from HEK293 cells transiently expressing a mTMEM16F-YFP fusion construct. Inset shows voltage protocol. (D) Ca2+ concentration-response relationship of currents recorded from inside-out patches of a stable HEK293 cell-line expressing mTMEM16F (green, EC50 = 3.9 μM, n = 1.6) and from HEK293 cells transiently expressing a mTMEM16F-YFP fusion construct (blue, EC50 = 7.2 μM, n = 1.7). Data show mean of five (stable cell-line) and seven biological replicates (transfected cells). B, D Solid lines show fit to a Hill equation. A, B, D, errors are s.e.m..
Figure 1—figure supplement 1
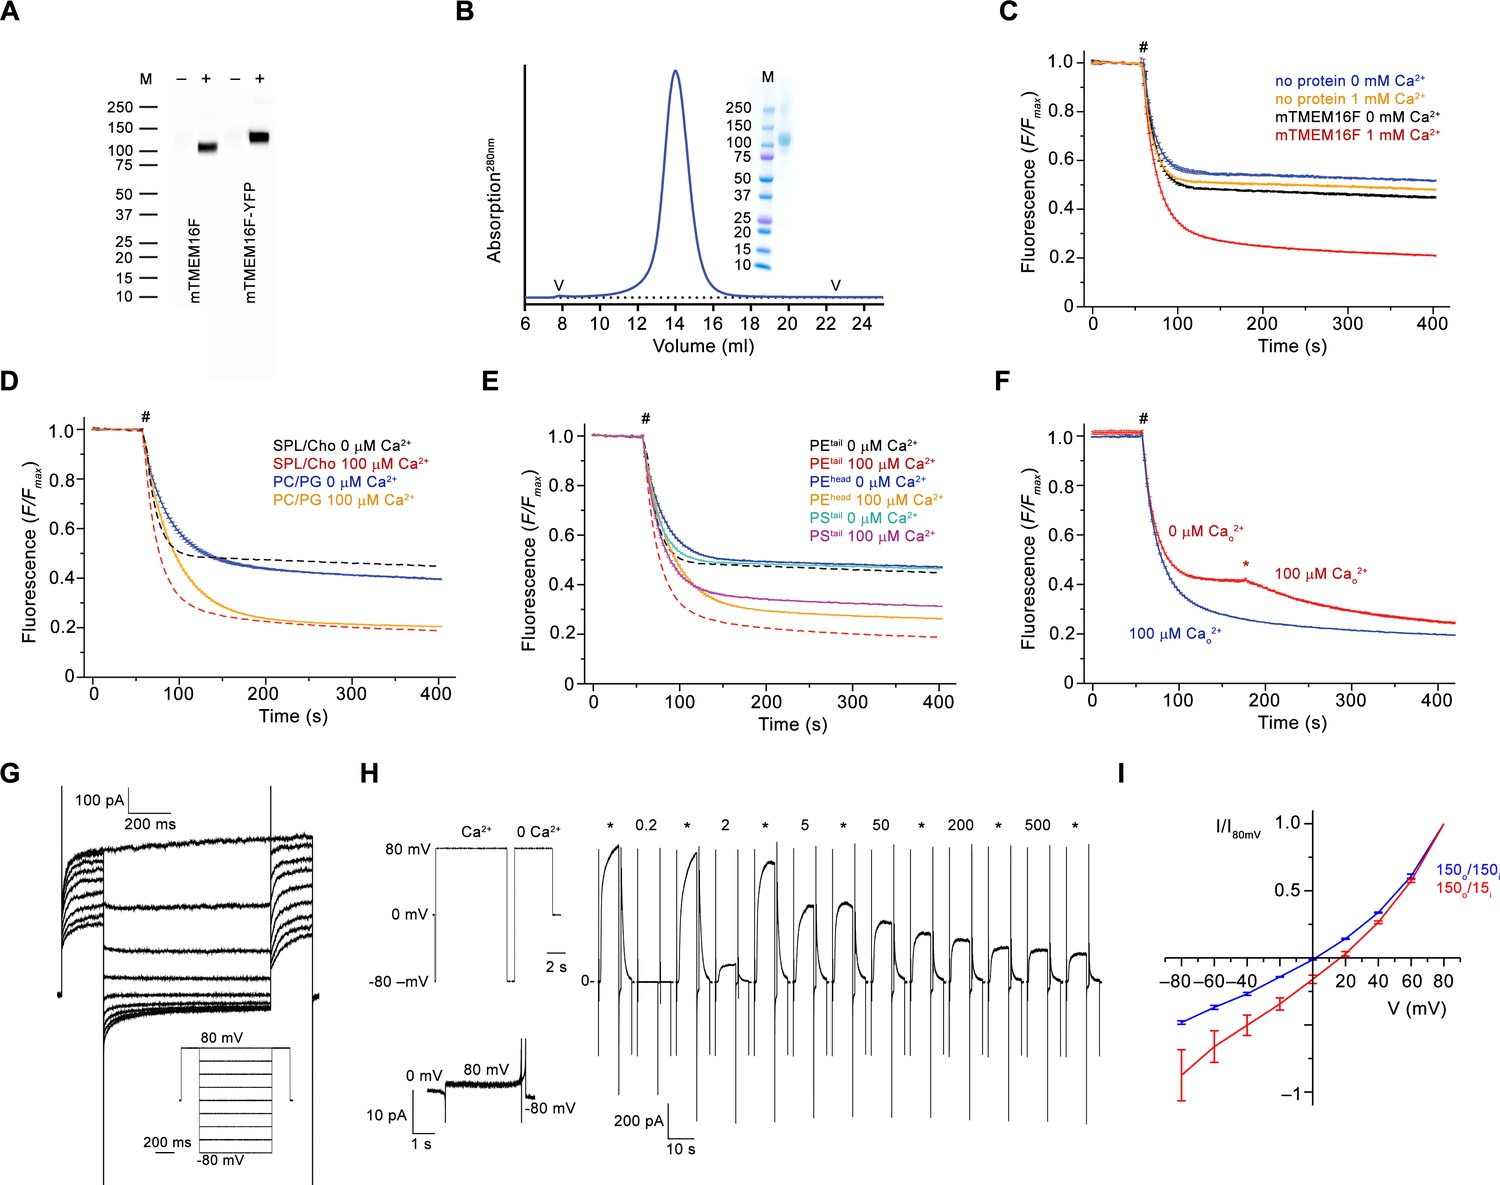
Biochemistry and functional characterization.
(A) Western blot of stable cell-lines expressing mTMEM16F before (–) and after (+) induction with tetracycline. mTMEM16F and a C-terminal YFP fusion (mTMEM16F-YFP) were detected with a mouse monoclonal anti-Myc and a Peroxidase Affinipure goat anti-mouse IgG antibodies. (B) Size-exclusion chromatogram of purified mTMEM16F in digitonin. ‘V’ indicates void and dead volumes of the column. Inset shows SDS-Page of peak fractions. The molecular weight marker (M) and corresponding masses (kDa) are indicated. (C) Fluorescence-based lipid transport assay in liposomes containing soybean polar lipids and cholesterol used throughout the study. The fluorescence of tail-labeled NBD-PE was quenched by addition of dithionite (#) to the outside, which leads to a reduction of the fluorescence to about half in liposomes not containing any protein. The reduction in mTMEM16F-containing proteoliposomes in the absence of Ca2+ underlines the poor activity of the protein in absence of its ligand. The stronger decrease at high Ca2+ concentration reflects activity of mTMEM16F as lipid scramblase. The fluorescence at the plateau is due to lipids that are not accessible to dithionite. (D) Comparison of mTMEM16F scrambling activity in proteoliposomes of different lipid composition. Solid lines depict data from proteoliposomes containing a PC/PG mixture used for reconstitution into nanodiscs, which show a Ca2+-activated activity that proceeds with slower kinetics and larger basal activity compared to soybean and cholesterol containing liposomes (C, dashed line). (E) Scrambling of proteoliposomes with different labeled lipids. mTMEM16F is capable of scrambling tail-labeled NBD-PS (PStail) and head-labeled NBD-PE (PEhead), thus underlining its poor substrate specificity. Data for tail-labeled NBD-PE used for most experiments (c, dashed line) are shown for comparison. (F) Rapid activation of mTMEM16F is shown by addition of Ca2+ (*) 120 s after the addition of dithionite (#), which causes a further decrease of the fluorescence due to the exposure of labeled lipids that are transported from the inner leaflet following the activation of the scramblase (red). Proteoliposomes that were pre-incubated with Ca2+ on their outside before addition of dithionite are shown in blue for comparison. (C–F) Traces show average of three experiments from the same reconstitution. Errors are s.e.m.. # indicates addition of dithionite. (G) Representative current traces at 200 μM Ca2+ recorded from inside-out patches excised from HEK 293 cells stably expressing mTMEM16F. Inset shows voltage protocol. (H) Representative current response of mTMEM16F at different Ca2+ concentrations measured in excised inside-out patches. Numbers indicate Ca2+ concentration (µM), * indicates reference pulses recorded at 20 µM Ca2+ used for rundown correction. Individual sweeps are separated by a regular time interval (15–18 s) and are concatenated to form a continuous trace. Insets (left) shows voltage protocol used for each sweep in all concentration-response relationships throughout the study (top) and the leak currents at applied voltages in the absence of Ca2+ (bottom). (I) Normalized I-V relationships of mTMEM16F at symmetric (blue) and in a 10-fold gradient of the NaCl concentration (red) recorded from the instantaneous response following a voltage jump. The apparent decreased rectification in asymmetric conditions results from the low intracellular ion concentration. The osmolarity was adjusted by addition of NMDG-sulfate. The shift in the reversal potential in asymmetric conditions indicates a slight selectivity for cations over anions (PNa+/PCl-=2.7 when assuming a negligible conductance of NMDG-sulfate). Data show averages of three biological replicates, errors are s.e.m.
Figure 2 with 7 supplements
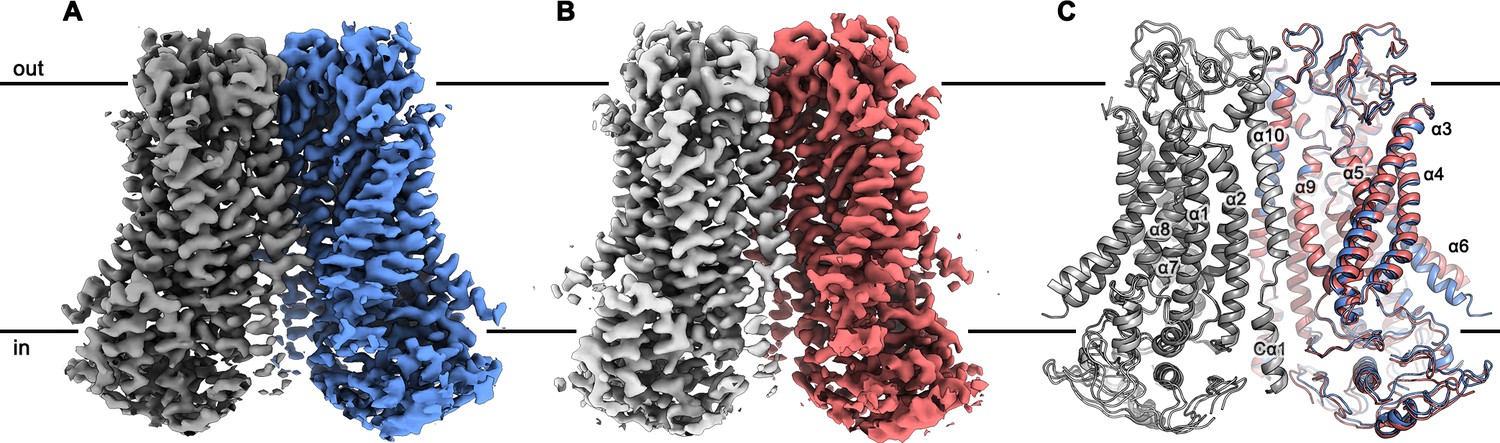
mTMEM16F structures.
Cryo-EM map of mTMEM16F in digitonin in presence (A) and absence (B) of calcium at 3.2 Å and 3.6 Å, respectively. (C) Cartoon representation of a superposition of the Ca2+-bound (blue and grey) and Ca2+-free mTMEM16F (magenta and light grey) dimer. Both structures superimpose with a root mean square deviation (RMSD) of 1.2 Å. Transmembrane helices are labelled and the membrane boundary is indicated.
Figure 2—figure supplement 1
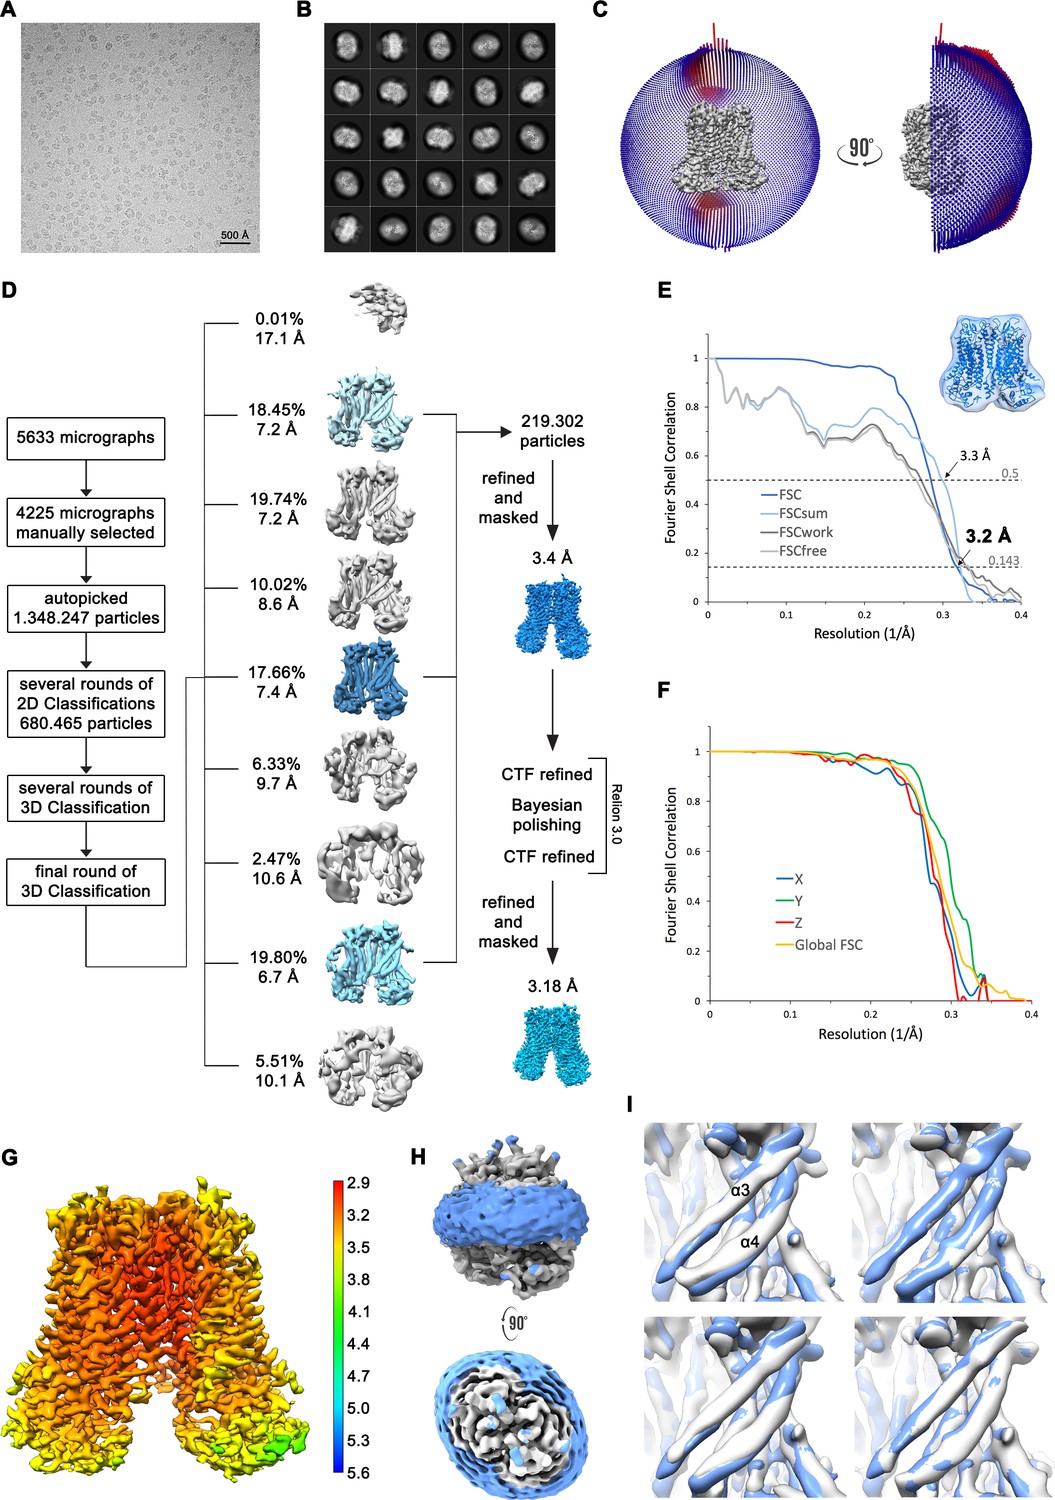
Structure determination of mTMEM16F in complex with Ca2+ in digitonin.
(A) Representative cryo-EM image and (B) 2D-class averages of vitrified mTMEM16F in a Ca2+-bound state in digitonin. (C) Angular distribution plot of particles included in the final C2-symmetric 3D reconstruction. The number of particles with their respective orientation is represented by length and color of the cylinders. (D) Image processing workflow. (E) FSC plot used for resolution estimation and model validation. The gold-standard FSC plot between two separately refined half-maps is shown in dark blue and indicates a final resolution of 3.18 Å. FSC validation curves for FSCsum, FSCwork and FSCfree, as described in Materials and methods, are shown in light blue, dark grey and light grey, respectively. A thumbnail of the mask used for FSC calculation overlaid on the atomic model is shown in the upper right corner and thresholds used for FSCsum of 0.5 and for FSC of 0.143 are shown as dashed lines. (F) Anisotropy estimation plot of the final map. The global FSC curve is represented in yellow. The directional FSCs along the x, y and z axis displayed in blue, green and red, respectively, are indicative for an isotropic dataset. (G) Final reconstruction map colored by local resolution as estimated by Relion. (H) Representation of the map including the detergent micelle (low-pass filtered to 6.5 Å) reveals no noticeable distortion of the micelle (blue). (I) Analysis of structural heterogeneity, by subjecting the final dataset to another round of 3D classification, reveals alternative conformations of α3 and α4. Shown are superpositions of obtained 3D classes (grey) on the final cryo-EM map (blue), low-pass filtered to 6.5 Å.
Figure 2—figure supplement 2

Structure determination of mTMEM16F in absence of Ca2+ in digitonin.
(A) Representative cryo-EM image and (B) 2D-class averages of vitrified mTMEM16F in a Ca2+-free state in digitonin. (C) Angular distribution plot of particles included in the final C2-symmetric 3D reconstruction. The number of particles with their respective orientation is represented by length and color of the cylinders. (D) Image processing workflow. (E) FSC plot used for resolution estimation and model validation. The gold-standard FSC plot between two separately refined half-maps is shown in red and indicates a final resolution of 3.6 Å. FSC validation curves for FSCsum, FSCwork and FSCfree, as described in Materials and methods, are shown in orange, dark grey and light grey, respectively. A thumbnail of the mask used for FSC calculation overlaid on the atomic model is shown in the upper right corner and threshold used for FSCsum of 0.5 and for FSC of 0.143 are shown as dashed lines. (F) Anisotropy estimation plot of the final map. The global FSC curve is represented in yellow. The directional FSCs along the x, y and z axis shown in blue, green and red, respectively, are indicative for a largely isotropic dataset. (G) Final reconstruction map colored by local resolution as estimated by Relion. (H) Representation of the map including the detergent micelle (low-pass filtered to 6.5 Å) reveals no noticeable distortion of the micelle (red). (I) Analysis of structural heterogeneity, by subjecting the final dataset to another round of 3D classification, reveals no alternative conformations of α3 and α4. Shown are superpositions of obtained 3D classes (grey) on the final cryo-EM map (magenta), low-pass filtered to 6.5 Å.
Figure 2—figure supplement 3
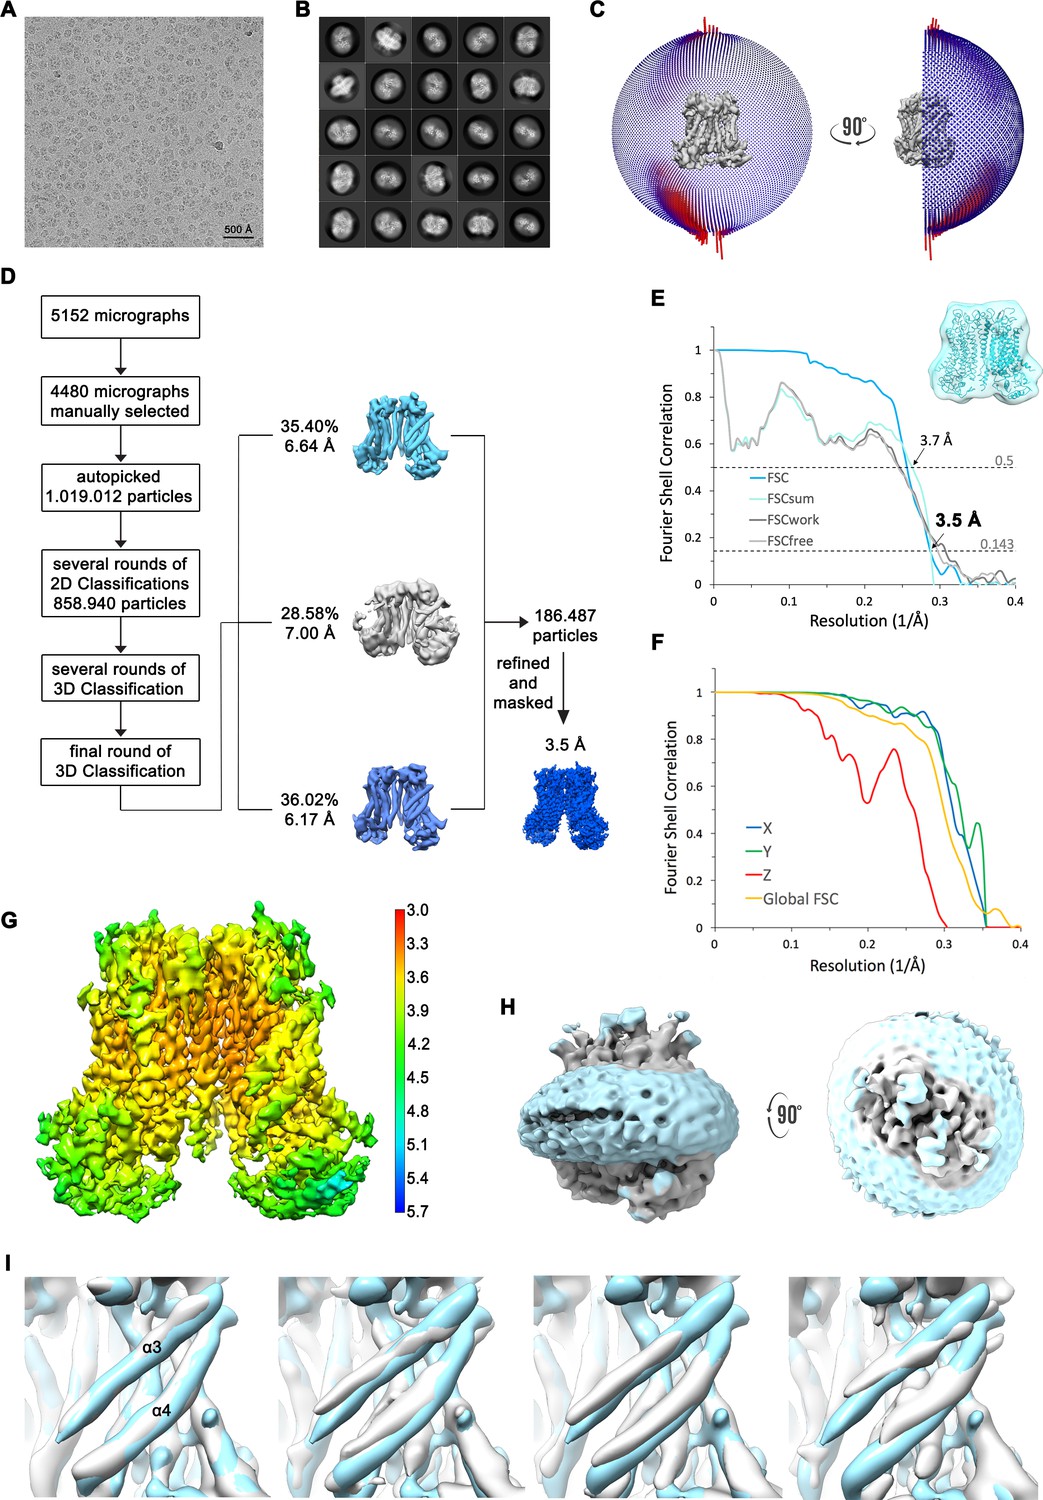
Structure determination of mTMEM16F in complex with Ca2+ in nanodisc.
(A) Representative cryo-EM image and (B) 2D-class averages of vitrified mTMEM16F in a Ca2+-bound state in nanodiscs. (C) Angular distribution plot of particles included in the final C2-symmetric 3D reconstruction. The number of particles with their respective orientation is represented by length and color of the cylinders. (D) Image processing workflow. (E) FSC plot used for resolution estimation and model validation. The gold-standard FSC plot between two separately refined half-maps is shown in blue and indicates a final resolution of 3.5 Å. FSC validation curves for FSCsum, FSCwork and FSCfree, as described in Materials and methods, are shown as light blue, dark grey and light grey, respectively. A thumbnail of the mask used for FSC calculation overlaid on the atomic model is shown in the upper right corner and threshold used for FSCsum of 0.5 and for FSC of 0.143 are shown as dashed lines. (F) Anisotropy estimation plot of the final map. The global FSC curve is represented in yellow. The directional FSCs along the x, y and z axis are shown in blue, green and red, respectively, and indicate a dataset that is to some extent anisotropic. (G) Final reconstruction map colored by local resolution as estimated by Relion. (H) Representation of the map including the nanodisc (low-pass filtered to 6.5 Å) reveals no noticeable distortion of the nanodisc (light blue). (I) Analysis of structural heterogeneity, by subjecting the final dataset to another round of 3D classification, reveals alternative conformations of α3 and α4. Shown are superpositions of obtained 3D classes (grey) on the final cryo-EM map (light blue), low-pass filtered to 6.5 Å.
Figure 2—figure supplement 4
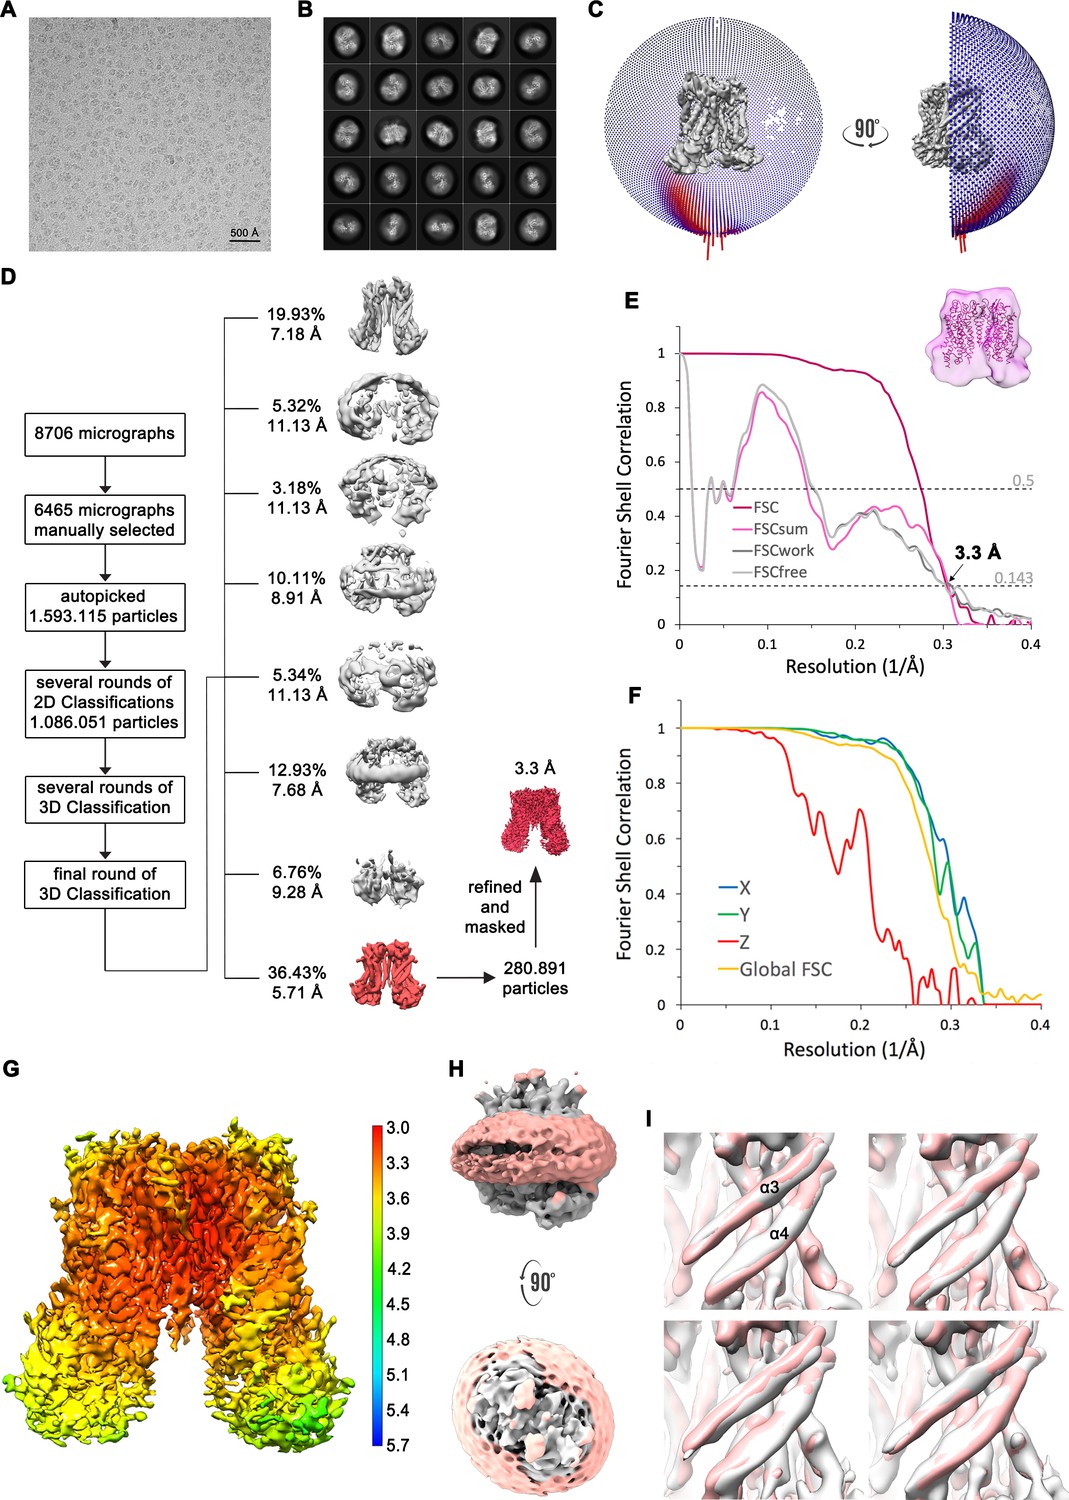
Structure determination of mTMEM16F in absence of Ca2+ in nanodiscs.
(A) Representative cryo-EM image and (B) 2D-class averages of vitrified mTMEM16F in a Ca2+-free state in nanodiscs. (C) Angular distribution plot of particles included in the final C2-symmetric 3D reconstruction. The number of particles with their respective orientation is represented by length and color of the cylinders. (D) Image processing workflow. (E) FSC plot used for resolution estimation and model validation. The gold-standard FSC plot between two separately refined half-maps is shown in red and indicates a final resolution of 3.3 Å. FSC validation curves for FSCsum, FSCwork and FSCfree, as described in Materials and methods, are shown as magenta, dark grey and light grey, respectively. A thumbnail of the mask used for FSC calculation overlaid on the atomic model is shown in the upper right corner and threshold used for FSCsum of 0.5 and for FSC of 0.143 are shown as dashed lines. (F) Anisotropy estimation plot of the final map. The global FSC curve is represented in yellow. The directional FSCs along the x, y and z axis are shown in blue, green and red, respectively, reveal a strongly anisotropic dataset, which compromises a detailed interpretation of the map. (G) Final reconstruction map colored by local resolution as estimated by Relion. (H) Representation of the map including the nanodisc (low-pass filtered to 6.5 Å) reveals no noticeable distortion of the nanodisc (light red). (I) Analysis of structural heterogeneity, by subjecting the final dataset to another round of 3D classification, reveals no alternative conformations of α3 and α4. Shown are superpositions of obtained 3D classes (grey) on the final cryo-EM map (light red), low-pass filtered to 6.5 Å.
Figure 2—figure supplement 5
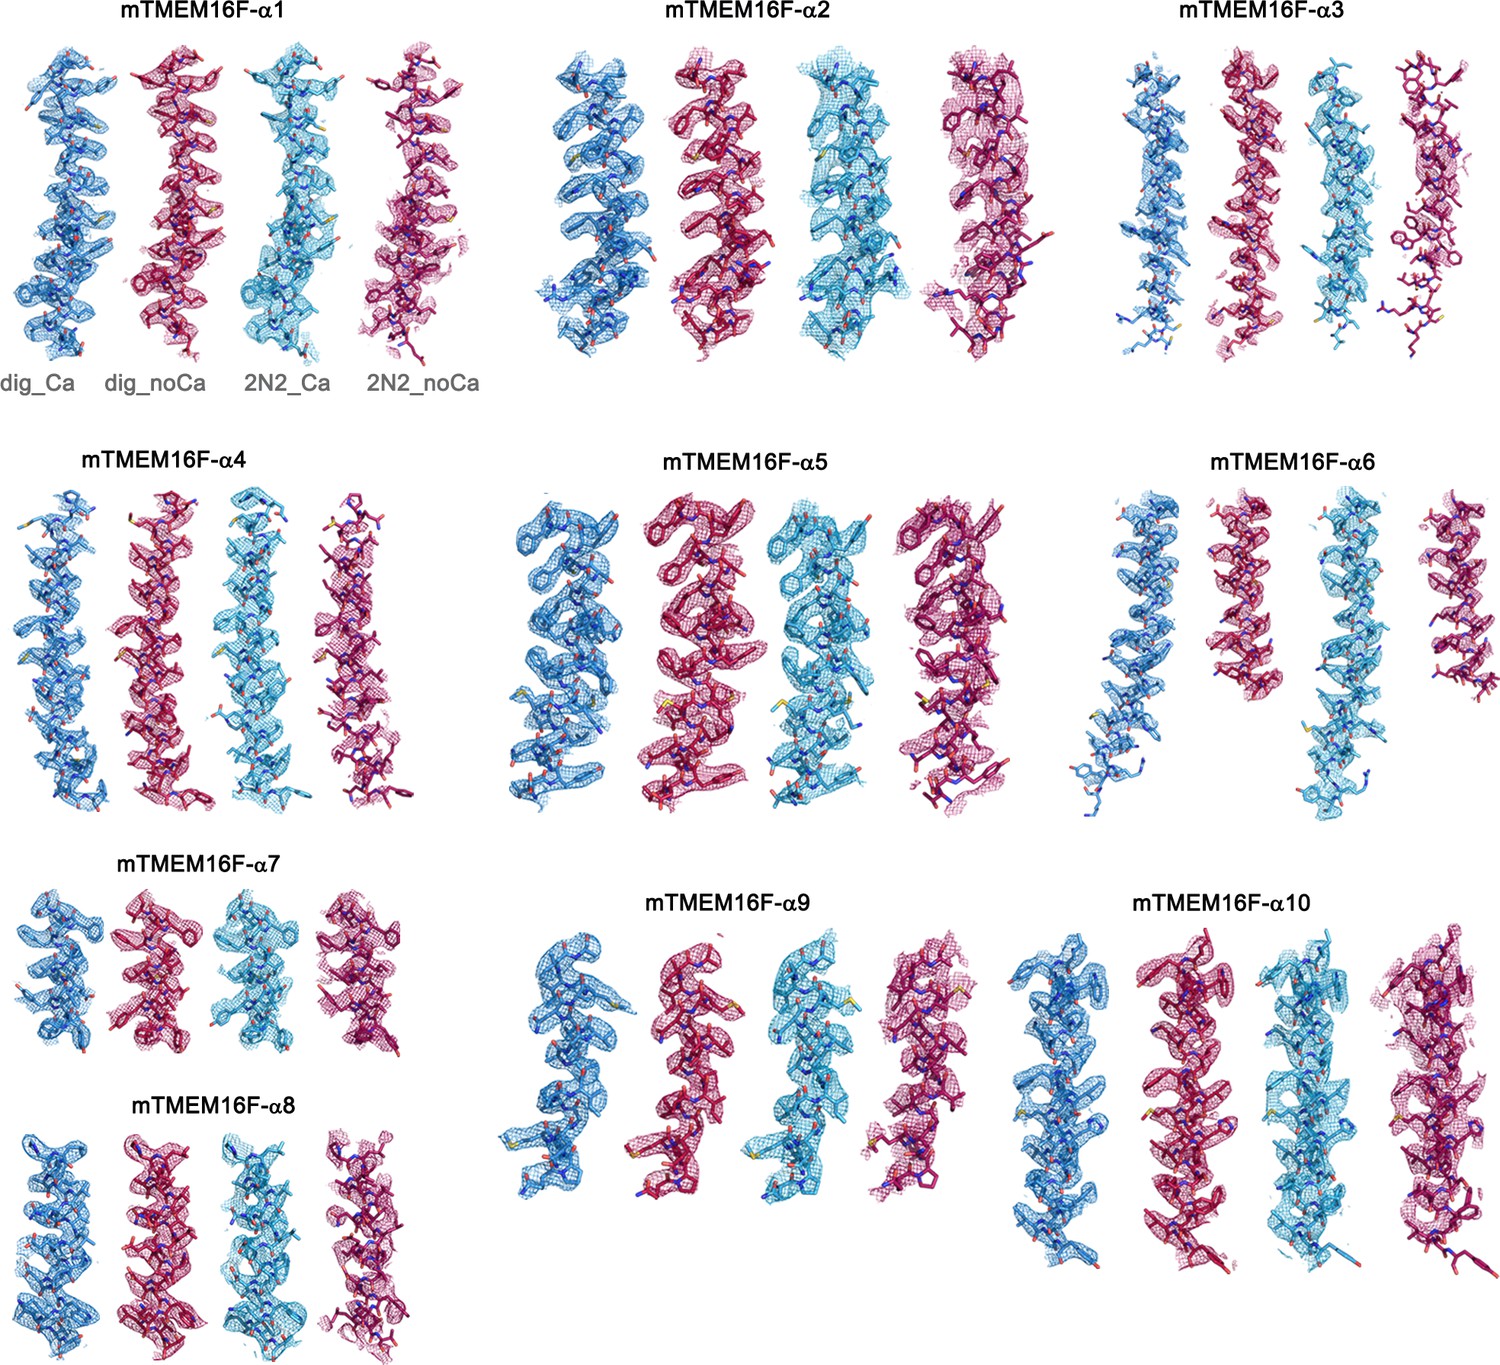
Cryo-EM Density Maps.
Sections of the cryo-EM density of all four mTMEM16F maps superimposed on the respective refined models. Models are shown as sticks and structural elements are labelled. mTMEM16F Ca2+-bound in digitonin is colored in blue, mTMEM16F Ca2+-free in digitonin in red, mTMEM16F Ca2+-bound in nanodiscs in light blue and mTMEM16F Ca2+-free in nanodiscs in magenta. Maps were sharpened with a b-factor of –94, –139, –121 and –131 Å2 and contoured at 4.7 σ, 4.7 σ, 6.5 σ and 6.5 σ, respectively.
Figure 2—figure supplement 6
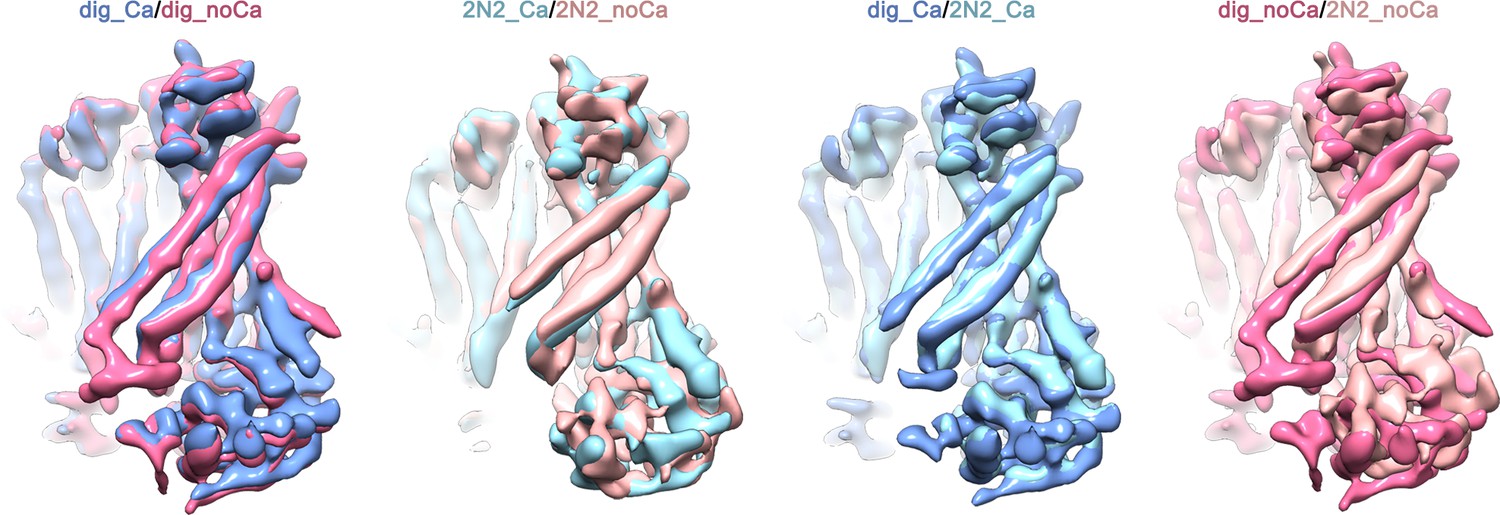
Superpositions of the four final cryo-EM maps.
mTMEM16F in presence of calcium is shown in dark blue in digitonin and in light blue when reconstituted in nanodiscs. mTMEM16F in absence of calcium is shown in magenta in digitonin and in coral when reconstituted in nanodiscs. For a better comparison all maps were low-pass filtered to 6.5 Å. The conformational differences observed for α3 and α4 between the datasets obtained in digitonin and nanodiscs might hint towards a lipid-dependent conformational transition.
Figure 2—figure supplement 7
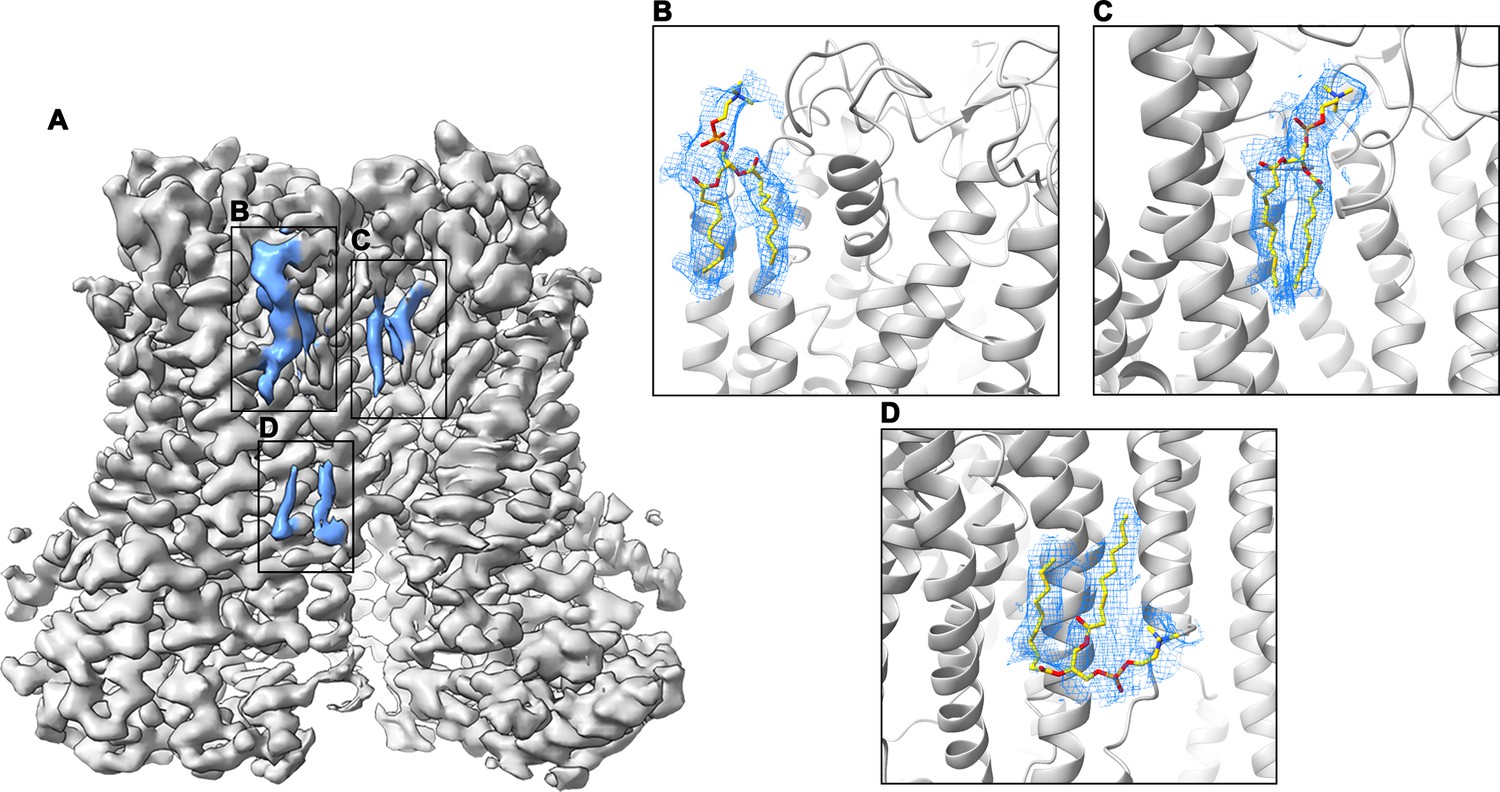
Cryo-EM density of lipids at the dimer interface.
(A) Cryo-EM map of mTMEM16F in digitonin in the presence of Ca2+ (grey). Residual density at the dimer interface is highlighted in blue. (B–D) Close-up of putative lipid densities (blue mesh) with modelled phosphatidylcholine. The protein is shown as grey ribbon. The map was low-pass filtered to 6.5 Å.
Figure 3 with 2 supplements
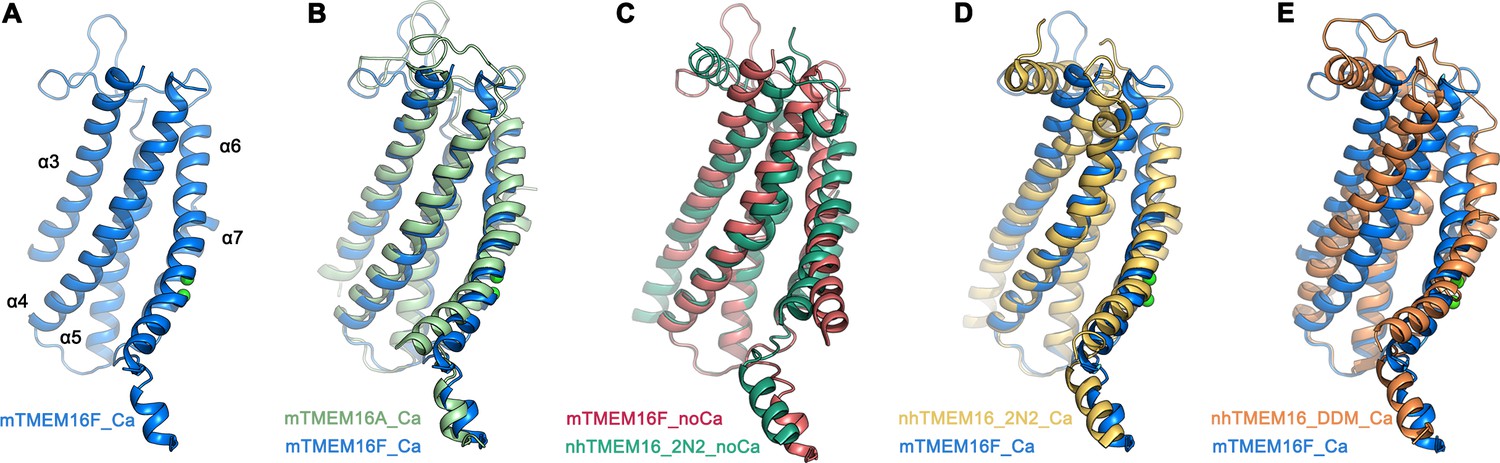
Comparison of the ‘subunit cavity’ of TMEM16 homologues.
(A) ‘Subunit cavity’ in the Ca2+-bound mTMEM16F structure composed of α-helices 3–7 (blue). (B) Superposition of the ‘subunit cavity’ between the Ca2+-bound structures of mTMEM16F (blue) and the anion channel mTMEM16A (PDBID 5OYB (Paulino et al., 2017a), green). (C) Superposition of the ‘subunit cavity’ between the Ca2+-free structure of mTMEM16F (magenta) and the Ca2+-free structure of the fungal scramblase nhTMEM16 in nanodiscs (PDBID 6QM4 (Kalienkova et al., 2019), teal) displaying a closed state of the scramblase. (D) Superposition of the Ca2+-bound structure of mTMEM16F (blue) with a Ca2+-bound conformation of nhTMEM16 in nanodiscs (PDBID 6QMA (Kalienkova et al., 2019), yellow) displaying an intermediate state of the scramblase. (E) Superposition of the Ca2+-bound structure of mTMEM16F (blue) with a Ca2+-bound conformation of nhTMEM16 in detergents (PDBID 6QM5 (Kalienkova et al., 2019), orange) displaying an open state of the scramblase.
Figure 3—figure supplement 1
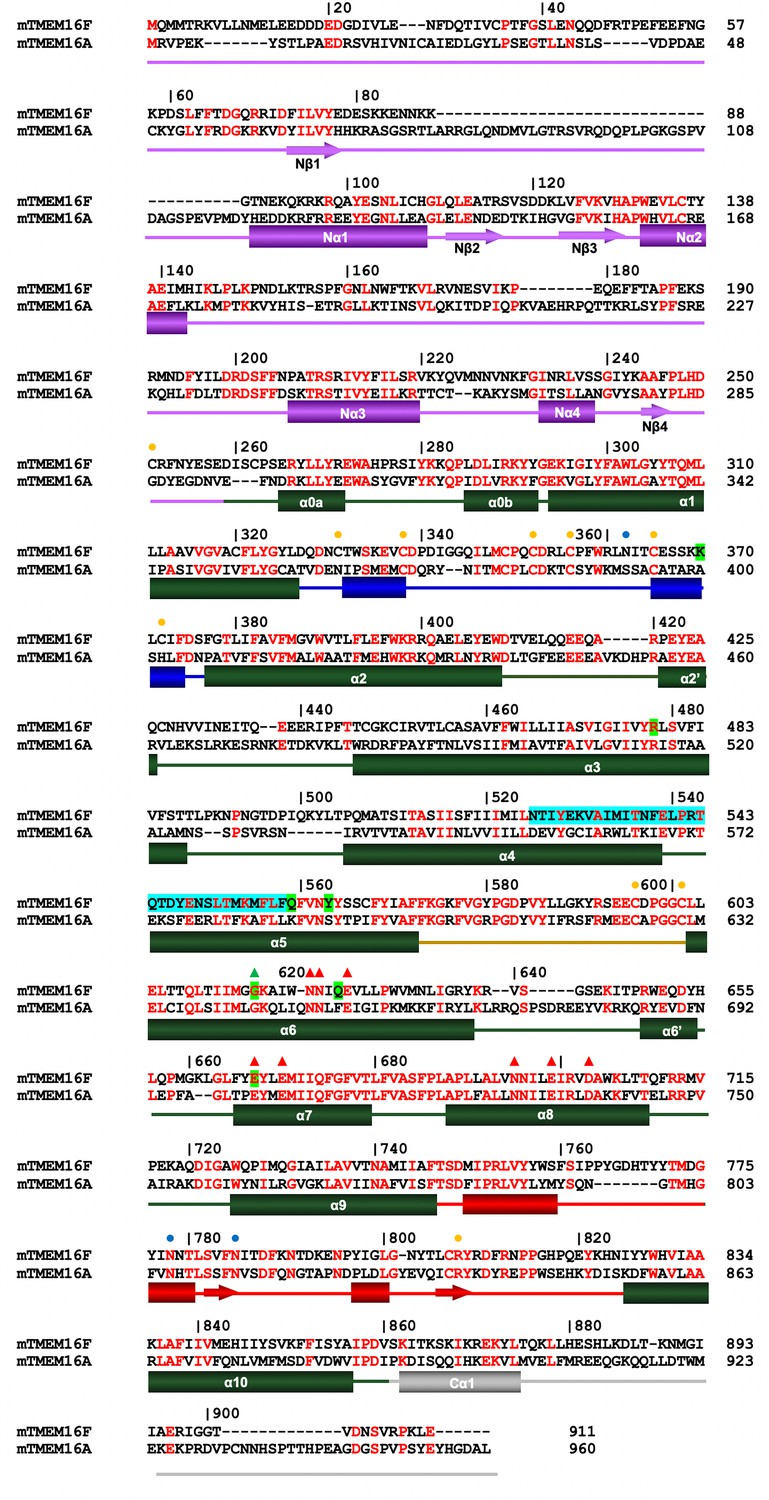
Sequence alignment.
Protein sequences of murine TMEM16F (UniProt: Q6P9J9.1) and murine TMEM16A (UniProt: Q8BHY3.2) were aligned with Clustal Omega (Sievers et al., 2011). Numbering corresponds to mTMEM16F. Secondary structure elements: green, transmembrane domain; violet, N-terminal domain; grey, C-terminal region; blue, α1–α2 loop; beige, α5–α6 loop; red, α9–α10 loop. Boundary of secondary structure elements refers to mTMEM16F. Orange circles mark the position of cysteines involved in disulfide bonds, blue circles mark putative sites of glycosylation indicated by residual density in the cryo-EM map. Red triangles correspond to residues of the Ca2+-binding site and the green triangle to the hinge for conformational rearrangements in α6. The SCRD is highlighted in cyan and positions mutated in this study in green.
Figure 3—figure supplement 2
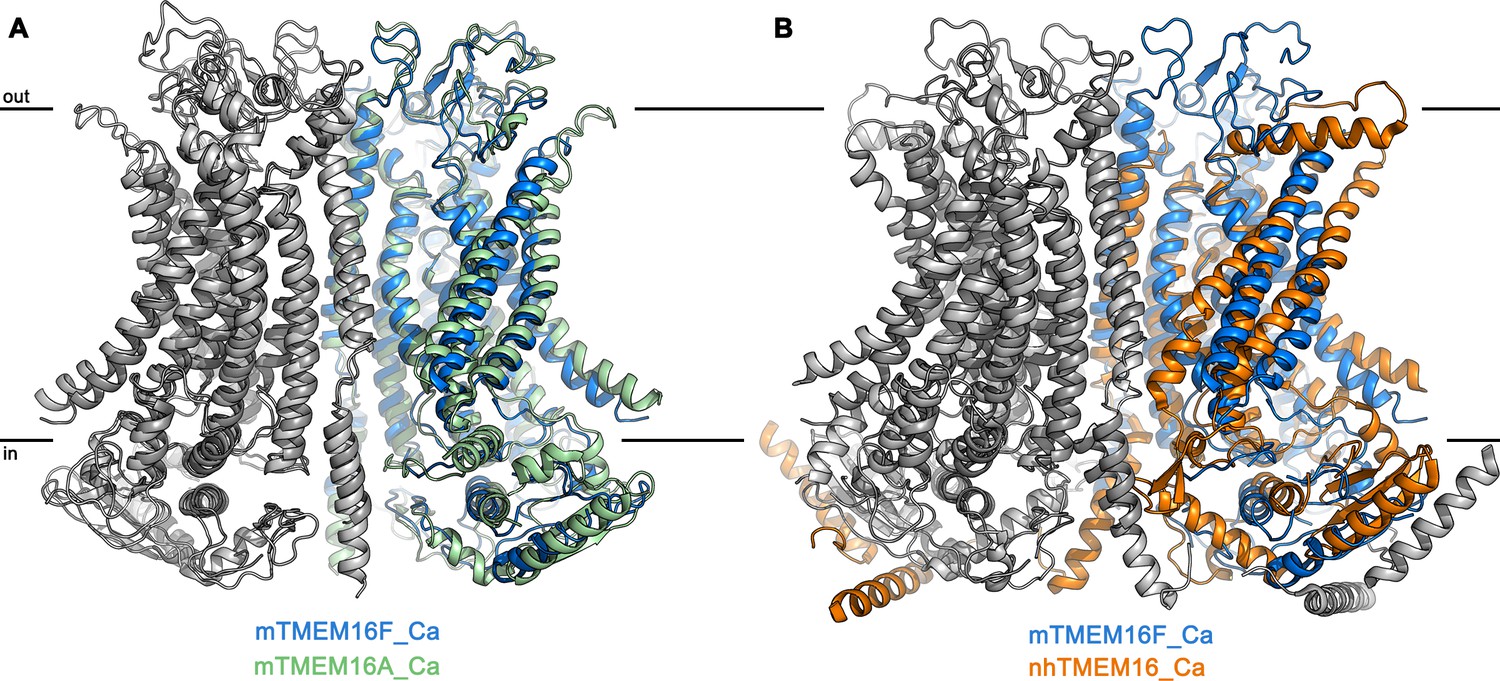
Superposition of TMEM16 dimers.
(A) Superposition of the Ca2+-bound structures of mTMEM16F in digitonin (blue and grey) and the anion channel mTMEM16A (PDBID 5OYB (Paulino et al., 2017a), green and grey). (B) Superposition of the Ca2+-bound structures of mTMEM16F (blue and grey) and the fungal scramblase nhTMEM16 (PDBID 6QM5 (Kalienkova et al., 2019), orange and grey). A, B, The view is as in Figure 2C.
Figure 4 with 1 supplement
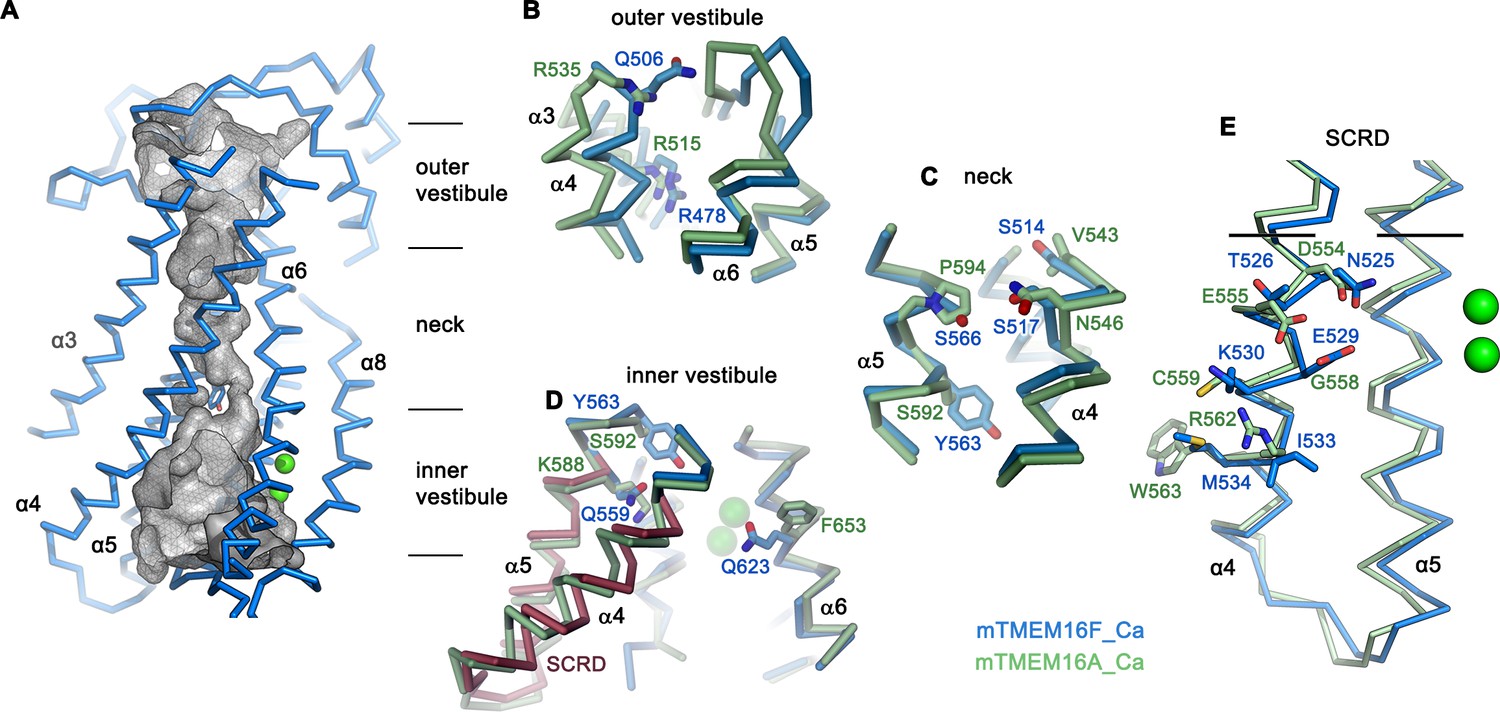
Pore region of mTMEM16F.
(A) ‘Subunit cavity’ in the Ca2+-bound state of mTMEM16F showing the putative ion conduction pore. Grey mesh shows pore surface (sampled with probe radius of 1 Å). (B to D) Superposition of selected pore regions of mTMEM16F (blue) and the anion channel mTMEM16A (green, remodeled version of PDBID 5OYB, see Materials and methods) along the extracellular vestibule (B), the neck (C) and the intracellular vestibule, with the 35 amino acid long scrambling domain (SCRD) on α4 and α5 of mTMEM16F highlighted in brown (D). (E) View of the SCRD rotated by about 90° relative to D. The SCRD boundary is indicated by black lines. A-E, Selected residues are displayed as sticks, bound calcium ions as green spheres.
Figure 4—figure supplement 1

Structural features of the pore region and electrostatics.
(A) View of the catalytic regions in a superposition of mTMEM16F (blue) and mTMEM16A (green, remodeled version of PDBID 5OYB, see Materials and methods). The SCRD is colored in brown. Selected residues are displayed as sticks. Labels and numbers correspond to mTMEM16F. (B) Diameter of the putative pores of mTMEM16F (blue) and mTMEM16A (green) as calculated by HOLE (Smart et al., 1996) from the extracellular (out) to the intracellular side (in). The positions of Arg 478 and Tyr 563 are indicated. (C) Electrostatic profile calculated along the pore regions of mTMEM16F (blue) and mTMEM16A (green, dashed, obtained from Paulino et al., 2017a). The potential is less positive in mTMEM16F for most of the pore, consistent with the observed slight preference for cations over anions. Due to its narrow diameter, the potential in the neck is less accurate. * indicates location of the Ca2+-binding site. B,C, The positions of Arg 478 and Tyr 563 are indicated and the region of the neck is highlighted in grey.
Figure 5 with 2 supplements

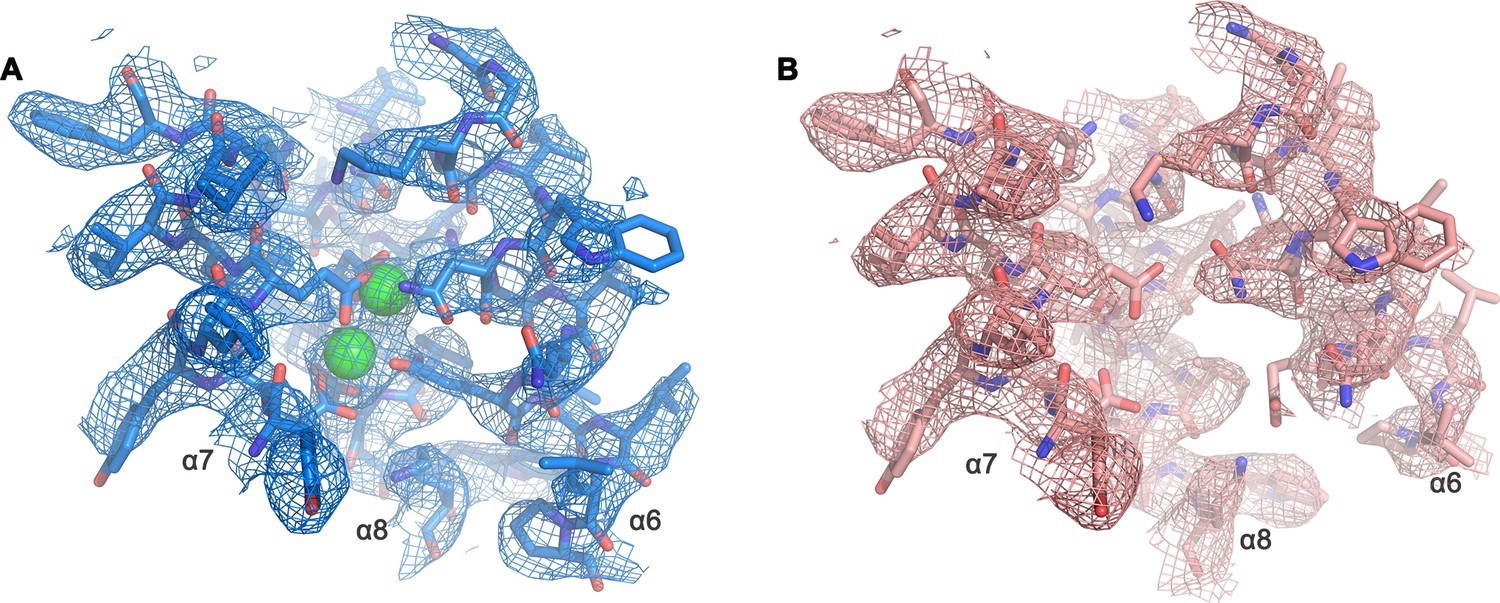
Ca2+-binding site and conformational changes.
(A) Superposition of α-helices 3–8 of mTMEM16F in the presence (blue) and absence of Ca2+ (coral). (B and C) Close-up of the Ca2+-binding site in complex (B) or in absence of Ca2+ (C). Coordinating residues are depicted as sticks, calcium ions as green spheres (with surrounding cryo-EM density contoured at 5σ). (D) Comparison of Ca2+-induced movements in mTMEM16F (Ca2+-bound in blue, Ca2+-free in coral) and mTMEM16A (Ca2+-bound (PDBID 5OYB) in green, Ca2+-free (PDBID 5OYG) in pink). Shown is a cartoon superposition of α6. A-D. Pivot for movement is depicted as sphere.
Figure 5—figure supplement 1
Cryo-EM density of the Ca2+-binding site.
Close-up of Ca2+-binding site of the Ca2+-bound (A) and Ca2+-free (B) state of mTMEM16F in digitonin as depicted in Figure 5B. A, B, The respective cryo-EM density is shown as mesh, all residues are displayed as sticks and Ca2+ as green spheres. Maps were sharpened with a b-factor of –94,–139 Å2, respectively, and both contoured at 5 σ.
Figure 5—figure supplement 2
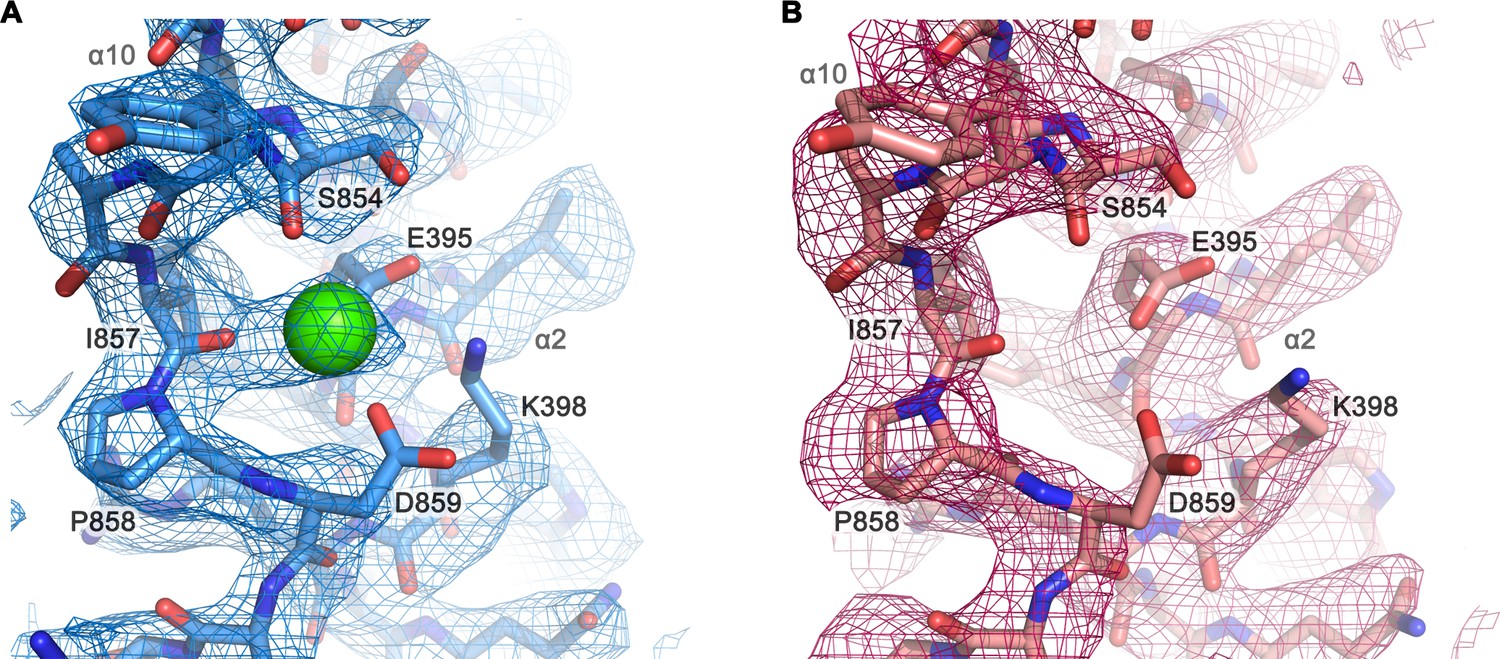
Cryo-EM density of a putative Ca2+-binding site located at the end of α10.
Close-up of a putative Ca2+-binding site in the Ca2+-bound state of mTMEM16F in digitonin (A) and in the Ca2+-free state of mTMEM16F in digitonin (B). The respective cryo-EM densities are shown as mesh, the models as sticks and Ca2+ as green sphere. Selected residues are labeled. Maps were contoured at 4.2 σ and sharpened with a b-factor of –94,–139 Å2, respectively.
Figure 6 with 2 supplements
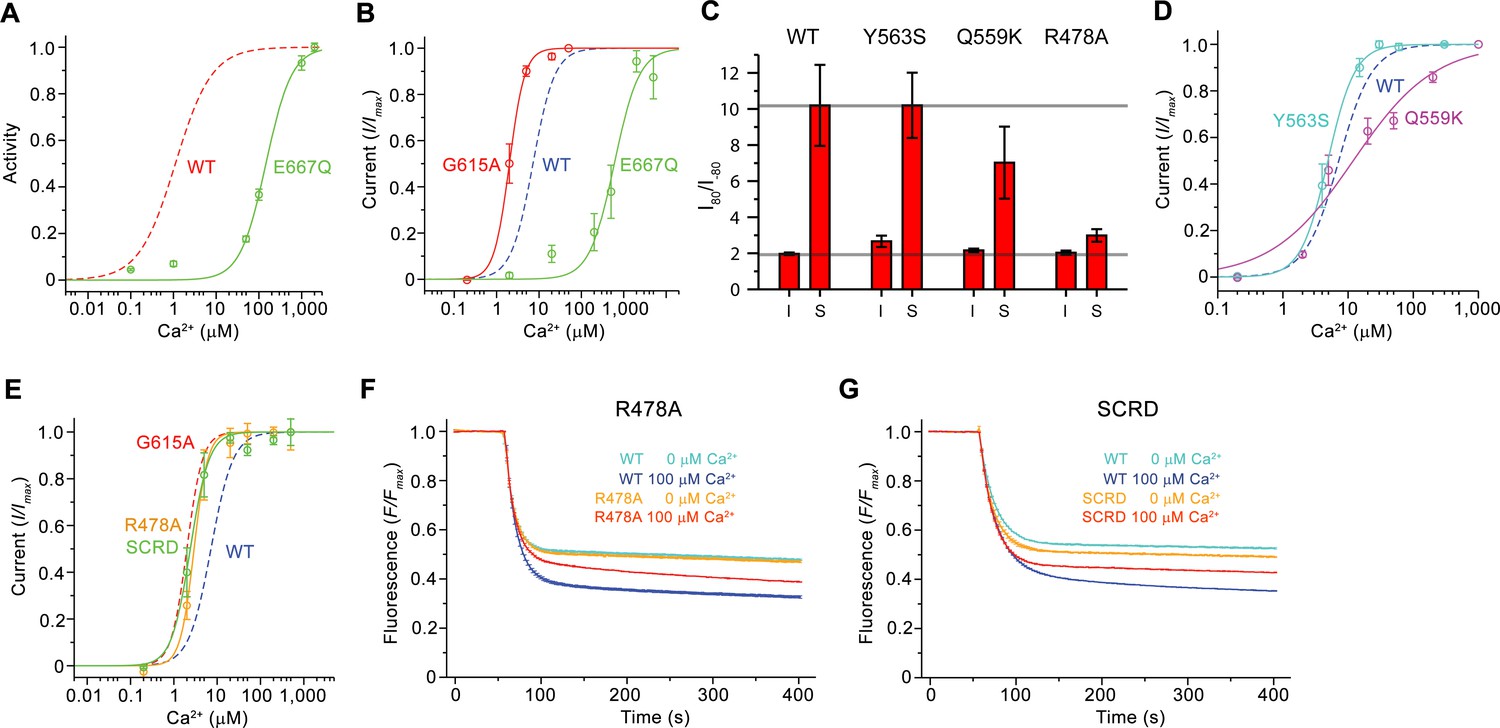
Functional properties of mutants.
(A) Ca2+ concentration-response relationship of lipid scrambling in the binding site mutant E667Q. Data show average of either six (0, 1, 10, 100, 1000 µM) or three (other concentrations) independent experiments from two protein reconstitutions. (B) Ca2+ concentration-response relationship of currents of E667Q (n = 4) and the hinge residue G615A (n = 4). (A and B) For comparison WT traces are shown as dashed lines. (C) Rectification indices (I80mV/I–80mV) of instantaneous (I) and steady-state currents (S) of WT (n = 12) and the mutants Y563S (n = 8), Q559K (n = 10) and R478A (n = 10). Unlike Q599K, the difference between R478A and WT was found to be statistically significant. (D and E) Ca2+ concentration-response relationship of currents of mutants Y563S (n = 3) and Q559K (n = 5) (D) and R478A (n = 5) and mTMEM16FSCRD (SCRD, n = 6) (E). (F and G) Scrambling of the mutants R478A (F) and mTMEM16FSCRD (SCRD) (G). F, G Data show averages of three independent experiments of one protein reconstitution. WT reconstituted in a separate set of liposomes from the same batch is shown in comparison. B, D, E Data show averages from independent biological replicates. A-G, Errors are s.e.m.
Figure 6—figure supplement 1
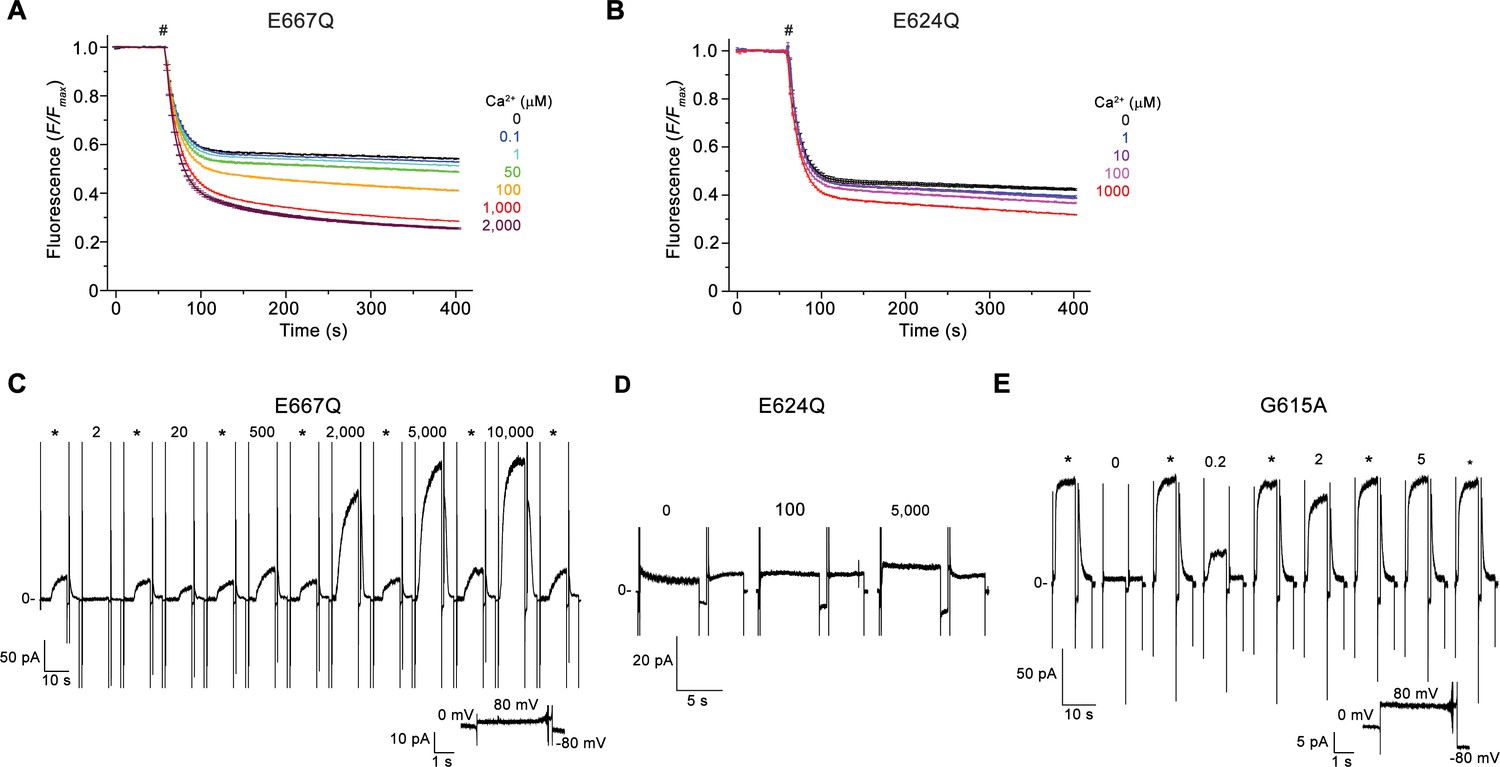
Electrophysiology and lipid scrambling data of mutants of the Ca2+-binding site and the gating hinge.
(A and B) Ca2+-dependence of scrambling activity in proteoliposomes containing the Ca2+-binding site mutants E667Q (A) and E624Q (B) at indicated ligand concentrations. (C, D and E) Representative current response of the mTMEM16F mutants E667Q (C), E624Q (D), and G615A (E) at different Ca2+ concentrations. C-E Data were recorded from inside-out patches excised from HEK293 cells transfected with mTMEM16F constructs fused to fluorescent proteins. Numbers indicate Ca2+ concentrations (µM), * indicates reference pulses used for rundown correction recorded at 200 µM Ca2+ for E667Q and 20 µM Ca2+ for all other mutants. A, B Traces depict fluorescence decrease of tail-labeled NBD-PE lipids after addition of dithionite (#). Data show averages of three technical replicates from the same reconstitution. C, E, Inset (bottom) shows leak currents at applied voltages in the absence of Ca2+.
Figure 6—figure supplement 2
Electrophysiology and lipid scrambling data of mutants of the pore region.
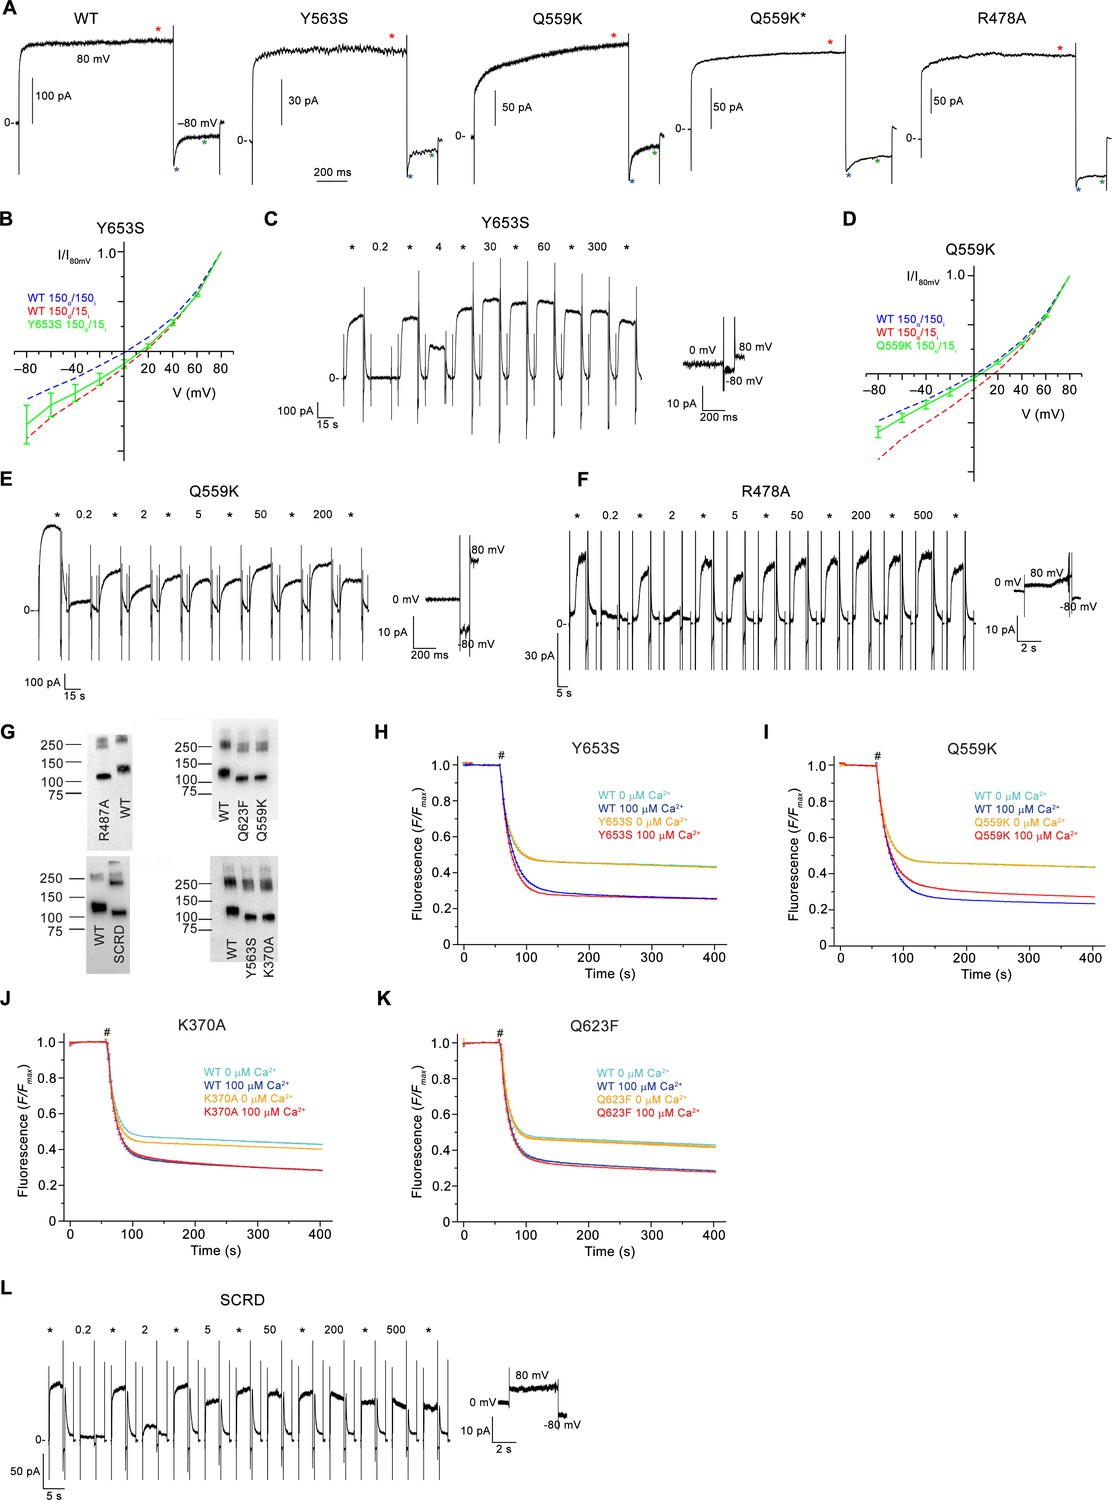
(A) Representative current traces of WT and mutants used for calculation of the rectification index (I80mV/I–80mV) of instantaneous currents (6 ms after the voltage change) and at steady-state. Red (I80mV) and blue (I-80mV) asterisks mark the timepoints used for the calculation of rectification indices from instantaneous currents, green (I-80mV) the timepoint used for the calculation of rectification indices from steady-state currents. Q559K* corresponds to a subset of samples of the mutant with lower steady-state rectification. (B) Normalized I-V relationships of the mutant Y653S in a 10-fold gradient of NaCl (green). (C) Representative current response of the mTMEM16F mutant Y653S at different Ca2+ concentrations. (D) Normalized I-V relationships of the mutant Q559K in a 10-fold gradient of NaCl (green). The shift in the reversal potential in asymmetric conditions towards 0 indicates a decreased cation over anion selectivity. B,D, The osmolarity of low NaCl solution was adjusted by addition of NMDG-sulfate. WT at symmetric and asymmetric concentrations is indicated as dashed line for comparison. Data shows average of 3 (Y365S) and 5 (Q559K) biological replicates, errors are s.e.m.. (E and F) Representative current responses of the mTMEM16F mutants Q559K (E) and R478A (F) at different Ca2+ concentrations. (G) Western blot analysis of the protein content of proteoliposomes containing different mTMEM16F constructs after extraction with dodecyl-β-D-maltopyranoside. WT reconstituted in the same batch of liposomes as respective mutants was used as reference and is displayed on the same blot for comparison. Proteoliposomes of mutants show similar protein levels as respective WT controls and thus allow for a direct comparison of respective activities. (H–K) Scrambling activity of the mutants Y653S (H), Q559K (I) K370A (J) and Q623F (K) at indicated Ca2+ concentrations. (L) Representative current response of the construct mTMEM16FSCRD (SCRD) at different Ca2+ concentrations. A-F, L, Data were recorded from inside-out patches excised from HEK293 cells transfected with mTMEM16F constructs fused to fluorescent proteins. Numbers indicate Ca2+ concentrations (µM), * indicates reference pulses used for rundown correction recorded at 20 µM Ca2+. C, E, F, L, Inset (bottom) shows leak currents at applied voltages in the absence of Ca2+. H-K, WT reconstituted in a separate set of liposomes from the same batch is shown as comparison. Traces depict fluorescence decrease of tail-labeled NBD-PE lipids after addition of dithionite (#). Data show averages of three technical replicates from the same reconstitution.
Figure 7
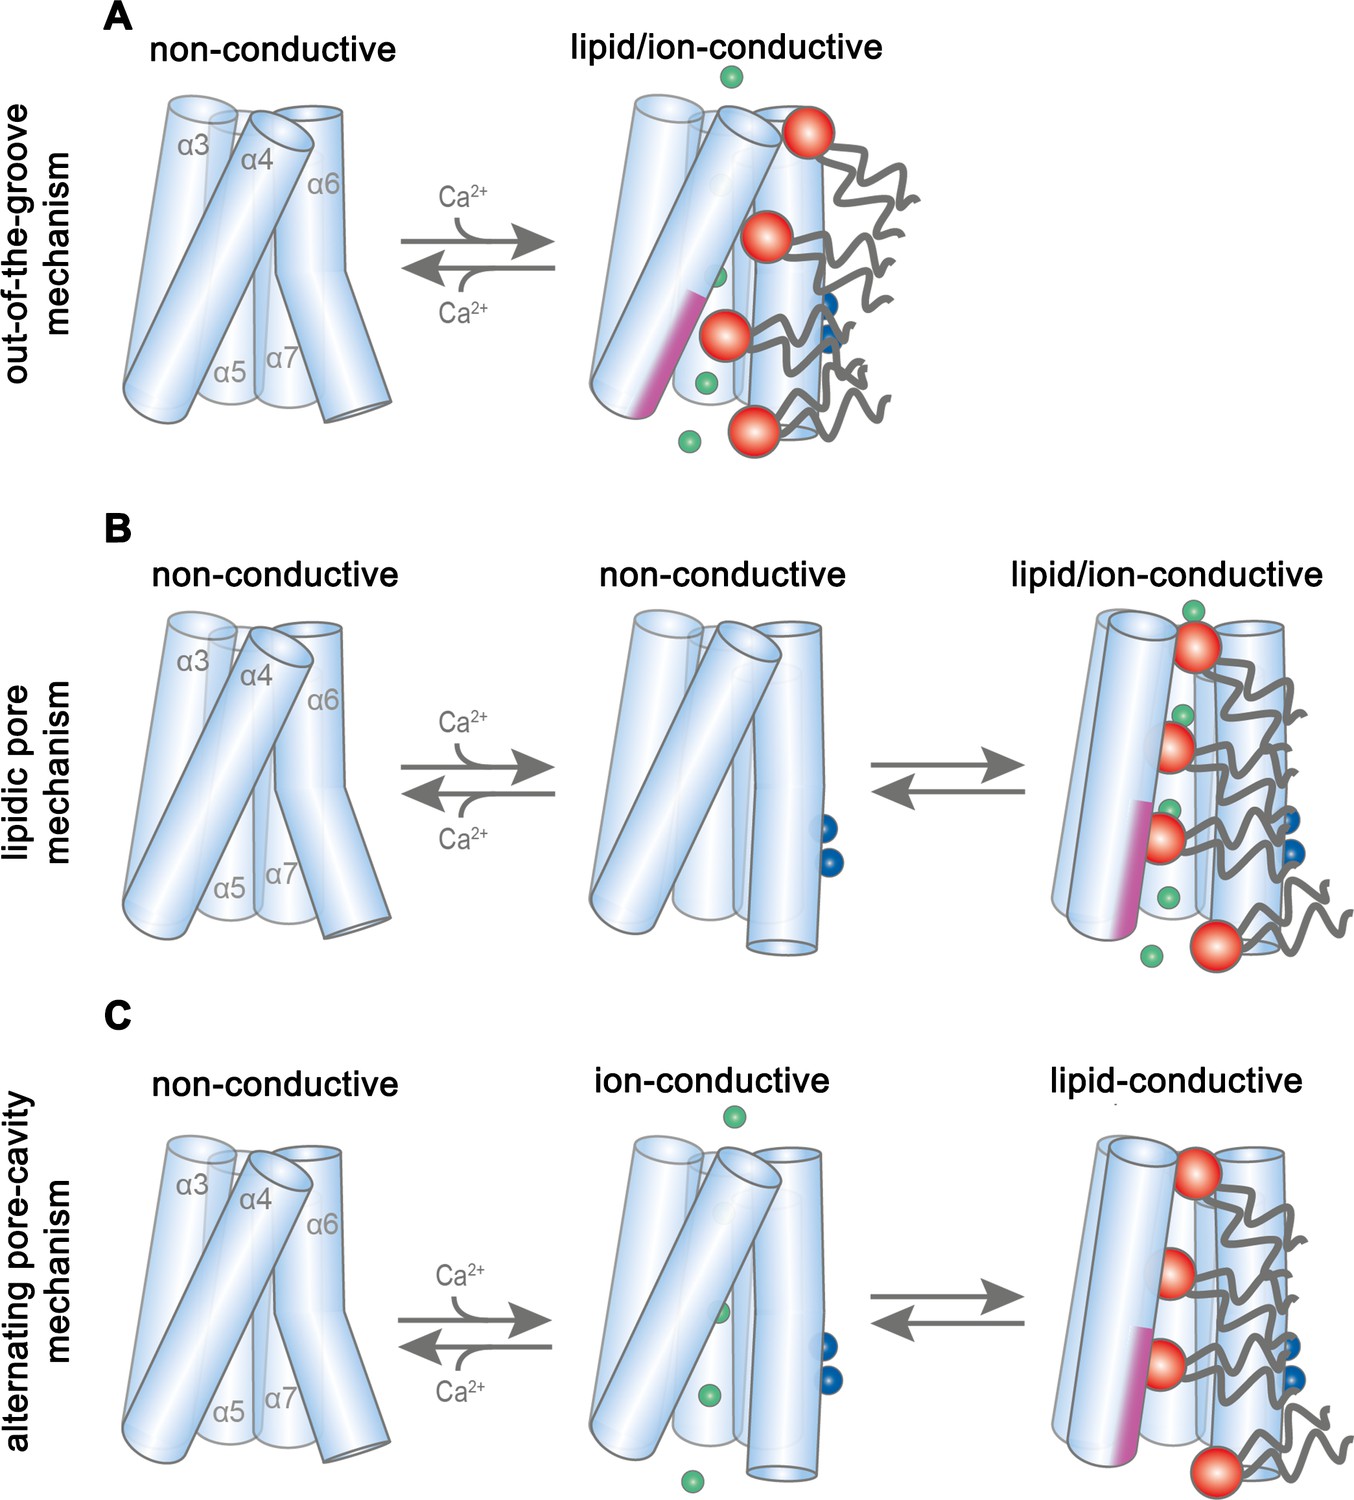
Potential transport mechanisms in mTMEM16F.
(A) ‘Out-of-the-groove mechanism’: upon calcium-activation the subunit cavity remains closed, ions and lipids permeate separate parts of the protein. (B) ‘Lipidic pore mechanism’: upon Ca2+ binding, the cavity opens with ions and lipids permeating the same open cavity conformation. (C) ‘Alternating pore-cavity mechanism’: After Ca2+-binding the open lipid-conductive cavity and ion conductive protein-surrounded pore are in equilibrium. This mechanism appears most likely in light of the functional data on mTMEM16F and the results on a related study on the activation of the lipid scramblase nhTMEM16 (Kalienkova et al., 2019). A-C, Schematic representation of mTMEM16F α3–7 depicted as cylinders, bound calcium ions as blue spheres, conducting chloride ions as green spheres, scrambling lipid head groups as red spheres and their respective acyl chains as grey lines. The scrambling domain (SCRD) is indicated as purple area at the intracellular side of α-helix 4.
Videos
Video 1
Structure of mTMEM16F in complex with Ca2+.
Shown is the cryo-EM density map of mTMEM16F obtained in complex with Ca2+ in digitonin superimposed on the refined structure. For clarity, only a single subunit is displayed. The cryo-EM map is depicted as blue surface, the model as blue sticks, and calcium ions as green spheres.
Video 2
Structure of mTMEM16F in absence of Ca2+.
Shown is the cryo-EM density map of the mTMEM16F obtained in a Ca2+-free state in digitonin superimposed on the refined structure. For clarity, only a single subunit is displayed. The cryo-EM map is depicted as magenta surface and the model as red sticks.
Tables
Table 1
Cryo-EM data collection, refinement and validation statistics.
https://doi.org/10.7554/eLife.44365.012| mTMEM16F dig, +Ca2+ (EMDB 4611, PDBID 6QP6) | mTMEM16F dig, -Ca2+ (EMDB 4612, PDBID 6QPB) | mTMEM16F 2N2, +Ca2+ (EMDB 4613, PDBID 6QPC) | mTMEM16F 2N2, -Ca2+ (EMDB 4614, PDBID 6QPI) | |
|---|---|---|---|---|
| Data collection and processing | ||||
| Microscope Camera Magnification | FEI Talos Arctica Gatan K2 Summit + GIF 49,407 | FEI Talos Arctica Gatan K2 Summit + GIF 49,407 | FEI Talos Arctica Gatan K2 Summit + GIF 49,407 | FEI Talos Arctica Gatan K2 Summit + GIF 49,407 |
| Voltage (kV) Exposure time frame/total (s) Number of frames per image | 200 0.15/9 60 | 200 0.15/9 60 | 200 0.15/9 60 | 200 0.15/9 60 |
| Electron exposure (e–/Å2) | 52 | 52 | 52 | 52 |
| Defocus range (μm) | −0.5 to −2.0 | −0.5 to −2.0 | −0.5 to −2.0 | −0.5 to −2.0 |
| Pixel size (Å) Box size (pixels) | 1.012 220 | 1.012 220 | 1.012 256 | 1.012 220 |
| Symmetry imposed | C2 | C2 | C2 | C2 |
| Initial particle images (no.) | 1,348,247 | 1,314,676 | 1,019,012 | 1,593,115 |
| Final particle images (no.) | 219,302 | 194,284 | 186,487 | 280,891 |
| Map resolution (Å) 0.143 FSC threshold | 3.18 | 3.64 | 3.54 | 3.27 |
| Map resolution range (Å) | 2.9–4.5 | 3.2–5 | 3.3–5 | 3.0–4.2 |
| Refinement | ||||
| Initial model used | PDBID 5OYB | PDBID 6QP6 | PDBID 6QP6 | PDBID 6QPB |
| Model resolution (Å) FSC threshold | 3.3 | 3.8 | 4.0 | 7.0 |
| Model resolution range (Å) | 80–3.2 | 80–3.6 | 80–3.5 | 80–3.3 |
| Map sharpening B factor (Å2) | −94 | −139 | −121 | −131 |
| Model composition Nonhydrogen atoms Protein residues Ligands | 12144 1462 8 | 12136 1460 2 | 9060 1138 6 | 2288 462 - |
| B factors (Å2) Protein Ligand | 53.3 39.1 | 52 34.8 | 72.7 54.6 | 7.8 - |
| R.m.s. deviations Bond lengths (Å) Bond angles (°) | 0.009 1 | 0.007 0.9 | 0.005 0.87 | 0.004 0.655 |
| Validation MolProbity score Clashscore Poor rotamers (%) | 1.36 6.5 0.46 | 1.23 4.5 0.3 | 1.3 5.6 0.22 | 1.17 2.4 0 |
| Ramachandran plot Favored (%) Allowed (%) Disallowed (%) | 98.6 1.4 0 | 98.4 1.6 0 | 98.4 1.6 0 | 97.2 2.8 0 |
Key resources table
| Reagent type (species) or resource | Designation | Source or reference | Identifier | Additional information |
|---|---|---|---|---|
| Antibody | Mouse monoclonal Anti-c-Myc | Millipore Sigma | Cat#M4439; Clone#9E10 | Dilution – 1:5000 |
| Antibody | Peroxidase Affinipure goat anti-mouse IgG | Jackson Immunoresearch | Cat#115-035-146 | Dilution – 1:10000 |
| Chemical compound, drug | FuGENE six transfection reagent | Promega | Cat# E2691 | |
| Chemical compound, drug | Hygromycin B | Gibco, Thermo Fisher Scientific | Cat#10687010 | |
| Chemical compound, drug | Tetracycline hydrochloride | Millipore Sigma | Cat#T7660 | |
| Chemical compound, drug | n-dodecyl-β-d- maltopyranoside, Solgrade | Anatrace | Cat#D310S | |
| Chemical compound, drug | EX-CELL 293 Serum-Free medium | Millipore Sigma | Cat#14571C | |
| Chemical compound, drug | Fetal bovine serum | Millipore Sigma | Cat#F7524 | |
| Chemical compound, drug | L-glutamine | Millipore Sigma | Cat#G7513 | |
| Chemical compound, drug | Penicillin-streptomycin | Millipore Sigma | Cat#P0781 | |
| Chemical compound, drug | Valproic acid | Millipore Sigma | Cat#P4543 | |
| Chemical compound, drug | HyClone HyCell TransFx-H medium | GE Healthcare | Cat#SH30939.02 | |
| Chemical compound, drug | Poloxamer 188 | Millipore Sigma | Cat#P5556 | |
| Chemical compound, drug | Polyethylenimine MAX 40 K | Polysciences | Cat# 24765–1 | |
| Chemical compound, drug | Dulbecco’s Modified Eagle’s Medium - high glucose | Millipore Sigma | D5671 | |
| Chemical compound, drug | Dulbecco’s Phosphate Buffered Saline | Millipore Sigma | D8537 | |
| Chemical compound, drug | Digitonin Reagent USP | PanReac AppliChem | Cat#A1905 | |
| Chemical compound, drug | Calcium nitrate tetrahydrate | Millipore Sigma | Cat#C4955 | |
| Chemical compound, drug | Sodium chloride | Millipore Sigma | Cat#71380 | |
| Chemical compound, drug | HEPES | Millipore Sigma | Cat#H3375 | |
| Chemical compound, drug | Ethylene glycol-bis(2- aminoethylether)-N,N,N′,N′- tetraacetic acid | Millipore Sigma | Cat#03777 | |
| Chemical compound, drug | cOmplete, EDTA-free Protease Inhibitor Cocktail | Roche | Cat#5056489001 | |
| Chemical compound, drug | Digitonin, High Purity - Calbiochem | EMD Millipore | Cat#300410 | |
| Chemical compound, drug | Biotin | Millipore Sigma | Cat#B4501 | |
| Recombinant protein | PNGase F | Raimund Dutzler laboratory | NA | |
| Commercial assay or kit | Amicon Ultra-4–100 KDa cutoff | EMD Millipore | Cat#UFC8100 | |
| Commercial assay or kit | 0.22 μm Ultrafree-MC Centrifugal Filter | EMD Millipore | Cat#UFC30GV | |
| Chemical compound, drug | 1-palmitoyl-2-oleoyl -glycero-3-phosphocholine | Avanti Polar Lipids, Inc | Cat#850457C | |
| Chemical compound, drug | 1-palmitoyl-2-oleoyl-sn- glycero-3-phospho-(1'-rac- glycerol) | Avanti Polar Lipids, Inc | Cat#840457C | |
| Chemical compound | Diethyl ether | Millipore Sigma | Cat#296082 | |
| Commercial assay or kit | Bio-Beads SM-2 Adsorbents | Bio-Rad | Cat# 1523920 | |
| Chemical compound, drug | Soybean Polar Lipid Extract | Avanti Polar Lipids, Inc | Cat#541602C | |
| Chemical compound, drug | Cholesterol | Millipore Sigma | Cat#C8667 | |
| Chemical compound | 18:1-06:0 NBD-PE | Avanti Polar Lipids, Inc | Cat#810155C | |
| Chemical compound, drug | 18:1-06:0 NBD-PS | Avanti Polar Lipids, Inc | Cat#810194C | |
| Chemical compound, drug | 14:0 NBD-PE | Avanti Polar Lipids, Inc | Cat#810143 C | |
| Chemical compound, drug | Potassium chloride | Millipore Sigma | Cat#746436 | |
| Chemical compound, drug | Triton X-100 | Millipore Sigma | Cat#T9284 | |
| Chemical compound, drug | Sodium dithionite | Millipore Sigma | Cat#157953 | |
| Chemical compound, drug | N-Methyl-D-glucamine | Millipore Sigma | Cat#66930 | |
| Chemical compound, drug | Sulphuric acid 95–97% | EMD Millipore | Cat# 1.00731.1000 | |
| Commercial assay or kit | Borosilicate glass capilliary with filament | Sutter Instrument | Cat#BF150-86-10HP | |
| Commercial assay or kit | Pierce Streptavidin Plus UltraLink Resin | Thermo Fisher Scientific | Cat#53117 | |
| Commercial assay or kit | Superose 6 10/300 GL | GE Healthcare | Cat#17-5172-01 | |
| Commercial assay or kit | Flp-In T-Rex Core Kit | ThermoFisher Scientific | Cat#K650001 | |
| Commercial assay or kit | Whatman Nuclepore Track-Etched Membranes diam.19mm, pore size 0.4μm, polycarbonate | Millipore Sigma | Cat#WHA800282 | |
| Commercial assay or kit | Microforge | Narishige | NA | |
| Commercial assay or kit | Axopatch 200B amplifer | Molecular Devices | NA | |
| Commercial assay or kit | Digidata 1440 | Molecular Devices | NA | |
| Commercial assay or kit | 300 mesh Au 1.2/1.3 cryo-EM grids | Quantifoil | Cat#N1-C14nAu30-01 | |
| Cell line (Human) | Flp-In T-REx 293 | ThermoFisher Scientific | Cat#R78007 | |
| Cell line (Human) | HEK-293T | ATCC | Cat#CRL-1573 | |
| Cell line (Human) | HEK293S GnTI- | ATCC | Cat#CRL-3022 | |
| Recombinant DNA | Mouse mTMEM16F open reading frame | Dharmacon - Horizon Discovery | GenBank#BC060732 | |
| Recombinant DNA | Mammalian expression vector with C-terminal 3C protease cleavage site, Myc tag and streptavidin binding peptide | Raimund Dutzler laboratory | NA | |
| Recombinant DNA | Mammalian expression vector with C-terminal 3C protease cleavage site, Venus and Myc tags and streptavidin binding peptide | Raimund Dutzler laboratory | NA | |
| Recombinant DNA | Synthesized mTMEM16FSCRD cDNA | GenScript | NA | |
| Recombinant DNA | Membrane scaffold protein (MSP) 2N2 | Stephen Sligar laboratory | Addgene:Cat#29520 | |
| Software, algorithm | WEBMAXC calculator | Bers et al., 2010 | http://maxchelator.stanford.edu/webmaxc/webmaxcS.htm | |
| Software, algorithm | Axon Clampfit 10.7 | Molecular Devices | NA | |
| Software, algorithm | Axon Clampex 10.6 | Molecular Devices | NA | |
| Software, algorithm | Focus 1.1.0 | Biyani et al. (2017) | https://focus.c-cina.unibas.ch/about.php | |
| Software, algorithm | MotionCorr2 1.1.0 | Zheng et al. (2017) | http://msg.ucsf.edu/em/software/motioncor2.html | |
| Software, algorithm | CTFFIND 4.1 | Rohou and Grigorieff (2015) | http://grigoriefflab.janelia.org/ctf | |
| Software, algorithm | Relion v 2.1 and 3.0 | Kimanius et al., 2016 Zivanov et al., 2018 | https://www2.mrc-lmb.cam.ac.uk/relion/ | |
| Software, algorithm | Phenix 1.13 | Adams et al. (2010) | http://http://phenix-online.org/ | |
| Software, algorithm | Coot 0.8.9.1 | Emsley and Cowtan (2004) | https://www2.mrc-lmb.cam.ac.uk/personal/pemsley/coot/ | |
| Software, algorithm | Pymol 2.0 | Schrodinger LLC | https://pymol.org/2/ | |
| Software, algorithm | Chimera 1.12 | Pettersen et al. (2004) | https://www.cgl.ucsf.edu/chimera/ |
Additional files
-
Transparent reporting form
- https://doi.org/10.7554/eLife.44365.027
Download links
A two-part list of links to download the article, or parts of the article, in various formats.
Downloads (link to download the article as PDF)
Open citations (links to open the citations from this article in various online reference manager services)
Cite this article (links to download the citations from this article in formats compatible with various reference manager tools)
Cryo-EM structures and functional characterization of the murine lipid scramblase TMEM16F
eLife 8:e44365.
https://doi.org/10.7554/eLife.44365


