A de novo evolved gene in the house mouse regulates female pregnancy cycles
- Max Planck Institute for Evolutionary Biology, Germany
Figures
Figure 1
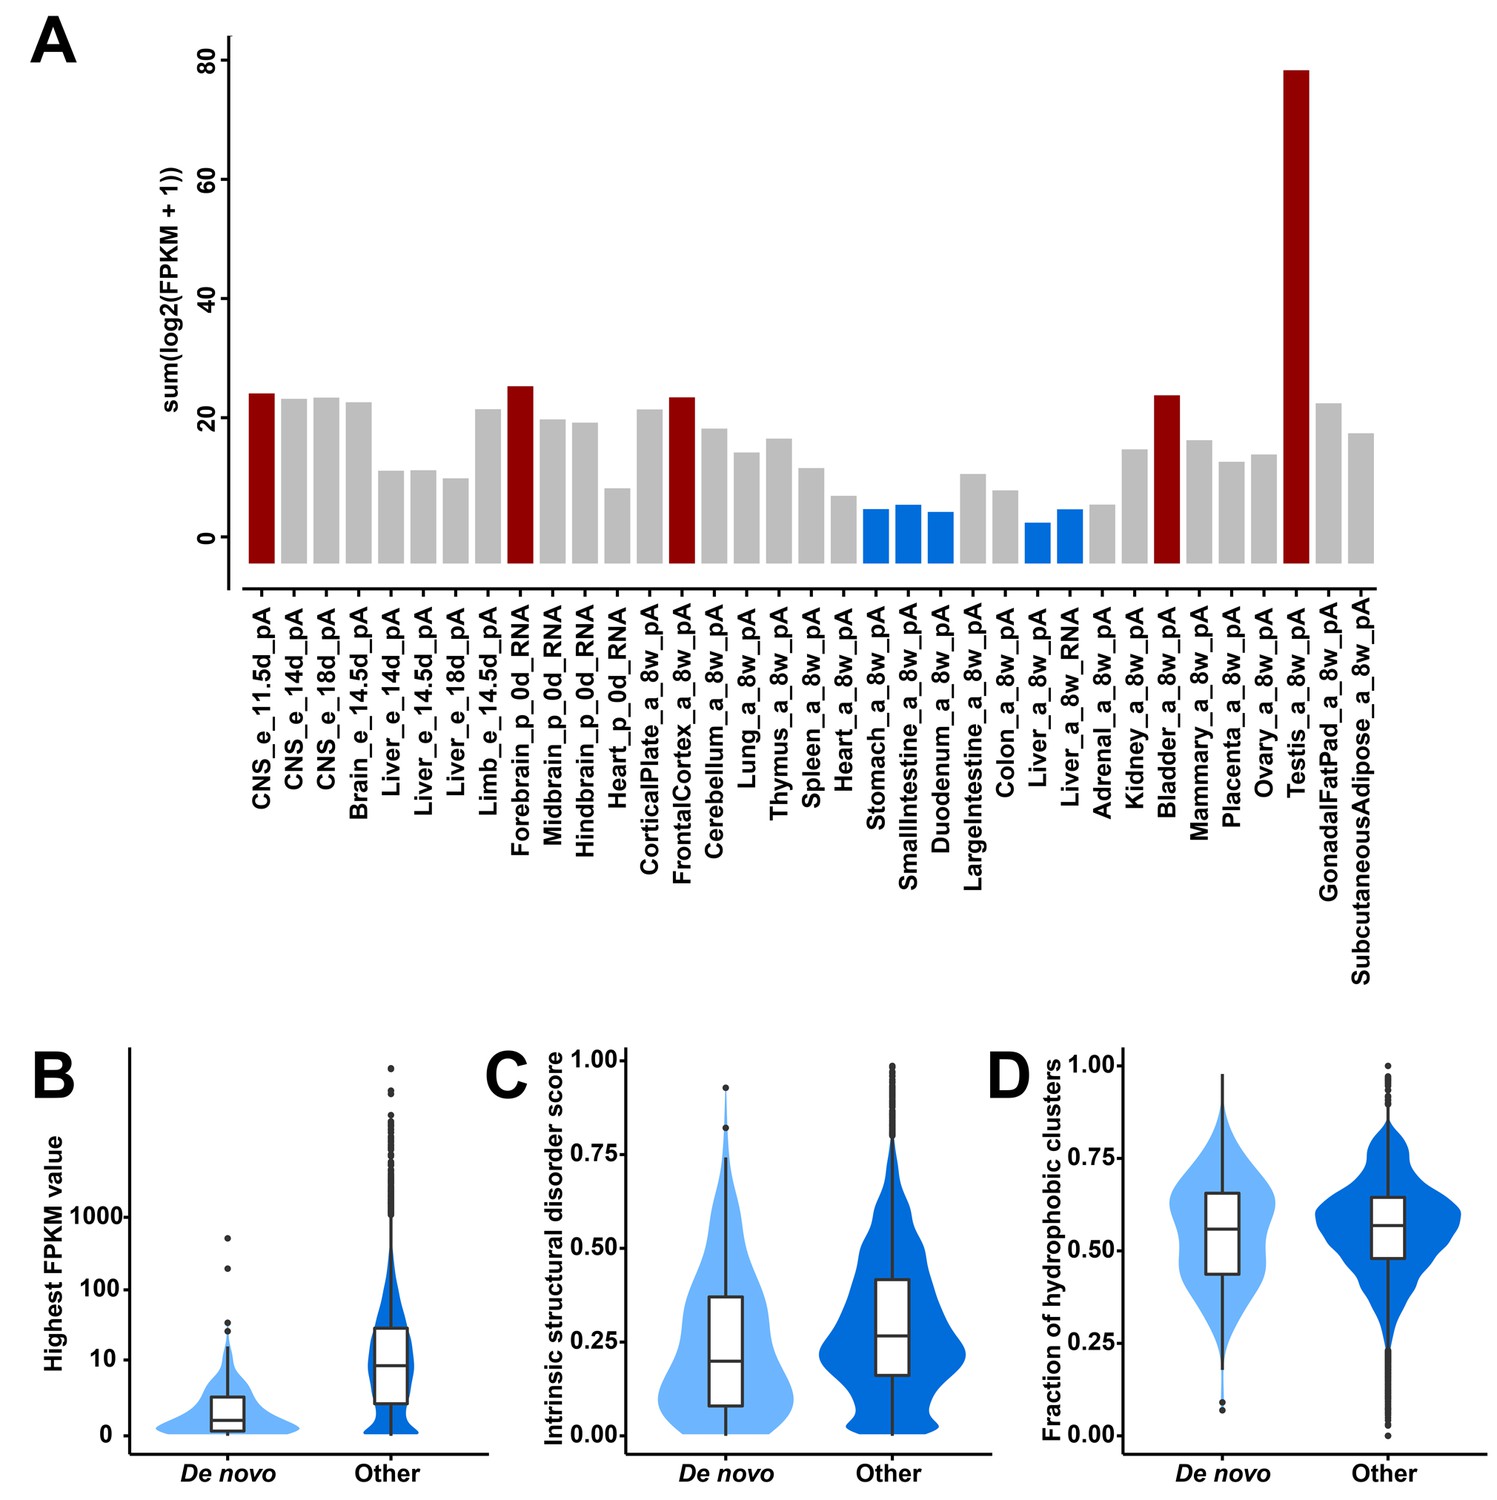
Transcriptional abundance and structural features of 119 candidate de novo genes in the mouse lineage.
(A) Transcriptional abundance in each mouse tissue, represented as the sum of log-transformed FPKM values of each transcript: sum(log2(FPKM + 1)). Details on tissue designations and RNA samples are provided in Figure 1—source data 1. The five tissues with the highest fractions are highlighted in red and the lowest ones in blue. (B) Comparison of overall expression levels (represented as the highest FPKM values in the 35 tissues) between de novo and all other protein-coding genes (‘De novo’ and ‘Other’ on the x-axis). (C) Comparison of averages of intrinsic structural disorder scores between de novo and all other protein-coding genes. (D) Comparison of fractions of sequence covered by hydrophobic clusters between de novo and all other protein-coding genes.
-
Figure 1—source data 1
Excel file with five tabs, providing (i) the legends for the tissue sources, (ii) the table for the gene lists, (iii) the information for the reassembled transcripts, (iv) the proteomic evidence shown in detail, and (v) the accession numbers for the ENCODE data.
- https://doi.org/10.7554/eLife.44392.004
Figure 2

General information of Gm13030, expression, and knockout strategy.
(A) General information on transcript ID, location and protein characteristics. (B) Reverse transcription PCR across intron junctions to study Gm13030 expression in gonadal fat pad, ovary, oviduct, and uterus. Fat: gonadal fat pad; M: marker (from top to bottom: 1500 bp, 850 bp, 400 bp, 200 bp, 50 bp); U: Uba1 (control gene, 255 bp); j1: Gm13030 junction 1 (161 bp); j2: Gm13030 junction 2 (209 bp). (C) Transcript structure, DNA target, guide RNA, and depiction of the deletion created by the CRISPR/Cas9 knockout of Gm13030. The 20-nt guide sequence is colored blue and the 3-nt PAM is colored red. The induced deletion was verified by sequencing.
Figure 3 with 3 supplements
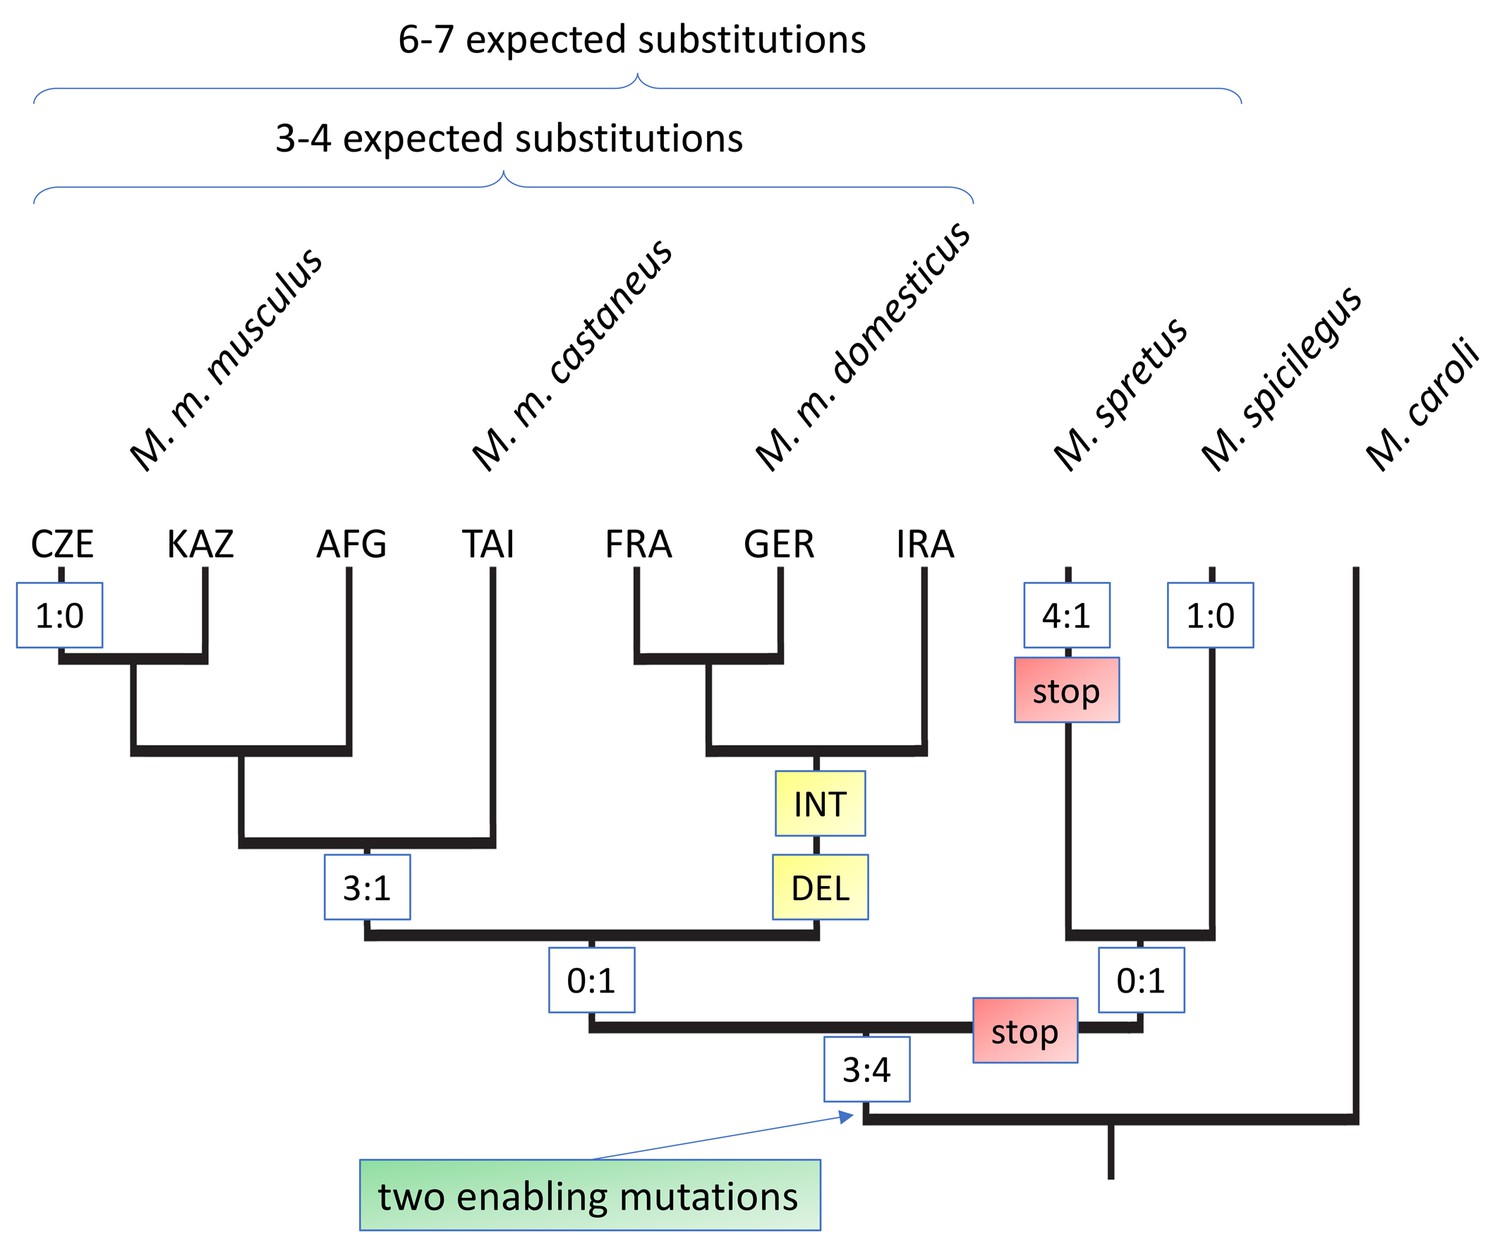
Evolutionary history of the Gm13030 ORF.
The tree is based on the alignments shown in Figure 3—figure supplement 1, with only M. caroli included as the outgroup. The relevant substitutions at the different nodes are shown in boxes. Numbers refer to coding:non-coding substitutions, ‘stop’ refers to a mutation that creates a stop codon in the reading frame, ‘DEL’ refers to a deletion, ‘INT’ to an assumed introgression. 3-letter codes on the tips refer to the different populations of the respective sub-species. Expected substitutions on the top are inferred from whole genome distances and represent the approximately neutral number of substitutions for the respective comparisons (Figure 3—figure supplement 2).
Figure 3—figure supplement 1
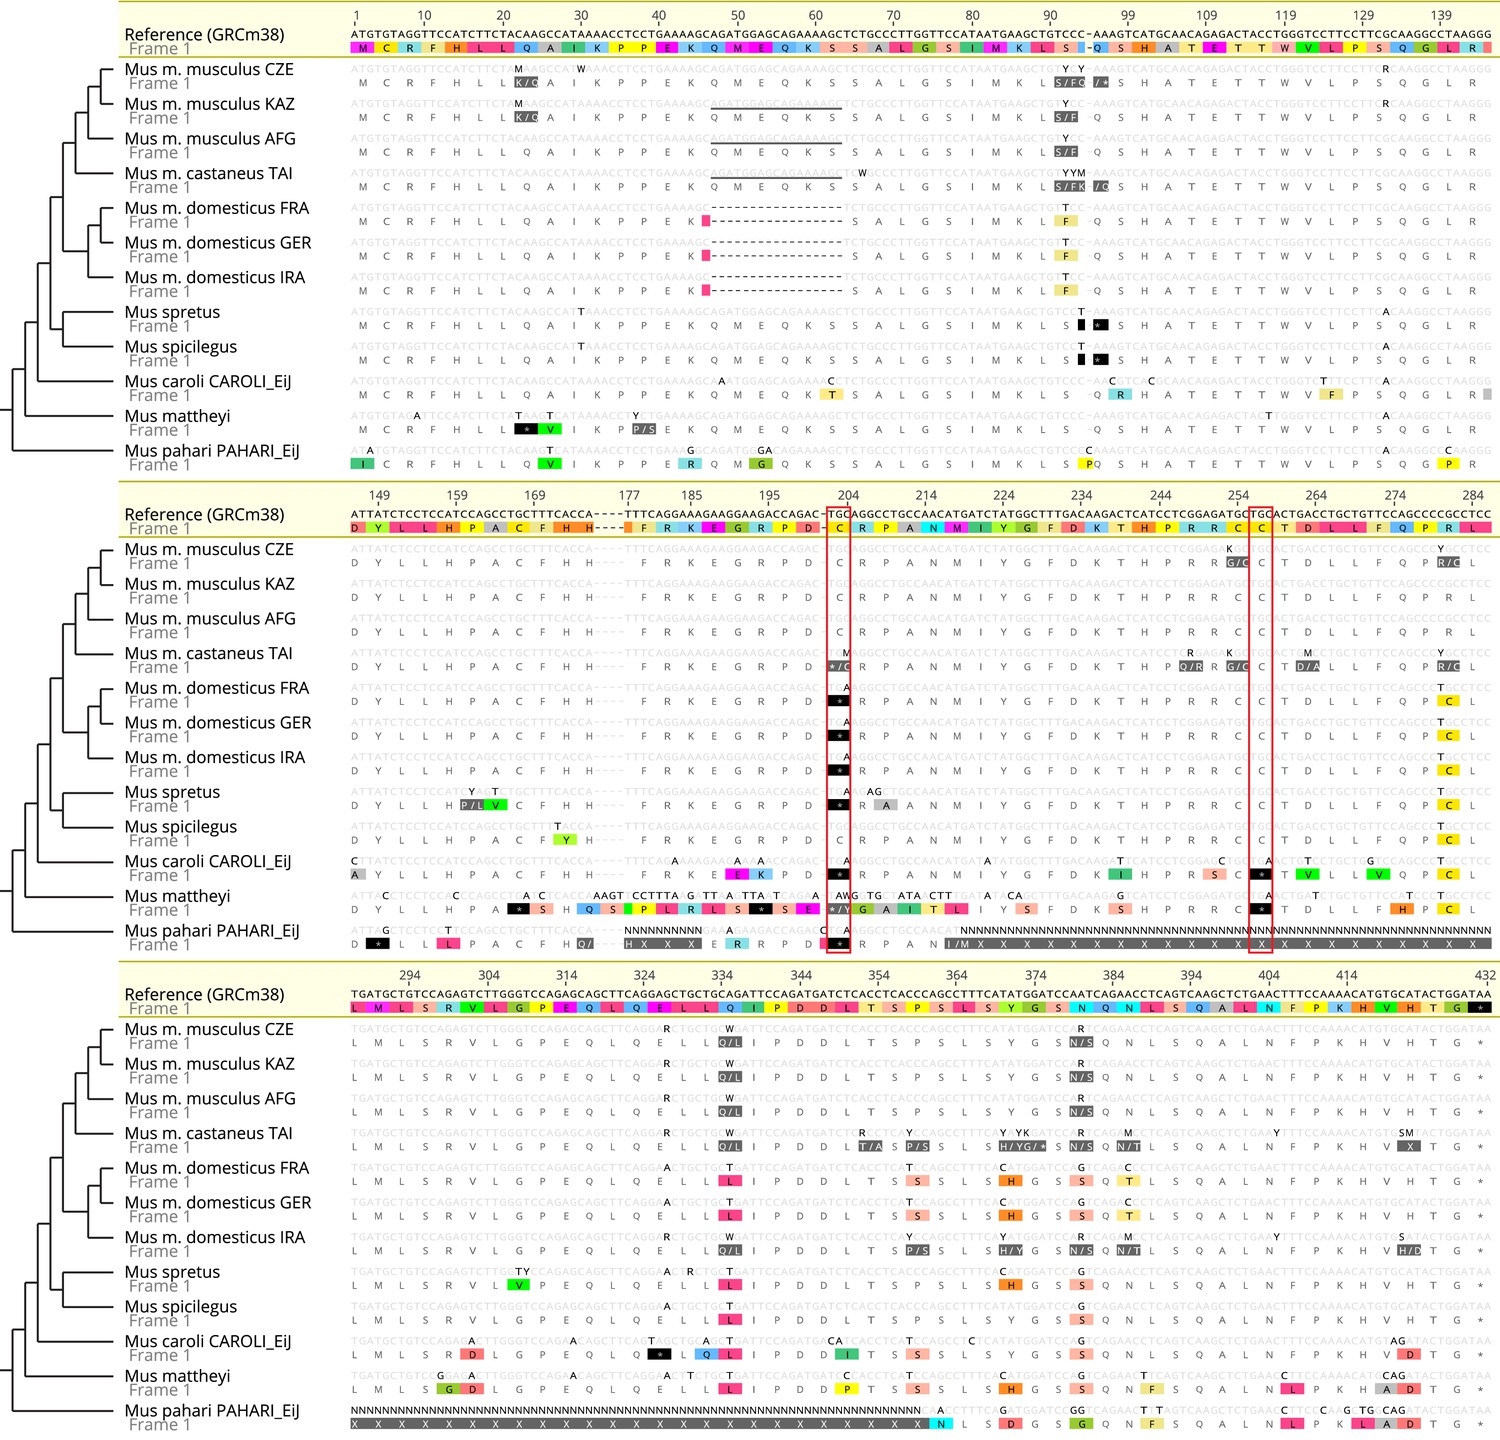
Alignment of the ORF of Gm13030 among the mouse populations, subspecies and related species where the sequence could be identified in the respective genomic region.
All nucleotide sequences are aligned to the mm10 mouse reference, and amino acids are translated according to the reference frame (note that this implies that the frameshifts in the individual sequences are not shown). Alignment was done in Geneious Prime (2019.0.3 Biomatters Ltd.). The topology of the species tree is shown to the left. ‘Mus m.’ represents Mus musculus. Mus musculus populations are marked with 3-letter origin designations, and sequences from inbred strains are marked with strain designations. Nucleotides and amino acids are shown in IUPAC codes. The two rectangles mark the positions of the enabler mutations.
Figure 3—figure supplement 2
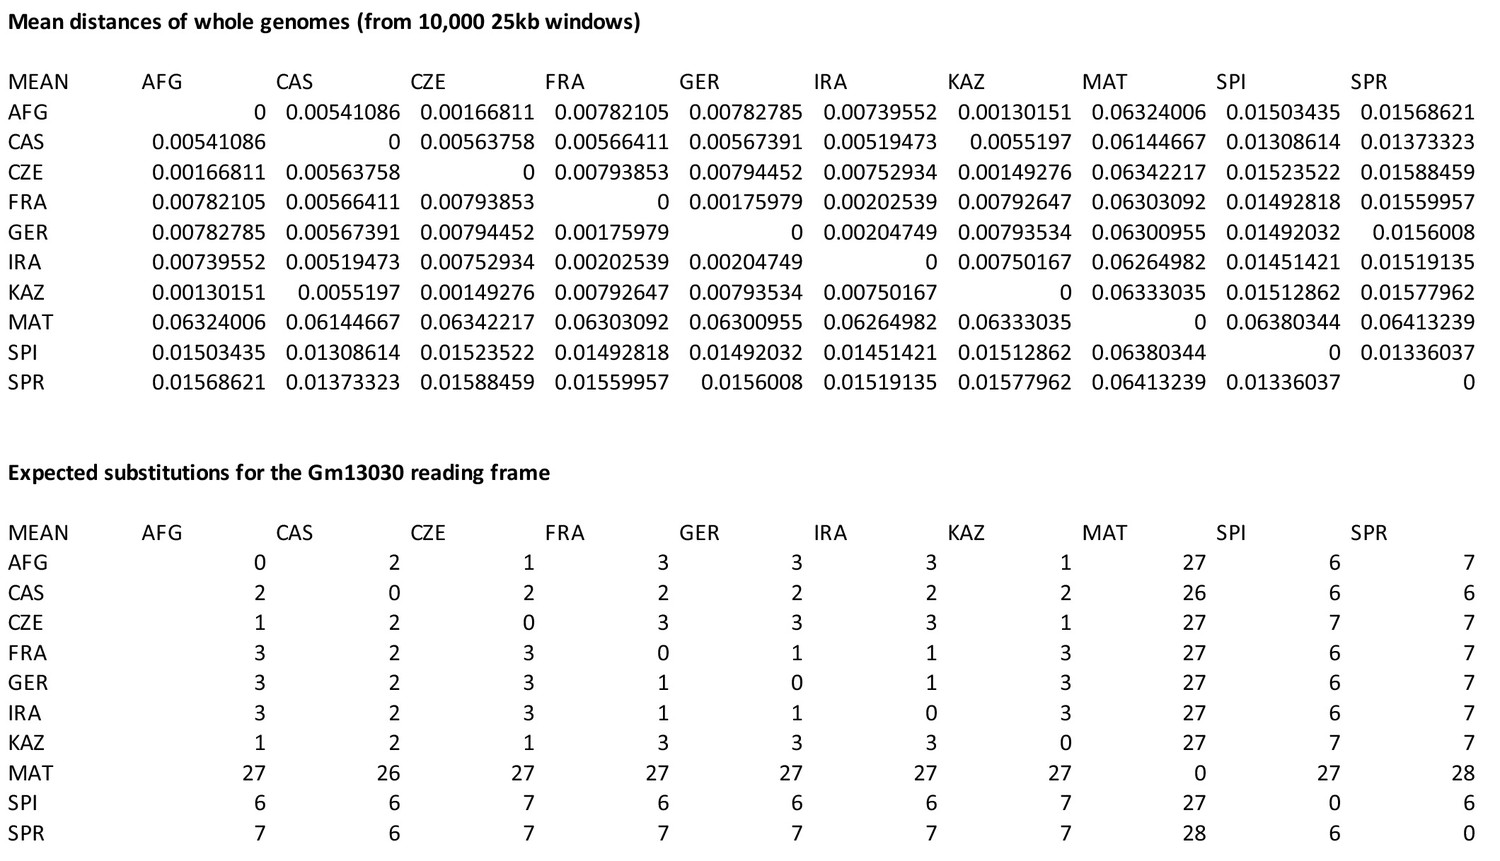
Distance matrices for whole genome comparisons and expected numbers of substitutions for Gm13030.
https://doi.org/10.7554/eLife.44392.008
Figure 3—figure supplement 3
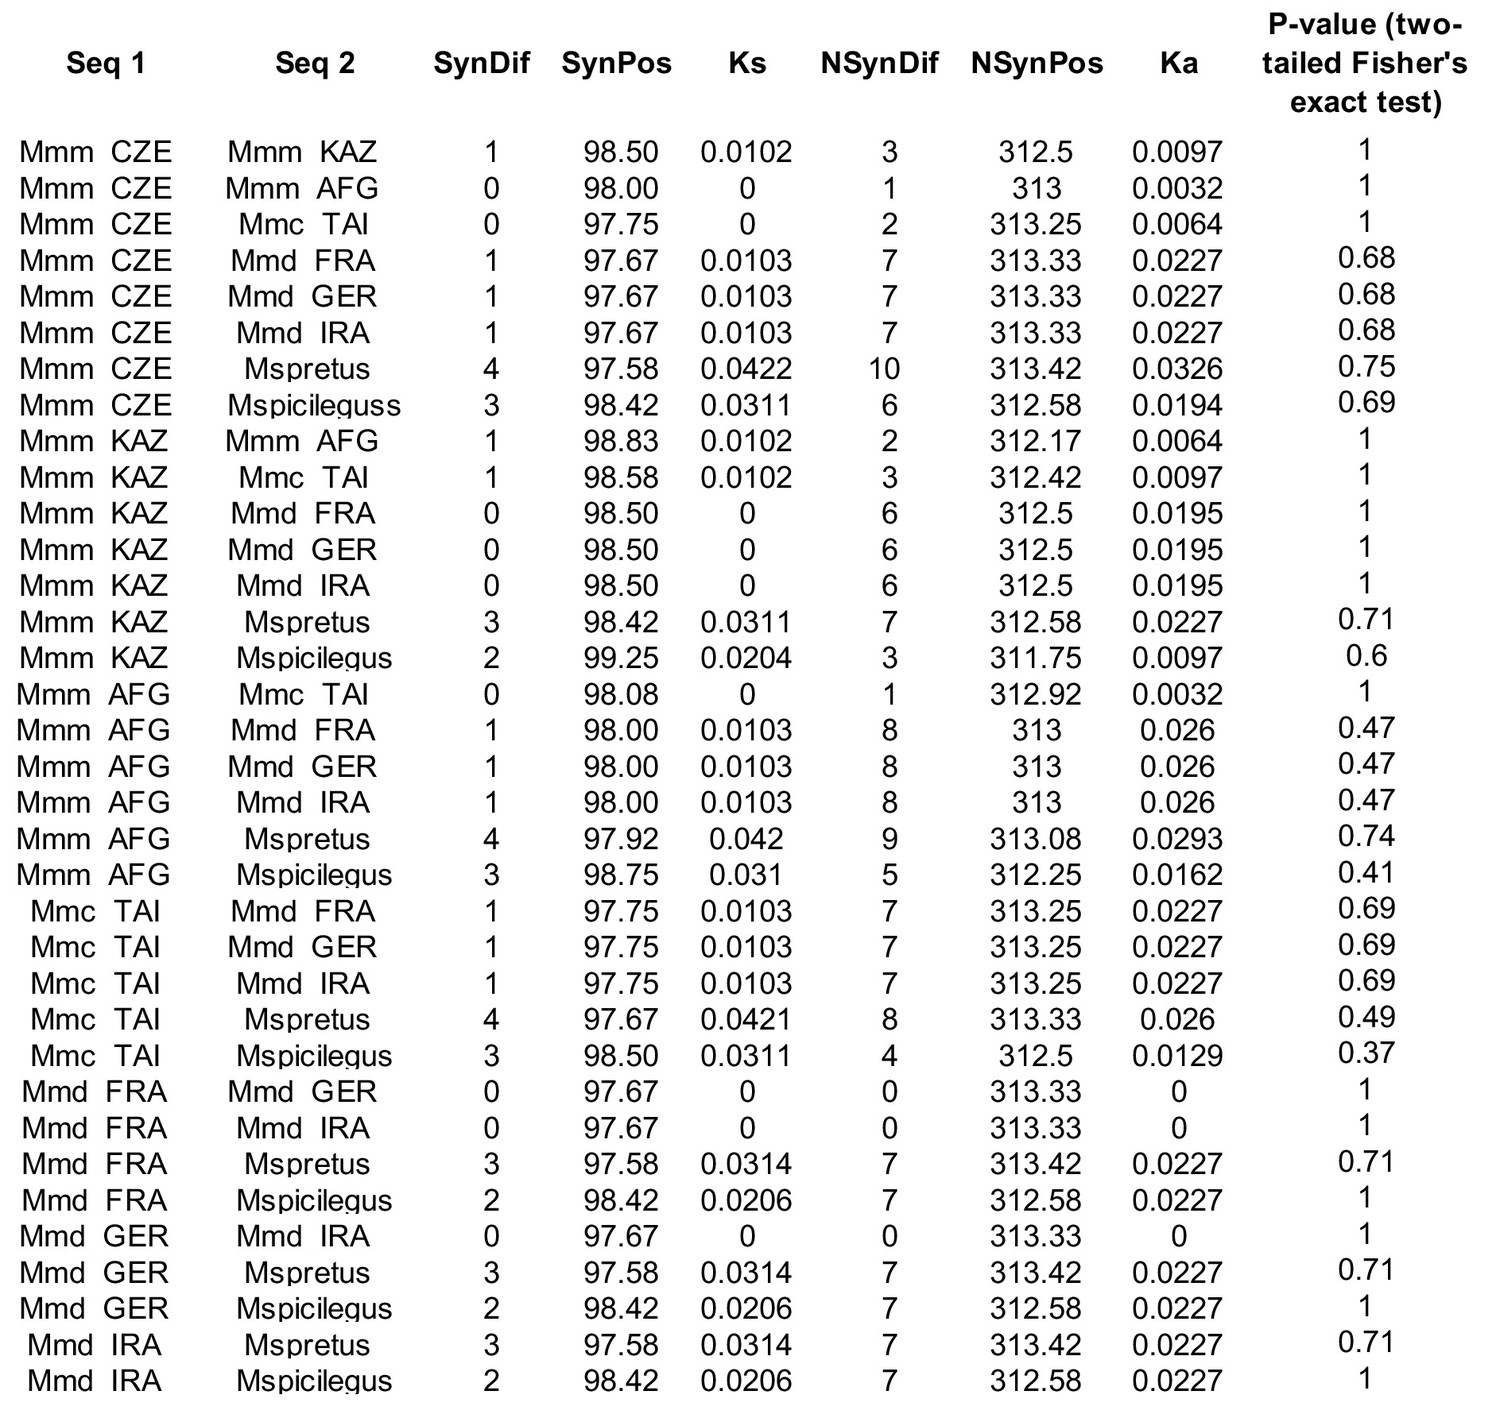
Table for all pairwise comparisons of the aligned reading frame of Gm13030 with the calculation of coding and non-coding positions, plus the observed numbers of substitutions (generated with DnaSP; Librado and Rozas, 2009).
P-values were calculated in a 2 × 2 contingency table using Fisher’s exact test.
Figure 4 with 3 supplements
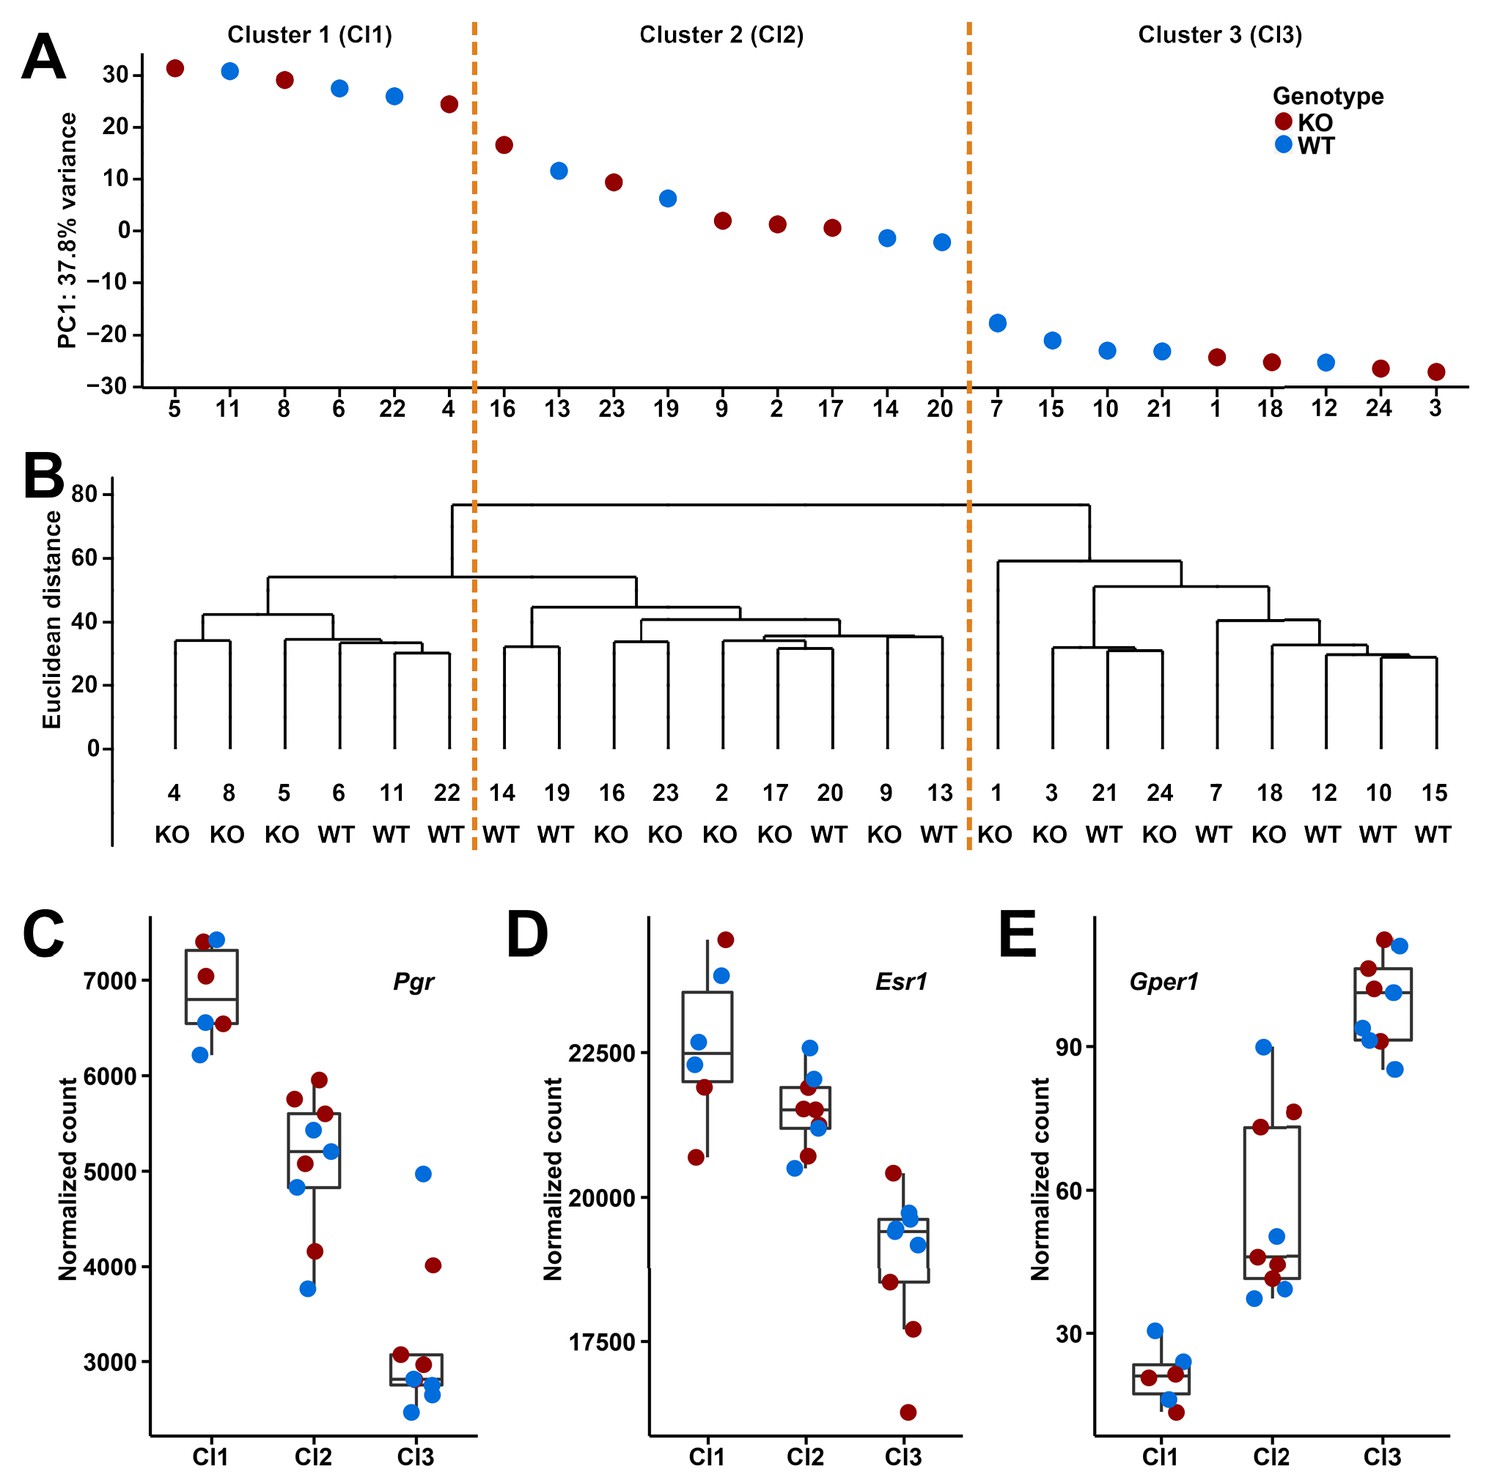
Clusters and expression levels in the 24 RNA-Seq samples of oviducts.
(A) PC1 values from the PCA analysis, (B) hierarchical clustering result. Sample codes and genotypes are listed along X-axis. The 24 samples are assigned into three clusters accordingly. (C-E) The expression levels of three sex hormone receptor genes (Pgr, Esr1, Gper1) are shown by box plots.
Figure 4—figure supplement 1
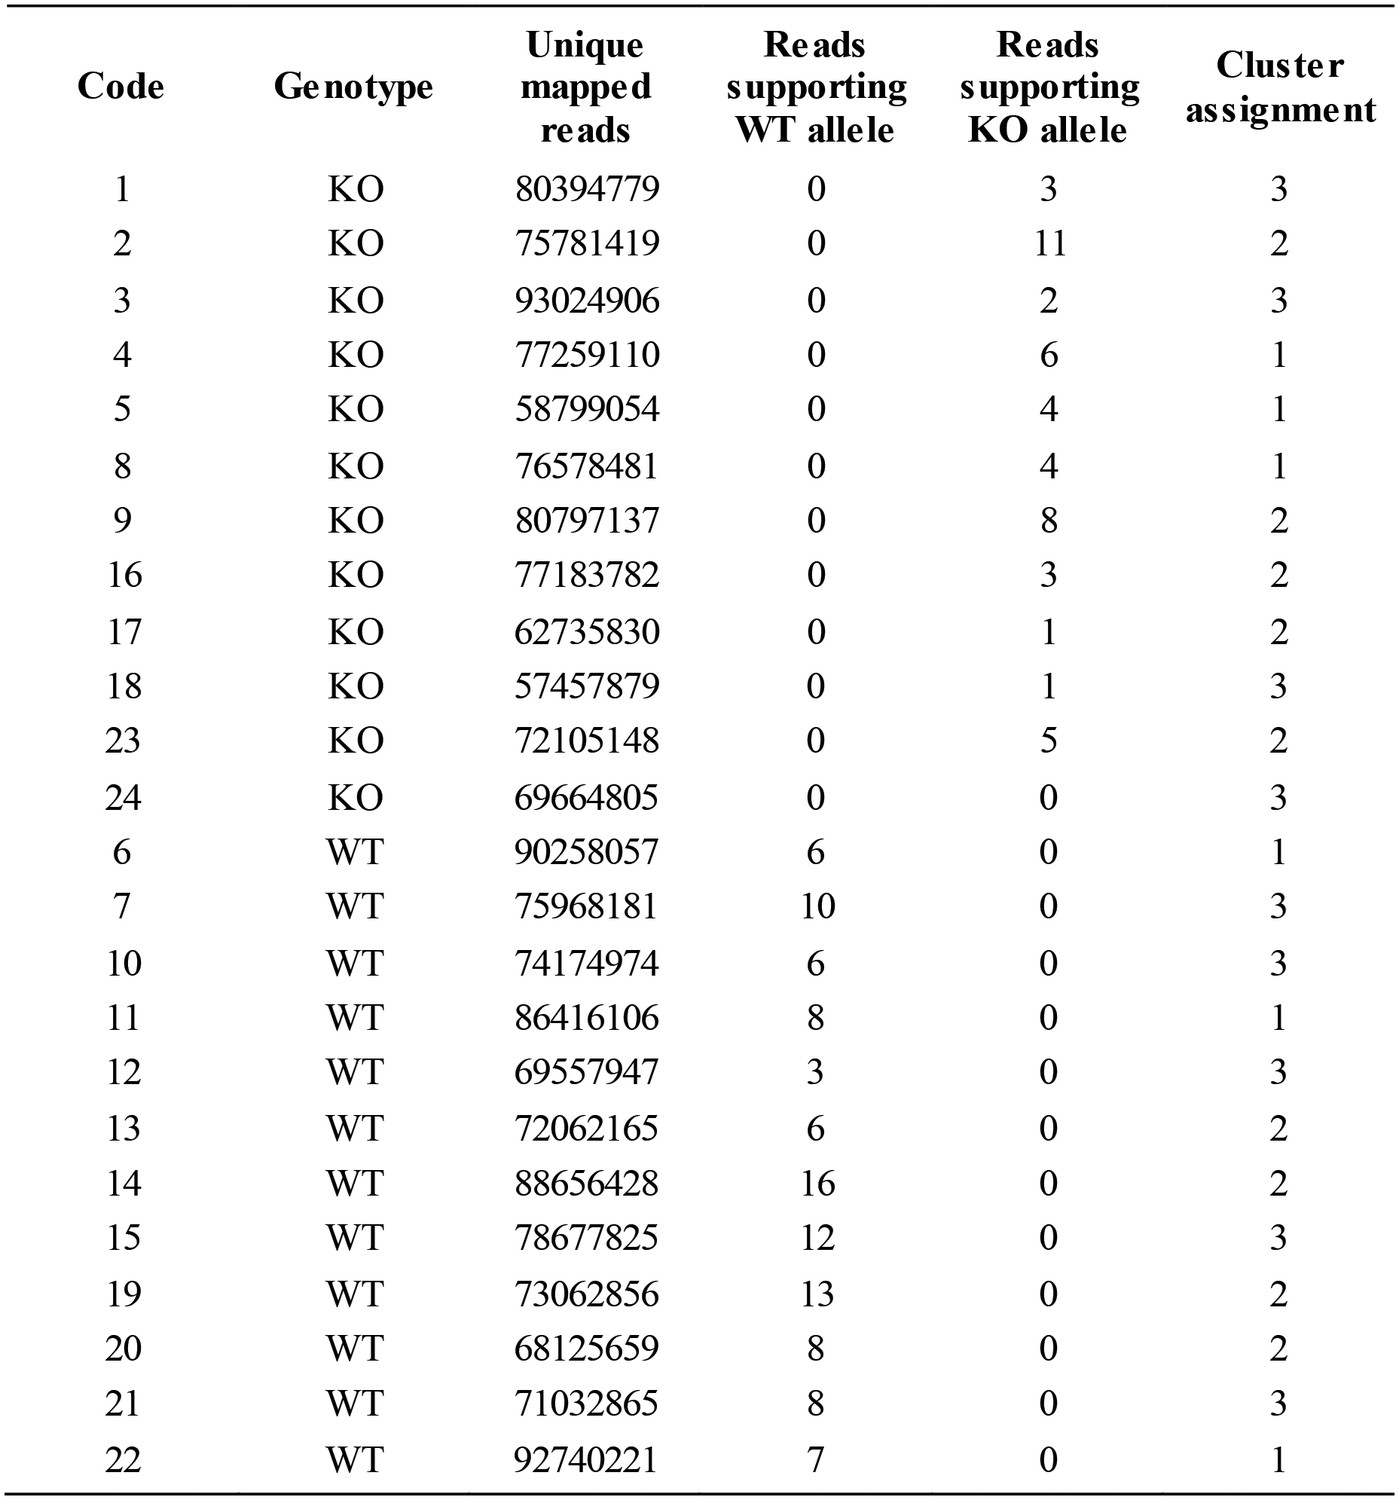
Oviduct sample details and read statistics.
Read statistics for the RNA-Seq samples of oviducts.
Figure 4—figure supplement 2
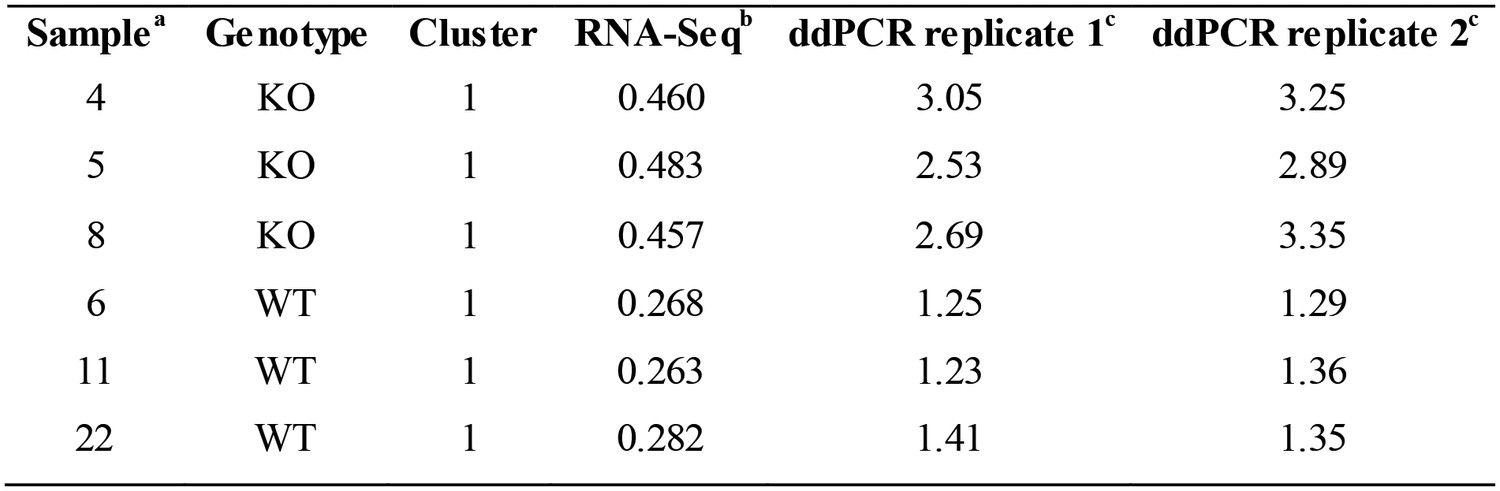
Dcpp expression confirmation.
The relative expression levels of three Dcpp genes in cluster one samples. Comparison of RNA-Seq counts and two replicates of ddPCR experiments (see experimental details in the Materials and method section). Note that the three Dcpp genes (Dcpp1, Dcpp2, and Dcpp3) are too similar to each other to allow to place primers that could distinguish them. Hence, both the RNA-Seq counts, as well as the ddPCR results reflect the cumulative expression levels. ddPCR test on the relative expression levels of the three Dcpp genes in cluster one samples.
Figure 4—figure supplement 3
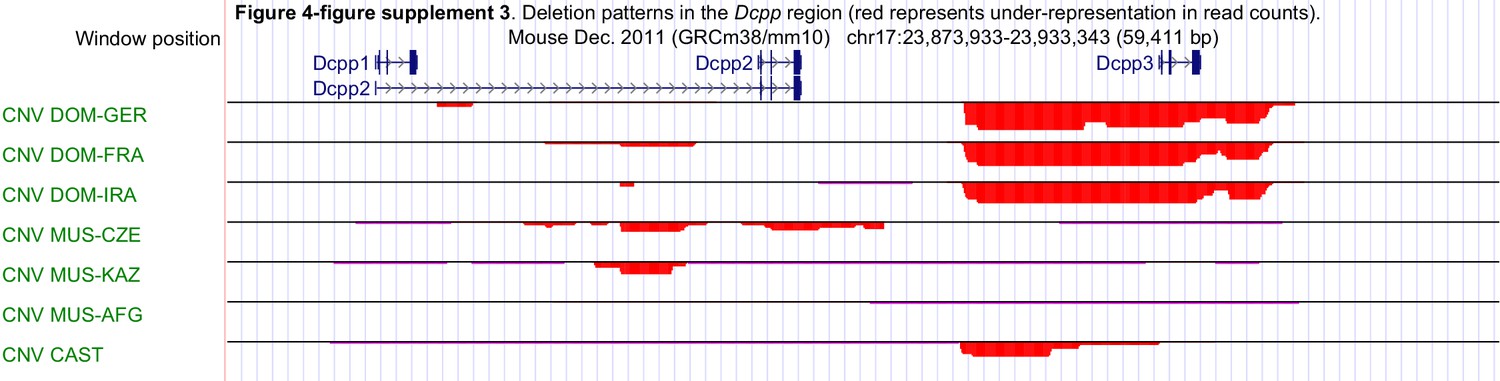
Deletion patterns in the Dcpp gene region of the different Mus musculus populations.
https://doi.org/10.7554/eLife.44392.013
Figure 5

Distributions of the time from the first litter to the second litter.
Time points of the second litter are plotted for the different genotypes, with box plots marked. A bimodal distribution becomes evident, as discussed in the text.
-
Figure 5—source data 1
Details of the fertility scores for the different groups of mice.
The mice listed under the UC codes are part of the standard stock breeding, the mice listed under the WT and KO codes were specifically set up to confirm the observations from the stock breeding.
- https://doi.org/10.7554/eLife.44392.016
Tables
Table 1
Differentially expressed genes in oviduct cluster 1.
https://doi.org/10.7554/eLife.44392.014| Gene ID | Gene name | Base meana | Fold change | Adjusted P-Value |
|---|---|---|---|---|
| ENSMUSG00000057417 | Dcpp3 | 3700 | 1.59 | 0.0000 |
| ENSMUSG00000096278 | Dcpp2 | 427 | 1.47 | 0.0000 |
| ENSMUSG00000096445 | Dcpp1 | 415 | 1.45 | 0.0000 |
| ENSMUSG00000034009 | Rxfp1 | 4410 | 1.35 | 0.0003 |
| ENSMUSG00000022206 | Npr3 | 349 | 1.36 | 0.0011 |
| ENSMUSG00000035864 | Syt1 | 666 | 1.34 | 0.0011 |
| ENSMUSG00000070348 | Ccnd1 | 7382 | 0.80 | 0.0012 |
| ENSMUSG00000058897 | Col25a1 | 1605 | 1.34 | 0.0015 |
| ENSMUSG00000059908 | Mug1 | 268 | 1.35 | 0.0015 |
| ENSMUSG00000063130 | Calml3 | 698 | 1.31 | 0.0018 |
| ENSMUSG00000015966 | Il17rb | 637 | 0.75 | 0.0025 |
| ENSMUSG00000022358 | Fbxo32 | 3614 | 1.31 | 0.0038 |
| ENSMUSG00000040724 | Kcna2 | 895 | 0.75 | 0.0038 |
| ENSMUSG00000061477 | Rps7 | 6247 | 1.20 | 0.0052 |
| ENSMUSG00000067786 | Nnat | 658 | 1.32 | 0.0052 |
| ENSMUSG00000019987 | Arg1 | 1208 | 1.32 | 0.0068 |
| ENSMUSG00000079017 | Ifi27l2a | 1065 | 1.32 | 0.0073 |
| ENSMUSG00000028031 | Dkk2 | 678 | 1.31 | 0.0077 |
| ENSMUSG00000022037 | Clu | 17139 | 1.22 | 0.0086 |
| ENSMUSG00000033715 | Akr1c14 | 23879 | 1.21 | 0.0086 |
| ENSMUSG00000034039 | Prss29 | 176 | 1.29 | 0.0086 |
-
aThe mean of the normalized read counts for all cluster one samples.
Key resources table
| Reagent type (species) or resource | Designation | Source or reference | Identifiers | Additional information |
|---|---|---|---|---|
| Gene (Mus musculus) | Gm13030; Shj | NA | Ensembl:ENSMUSG00000078518 | |
| Genetic reagent (M. musculus) | Gm13030 line | this paper | Generated from C57BL/6N line by introducing a 7 bp deletion using CRISPR/Cas9 at Mouse Biology Program (MBP). See detail in Materials and methods. | |
| Sequence-based reagent | Reverse transcription PCR primers | this paper | See Materials and methods. | |
| Sequence-based reagent | PCR and Sanger sequencing primers | this paper | See Materials and methods. | |
| Sequence-based reagent | Genotyping primers | this paper | See Materials and methods. | |
| Sequence-based reagent | Droplet digital PCR primers and probes | this paper | See Materials and methods. |
Additional files
-
Transparent reporting form
- https://doi.org/10.7554/eLife.44392.017
Download links
A two-part list of links to download the article, or parts of the article, in various formats.
Downloads (link to download the article as PDF)
Open citations (links to open the citations from this article in various online reference manager services)
Cite this article (links to download the citations from this article in formats compatible with various reference manager tools)
A de novo evolved gene in the house mouse regulates female pregnancy cycles
eLife 8:e44392.
https://doi.org/10.7554/eLife.44392


