The carboxyl-terminal sequence of bim enables bax activation and killing of unprimed cells
- McMaster University, Canada
- Sunnybrook Research Institute, Canada
- University of Toronto, Canada
- University of Oklahoma Health Sciences Center, United States
Figures
Figure 1 with 1 supplement
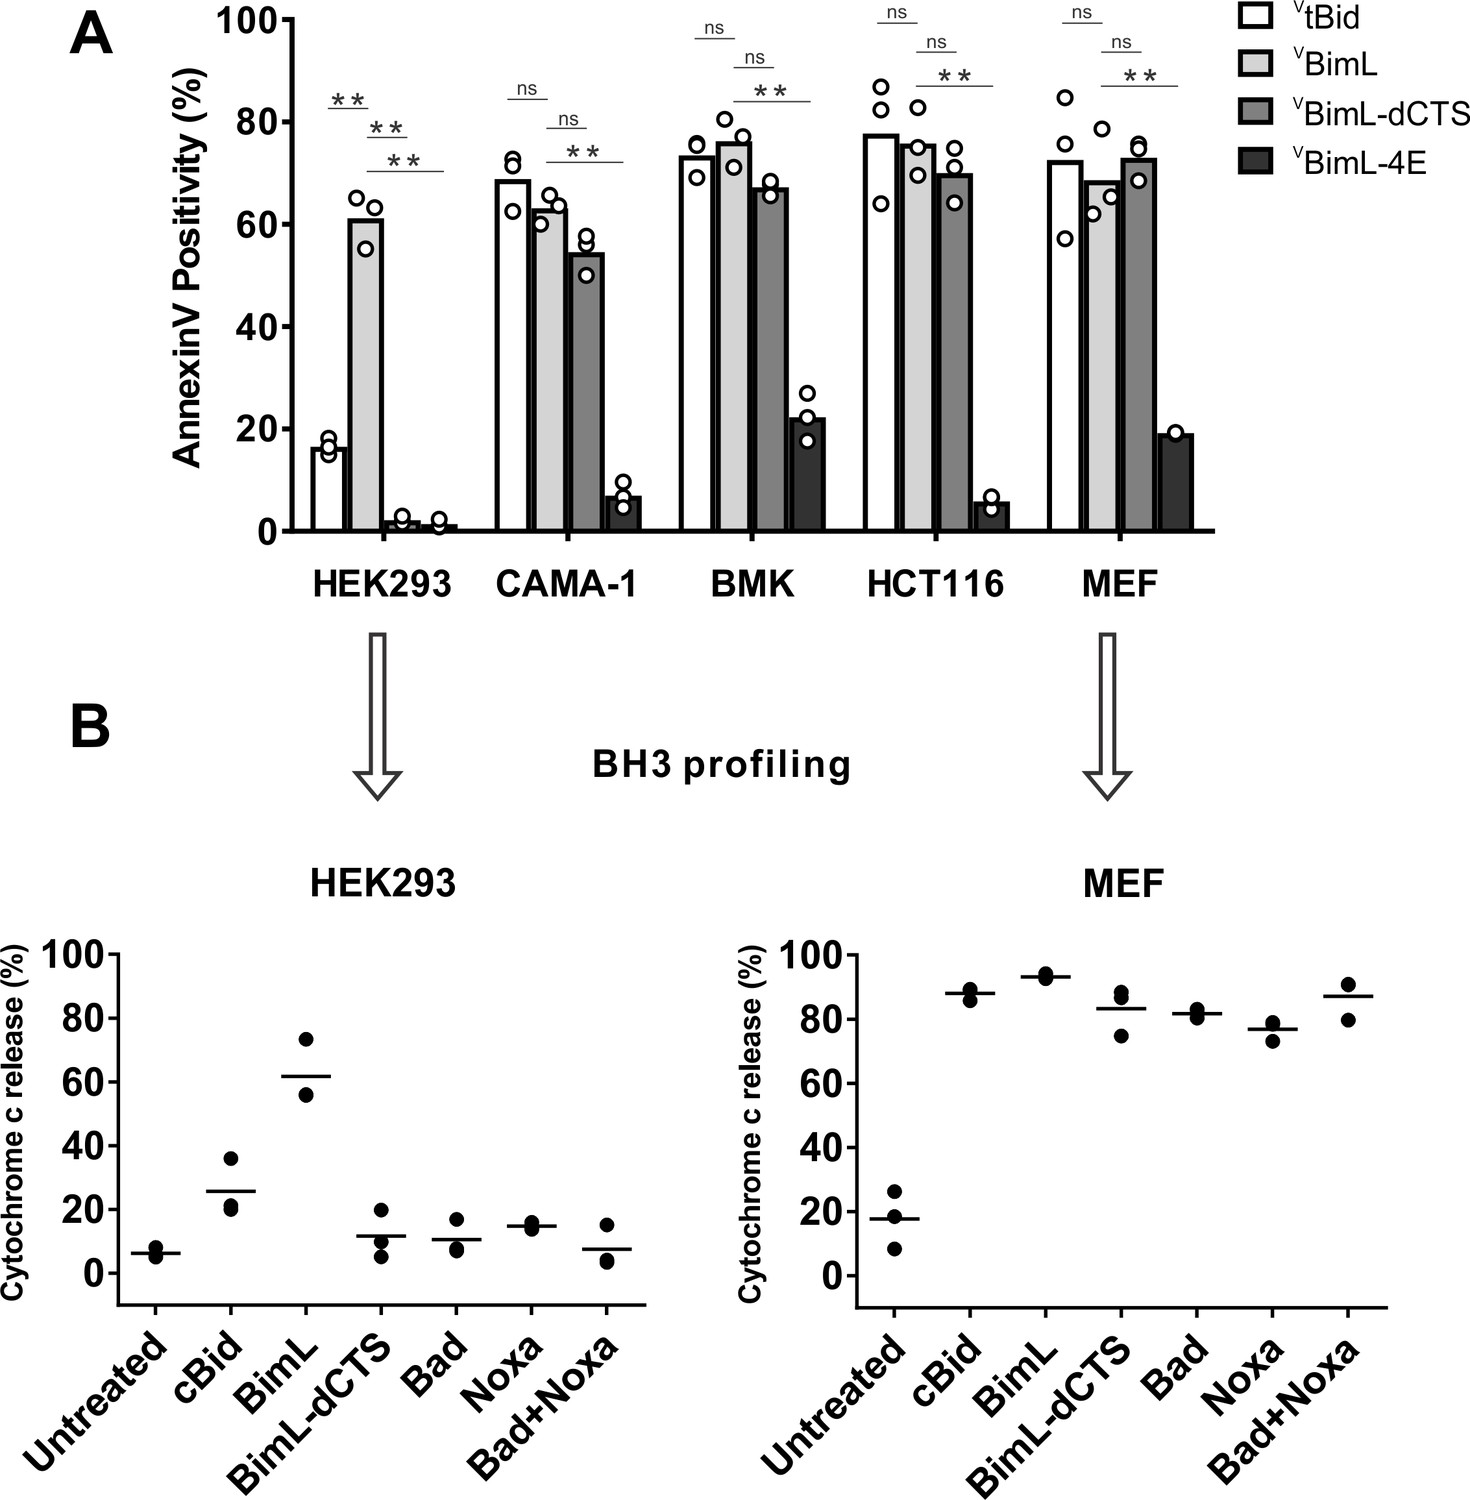
Cell lines demonstrate a range of apoptotic response to BimL-dCTS expression.
(A) Venus, VtBid VBimL, VBimL-dCTS or VBim-4E were expressed in the indicated cell lines by transient transfection. The cells were stained with the nuclear dye Draq5 and rhodamine labeled Annexin V, and imaged by confocal microscopy to identify cells undergoing apoptosis. At least 400 cells were analyzed for each condition. The Y axis indicates the percentage of Venus-positive cells that stained positive with Annexin V. Open circles represent the average for each replicate, while the bar height, represents the average for all three replicates. The means were assessed for significant differences using a one-way ANOVA within each group followed by a Tukey’s multiple comparisons test. *p-values<0.05, **p-
-
Figure 1—source data 1
Source data indicating that BimL requires a CTS to induce MOMP in HEK293 cells.
- https://cdn.elifesciences.org/articles/44525/elife-44525-fig1-data1-v2.xlsx
-
Figure 1—source data 2
Image data for MEF mitochondrial priming experiments.
- https://cdn.elifesciences.org/articles/44525/elife-44525-fig1-data2-v2.zip
-
Figure 1—source data 3
Image data for HEK293 mitochondrial priming experiments.
- https://cdn.elifesciences.org/articles/44525/elife-44525-fig1-data3-v2.zip
Figure 1—figure supplement 1
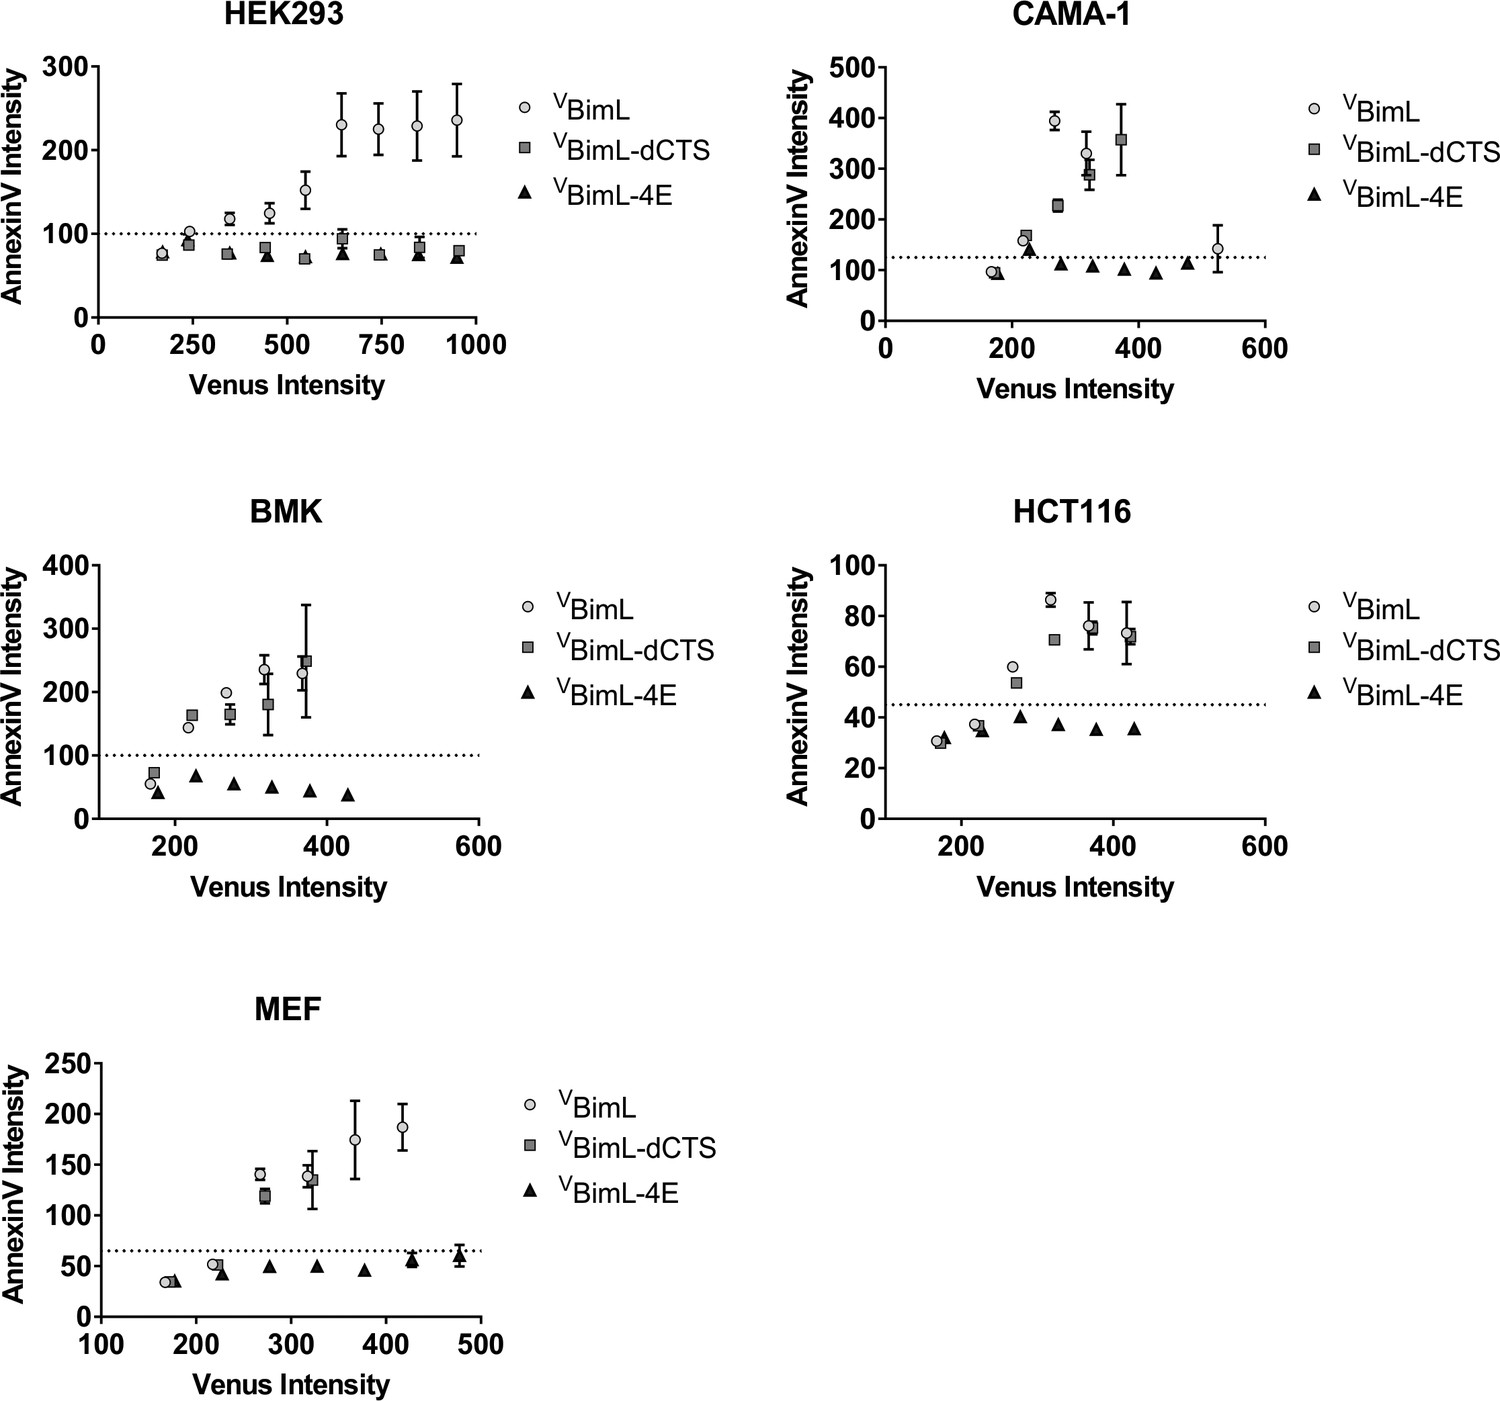
Correlation between expression of VBH3-proteins and apoptosis measured as Annexin V labeling.
For each cell line, the Annexin V Rhodamine intensity per cell was plotted against the Venus intensity per cell. The Venus intensity acts as a surrogate for the relative amount of each of the BimL mutant proteins expressed in one cell. Cells with intensity in the Venus channel equal to or less than the mean signal from untransfected cells were pooled as the first point, the subsequent points are data from intensity bins with arbitrary 50 unit increments. The horizontal dotted line indicates two standard deviations above the signal from untransfected cells in the AnnexinV channel. The cell line is indicated at the top of each panel.
-
Figure 1—figure supplement 1—source data 1
Source data of binned Venus intensities and Annexin V positivity.
- https://cdn.elifesciences.org/articles/44525/elife-44525-fig1-figsupp1-data1-v2.xlsx
Figure 2
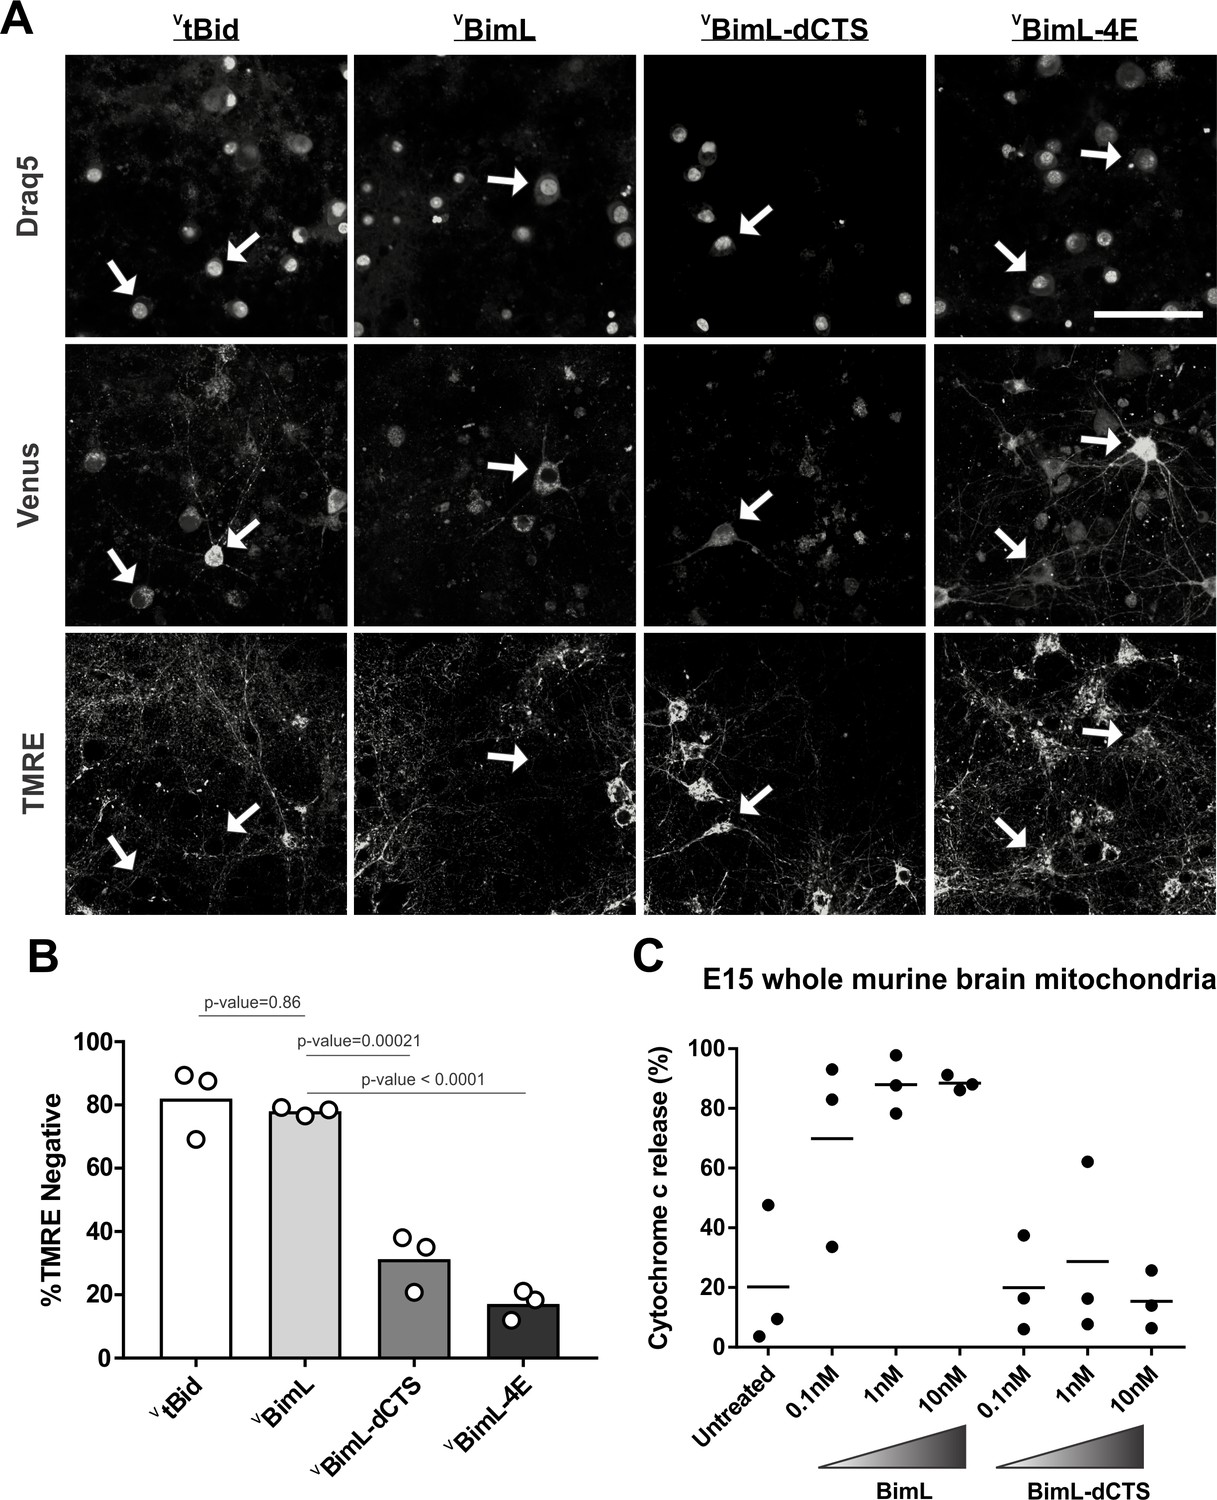
Full-length BimL is required to kill cultures of primary cortical neurons.
(A) Representative images of primary cortical neurons infected with lentivirus to express VtBid, VBimL, VBimL-dCTS or VBimL-4E as indicated above. Each row is a different channel as indicated to the left, for the same field of cells. White arrows indicate illustrative neurons expressing Venus and hence fluorescent. Scale bar is 80 μm. (B) Quantified data from Venus expressing primary cortical neurons. Percentage of Venus-expressing cells that stain negative with TMRE dye (% TMRE Negative). Open circles; averages for three biological replicates each representing 90–1000 cells analyzed. The Bar height; mean. A one-way ANOVA was used followed by a Tukey’s multiple comparisons test to compare the means of each group. (C) Mitochondria extracted from embryonic day 15 (E15) mouse brains (0.5 mg/mL) were incubated with the indicated BH3-only proteins. Cytochrome c release, indicative of MOMP, was quantified using immunoblotting. Each point (black circle) represents one independent replicate, with the line representing the average across all three.
-
Figure 2—source data 1
Source data for experiments demonstrating that VBimL-dCTS does not kill mature cultures of mouse neurons.
- https://cdn.elifesciences.org/articles/44525/elife-44525-fig2-data1-v2.xlsx
-
Figure 2—source data 2
Image data for E15 brain mitochondria priming experiments.
- https://cdn.elifesciences.org/articles/44525/elife-44525-fig2-data2-v2.zip
Figure 3

The Bim CTS is required to activate Bax to permeabilize membranes.
Cartoons indicate the binding interactions being measured. Equilibria symbols indicate the predicted balance of complexes for BimL (blue), Bax (red), liposomes (tan), mitochondria (black). For each graph, data from three independent experiments are shown as individual points. Due to overlap, some points may not be visible. (A) Activation of Bax by BimL assessed by measuring permeabilization of ANTS/DPX filled liposomes (0.04 mg/mL) after incubation of Bax (100 nM) with the indicated concentrations of BimL or BimL-dCTS. Fluorescence intensity, indicative of membrane permeabilization, was measured using the Tecan infinite M1000 microplate reader and converted to percent release by comparison with detergent-mediated liposome lysis. (B)Permeabilization of the outer mitochondrial membrane by Bax (50 nM) in response to activation by the indicated amounts of Bim and BimL-dCTS was assessed by measuring SMAC-mCherry release from mitochondria. (C) Bim binding to Bax in solution measured by FRET. Alexa568-labeled BimL or BimL-dCTS (4 nM) was incubated with the indicated amounts of Alexa647-labeled Bax and FRET was measured from the decrease in Alexa568 fluorescence. (D) Bim binding to Bax measured by FRET in samples containing mitochondrial-like liposomes. FRET was measured as in (C) with 4 nM Alexa568-labeled BimL or BimL-dCTS and the indicated amounts of Alexa647-labeled Bax.
-
Figure 3—source data 1
Source data for experiments demonstrating that BimL-dCTS cannot bind to nor activate Bax.
- https://cdn.elifesciences.org/articles/44525/elife-44525-fig3-data1-v2.xlsx
Figure 4
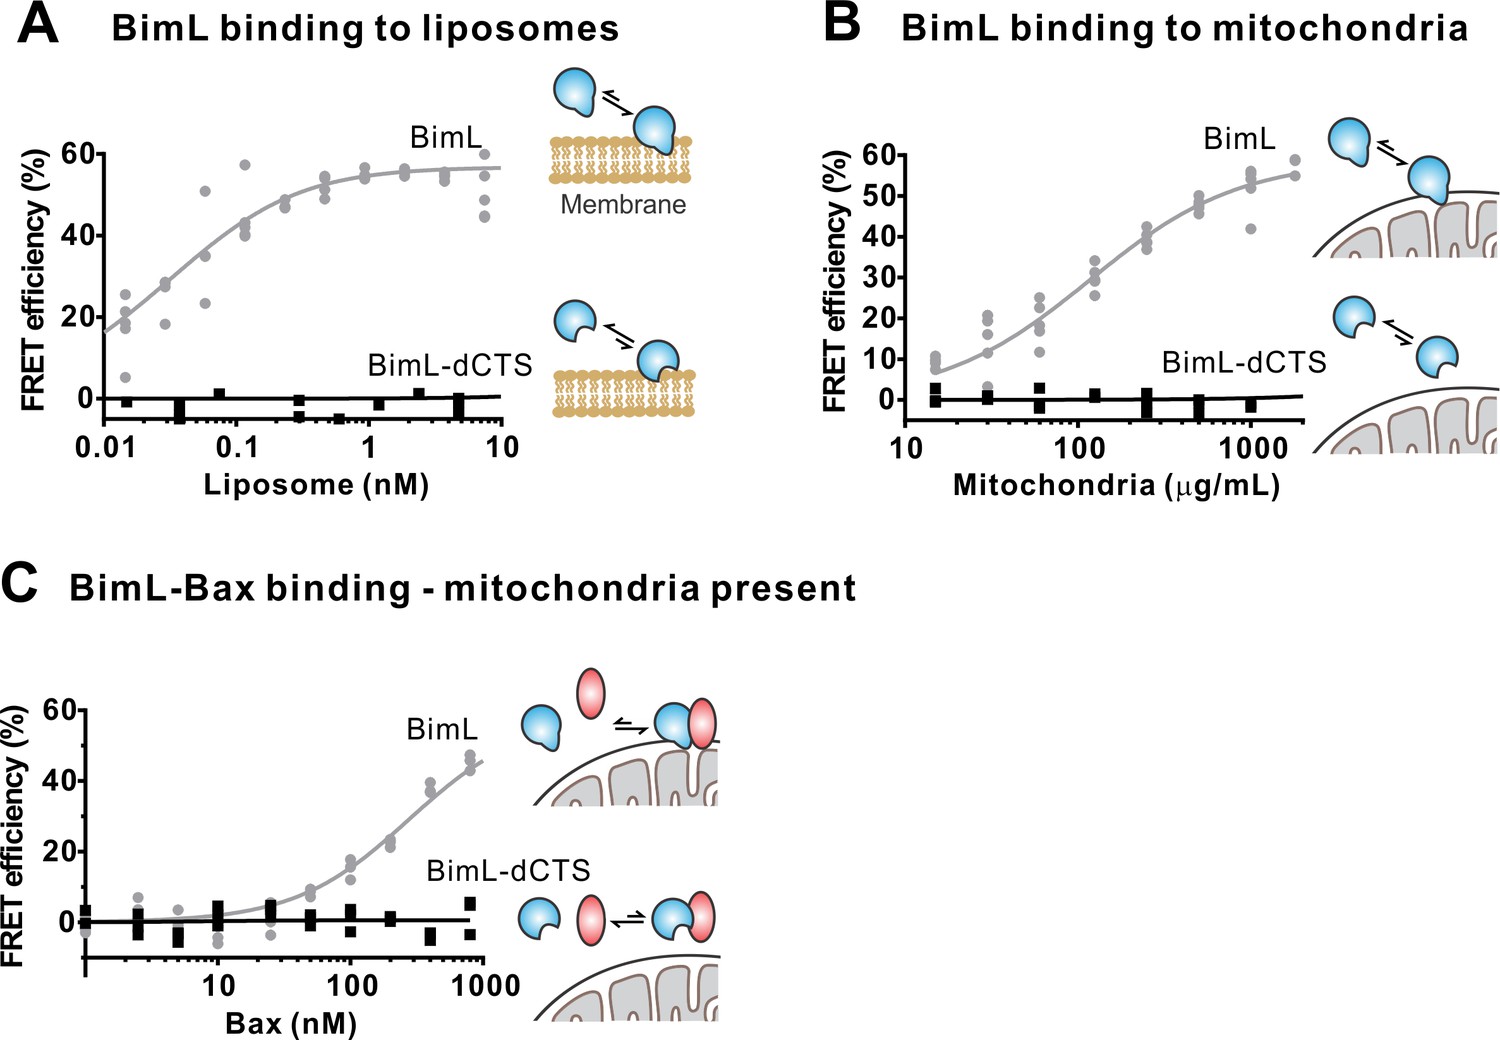
The Bim CTS is required to bind BimL to membranes in vitro.
Cartoons indicate the binding interactions being measured. Equilibria symbols indicate the predicted balance of complexes for Bim (blue), Bax (red), liposomes (tan), and mitochondria (black). Unless stated otherwise, for each graph, data from three independent experiments are shown as individual points. Due to overlap, some points may not be visible. (A) The CTS of Bim is necessary for Bim to bind to liposomes. Bim binding to mitochondrial-like liposomes assessed by measuring FRET between 20 nM Alexa568-labeled BimL or BimL-dCTS and the indicated amounts of DiD-labeled liposomes. (B) The CTS of Bim is necessary for Bim to bind to mitochondria. Binding of 4 nM Alexa568-labeled BimL (n = 5) or BimL-dCTS to the indicated amounts of DiD-labeled mouse liver mitochondria was assessed by measuring FRET. (C) The CTS of Bim is necessary for Bim to bind to Bax at mitochondria. Bim binding to Bax was measured by FRET in samples containing mouse liver mitochondria, 4 nM Alexa568-labeled BimL (gray) or BimL-dCTS (black) and the indicated amounts of Alexa647-labeled Bax.
-
Figure 4—source data 1
Source data for experiments demonstrating the Bim CTS is required to bind BimL to membranes.
- https://cdn.elifesciences.org/articles/44525/elife-44525-fig4-data1-v2.xlsx
Figure 5
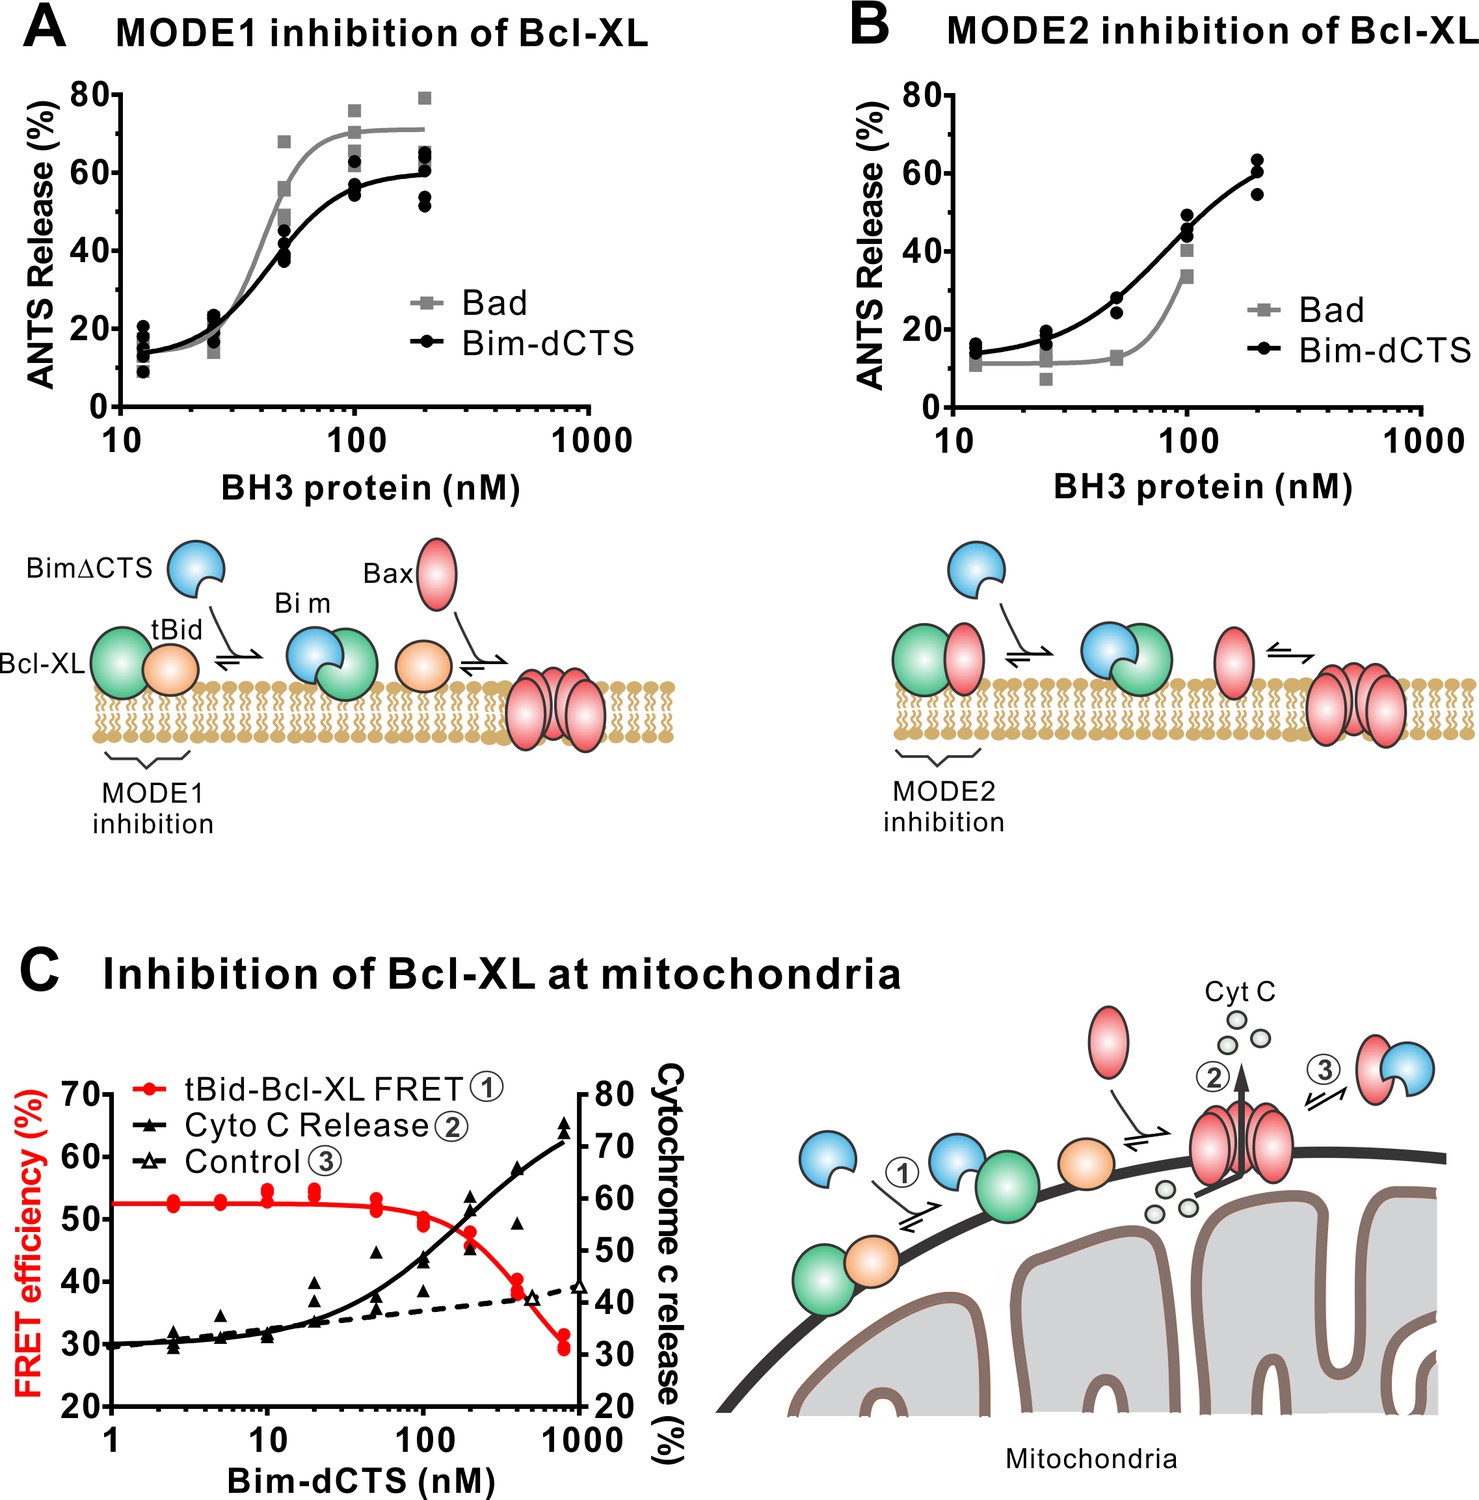
The Bim CTS is not required to inhibit Bcl-XL.
(A–B) BimL-dCTS and Bad release tBid (A) or Bax (B) from Bcl-XL. 20 nM tBid (A) or tBidmt1 (B) a protein that activates Bax but does not bind Bcl-XL, were incubated with 100 nM Bax, 40 nM Bcl-XL, 0.04 mg/mL ANTS/DPX liposomes, and the indicated amounts of either Bad or BimL-dCTS. Liposome permeabilization was assessed after incubation at 37 °C for 3 hr by measuring the increase in fluorescence due to ANTS/DPX release. Cartoons indicate the interactions measured, BimL (blue), Bax (red), tBid (orange), Bcl-XL (green), and membranes (tan). (C) BimL-dCTS displaced tBid from Bcl-XL and permeabilized mitochondria. Mitochondria were incubated with Bcl-XL (40 nM), tBid (20 nM), Bax (100 nM) and mitochondria. Increasing concentrations of BimL-dCTS were added and displacement of tBid from Bcl-XL was measured by FRET. Mitochondria were then pelleted and cytochrome c release measured by western blotting. Control reactions containing only Bax and BimL-dCTS did not result in cytochrome c release (dotted line). Individual points are shown for three independent replicates. Not all points are visible due to overlap. The adjacent cartoon indicates the interactions measured.
-
Figure 5—source data 1
Source data demonstrating that recombinant BimL-dCTS indirectly activates Bax through inhibition of Bcl_XL.
- https://cdn.elifesciences.org/articles/44525/elife-44525-fig5-data1-v2.xlsx
Figure 6 with 1 supplement
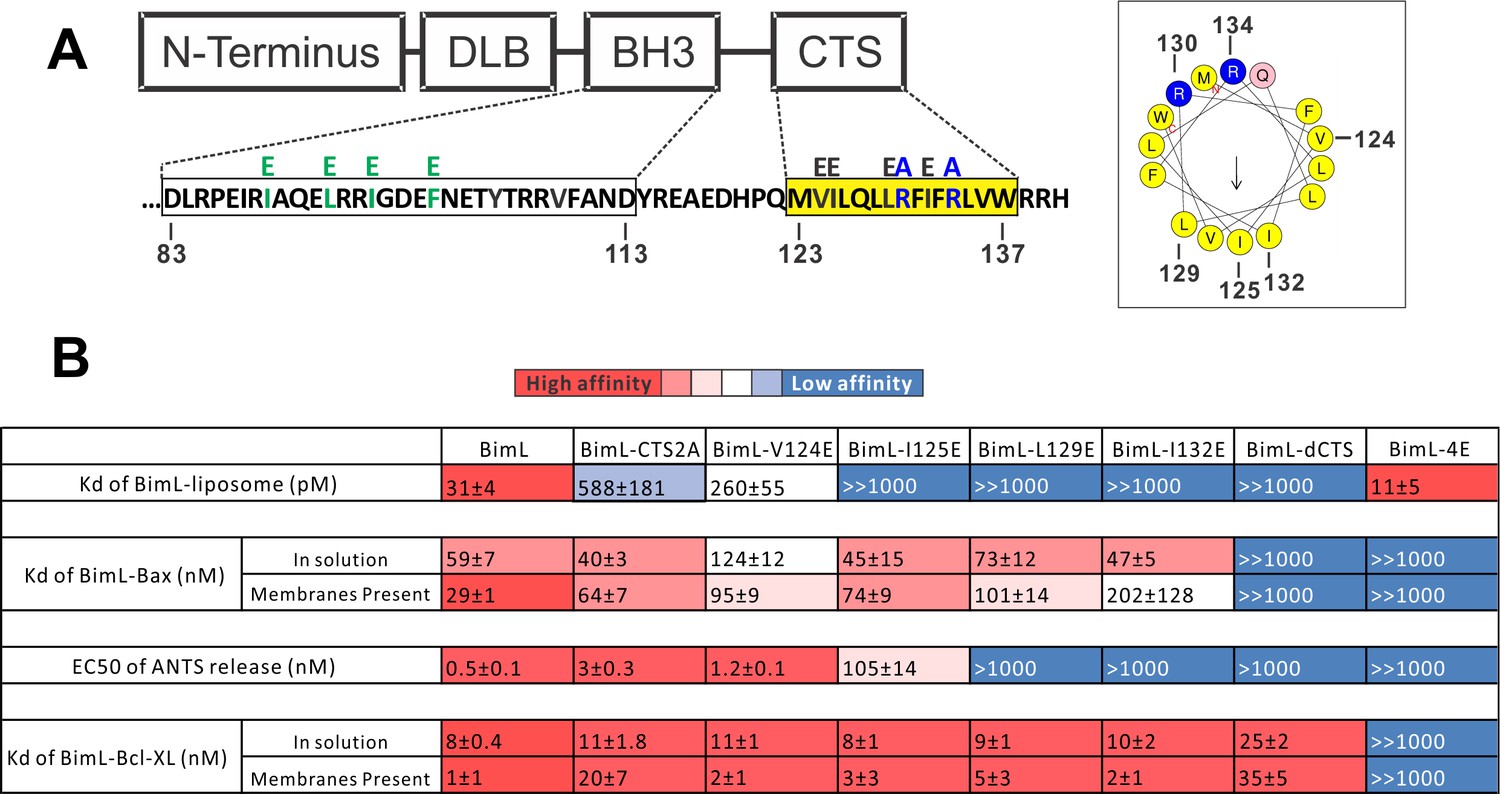
Residues within the Bim CTS distinctly regulate membrane binding and Bax activation.
(A) Diagram of BimL depicting the various domains (DLB: dynein light chain binding motif) and the sequences of the BH3-domain and CTS. The four essential hydrophobic residues in BH3-domain that were mutated to glutamic acid are colored green. Two positive charged residues in the CTS mutated to alanine are colored blue. Glutamic acid mutations for individual hydrophobic residues in the CTS are indicated in black on top of the original sequence. A predicted alpha helix structure generated via HeliQuest software is shown on the right, indicating the amphipathic nature of the CTS. The arrow central to the helix shows the polarity direction for hydrophobicity. The Q indicated in pink is the fifth amino acid in the CTS. Other residues are colored as in the linear sequence. (B) Binding of BimL mutants to liposomes, Bax and Bcl-XL expressed as apparent dissociation constants (Kd) measured from raw data as in Figure 6—figure supplement 1 for each binary interaction. Activation of Bax (EC50) measured from ANTS/DPX assays in Figure 6—figure supplement 1. Values are mean ± SEM (n = 3). The table is colour-coded in a heat map fashion as follows: red 0–40; light red 40–80; light pink 80–120; white 120–500; light blue 500–1000; Dark blue >1000. All values are nM except for binding to liposomes which is in pM. The Kds for ‘membranes present’ measurements are apparent values since diffusion for the protein fraction bound to membranes is in two dimensions while diffusion for the fraction of protein in solution is in three dimensions and several of the binary interactions take place in both locations. Apparent Kd values may also be affected by competing interactions with membranes.
Figure 6—figure supplement 1
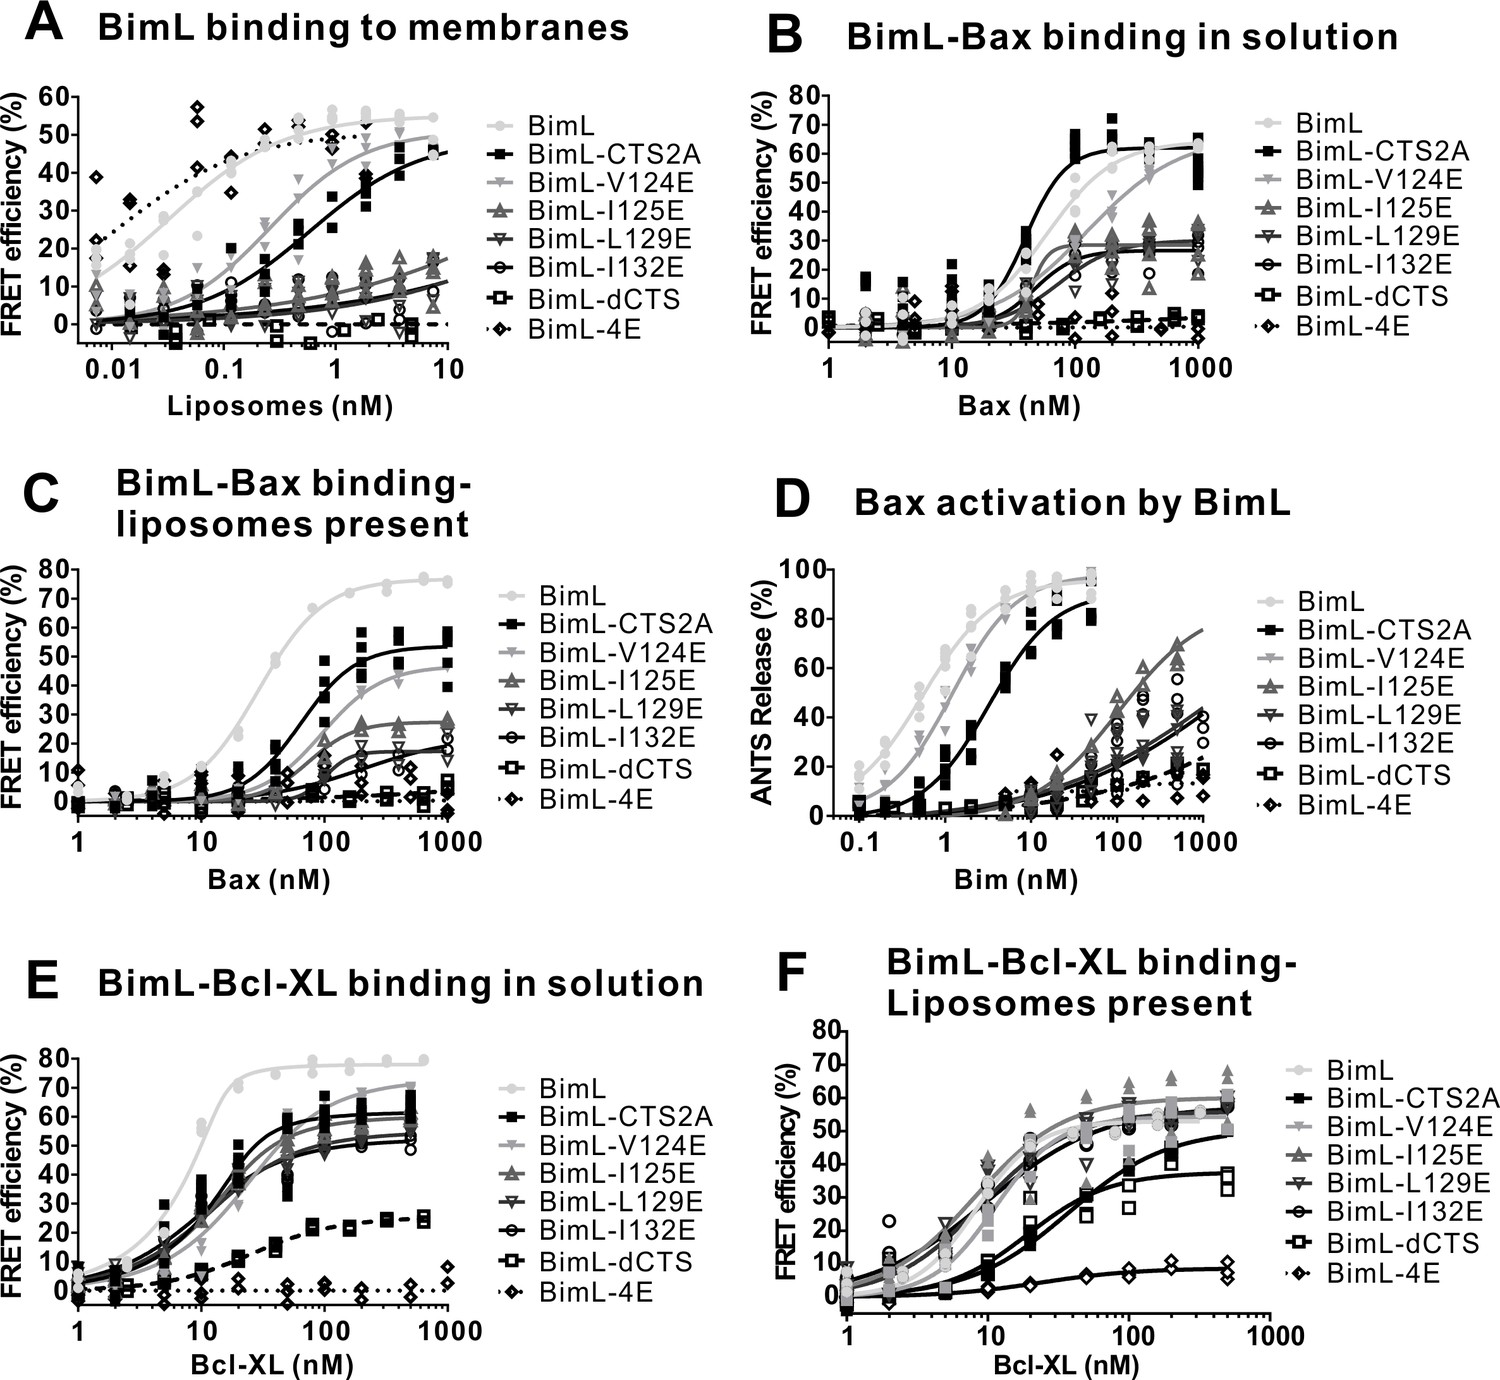
Full titrations using recombinant proteins identifies residues in the Bim CTS important for binding to membranes, and for Bim binding to and activating Bax.
(A) BimL binding to membranes. (B) BimL binding to Bax in solution. (C) BimL binding to Bax, with - Liposomes present. (D) Bax (100 nM) activation by BimL. (E) BimL binding to Bcl-XL in solution. (F) BimL binding to Bcl-XL, with Liposomes present For FRET experiments in (A-C) and (E,F), 20 nM of the indicated Alexa568-labeled BimL mutants (FRET donor) were incubated with the indicated concentrations of the Alexa647-labeled FRET acceptor labeled proteins. For each panel, data from three independent experiments are shown as individual points. Some points are not visible due to overlap. The mutants analyzed are indicated to the right of the graphs. To permit accurate estimation of the binding constants presented in Figure 6, data was collected to saturation for all mutants (for some curves 1600 nM or 3200 nM acceptor concentrations were required). For presentation purposes all curves were truncated at 1000 nM. Non measurable binding is represented by Kds > 1000.
-
Figure 6—figure supplement 1—source data 1
Source data with fitted curves used to calculate dissociation constants and EC50's for Figure 6B.
- https://cdn.elifesciences.org/articles/44525/elife-44525-fig6-figsupp1-data1-v2.xlsx
Figure 7 with 2 supplements
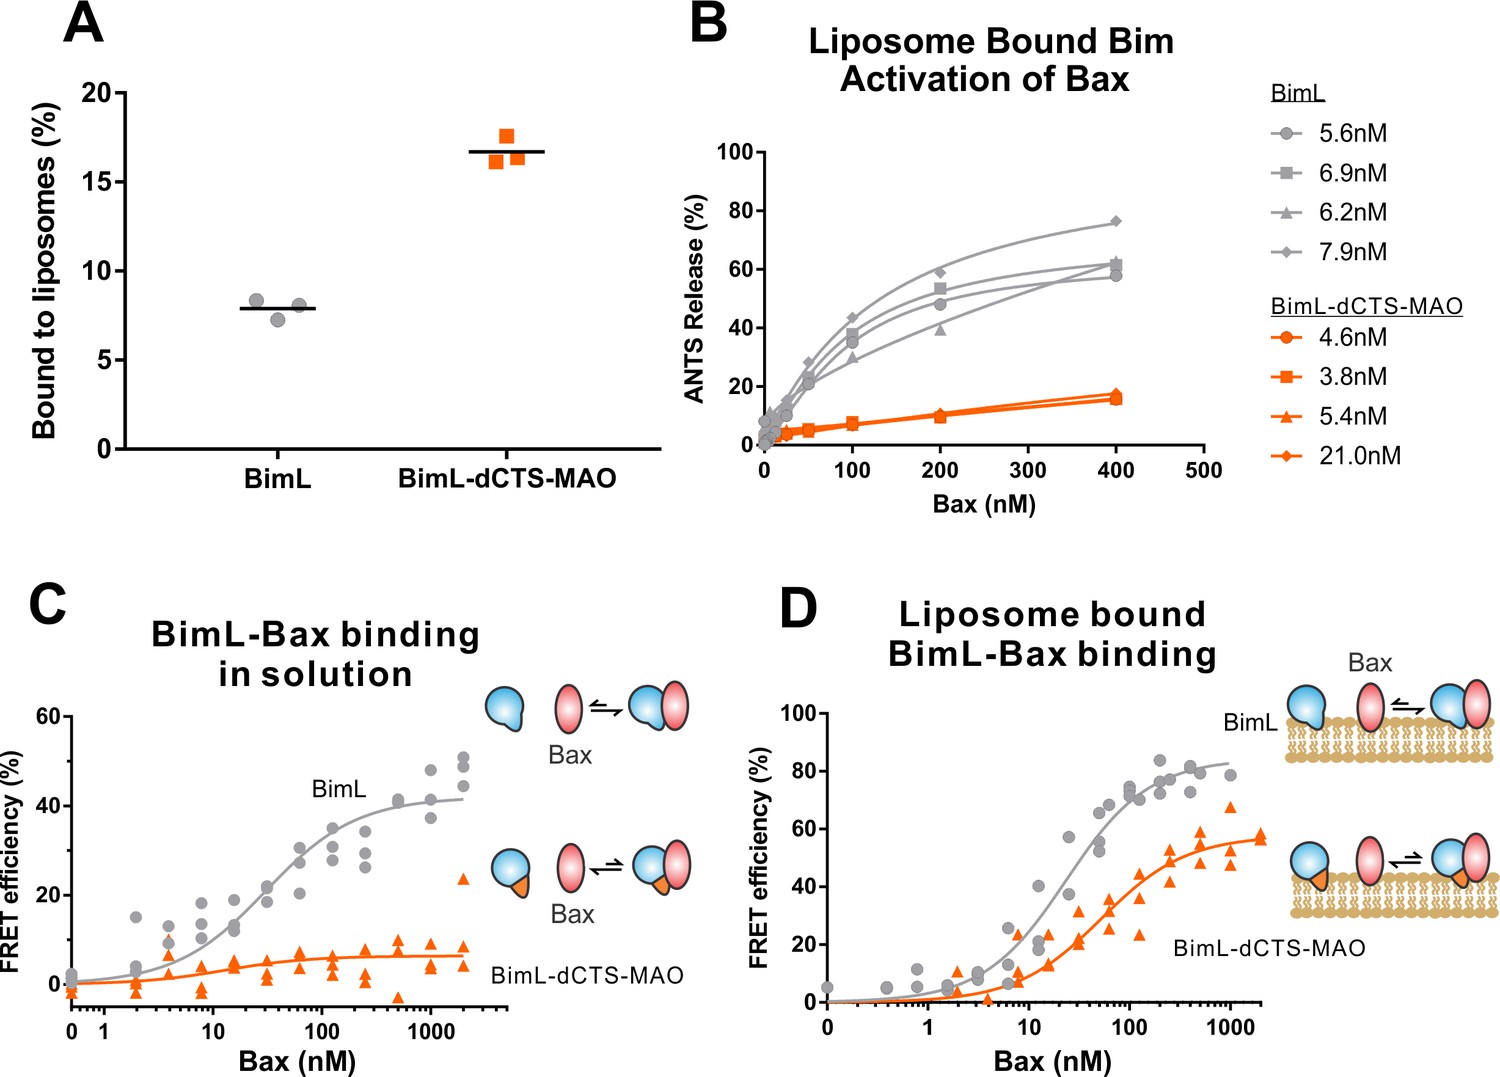
BimL-dCTS-MAO binds to liposomes and Bax but activates Bax poorly.
Cartoons at the side indicate the measurements being made with equilibria arrows representing the results obtained. Blue objects, Bim. Red ovals, Bax. Blue and orange objects, BimL-dCTS-MAO. (A)BimL-dCTS-MAO targets to liposomes as efficiently as BimL. Alexa568-labeled single cysteine (Q41C) recombinant BimL, and BimL-dCTS-MAO (20 nM) were incubated with 0.5 mg/ml of liposomes for 40 min at 37°C. Liposomes were then subjected to gel filtration column chromatography, and the Alexa568 fluorescence was measured in the liposome fractions. (B) Restoring membrane binding to BimL-dCTS by adding the MAO tail-anchor sequence (BimL-dCTS-MAO) did not restore Bax activation function. Using gel filtration chromatography, Alexa568-labeled Bim bound to liposomes containing ANTS/DPX were isolated, and the concentration of membrane-bound Bim was calculated based on Alexa568 fluorescence. Increasing concentrations of recombinant Bax protein were then added to these liposomes, and Bax activation was measured as an increase in ANTS release. (C)BimL-dCTS-MAO does not bind to Bax in solution. 10 nM of Alexa568-labeled BimL or BimL-dCTS-MAO was incubated with increasing amounts of Alexa647-labeled Bax. FRET was measured as a decrease in Alexa568 fluorescence signal. (D) Liposome bound labeled BimL-dCTS-MAO binds to Bax. Liposomes were incubated with Alexa568-labeled BimL or BimL-dCTS-MAO as in (B), and incubated with increasing amounts of Alexa647-labeled Bax. FRET was measured as a decrease in Alexa568 fluorescence.
-
Figure 7—source data 1
Source data demonstrating that BimL-dCTS-MAO binds to liposomes and Bax, but activates Bax poorly.
- https://cdn.elifesciences.org/articles/44525/elife-44525-fig7-data1-v2.xlsx
Figure 7—figure supplement 1
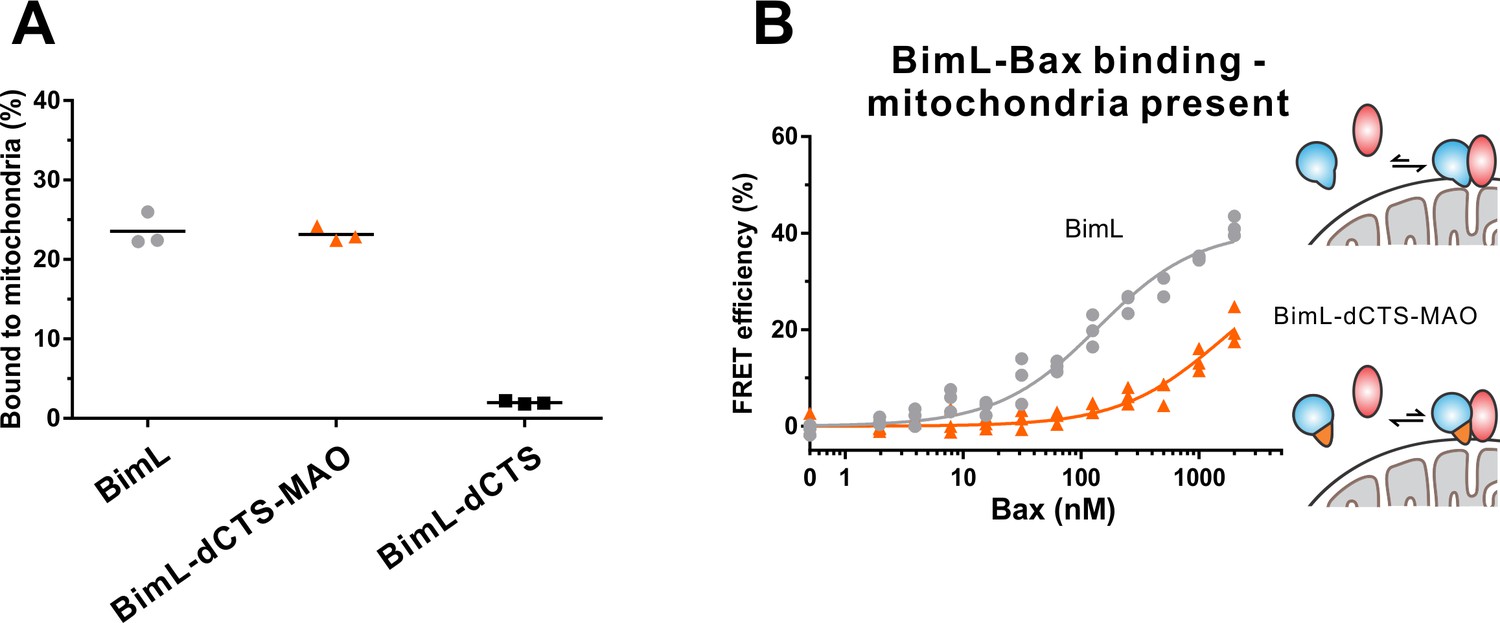
BimL-dCTS-MAO binds to mitchondrial membranes but binds poorly to Bax.
(A) Percentage of recombinant Bim proteins that bind to purified mouse liver mitochondria. Alexa568-labeled recombinant BimL proteins were incubated with 0.2 mg/mL of mitochondria for 30 min, and then mitochondria were isolated by centrifugation. Fluorescence was measured for both the supernatant and the pellet fractions and the fluorescence in the mitochondrial pellet expressed as percent of fluorescent protein bound to mitochondria. (B) BimL-dCTS-MAO binds poorly to Bax in the presence of mitochondria. Bim binding to Bax was measured by FRET in samples containing mouse liver mitochondria (0.2 mg/mL), Alexa568-labeled BimL (gray) or BimL-dCTS-MAO (orange) (both 4 nM) and the indicated amounts of Alexa647-labeled Bax. Data from three independent experiments are shown, not all symbols are visible due to overlap.
-
Figure 7—figure supplement 1—source data 1
Source data demonstrating BimL-dCTS-MAO binds to mitochondria but binds poorly to Bax.
- https://cdn.elifesciences.org/articles/44525/elife-44525-fig7-figsupp1-data1-v2.xlsx
Figure 7—figure supplement 2
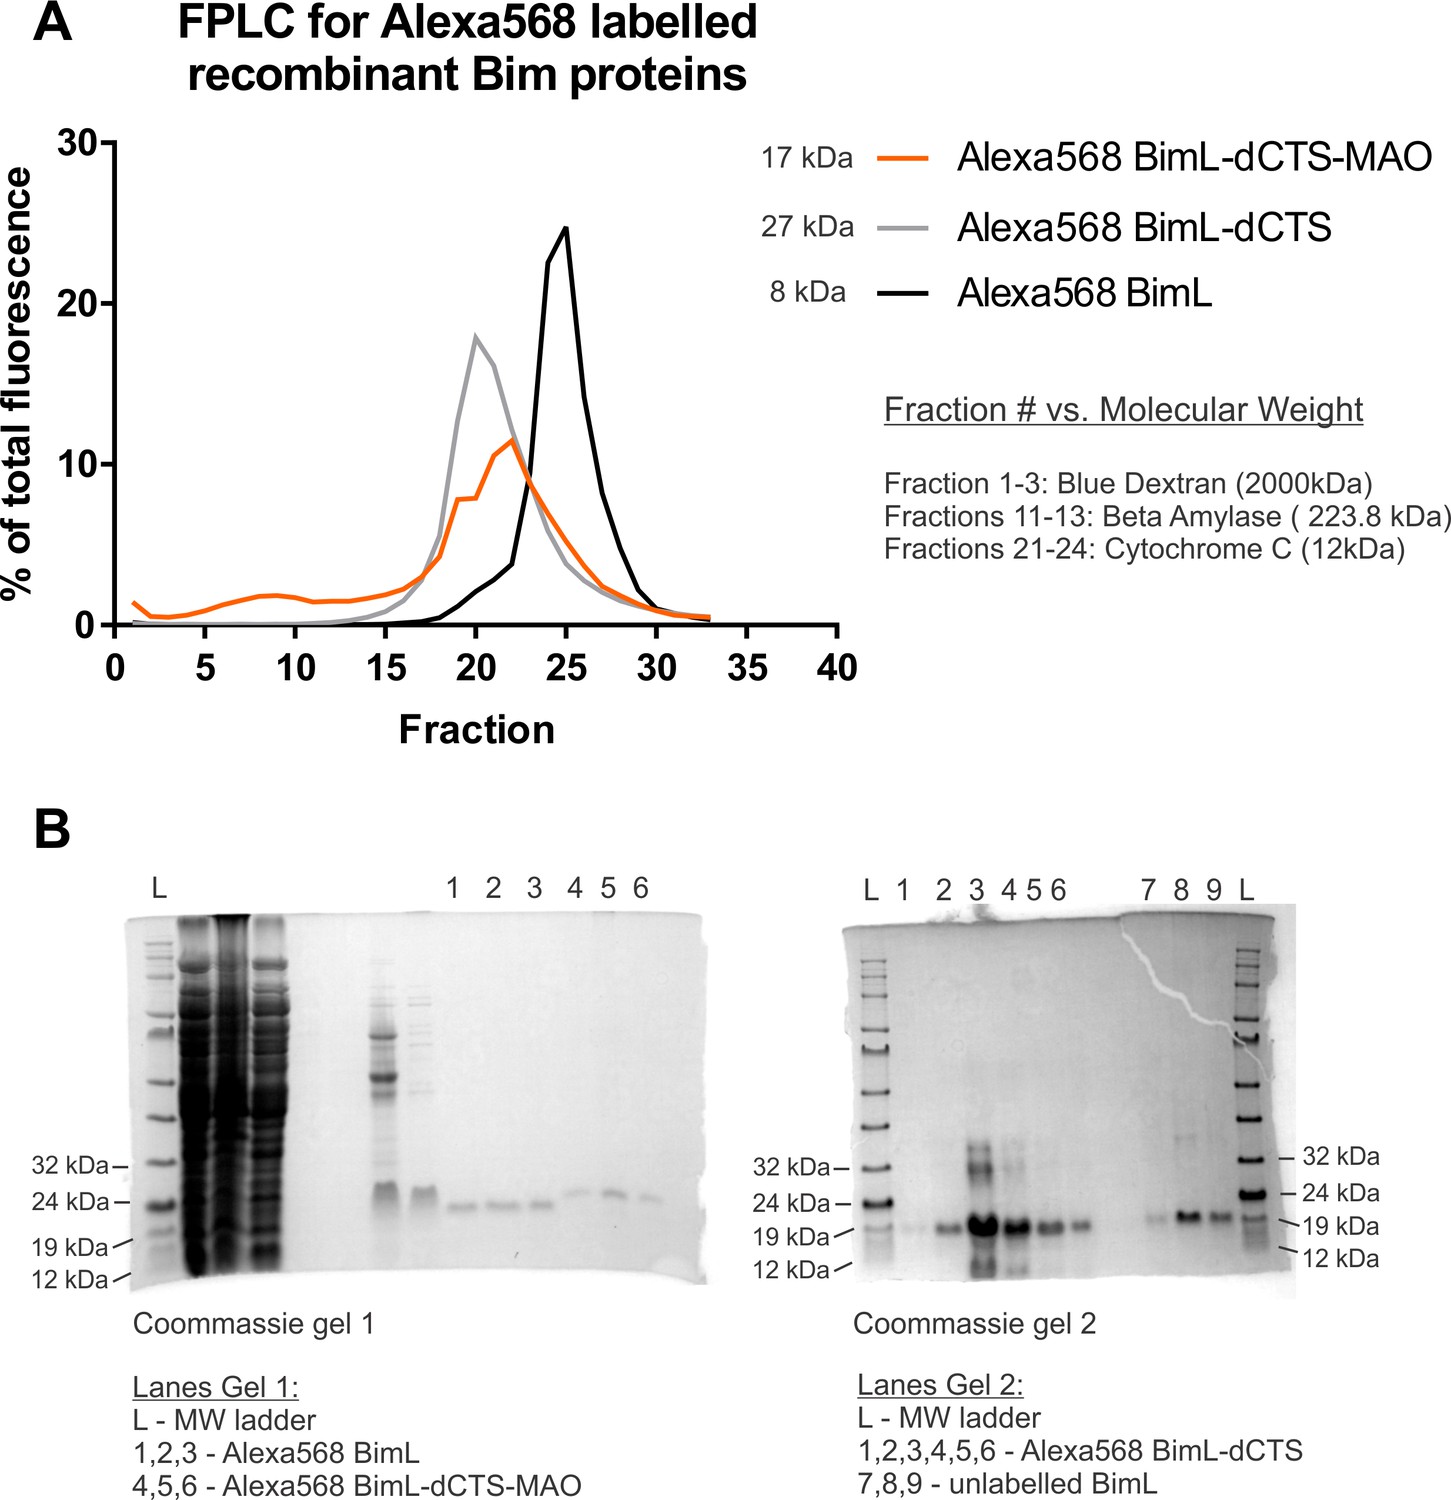
Recombinant BimL proteins do not aggregate and are the expected moelcular weights.
(A) Alexa568-labeled recombinant Bim proteins are not aggregating. FPLC data demonstrating that recombinant proteins elute as single peaks in fractions of low molecular weight (calculations found in source data). (B) SDS-PAGE Indicates Alexa568-labeled Bim proteins migrate at positions that correspond to the correct molecular weight. Gel1 indicates that Alexa568 BimL-dCTS-MAO (Lanes 4,5,6) is slightly larger than Alexa568 BimL (Lanes 1,2,3) as suggested by their molecular weights of 21.38 kDa and 19.62 kDa, respectively. Gel two indicates Alexa568 BimL-dCTS (Lanes 1,2,3,4,5,6), molecular weight of 17.25 kDa is slightly smaller than unlabeled BimL (Lanes 7,8,9) (molecular weight of 18.74 kDa).
-
Figure 7—figure supplement 2—source data 1
FPLC source data demonstrating recombinant BimL proteins do not aggregate.
- https://cdn.elifesciences.org/articles/44525/elife-44525-fig7-figsupp2-data1-v2.xlsx
Figure 8
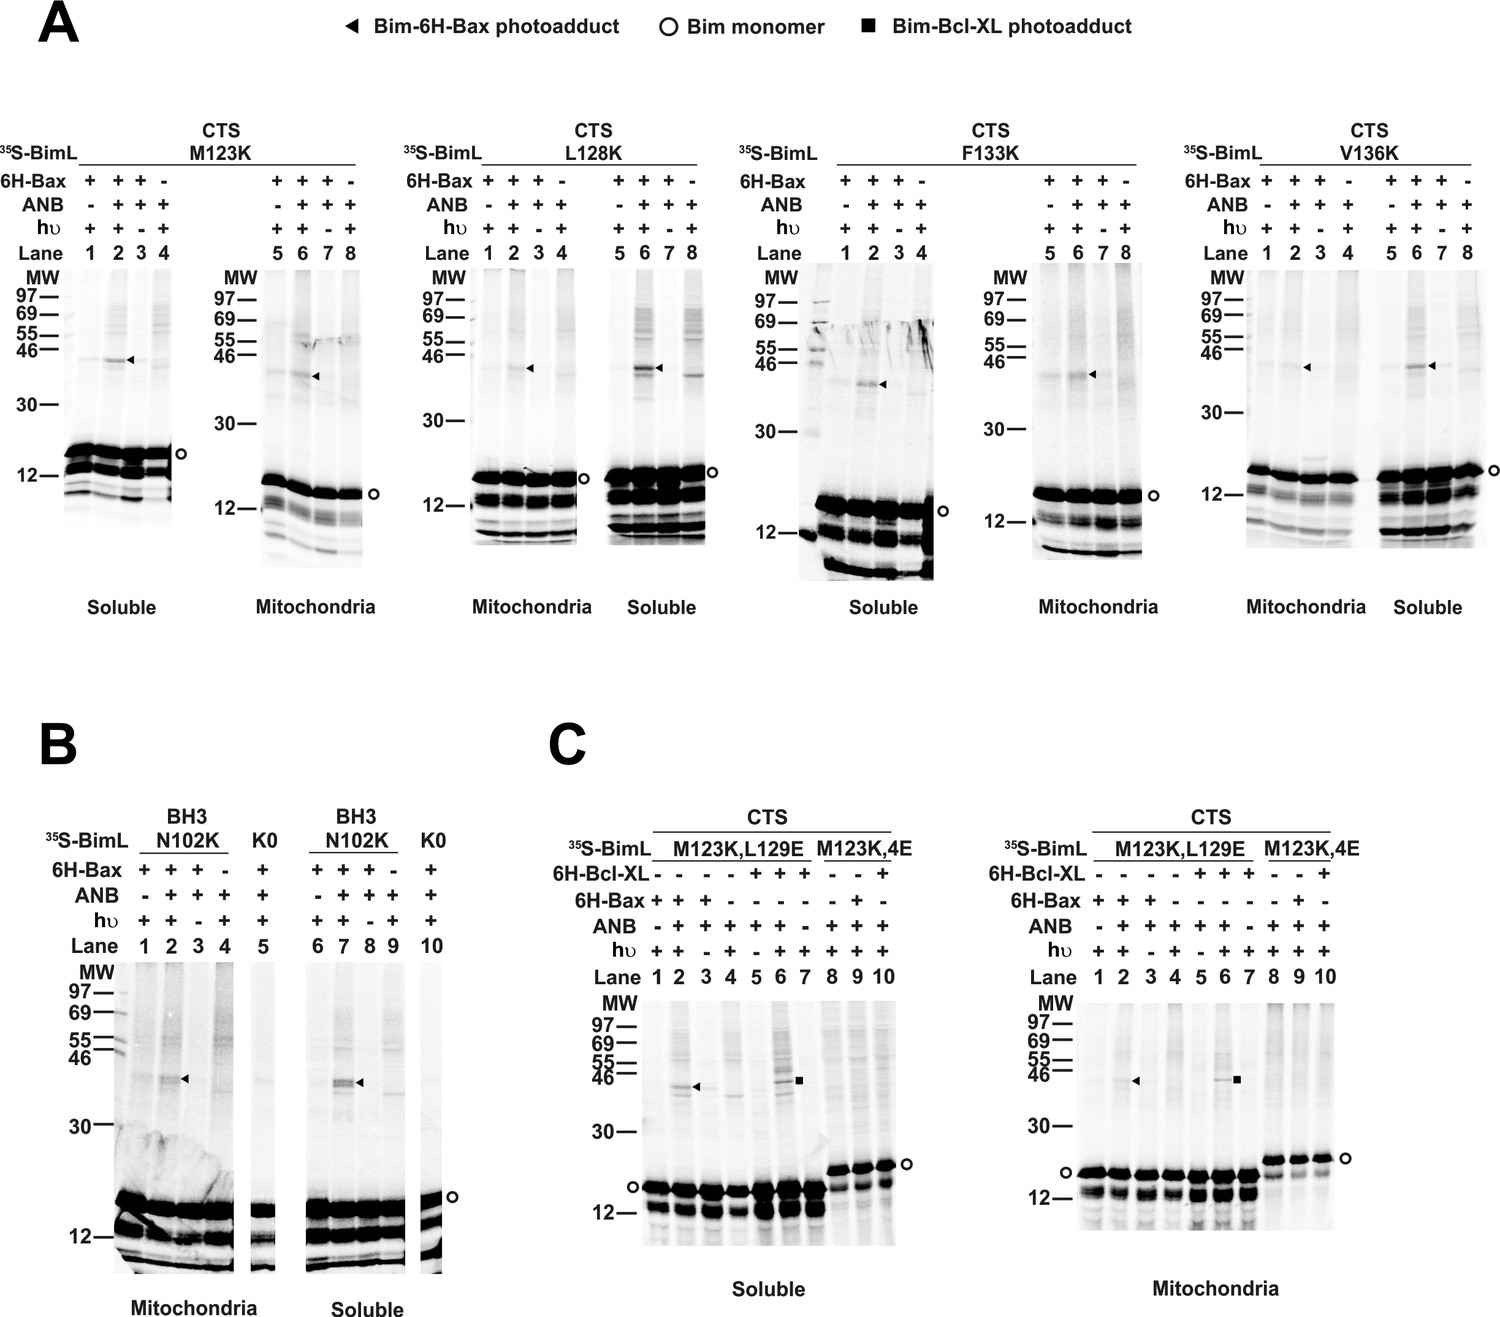
Residues within the Bim CTS interact with Bax.
(A) Interaction of the Bim CTS with Bax in both soluble and mitochondrial fractions detected by photocrosslinking. The [35S]Met-labeled BimL proteins, each with a single εANB-lysine residue located at the position in the CTS indicated at the top of the panels, were synthesized in vitro, and incubated with His6-tagged Bax protein (6H-Bax) in the presence of mitochondria lacking endogenous Bax and Bak. The mitochondria were then separated from the soluble proteins by centrifugation and both fractions were photolyzed. The resulting radioactive BimL/6H-Bax photoadducts were enriched with Ni2+-beads, and analyzed by SDS-PAGE and phosphor-imaging. BimL/6H-Bax dimer specific photoadducts were detected in both mitochondrial and soluble fractions and indicated by arrowheads. They were of reduced intensity or not detected in control incubations in which the ANB probe, light (hυ)or 6H-Bax protein was omitted, as indicated. The radioactive BimL monomers are indicated by circles. The migration positions of protein standards are indicated by molecular weight (MW) in kDa. (B) Interaction of the Bim BH3-domain with Bax in both soluble and mitochondrial fractions detected by photocrosslinking. As a positive control experiment illustrating the expected efficiency for the photocrosslinking of BimL protein with a single εANB-lysine located at the indicated position in the BH3-domain was used to photocrosslink 6H-Bax protein. In another control experiment, a lysine-null BimL protein that does not contain any εANB-Lys (K0) was used. As expected, a BimL/6H-Bax specific photoadduct was detected in the former but not the latter experiment. And, the efficiencies for the photocrosslinking via photoprobes located in the BH3-domain (B) and the CTS (A) are comparable strongly suggesting that like BH3-domain, the CTS interacts with Bax directly. (C) The 4E mutation in the BH3-domain but not the L129E mutation in the CTS of Bim inhibited photocrosslinking of the Bim CTS to Bax. The BimL protein with either the 4E or the L129E mutation and the εANB-Lys in the CTS was used in the photocrosslinking reaction with either 6H-Bax or 6H-Bcl-XL protein in both soluble and mitochondrial fractions. While the L129E mutation did not inhibit photocrosslinking of BimL to either 6H-protein, the4E mutation did. The BimL/6H-Bcl-XL photoadducts are indicated by squares. The phosphorimages in all panels are representatives from two independent photocrosslinking experiments with each indicated pair of BimL and 6H-Bax or 6H-Bcl-XL proteins.
Figure 9 with 1 supplement
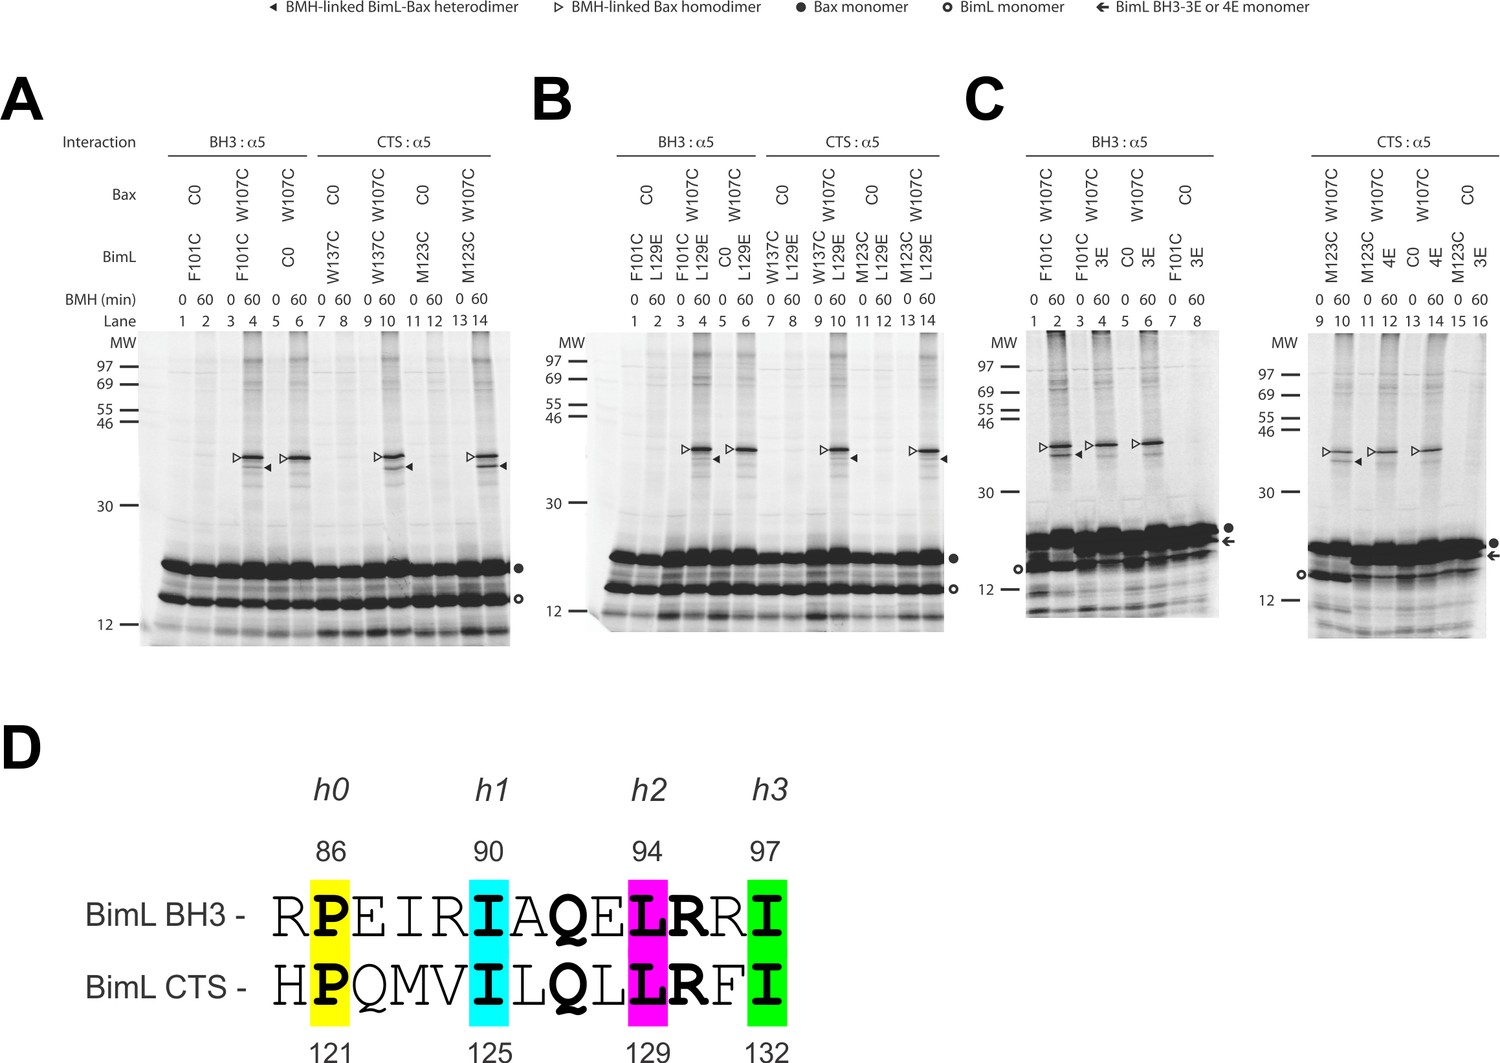
The CTS of Bim binds to the canonical BH3-binding groove of Bax.
(A) Interaction of the BH3-domain and CTS of Bim with the canonical groove of Bax in solution detected by chemical crosslinking. The radioactive cysteine-null (C0) or single-cysteine BimL and Bax proteins were synthesized in vitro. The indicated BimL-Bax pairs were incubated and subjected to BMH crosslinking for the indicated times. The products were analyzed by SDS-PAGE and phosphorimaging. The BMH-linked BimL-Bax heterodimers (indicated by closed triangles) were detected in the sample containing BimL with F101C in the BH3-domain or M123C or W137C in the CTS and Bax with W107C in the groove. As expected, these BimL-Bax heterodimers were not detected when one of the single-cysteine proteins in each pair was substituted with the respective cysteine-null (C0) protein. In contrast, the BMH-linked Bax homodimers (indicated by open triangles) were detected not only in the samples with each single-cysteine Bax-BimL pair but also that with the single-cysteine Bax and the cysteine-null BimL. The BimL and Bax monomers are indicated by open and closed circles, respectively. The migration positions of protein standards are indicated by MW in kDa. (B–C) The Bim CTS mutation (L129E) reduced, whereas the BH3 mutation (3E or 4E) abolished the interaction of the CTS and BH3-domain with the Bax canonical groove. The BMH crosslinking was done with the indicated single-Cys BimL-Bax pairs to detect the CTS or BH3-groove interaction. As indicated, some BimL proteins contain the L129E or 4E mutation, whereas others contain the 3E (I90E, L94E, and I97E) mutation since residue F101 was changed to Cys instead of Glu. The phosphorimages in panels A to C are representatives from two independent BMH crosslinking experiments with each pair of indicated BimL and Bax proteins. (D)Sequence alignment of the BimL BH3 (residues 85–97) with the BimL CTS (residues 120–132). Note the similarities between the CTS and the BH3-domain as both have the same hydrophobic residues at the h0, h1, h2 and h3 positions, and the same polar or charged residue at the h1+two or h2+one positions.
Figure 9—figure supplement 1

Identification of the BimL-Bax heterodimer specific BMH crosslinking product by reciprocal immunoprecipitation.
The BMH crosslinking was done with the indicated single-Cys BimL-Bax pairs. After saving an aliquot from each reaction for SDS-PAGE (lanes 1 to 6), the remaining reactions were divided to two parts, one of which was immunoprecipitated by an anti-Bax antibody (αBax), while the other by an anti-Bim antibody (αBim). The resulting precipitants were analyzed by SDS-PAGE (lanes 7 to 12). The radioactive proteins on the gel were detected by phosphorimaging. The closed triangles indicate the BimL-Bax heterodimer crosslinked by BMH that were precipitated by both antibodies. In contrast, the open triangles indicate the Bax homodimer crosslinked by BMH that were precipitated by the anti-Bax antibody but not by the anti-Bim antibody. As internal controls, the other major precipitants by the anti-Bax or the anti-Bim antibody are the Bax monomers (indicated by close circle) or the BimL monomers (indicated by open circle), respectively, and the other protein monomer (BimL or Bax, respectively) that was bound to and hence co-precipitated with the respective antigen. The phosphorimage is a representative from two independent experiments with the indicated BimL-Bax pairs.
Figure 10
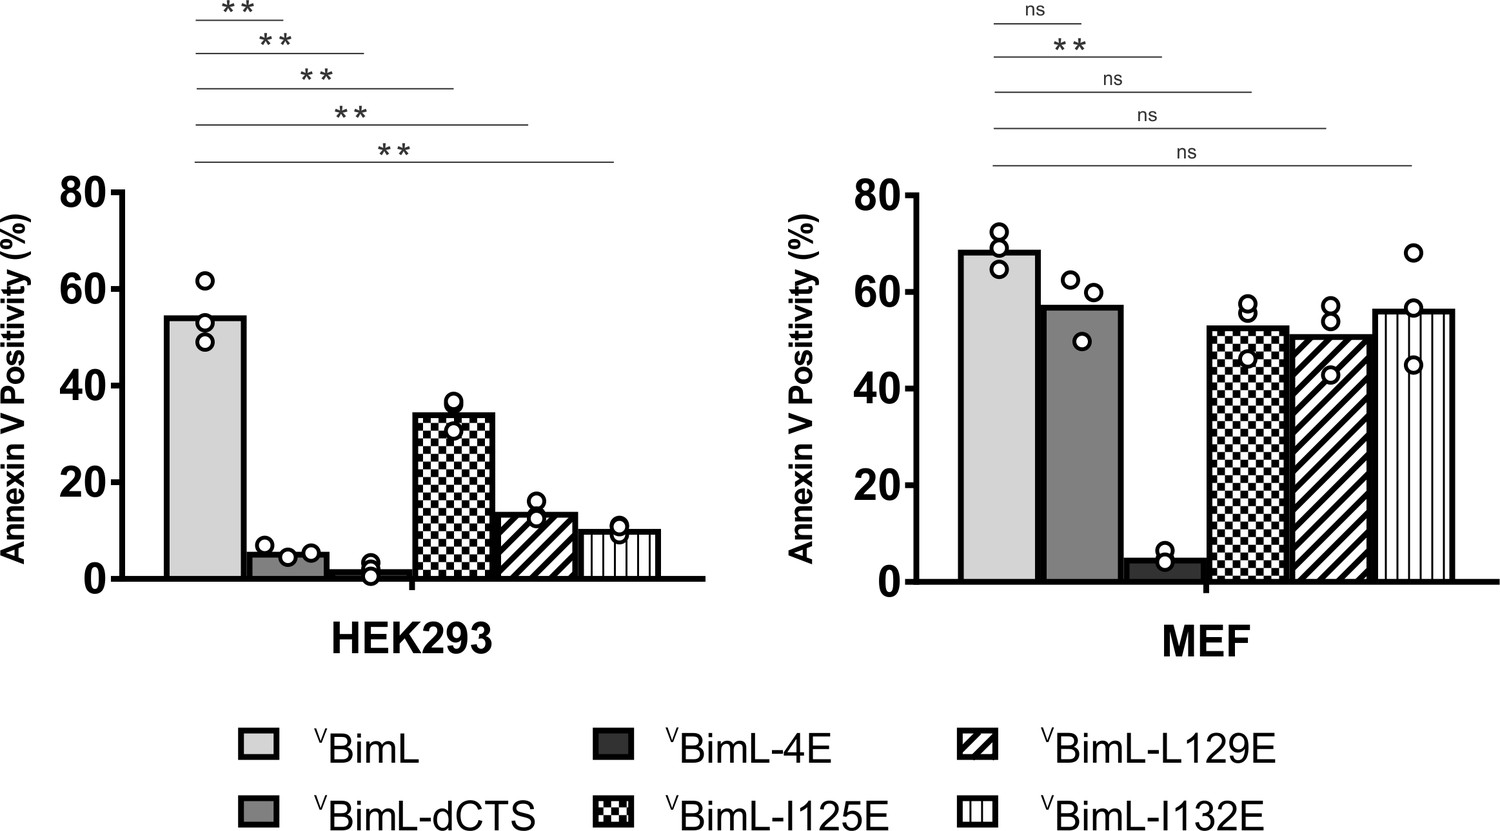
Bim CTS mutants that cannot activate Bax in vitro cannot kill HEK293 cells.
The indicated cell lines were transiently transfected with DNA to express VBimL, and the indicated VBimL mutant proteins. Cells expressing Venus fusion proteins were stained with the nuclear dye Draq5 and rhodamine-labeled Annexin V, and apoptosis was assessed by confocal microscopy as in Figure 1. The y-axis indicates Annexin V Positivity (%), which was calculated based on the total number of Venus expressing cells that also score positive for Annexin V rhodamine fluorescence. A minimum of 400 cells were imaged for each condition. Individual points (open circles) represent the average for each replicate, while the bar heights, relative to the y-axis, represent the average for all three replicates. A one-way ANOVA was used within each cell line followed by a Tukey’s multiple comparisons test to compare the means of each transfection group. *p-values<0.05, **p-values<0.01, ns, non-significant p-values (>0.05).
-
Figure 10—source data 1
Source data demonstrating that mutants of BimL that cannot activate Bax do not kill H.EK293 cells.
- https://cdn.elifesciences.org/articles/44525/elife-44525-fig10-data1-v2.xlsx
Figure 11

Schematic overview for the Bim CTS pro-apoptotic function Interactions between BimL (blue), effector protein Bax (red) and Bcl-XL (green) are shown at mitochondria of unprimed and primed cells as indicated.
Mutations of the Bim CTS are shown as a red or yellow star. Direction of protein flow into complexes indicated by lengths of the equilibria arrows is based on the Kds measured for the binding interactions (Figure 6B), using the approximate cellular concentrations of the various proteins and activity assays with liposomes and mitochondria. (A) In unprimed cells the direct activation of Bax is the main function of Bim for inducing apoptosis. Comparison of BimL-I125E with BimL-L129E, BimL-I132E, and BimL-dCTS shows that the CTS, not membrane binding controls the activation of Bax by BimL (Figure 6B). BimL binds membranes and can activate Bax. BimL-I125E (yellow star) has no detectable membrane-binding activity but still binds to and activates Bax, albeit with reduced activity compared to BimL (Figure 6B). At physiologically relevant concentrations BimL-L129E, BimL-I132E, and BimL-dCTS do not activate Bax and do not bind to membranes. However unlike BimL-dCTS. BimL-L129E and BimL-I132E binding to Bax is not reduced enough to account for the loss in Bax activation and membrane permeabilization suggesting these two residues are involved in activating Bax. (B) In primed cells, one or more pro-apoptotic proteins (activated Bax/Bak and/or a Bax/Bak-activating BH3-protein) are sequestered by anti-apoptotic proteins at the MOM. For simplicity only active Bax is shown. Depending on the amount of active pro-apoptotic protein sequestered and the amount of free inactive Bax and or Bak in the cell, BimL may initiate apoptosis primarily by inhibiting anti-apoptotic proteins or by activating Bax and inhibiting anti-apoptotic proteins. The Bim CTS is not required for binding to and inhibiting anti-apoptotic proteins as BimL-L129E, BimL-I132E, and BimL-dCTS bind to anti-apoptotic proteins such as Bcl-XL and release both pro-apoptotic BH3-proteins and Bax (Figure 5 and Figure 6B), thus enabling killing of primed cells.
Tables
Key resources table
| Reagent type (species) or resource | Designation | Source or reference | Identifiers | Additional information |
|---|---|---|---|---|
| Antibody | antibody to Cytochrome c | In house (Billen et al., 2008) | (1:2000) Dilution | |
| Antibody | Donkey anti-rabbit (polyclonal) | Jackson Immuno Research Laboratories | Cat. #: 711-035-150 | (1:10000) Dilution |
| Antibody | Donkey anti-mouse (polyclonal) | Jackson Immuno Research Laboratories | Cat. #: 711-035-152 | (1:10000) Dilution |
| Antibody | Antibody to Bax | In house (Zhu et al., 1996) | Max6 | (1:1000) dilution |
| Antibody | Antibody to Bim | Santa Cruz Biotechnology | Cat. #: sc-11425 | (1:50) dilution |
| Cell line (M. musculus) | Baby Mouse Kidney(BMK)-DKO (Bax and Bak knockout) cells | Other (Degenhardt et al., 2002) | Provided by Dr. Eileen White (Rutgers University) Mycoplasma free, see Materials and methods | |
| Cell line (H. sapiens) | Cama-1 | RRID: CVCL_1115 | Provided by Dr. Linda Penn (University of Toronto). Mycoplasma Free, see Materials and methods | |
| Cell line (H. sapiens) | HEK293 | Other (Graham et al., 1977) | RRID: CVCL_0045 | Provided by Dr. Frank Graham (McMaster University). Mycoplasma Free , see Materials and methods |
| Cell line (H. sapiens) | HCT-116 | Other (Polyak et al., 1996) | RRID: CVCL_0291 | Provided by Dr. Bert Vogelstein (John Hopkins University). Mycoplasma Free , see Materials and methods |
| Strain (M. musculus) | Embryonic day 15 embryos | The Jackson Laboratory | C57BL/6J | Used for the preparation of primary cortical neurons and for purification of mitochondria, see Materials and methods. |
| Cell line (M. musculus) | MEF | Other (Pagliari et al., 2005) | RRID: CVCL_U630 | Provided by Dr. Doug Green (St. Judes Children’s Research Hospital) Mycoplasma Free, see Materials and methods |
| Chemical compound, drug | Draq5 | ThermoFisher Scientific, Molecular probes | Cat. #62251 | Nuclear stain for live cell imaging |
| Chemical compound, drug | Hoescht 33258 | Cell signaling technologies | Cat. # 4082S | Nuclear stain for live cell imaging |
| Chemical compound, drug | Tetramethylrhodamine, Ethyl Ester, Perchlorate (TMRE) | ThermoFisher Scientific, Molecular probes | Cat. # T669 | Used to stain actively respiring mitochondria |
| Chemical compound, drug | Propidium iodide | Bioshop | Cat. # PPO888.10 | Nuclear stain for dead cells |
| Chemical compound, drug | Alexa 647-maleimide | ThermoFisher Scientific, Molecular probes | Cat. #: A20347 | Acceptor fluorophore in FRET experiments, when Alexa 568 is the donor. |
| Chemical compound, drug | Alexa568-maleimide | ThermoFisher Scientific, Molecular probes | Cat. #. A20341 | Donor fluorophore in FRET experiments when Alexa 647 is the acceptor. |
| Chemical compound, drug | ANTS (8-Aminonaphthalene-1,3,6-Trisulfonic Acid, Disodium Salt) | ThermoFisher Scientific, Molecular probes | A350 | Fluorophore used in liposome release assay (Billen et al., 2008) |
| Chemical compound, drug | DPX (p-Xylene-Bis-Pyridinium Bromide) | ThermoFisher Scientific, Molecular probes | X1525 | Quencher used in liposome release assay (Billen et al., 2008) |
| Chemical compound, drug | IANBD Amide (N,N'-Dimethyl-N-(Iodoacetyl)-N'-(7-Nitrobenz-2-Oxa-1,3-Diazol-4-yl)Ethylenediamine) | Molecular Probes | Cat. #: D-2004 | Chemically reactive environment sensitive fluorophore. Reacts with Cysteine used to label proteins for in vitro study. |
| Chemical compound, drug | PC (L-α-phosphatidylcholine) | Avanti Polar Lipids | Cat. #: 840051C | For making liposomes, used 48% PC |
| Chemical compound, drug | DOPS (1,2-dioleoyl-sn-glycero-3-phospho-L-serine) | Avanti Polar Lipids | Cat. #: 840035C | For making liposomes, used 10% DOPS |
| Chemical compound, drug | PI (L-α-phosphatidylinositol) | Avanti Polar Lipids | Cat. #: 840042C | For making liposomes, used 10% PI |
| Chemical compound, drug | PE (L-α-phosphatidylethanolamine) | Avanti Polar Lipids | Cat. #: 841118C | For making liposomes, used 28% PE |
| Chemical compound, drug | TOCL, (18:1 Cardiolipin) | Avanti Polar Lipids | Cat. #: 710335C | For making liposomes, used 4% TOCL |
| Chemical compound, drug | bismaleimidohexane (BMH) | Pierce | 22330 | Chemical crosslinker, Cysteine specific. Used for chemical crosslinking of Bim and Bax proteins, see Materials and methods. |
| Commercial assay or kit | Fugene HD | Promega | Cat. #: E2311 | Transfection reagent for mammalian cells |
| Commercial assay or kit | TransIT-X2 | Mirus | Cat. #: Mir 6003 | Transfection reagent for mammalian cells |
| Gene (H. sapiens) | Bax | In house (Yethon et al., 2003) | GI: L22473.1 | Expression plasmid for production of recombinant protein |
| Recombinant DNA reagent (H. sapiens) | Bax | In house (Zhang et al., 2010; Zhang et al., 2016) | GI: L22473.1 | For recombinant 6H-Bax protein used in photocrosslinking and for making Cys-null or single Cys recombinant protein in chemical crosslinking |
| Recombinant DNA reagent (H. Sapiens) | Bcl-XL | In house (Ding et al., 2014) | GI: Z23115.1 | For recombinant 6H-Bcl-XL protein used in photocrosslinking, membrane permeabilization, and protein-protein binding assays. |
| Gene (H. sapiens) | Bad | In house (Aranovich et al., 2012) | GI: AB451254.1 | For expression of VBad in cells |
| Gene (M. musculus) | Bid | In house (Lovell et al., 2008) | GI: NM_007544.4 | For recombinant cBid purification ( |
| Gene (M. musculus) | BimL | This paper | GI: AAD26594.1 | This lab, plasmid # 2187, for recombinant BimL purificaton |
| Recombinant DNA reagent (M. musculus) | BimL | This paper | GI: AAD26594.1 | Dr. Lin lab, plasmidpSPUTK-BimL For the single-Cys proteins used in photo and chemical crosslinking |
| Recombinant DNA reagent (M. musculus) | tBid | In house (Aranovich et al., 2012) | GI: NM_007544.4 | For expression of VtBid in cells |
| Other | Cell Carrier-384, Ultra plate | PerkinElmer | Cat. #: 6057300 | For mono-layer culturing and imaging cell lines |
| Other | Greiner Bio-one Cell culture microplate, 384 well | Greiner Bio-one | Cat. 781090 | For culturing and imaging primary cortical neurons. |
| Other | Non-binding surface, 96-well plate, black with clear bottom | Corning | Cat. #: 3881 | For recombinant protein and liposome assays. It is critical to use a non-binding plate. |
| Other | Opera Phenix | PerkinElmer | Cat. #: HH14000000 | Automated confocal microscope. Used for imaging cell lines and primary cortical neurons. |
| Other | AnnexinV*Alexa647 | In House (Logue et al., 2009) | Used for detecting phosphotidylserine externalization (Blankenberg et al., 1998) | |
| Other | εANB-[14C]Lys-tRNALys | tRNA Probes | L-32 | Used for incorporation εANB-Lys into Bim protein using an in vitro translation system. The εANB-group is photoactive and generates a nitrene for photocrosslinking |
| Other | [35S]Methionine | PerkinElmer | NEG009C | Used for incorporation [35S]Met into Bim and Bax proteins using an in vitro translation system for photo or chemical crosslinking,see Materials and methods. |
| Other | transcription/translation (TNT)-SP6 coupled wheat germ extract system | Promega | L4130 | Used for synthesis of Bim and Bax proteins for chemical crosslinking |
| Other | multi-purpose image scanner | Fuji Film | FLA-9000 | Used for phosphorimaging to detect radioactive proteins in gels |
| Software, algorithm | GraphPad Prism | San Diego, California | Version 6 RRID:SCR_002798 | Scientific graphing program, used for curve fitting of in vitro data and to perform statistical analysis. |
| Software, algorithm | ImageJ | PMID: 17936939 | MBF - ImageJ for microscopy, Dr. Tony Collins (McMaster University) | For band density measurements used to quantify Cytochrome c release from immunoblots. |
| Software, algorithm | Multi Gauge | Fuji Film | Version 3.0 | Used for processing and displaying phosphor-images |
| Recombinant DNA reagent (A. victoria) | mVenus-pEGFP-C1 | Other | GI: KU341334.1 | Dr. Ray Truant (McMaster University). Backbone EGFP-C1 (Clonetech) |
Additional files
Download links
A two-part list of links to download the article, or parts of the article, in various formats.
Downloads (link to download the article as PDF)
Open citations (links to open the citations from this article in various online reference manager services)
Cite this article (links to download the citations from this article in formats compatible with various reference manager tools)
The carboxyl-terminal sequence of bim enables bax activation and killing of unprimed cells
eLife 9:e44525.
https://doi.org/10.7554/eLife.44525


