Need-based prioritization of behavior
- National Institute of Diabetes and Digestive and Kidney Diseases (NIDDK), National Institutes of Health, United States
- National Institute on Drug Abuse (NIDA), National Institutes of Health, United States
- Brown University Graduate Partnerships Program, United States
- Brown University, United States
Figures
Figure 1 with 1 supplement

Prolonged food-deprivation leads to more pronounced changes in rodent physiology.
(A–F) 18 hr food restriction reduced body weight (A), fat mass (B), lean mass (C), and tissue weights of inguinal WAT, epididymal WAT, quadriceps, gastrocnemius, liver and stomach (D) in both males and female mice, and was further accentuated following 48 hr restriction. Data points outlined in black indicate males; n = 5, Data points outlined in pink indicate females; n = 5 per group, values are means ± SEM. *p<0.05, **p<0.01, ***p<0.001.
Figure 1—figure supplement 1
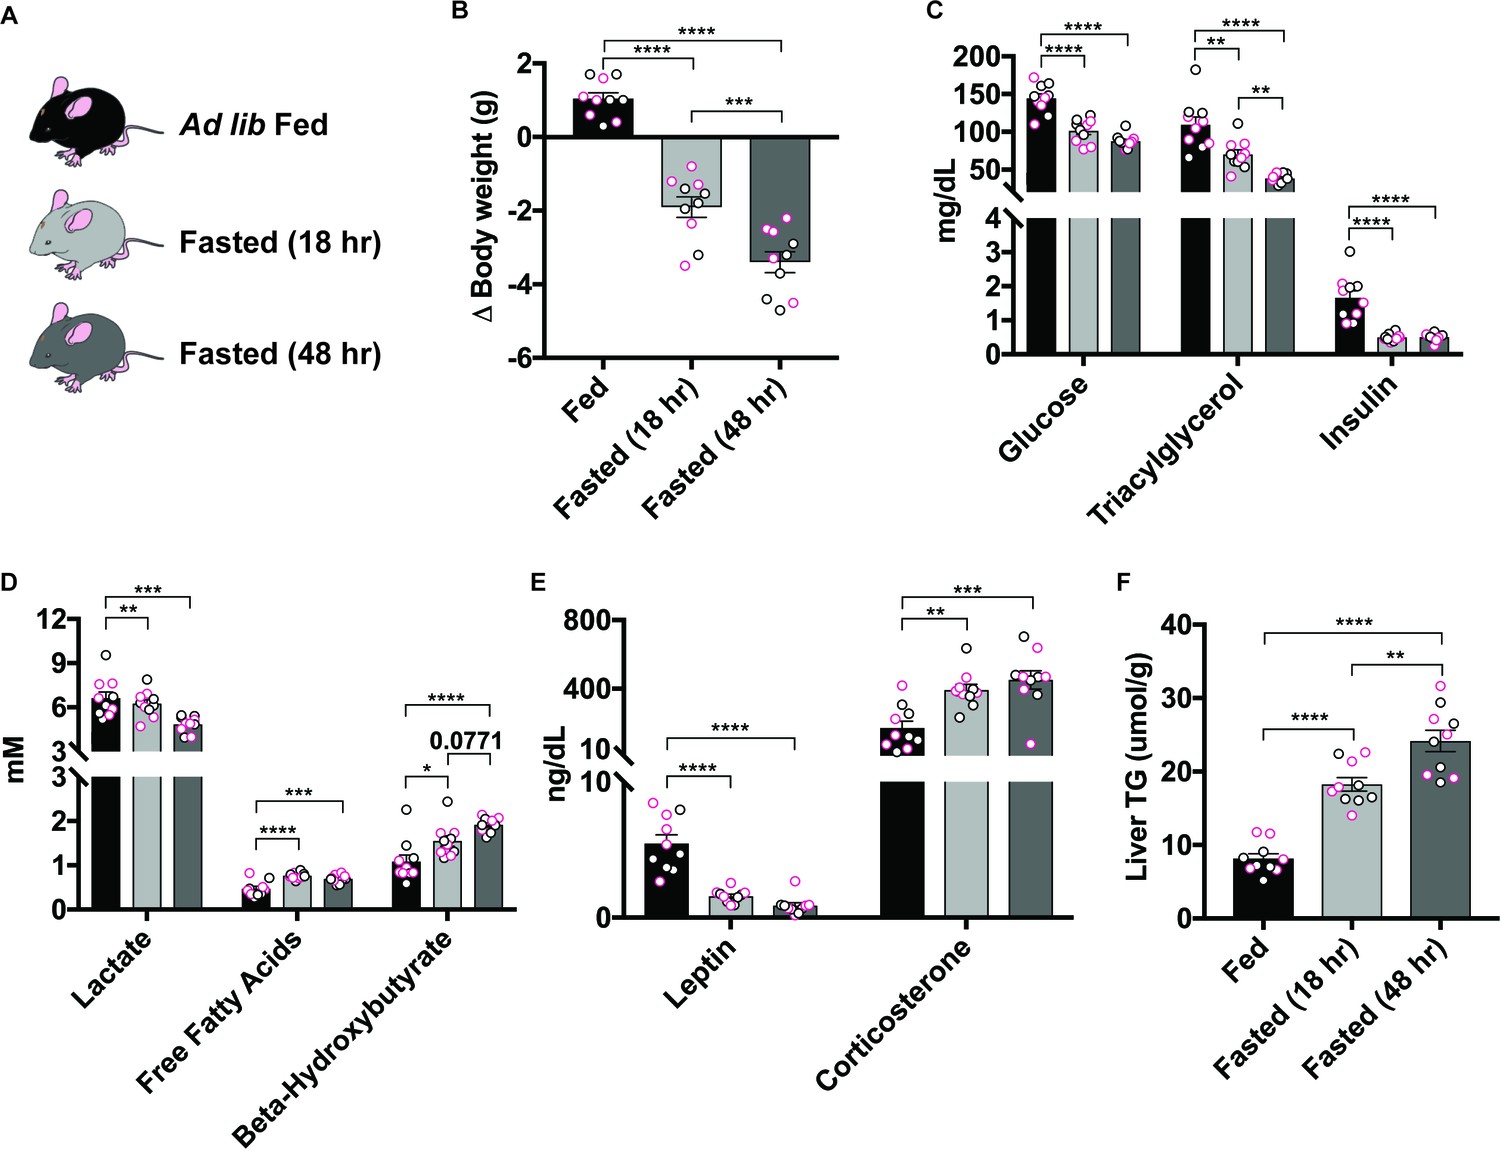
Prolonged food-deprivation leads to more pronounced changes in rodent physiology.
(A) Schematic of appetite states used for evaluations. (B) Overall body weight changes of animals at the start of the experiment compared to the time of dissection. Food restriction markedly lowered concentrations of glucose (C), triacylglycerol (C), insulin (C), lactate (D) and leptin (E) while elevating levels of free fatty acids (D), beta-hydroxybutyrate (D), corticosterone (E) and liver triacylglycerol (F). Data points outlined in black indicate males; n = 5, Data points outlined in pink indicate females; n = 5 per group, values are means ± SEM. *p<0.05, **p<0.01, ***p<0.001.
Figure 2 with 3 supplements

Evaluating resident behavior in response to a receptive female intruder.
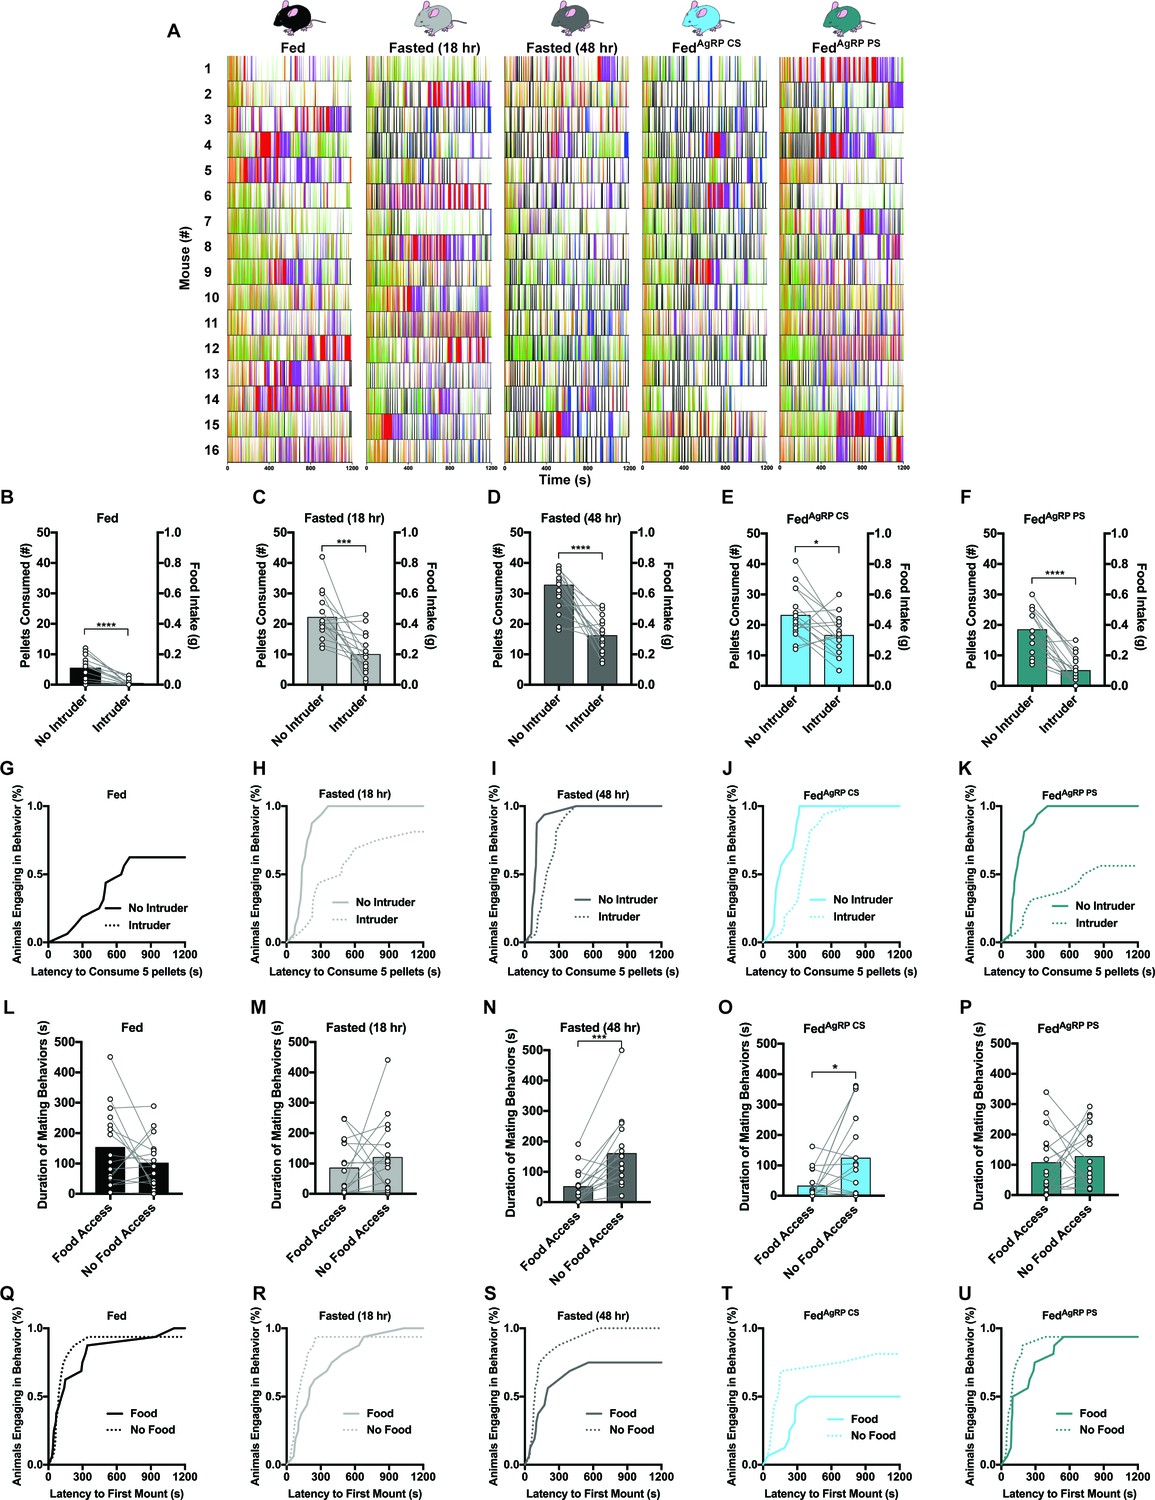
(A) Catalogue of scored resident behaviors (top); mounting and/or intromission of the female intruder (red), pursuit and/or attempted mounting of the female intruder (yellow), anogenital chemoinvestigation (orange), nose-to-nose chemoinvestigation (green), drinking (blue), grooming (purple) and eating (black). Sample raster plot of second-to-second scored behaviors across the entire Trial Phase (bottom). (B–D) Quantified between-subject comparisons of resident food intake (B) and cumulative latency plot to consume 0.1 grams of food in the absence (C) or presence of a female intruder (D). (E–G) Linear regression plots between mating and feeding (E), grooming and mating (F) and drinking and feeding (G). (H–J) Quantified between-subject comparisons of resident mating behavior (H) and cumulative latency plot to first mount in the presence (I) or absence of food (J). n = 16 per group, values are means ± SEM. *p<0.05, **p<0.01, ***p<0.001.
Figure 2—figure supplement 1
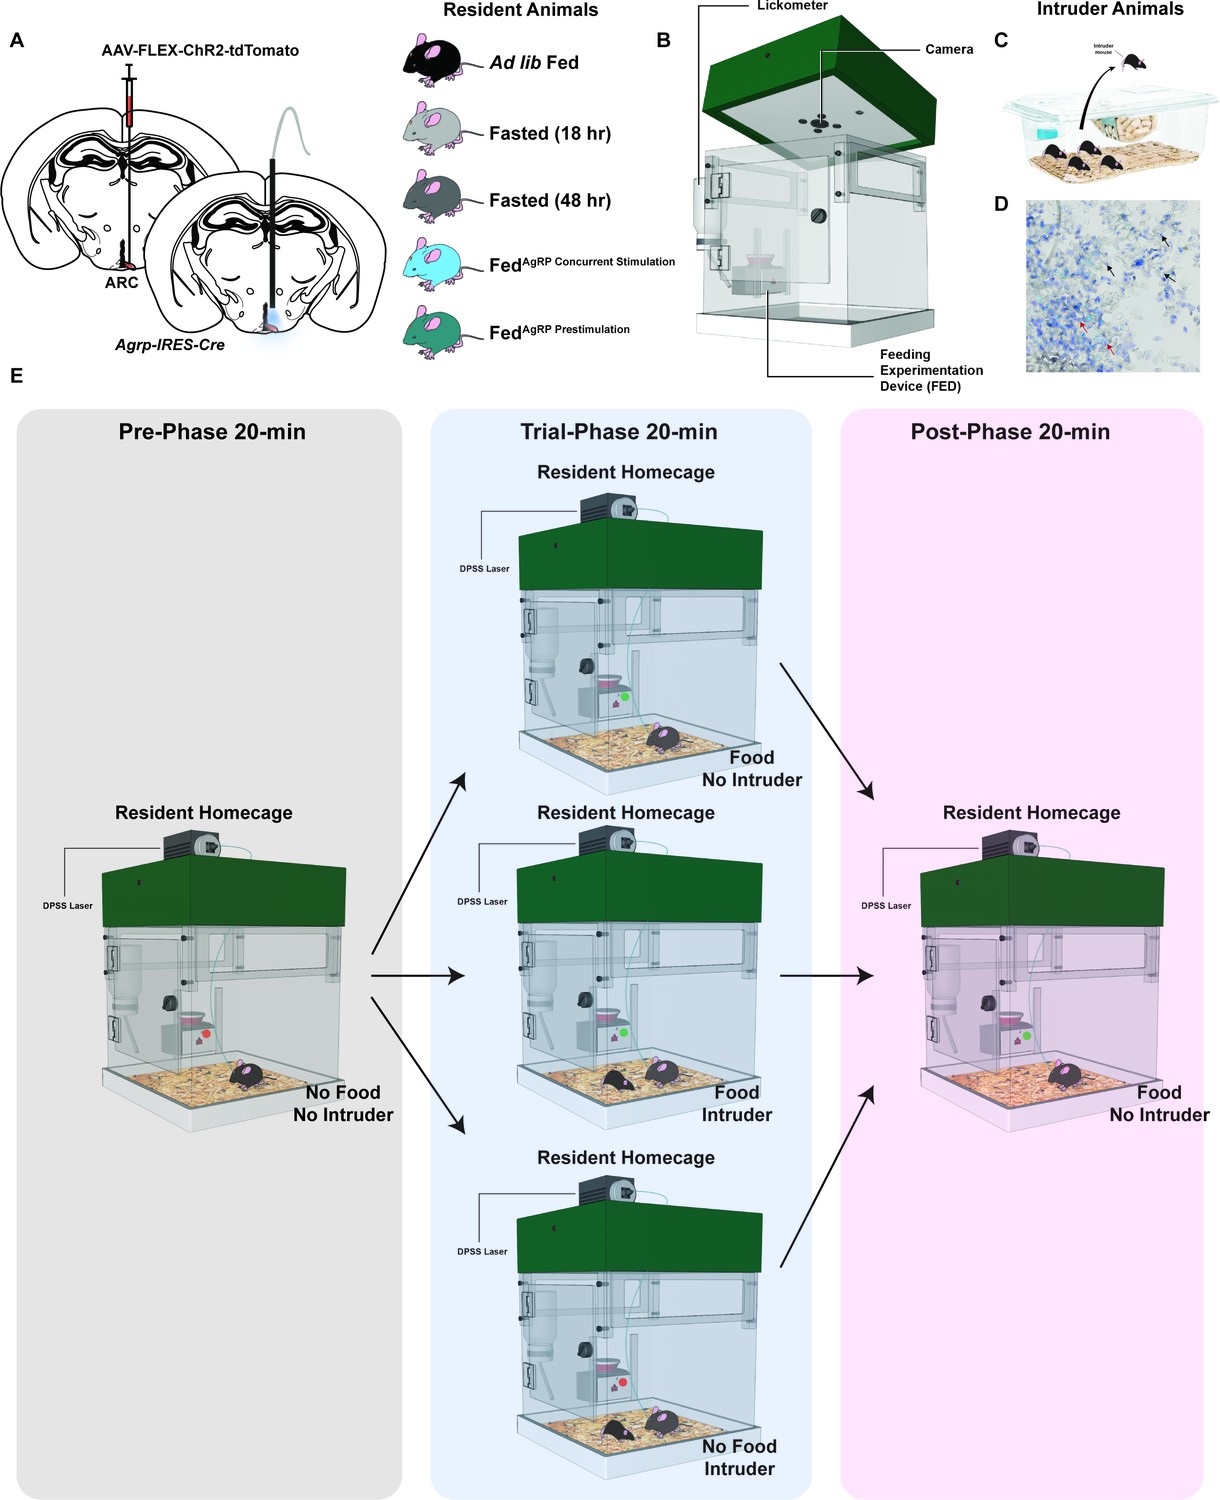
Experimental design of resident-intruder assay during evaluation of resident behavior.
(A) Brain schematic of optogenetic surgery whereby Agrp-IRES-Cre animals were unilaterally injected with Cre-dependent ChR2-tdTomato virus and unilaterally implanted with an optical fiber over the ARC (left). Resident animals were each tested under five discrete appetite conditions (right) using a crossover design. Residents in the female-intruder assay were sexually experienced but sexually deprived (>48 hr since last ejaculation) before testing. Residents in the male-intruder assay were sexually-experienced and had previous fighting experience before testing (B) Specialized cage used to evaluate behavior equipped with Feeding Experimental Device that individually dispenses 20 mg chow pellets permitting precise quantal and temporal measurements of food intake. (C) Intruders for the assay were used from group-housed cages. Each sexually-mature female was used only once to ensure virgin status and avoid variables associated with pregnancy, ensuing maternal experience, and social stress related to cagemates’ exposure to the female after the mating experience. Similarly, each male intruder was used only once to avoid further injury and prevent development of social defeat stress or learned helplessness, depressive-like occurrences resulting from repeated bouts of aggression from more dominant mice (D) All virgin female intruders used tested positive for estrus. Arrows represent different cells in standard vaginal cytology samples throughout the estrous cycle (black arrows, nucleated epithelial cells; red arrows, cornified epithelial cells; blue arrows, leukocytes). (E) Each resident animal was tested for 1 hr over 3 different 20 min phases; a Pre-Phase (grey color) in the absence of food and an intruder (left panel), a Trial Phase (blue color) which could occur in the presence of food but the absence of an intruder (middle panel, top), in the presence of both food and an intruder (middle panel, center) or in the absence of food but the presence of an intruder (middle panel, bottom) and a Post-Phase (pink color) in the presence of food but the absence of an intruder (right panel). Red and green circles on the feeding device indicate food inaccessibility and accessibility, respectively.
Figure 2—figure supplement 2
Evaluating resident behavior in response to a receptive female intruder.
(A) Raster plots of second-to-second scored behaviors of all resident animals across the entire Trial Phase (B–F) Quantified within-subject comparisons of resident food intake in the absence or presence of a female intruder. (G–K) Cumulative latency plots to consume 0.1 grams of food in the absence versus presence of a female intruder grouped by appetite condition. (L–P) Quantified within-subject comparisons of resident mating behavior in the absence or presence of food. (Q–U) Cumulative latency plots to first mount in the absence versus presence of food grouped by appetite condition. n = 16 per group, values are means ± SEM. *p<0.05, **p<0.01, ***p<0.001.
Figure 2—figure supplement 3

Post-trial phase food intake in resident mice in female intruder paradigm.
(A) Quantified between-subject comparisons of resident Post-phase food intake in animals never exposed to a female intruder or previously exposed to a female intruder during the Trial-phase. (B–F) Quantified within-subject comparisons of resident Post-phase food intake in animals never exposed to a female intruder versus animals exposed to a female intruder during the Trial-phase. n = 16 per group, values are means ± SEM. *p<0.05, **p<0.01, ***p<0.001.
Figure 3
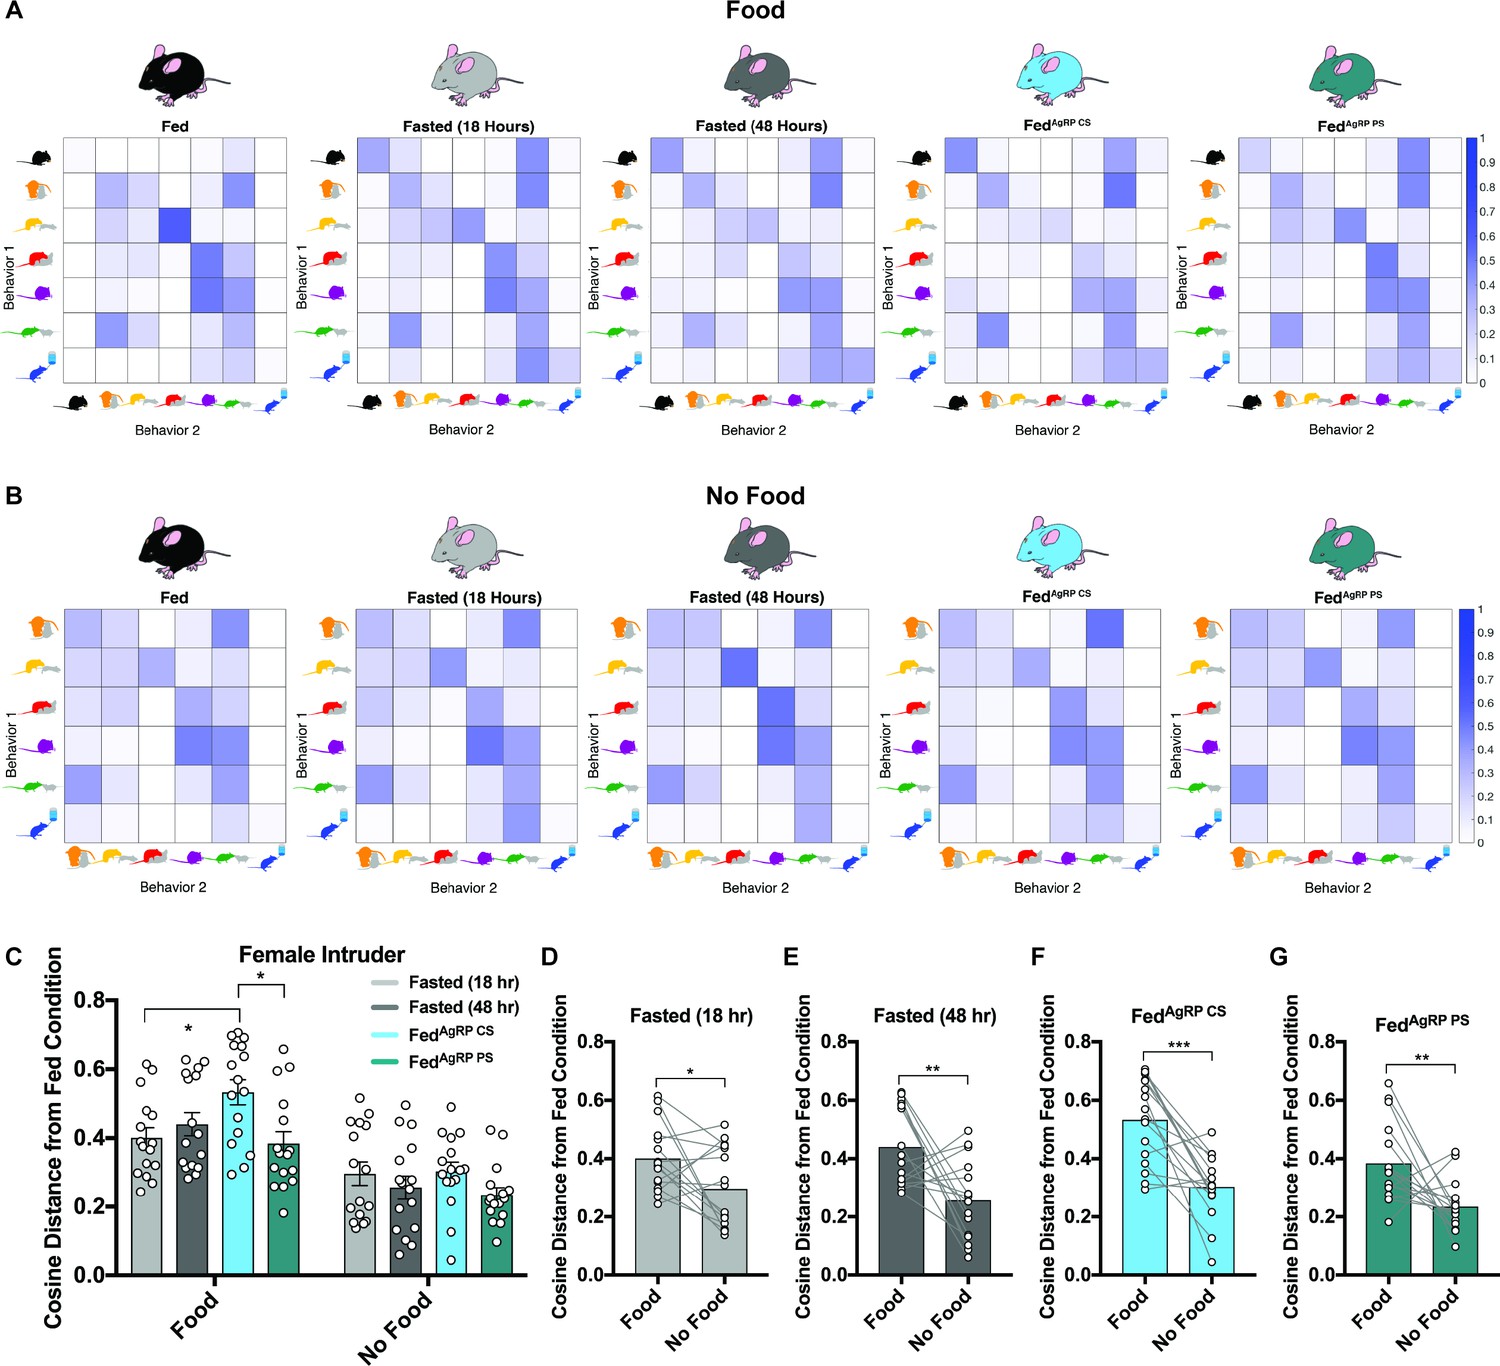
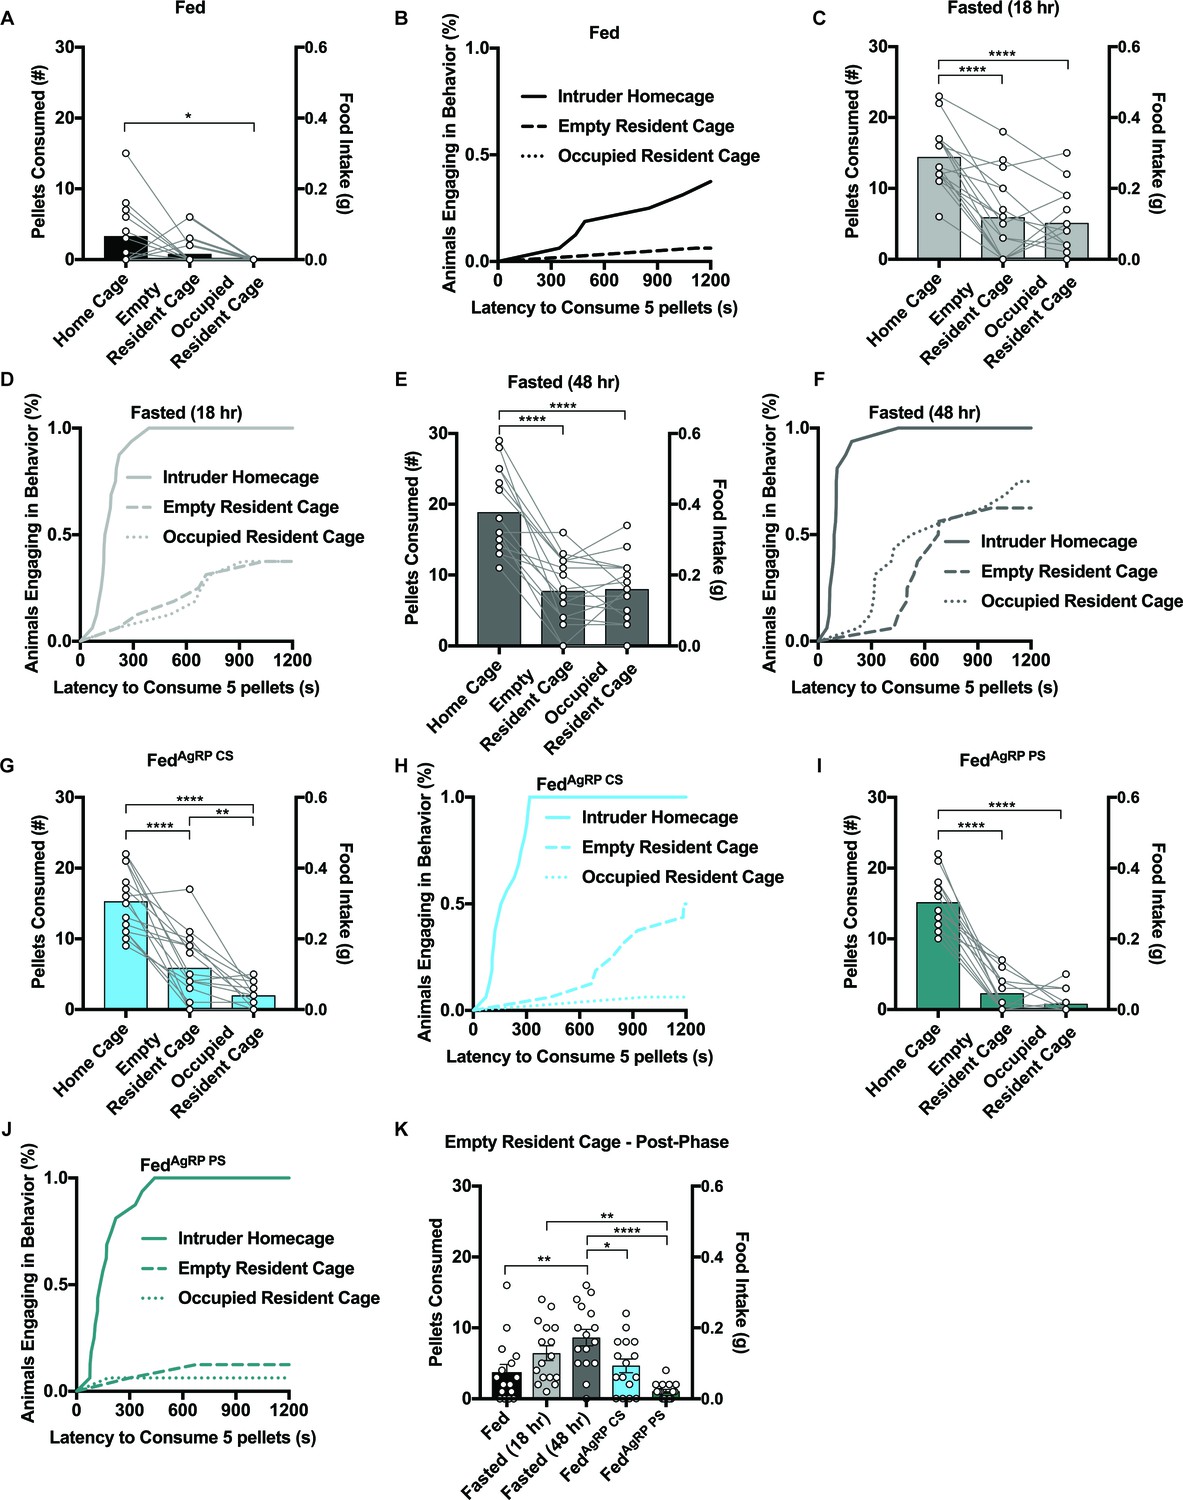
Behavioral sequence analyses of resident males exposed to a female intruder.
(A–B) Transition matrices of behavioral transitions grouped by appetite condition in the presence (A) or absence (B) of food. (C) Quantified between-subject comparisons of the cosine distance from the Fed condition in the presence or absence of food, respectively. (D–G) Quantified within-subject comparisons of the cosine distance from the Fed condition in the presence versus absence of food. n = 16 per group, values are means ± SEM. *p<0.05, **p<0.01, ***p<0.001.
Figure 4 with 2 supplements
Evaluating female intruder behavior in response to a dominant male resident.
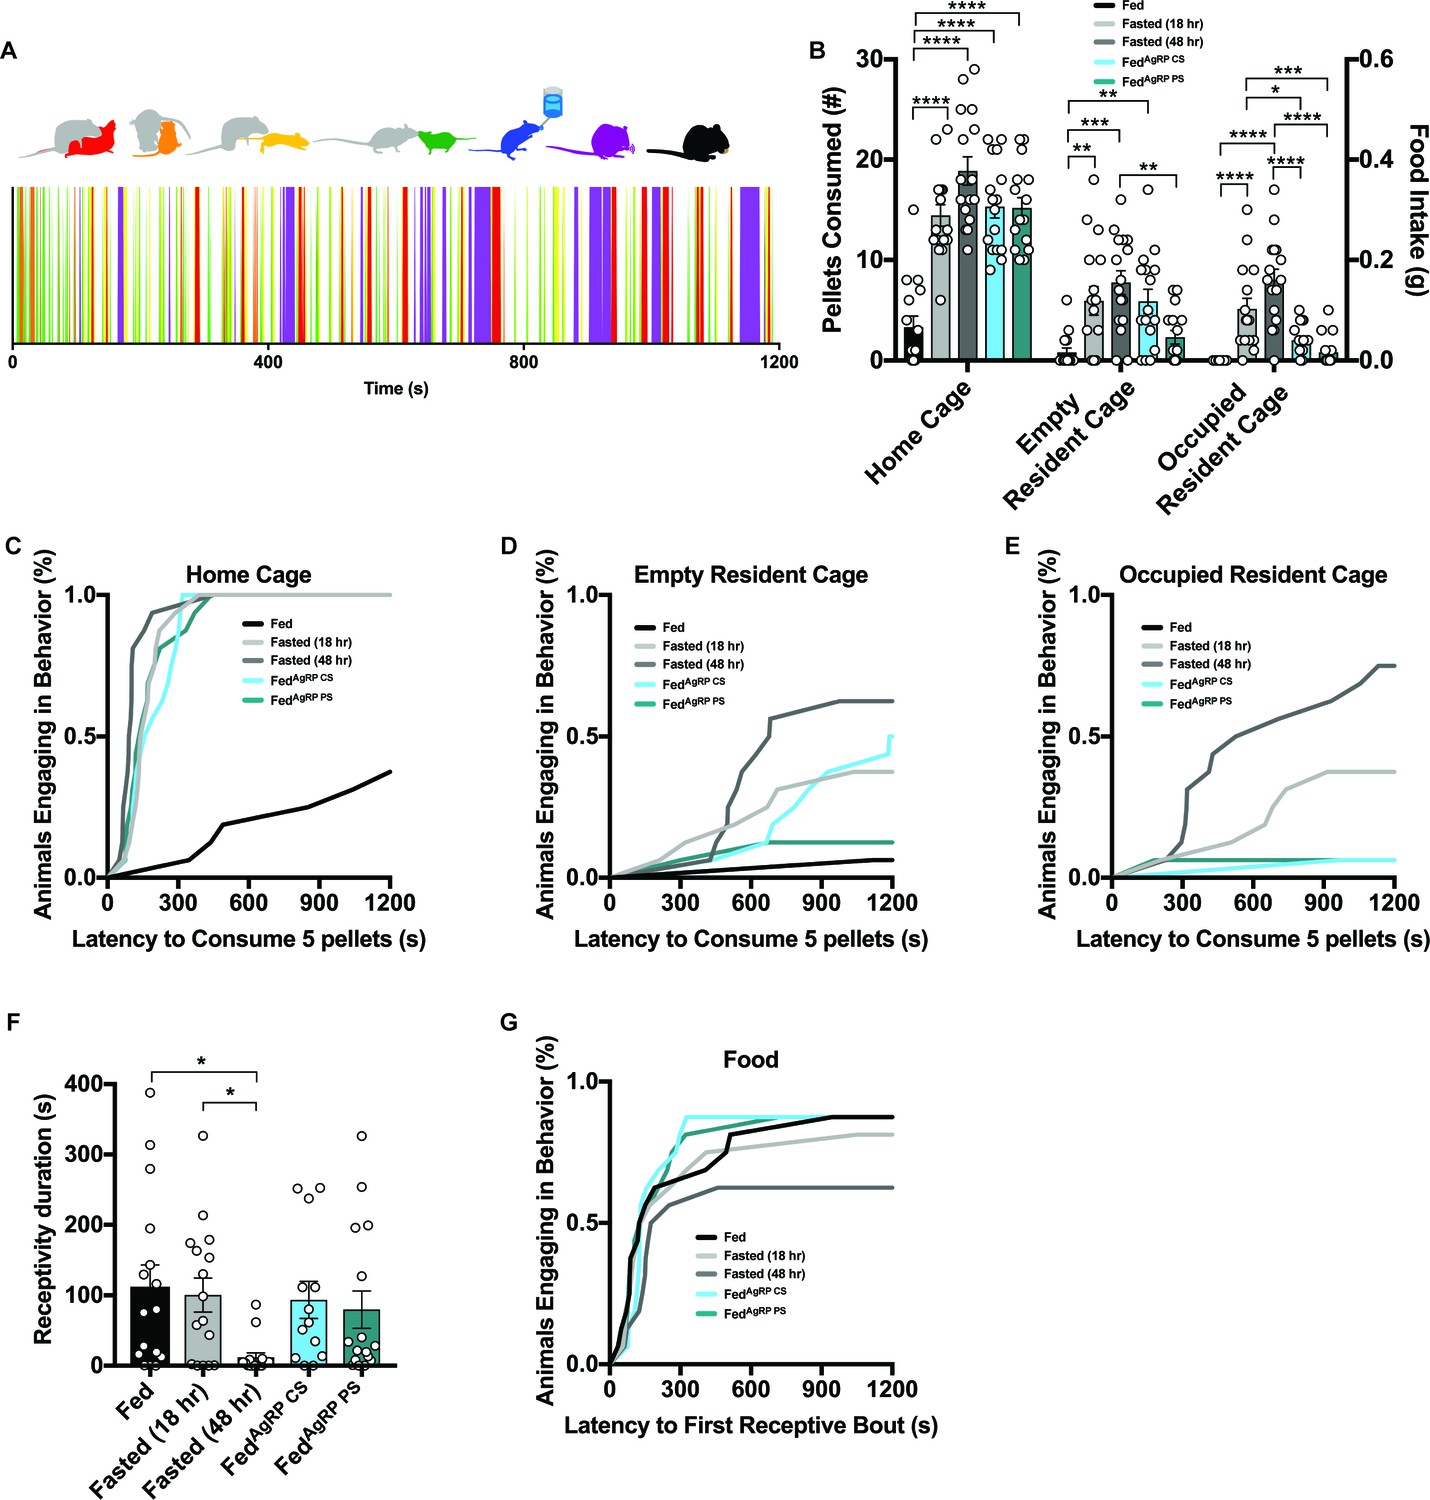
(A) Catalogue of scored female intruder behaviors (top); receptivity, encompassing presentation/lordosis (red), non-receptivity, comprising of escape/attempted escape (yellow), anogenital chemoinvestigation (orange), nose-to-nose chemoinvestigation (green), drinking (blue), grooming (purple) and eating (black). Sample raster plot of second-to-second scored behaviors across the entire Trial Phase (bottom). (B–E) Quantified between-subject comparisons of female intruder food intake (B) and cumulative latency plot to consume 0.1 grams of food in the intruder homecage (C), empty resident cage (D) or occupied resident cage (E). (F–G) Quantified between-subject comparisons of female intruder receptivity behavior (F) and cumulative latency plot to first receptive bout (G) in the presence of food. n = 16 per group, values are means ± SEM. *p<0.05, **p<0.01, ***p<0.001.
Figure 4—figure supplement 1

Experimental design of resident-intruder assay during evaluation of intruder behavior.
(A) Brain schematic of optogenetic surgery whereby Agrp-IRES-Cre animals were unilaterally injected with Cre-dependent ChR2-tdTomato virus and unilaterally implanted with an optical fiber over the ARC (left). Intruder animals were tested under five discrete appetite conditions (right). (B) Intruders for the assay were group-housed until the experiments. Each sexually-mature female was used only once to ensure virgin status and avoid variables associated with pregnancy, ensuing maternal experience, and social stress related to cagemates’ exposure to the female after the mating experience. Similarly, each male intruder was used only once to avoid further injury and prevent development of social defeat stress or learned helplessness, depressive-like occurrences resulting from repeated bouts of aggression from more dominant mice. (C) All virgin female intruders used tested positive for estrus. Arrows represent different cells in standard vaginal cytology samples throughout the estrous cycle (black arrows, nucleated epithelial cells; red arrows, cornified epithelial cells; blue arrows, leukocytes). (D) Each intruder animal was tested for 1 hr over 3 different 20 min phases; a Pre-Phase (grey color) in the absence of food and an intruder (left panel), a Trial Phase (blue color) which could occur in the intruder homecage in the presence of food but the absence of an intruder (middle panel, top), in the occupied, territorialized resident cage in the presence of both food and an intruder (middle panel, center) or in the empty, territorialized resident cage in the presence of food but the absence of an intruder (middle panel, bottom) and a Post-Phase (pink color) in the empty, territorialized residents cage in the presence of food but the absence of an intruder (right panel). Food intake was assessed first in the intruder homecage, then the empty resident cage and finally in the occupied resident cage over 2 weeks. Red and green circles on the feeding device indicate food inaccessibility and accessibility, respectively.
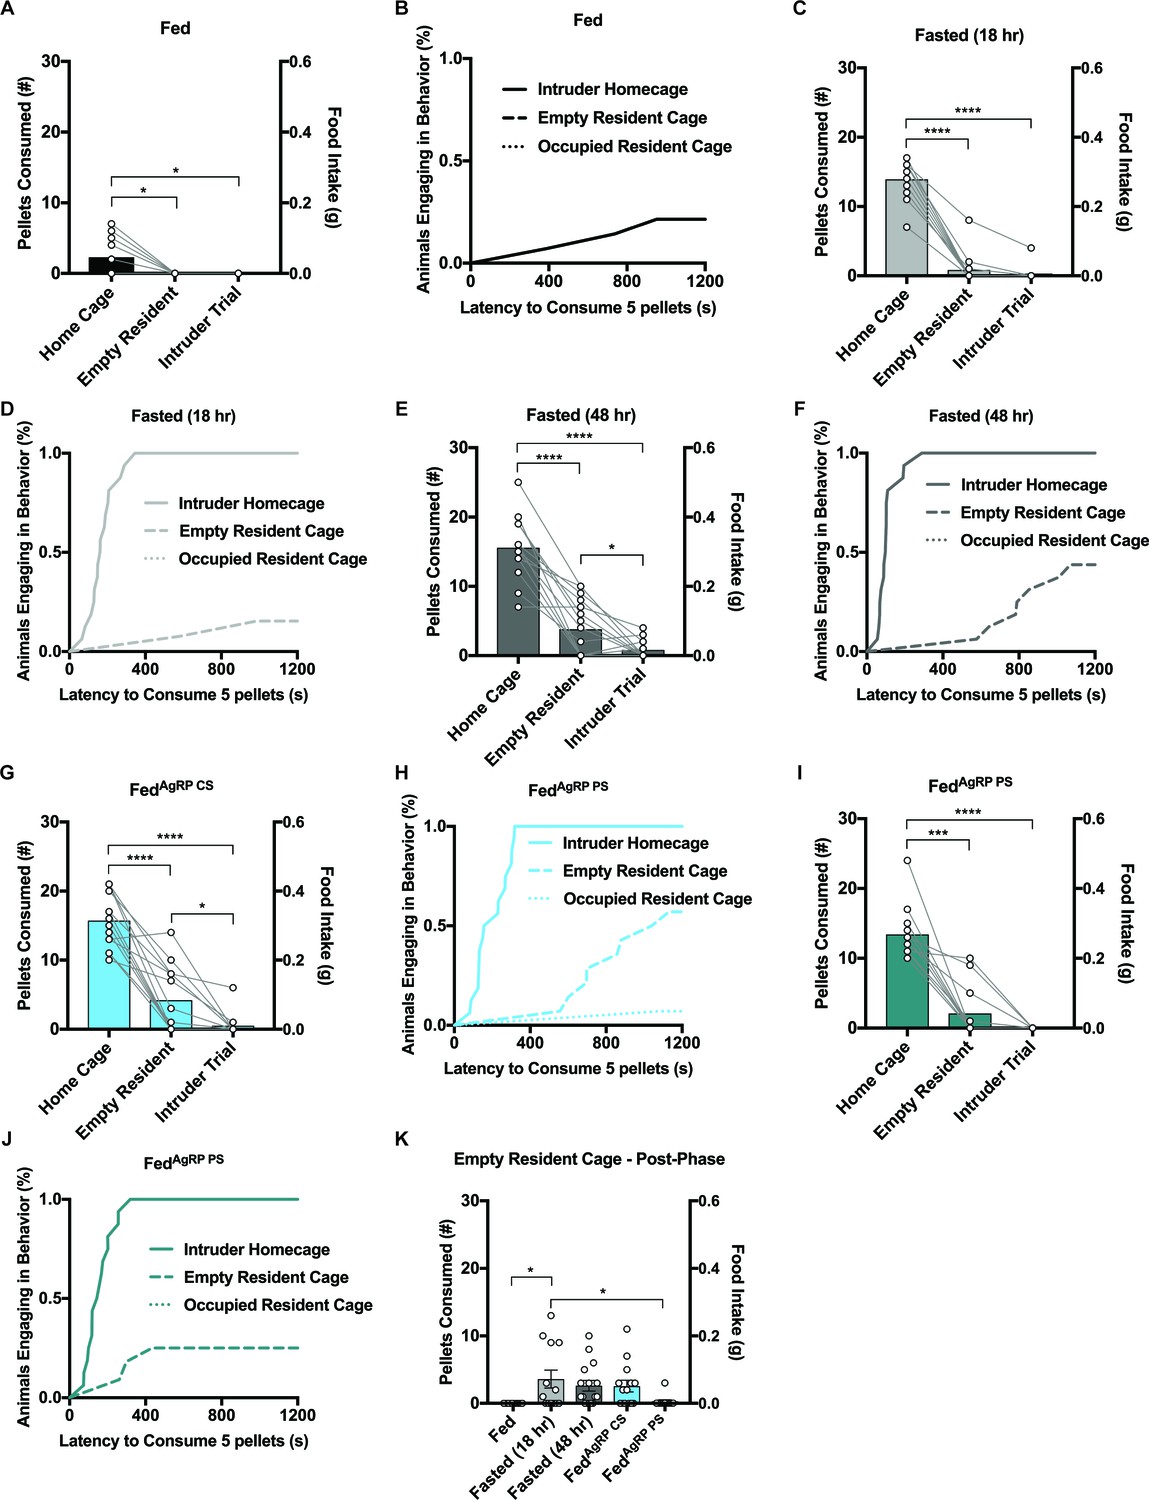
Figure 4—figure supplement 2
Evaluating female intruder behavior in response to a dominant male resident.
(A–J) Quantified within-subject comparisons of female intruder food intake in the intruder homecage versus empty resident cage versus occupied resident cage (A,C,E,G,I) and cumulative latency plots to consume 0.1 grams of food in the intruder homecage versus empty resident cage versus occupied resident cage (B,D,F,H,J) grouped by appetite condition. (K) Quantified between-subject comparisons of female intruder Post-phase food intake in an empty resident cage after male exposure during the Trial-phase. n = 16 per group, values are means ± SEM. *p<0.05, **p<0.01, ***p<0.001.
Figure 5 with 2 supplements

Evaluating resident behavior in response to a subordinate male intruder.
(A) Catalogue of scored resident behaviors (top); aggressive bouts of attack (red), chasing (yellow), anogenital chemoinvestigation (orange), nose-to-nose chemoinvestigation (green), drinking (blue), grooming (purple) and eating (black). Sample raster plot of second-to-second scored behaviors across the entire Trial Phase (bottom). (B–D) Quantified between-subject comparisons of resident food intake (B) and cumulative latency plot to consume 0.1 grams of food in the absence (C) or presence of a male intruder (D). (E–G) Linear regression plots between aggression and feeding (E), grooming and aggression (F) and drinking and feeding (G). (H–J) Quantified between-subject comparisons of resident aggression behavior (H) and cumulative latency plot to first attack in the presence (I) or absence of food (J). n = 16 per group, values are means ± SEM. *p<0.05, **p<0.01, ***p<0.001.
Figure 5—figure supplement 1

Evaluating resident behavior in response to a subordinate male intruder.
(A) Raster plots of second-to-second scored behaviors of all resident animals across the entire Trial Phase (B–F) Quantified within-subject comparisons of resident food intake in the absence or presence of a male intruder. (G–K) Cumulative latency plots to consume 0.1 grams of food in the absence versus presence of a male intruder grouped by appetite condition. (L–P) Quantified within-subject comparisons of resident aggression behavior in the absence or presence of food. (Q–U) Cumulative latency plots to first attack in the absence versus presence of food grouped by appetite condition. n = 16 per group, values are means ± SEM. *p<0.05, **p<0.01, ***p<0.001.
Figure 5—figure supplement 2

Post-trial phase food intake in resident mice in male intruder paradigm.
(A) Quantified between-subject comparisons of resident Post-phase food intake in animals never exposed to a male intruder or previously exposed to a male intruder during the Trial-phase. (B–F) Quantified within-subject comparisons of resident Post-phase food intake in animals never exposed to a male intruder versus animals exposed to a male intruder during the Trial-phase. n = 16 per group, values are means ± SEM. *p<0.05, **p<0.01, ***p<0.001.
Figure 6
Behavioral sequence analyses of resident males exposed to a male intruder.
(A–B) Transition matrices of behavioral transitions grouped by appetite condition in the presence (A) or absence (B) of food. (C) Quantified between-subject comparisons of the cosine distance from the Fed condition in the presence or absence of food, respectively. (D–G) Quantified within-subject comparisons of the cosine distance from the Fed condition in the presence versus absence of food. n = 16 per group, values are means ± SEM. *p<0.05, **p<0.01, ***p<0.001.
Figure 7 with 1 supplement
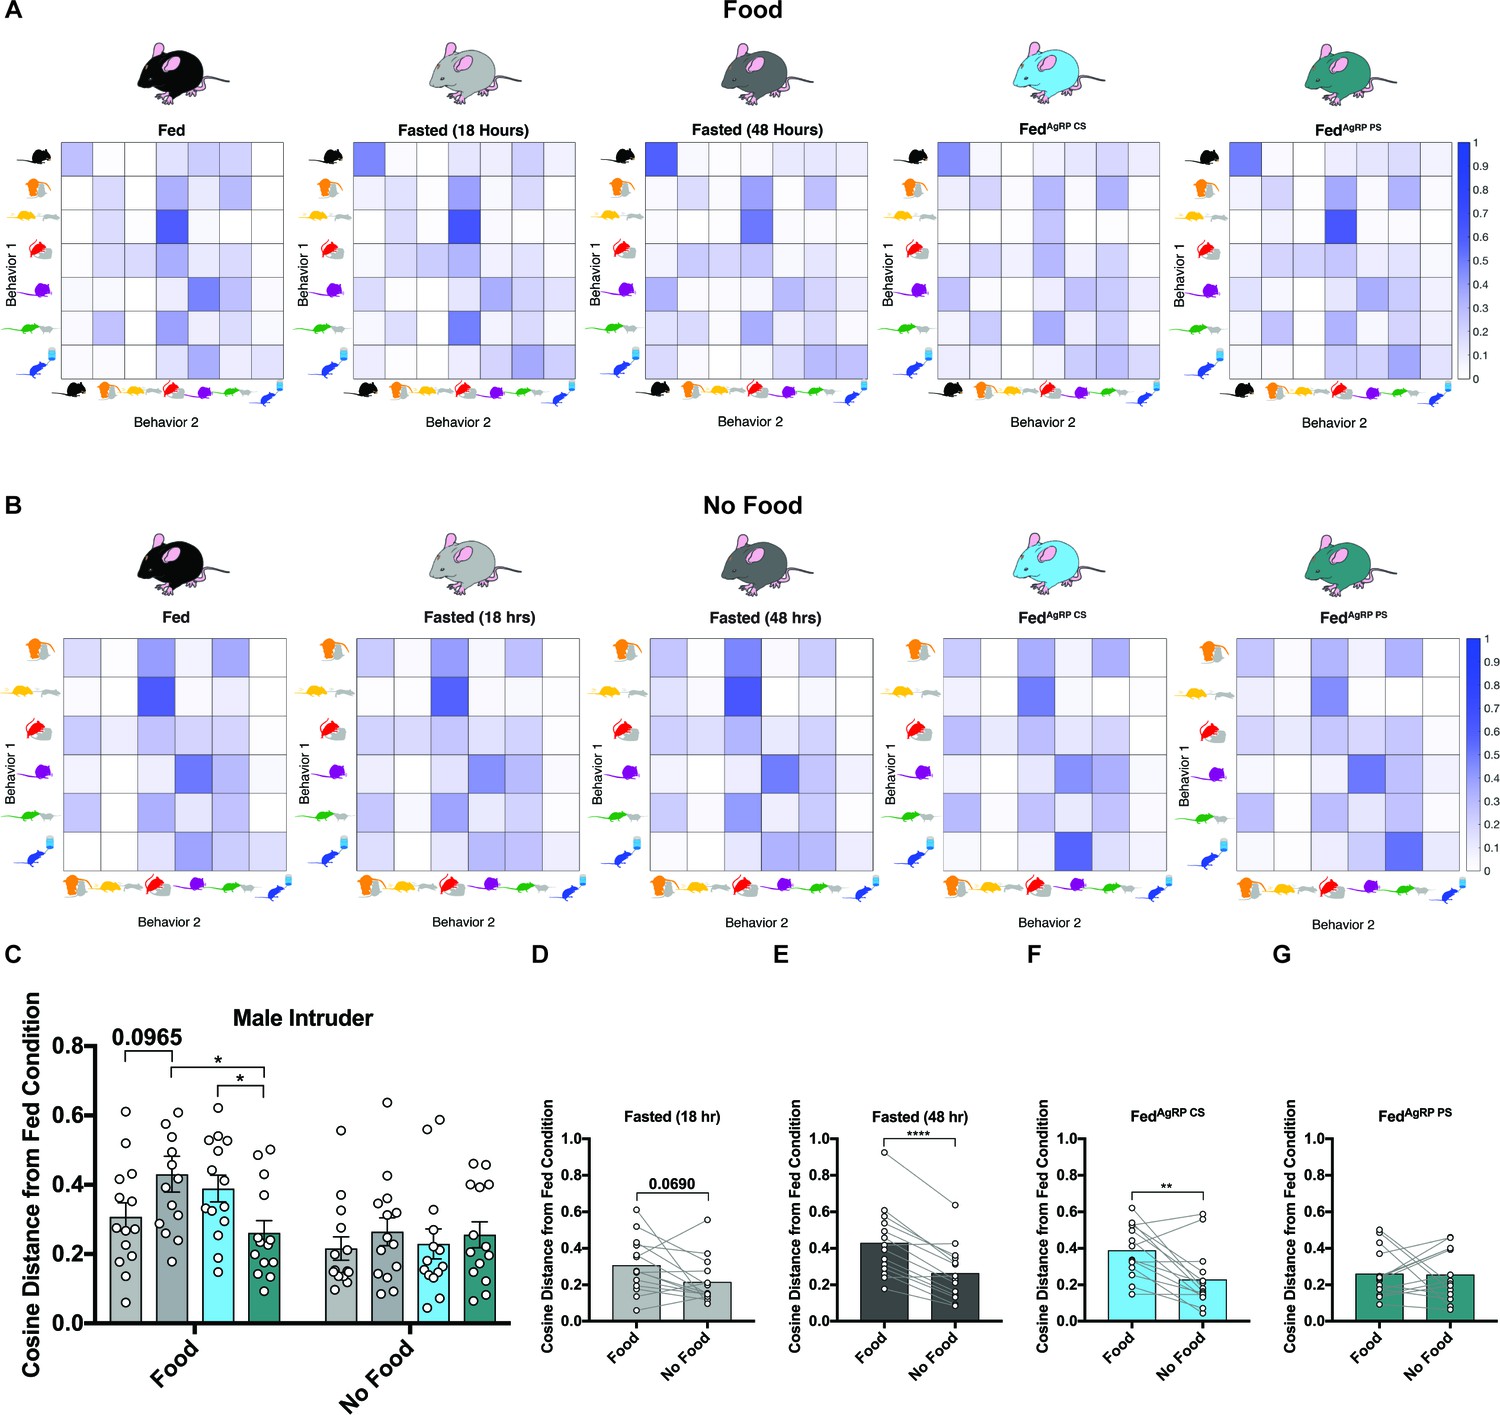
Evaluating male intruder behavior in response to a dominant male resident.
(A) Catalogue of scored male intruder behaviors (top); defensive posturing such as rearing and being pinned (red), flight comprising of escape/jumping (yellow), anogenital chemoinvestigation (orange), nose-to-nose chemoinvestigation (green), drinking (blue), grooming (purple) and eating (black). Sample raster plot of second-to-second scored behaviors across the entire Trial Phase (bottom). (B–E) Quantified between-subject comparisons of male intruder food intake (B) and cumulative latency plot to consume 0.1 grams of food in the intruder homecage (C), empty resident cage (D) or occupied resident cage (E). Quantified between-subject comparisons of male intruder escape (F) and defensive (G) behaviors. n = 14 Fed group, n = 13 Fasted (18 hr) group, n = 16 Fasted (48 hr) group, n = 14 FedAgRP CS group, n = 12 FedAgRP PS group. values are means ± SEM. *p<0.05, **p<0.01, ***p<0.001.
Figure 7—figure supplement 1
Evaluating male intruder behavior in response to a dominant male resident.
(A–J) Quantified within-subject comparisons of male intruder food intake in the intruder homecage versus empty resident cage versus occupied resident cage (A,C,E,G,I) and cumulative latency plots to consume 0.1 grams of food in the intruder homecage versus empty resident cage versus occupied resident cage (B,D,F,H,J) grouped by appetite condition. (K) Quantified between-subject comparisons of male intruder Post-phase food intake in an empty resident cage after male exposure during the Trial-phase. n = 14 Fed group, n = 13 Fasted (18 hr) group, n = 16 Fasted (48 hr) group, n = 14 FedAgRP CS group, n = 12 FedAgRP PS group. values are means ± SEM. *p<0.05, **p<0.01, ***p<0.001.
Figure 8
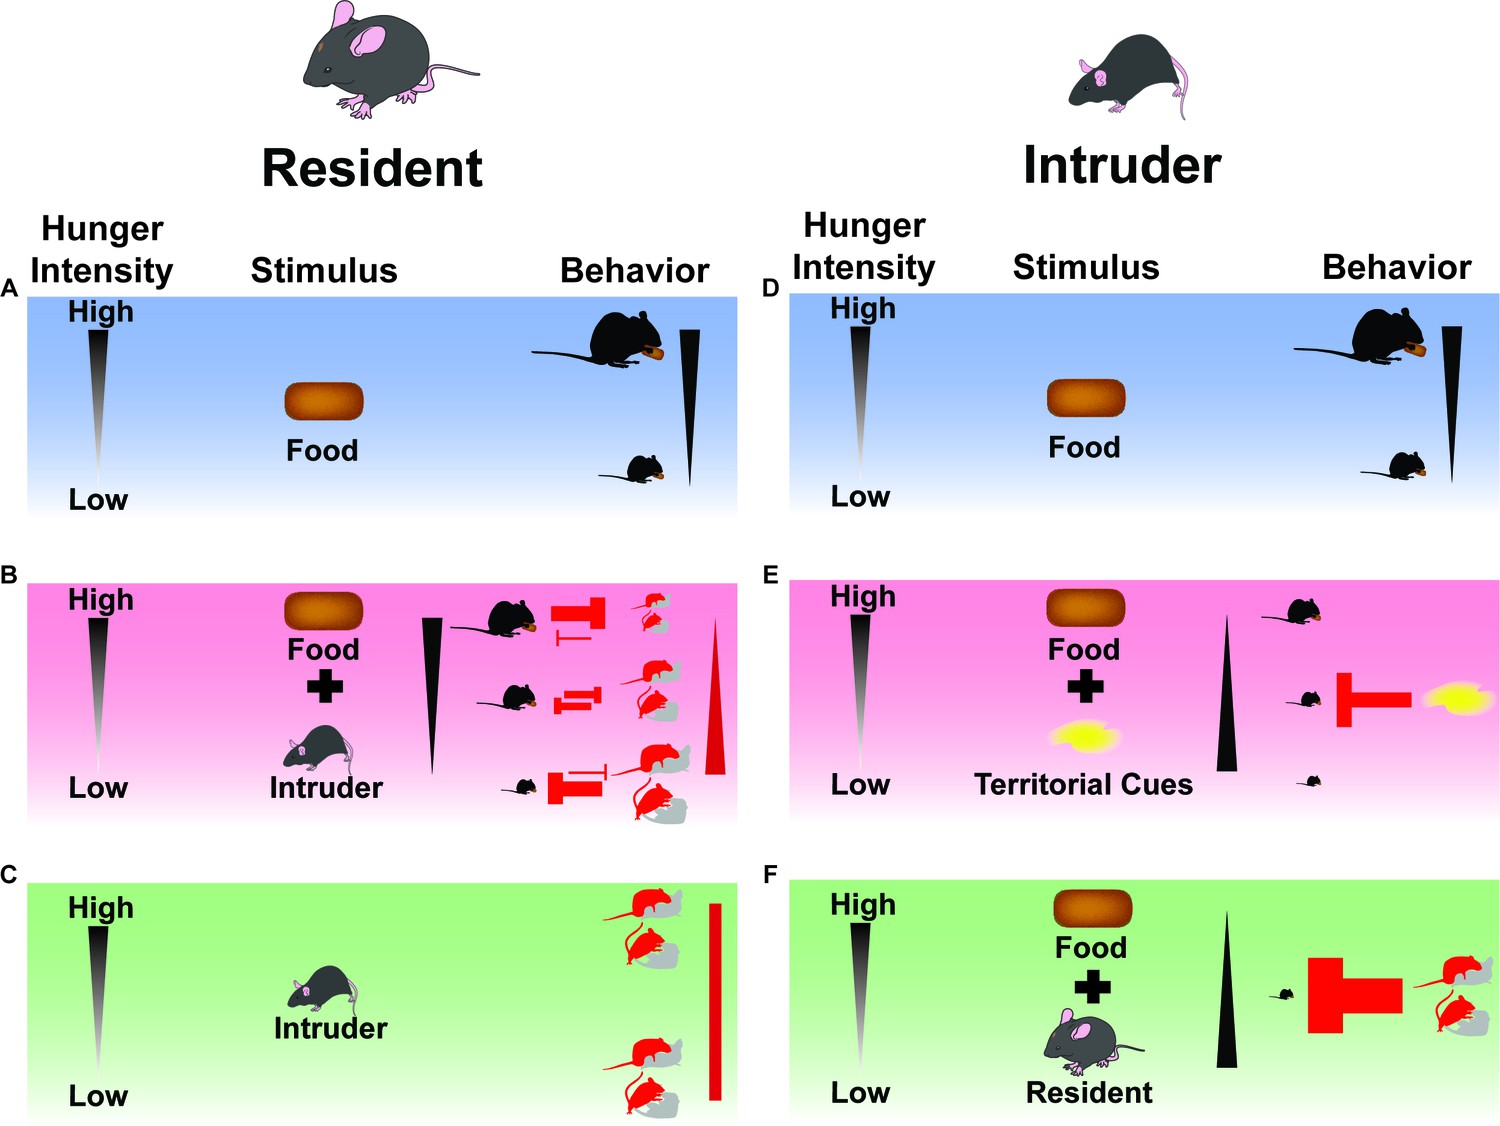
Summary Model: Feeding and social interactions/cues dynamically compete for behavioral expression.
(A) When resident male mice are presented with a singular external incentive (food), they express feeding based on internal state (hunger intensity). (B) When resident male mice are presented with multiple external incentives (food and intruding animal), a conflict arises between the motivation to eat or mate/aggress. If hunger is minimal, social interaction drives will suppress eating behaviors. If hunger intensity is high, the drive to feed will in turn deprioritize social interaction behaviors. If need state is intermediate, behaviors will both be expressed in moderate amounts. (C) When resident male mice are presented with a singular external incentive (intruder), they express social interaction behaviors independent of internal state (hunger intensity). (D) When intruder mice are presented with a singular external incentive (food) in a familiar context (homecage), they express feeding based on internal state (hunger intensity). (E) When intruder mice are presented with multiple external incentives (food and territorial cues) in an unfamiliar context (empty resident cage), they attenuate feeding based on internal state (hunger intensity). (F) When intruder mice are presented with multiple external incentives (food and resident animal) in an unfamiliar context (occupied resident cage), they abrogate feeding independent of internal state (hunger intensity), deferring to the resident’s behavioral choices of mating or aggressive advances.
Additional files
-
Source code 1
Custom python scripts.
- https://doi.org/10.7554/eLife.44527.019
-
Source code 2
Custom MATLAB script.
- https://doi.org/10.7554/eLife.44527.020
-
Transparent reporting form
- https://doi.org/10.7554/eLife.44527.026
Download links
A two-part list of links to download the article, or parts of the article, in various formats.
Downloads (link to download the article as PDF)
Open citations (links to open the citations from this article in various online reference manager services)
Cite this article (links to download the citations from this article in formats compatible with various reference manager tools)
Need-based prioritization of behavior
eLife 8:e44527.
https://doi.org/10.7554/eLife.44527


