Enzyme activity and selectivity filter stability of ancient TRPM2 channels were simultaneously lost in early vertebrates
- Semmelweis University, Hungary
Figures
Figure 1 with 1 supplement

Evolution of the TRPM2 proteins in the Animalia kingdom.
Evolutional progression through major animal taxa is indicated to the left, orange arrow marks the appearance of vertebrae. Chosen TRPM2 sequences from the indicated species are aligned in their Pore helix/Filter/Post-filter helix region (left, respective structural segments identified by bars on top and bottom) and Nudix box region (right); respective residue numbering is shown. The taxa Porifera (sponges; marked with '+') and Ctenophora (comb jellies; marked with '#') did not return any TRPM2-like sequences in BLAST. Asterisks mark Nudix box residues critical for ADPR hydrolysis. Concerted changes that happened between chordates and vertebrates in the sequences of the filter, post-filter helix, and the Nudix box are highlighted in blue (invertebrates) and red (vertebrates). Several of the listed proteins are predicted or uncharacterized proteins. For additional details on the chosen sequences, see Table in Figure 1—figure supplement 1.
-
Figure 1—source data 1
Evolution of the TRPM2 proteins in the Animalia kingdom.
- https://doi.org/10.7554/eLife.44556.004
Figure 1—figure supplement 1
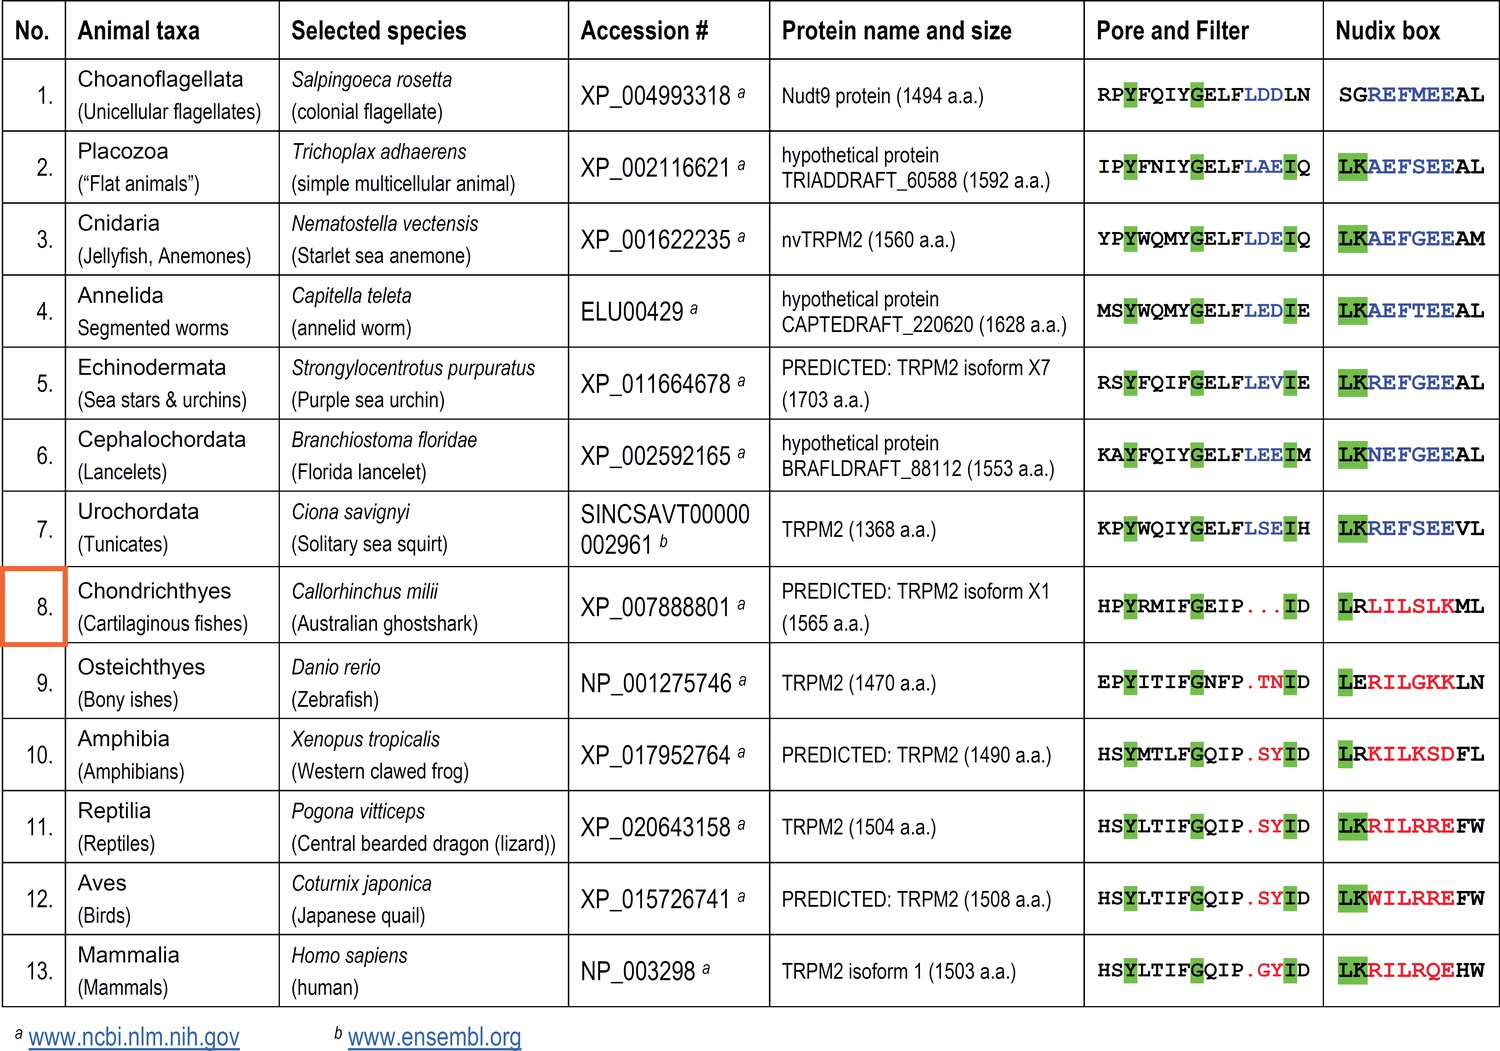
Evolutional progression of the TRPM2 proteins through the Animalia kingdom and the associated changes in their Pore/Filter and Nudix box regions.
Color coding of residues as in Figure 1. The appearance of vertebrae is marked with an orange box.
Figure 2 with 1 supplement
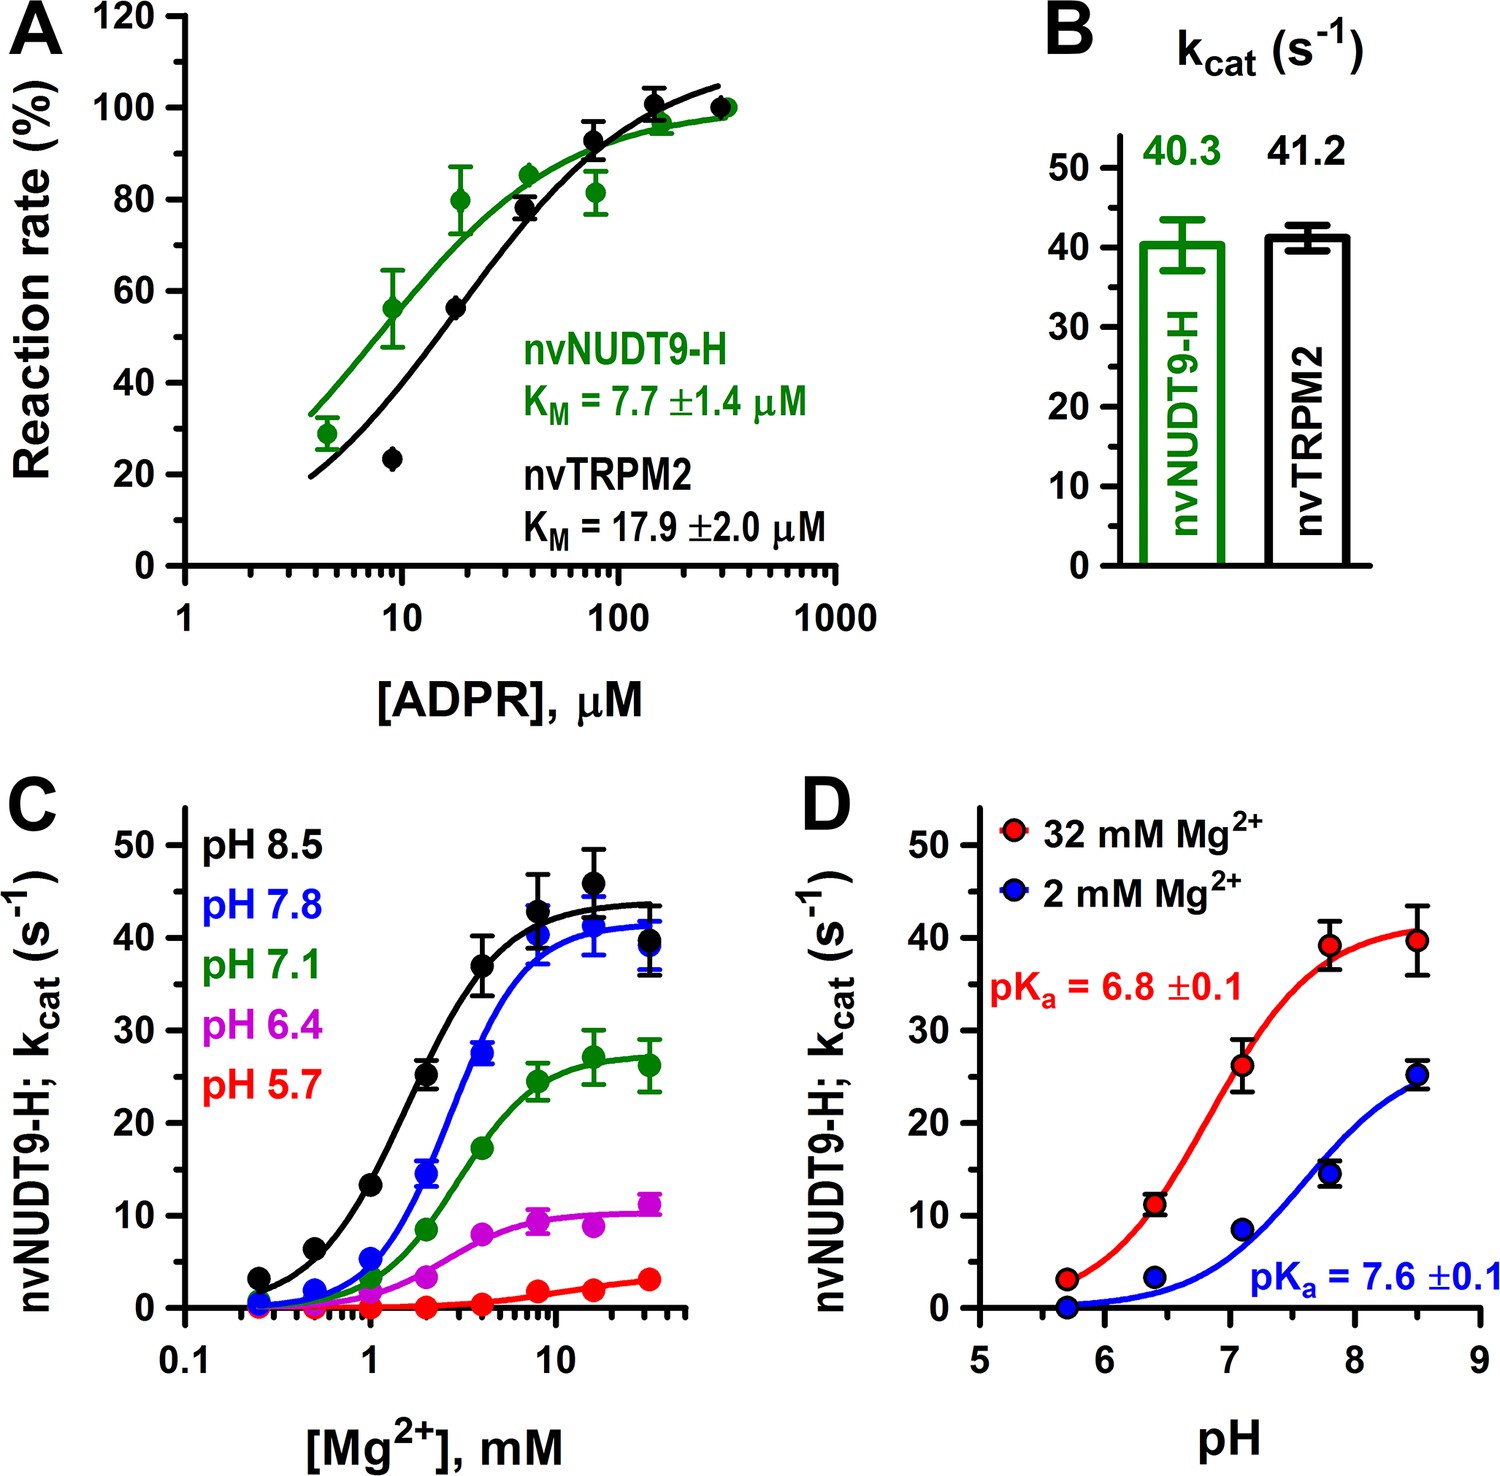
Enzymatic activity of full-length nvTRPM2 and of the isolated nvNUDT9-H domain.
(A) Rates of ADPR hydrolysis by nvTRPM2 (black) and nvNUDT9-H (green) as a function of [ADPR], normalized to the rate measured at the highest ADPR concentration (free [Mg2+] 10 mM, pH 8.0; see Materials and methods for details). Solid lines are fits to the Michaelis-Menten equation, KM values are indicated. (B) Estimated kcat values (s−1) for nvTRPM2 (black, calculated per subunit of protein) and nvNUDT9-H (green), determined in the presence of saturating ADPR. Data are shown as mean ± SEM of at least 5 experiments. (C) Mg2+-dependence of kcat (s−1) for nvNUDT9-H, determined at several fixed pH values (colors) in the presence of saturating ADPR. Solid lines are fits to the Hill equation, yielding K0.5 values of 10.8 ± 3.5 mM (pH 5.7, red), 2.5 ± 0.4 mM (pH 6.4, magenta), 3.0 ± 0.3 mM (pH 7.1, green), 2.7 ± 0.2 mM (pH 7.8, blue) and 1.6 ± 0.2 mM (pH 8.5, black); Hill coefficient was ~2 in each case. (D) pH-dependence of kcat (s−1) for nvNUDT9-H, determined at two different fixed free [Mg2+] (colors). Solid lines are fits to the equation kcat = kcat;max/(1 + 10(pKa−pH)), with the calculated pKa values indicated. Data are shown as mean ± SEM of at least 3 experiments. See also Figure 2—figure supplement 1.
-
Figure 2—source data 1
Enzymatic activity of full-length nvTRPM2 and of the isolated nvNUDT9-H domain.
- https://doi.org/10.7554/eLife.44556.007
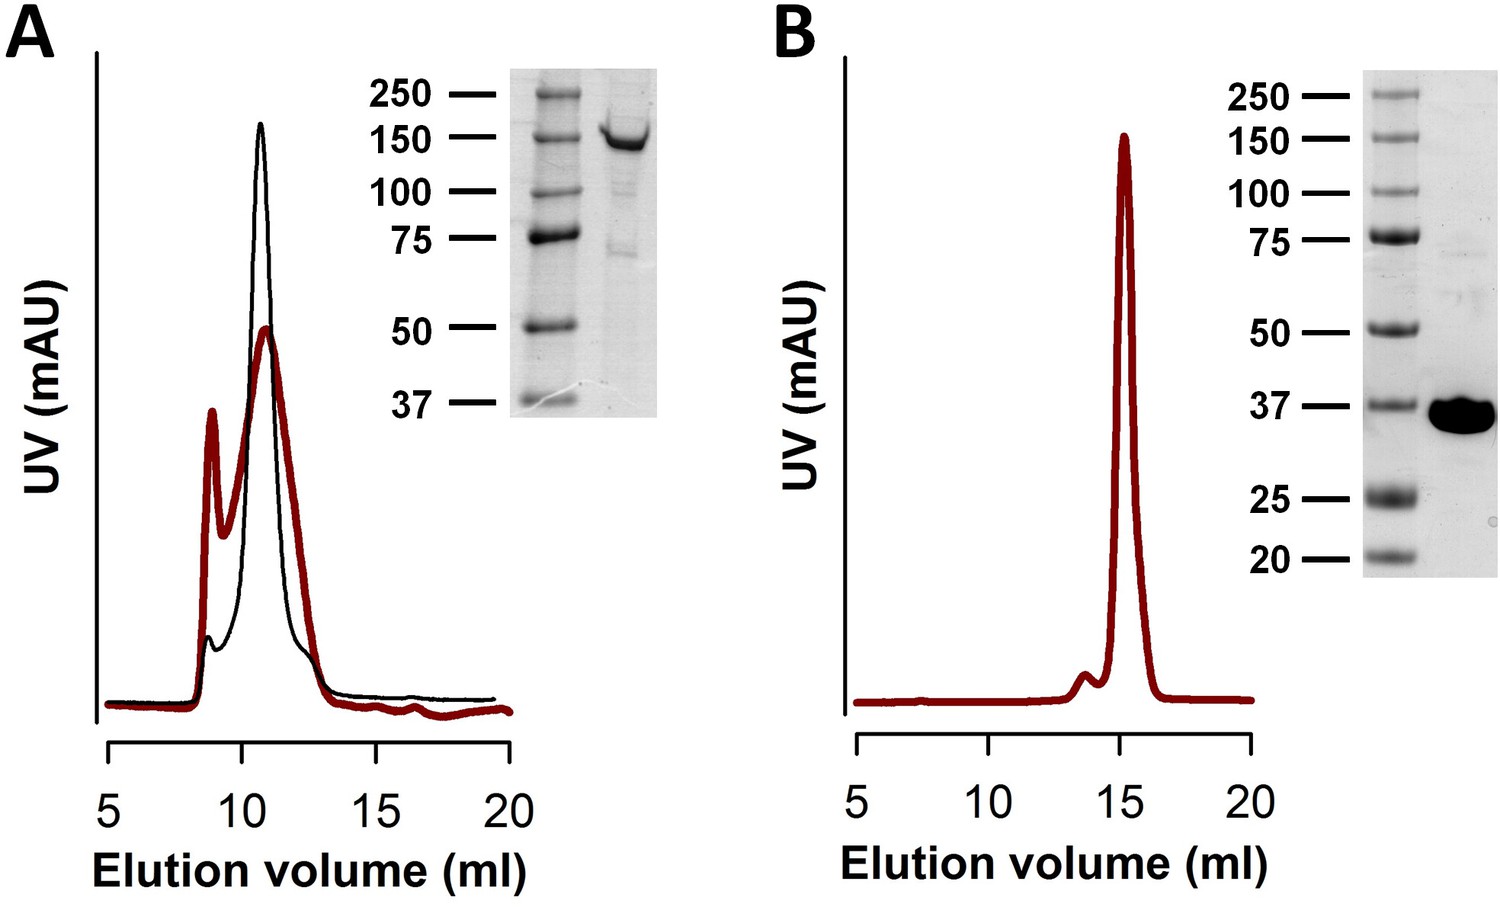
Figure 2—figure supplement 1
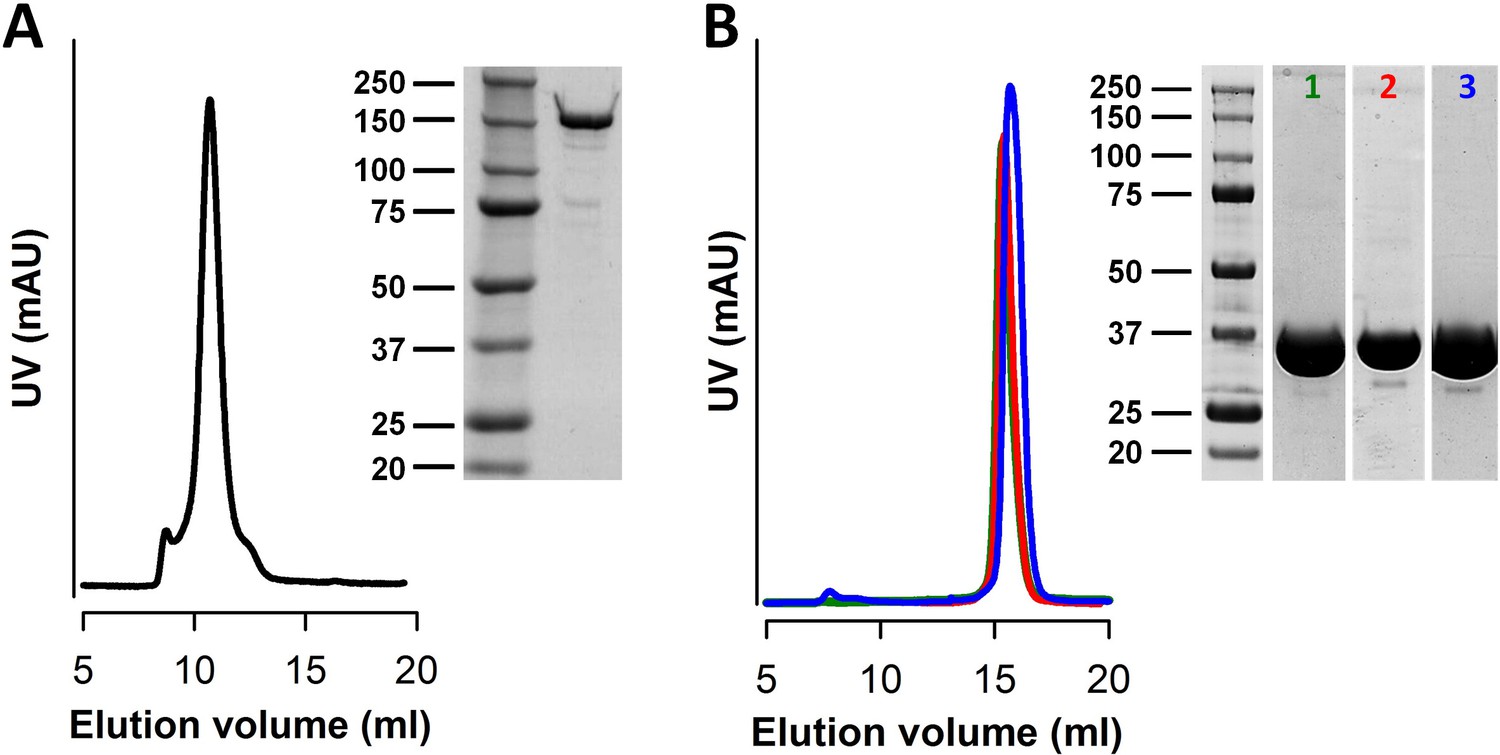
Purification of nvTRPM2 and nvNUDT9-H.
(A) Gel filtration (SEC) profile of freshly purified nvTRPM2 subjected to a second round of gel filtration, and SDS PAGE image of the collected main peak fraction. (B) Gel filtration profiles and SDS PAGE images of purified wild-type nvNUDT9-H (green SEC profile and lane 1), nvNUDT9-H E1443I/F1444L (red SEC profile and lane 2), and nvNUDT9-H E1446K/E1447K (blue SEC profile and lane 3). Protein marker ladders are in kDa.
Figure 3 with 1 supplement
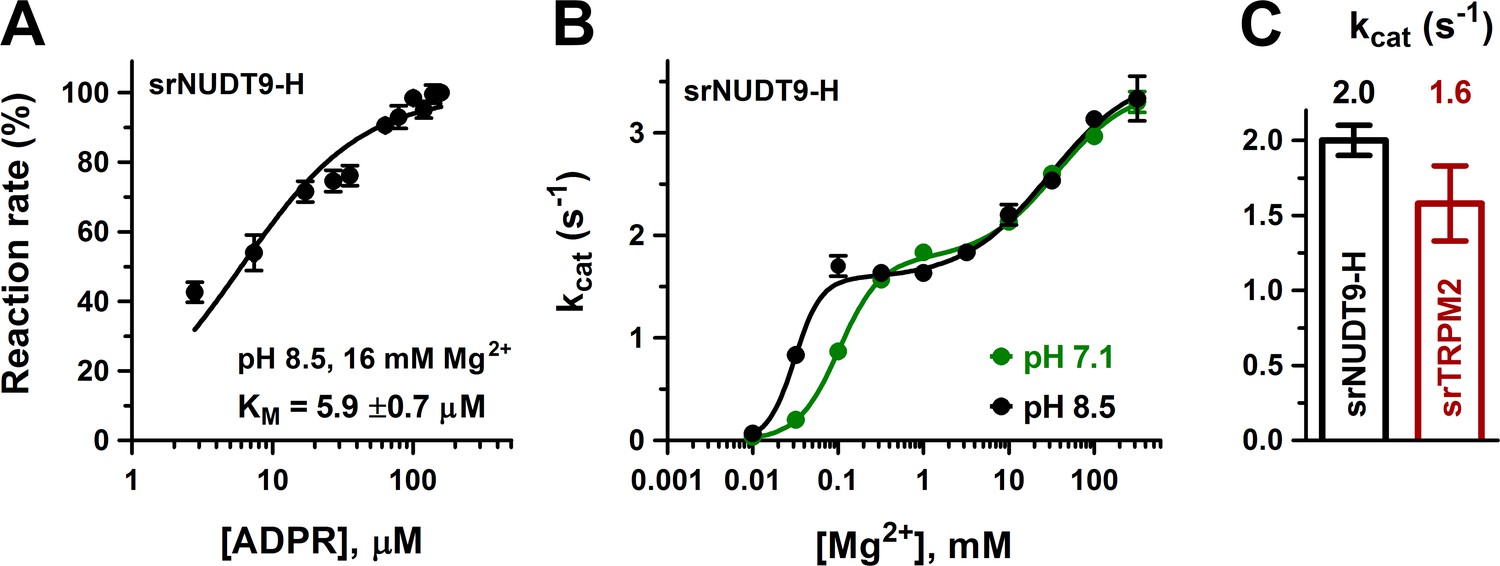
Enzymatic activity of full-length srTRPM2 and of the isolated srNUDT9-H domain.
(A) Rate of ADPR hydrolysis by NUDT9-H from Salpingoeca rosetta (srNUDT9-H) as a function of [ADPR], measured at pH 8.5 in the presence of 16 mM Mg2+, normalized to the rate measured at the highest ADPR concentration (see Materials and methods for details). The solid line is a fit to the Michaelis-Menten equation, the KM value is indicated. Data are shown as mean ± SEM of 3 experiments. (B) Mg2+-dependence of kcat (s−1) for srNUDT9-H, determined at fixed pH values of 8.5 (black symbols) and 7.1 (green symbols) in the presence of saturating ADPR. Solid lines are fits to the equation , yielding fit parameters of kcat1 = 1.57 ± 0.08 s−1, K1 = 0.031 ± 0.002 mM, n1 = 2.8 ± 0.9, kcat2 = 3.59 ± 0.19 s−1, K2 = 29 ± 8 mM, n2 = 0.86 ± 0.18 (pH 8.5, black), and kcat1 = 1.76 ± 0.07 s−1, K1 = 0.102 ± 0.008 mM, n1 = 1.8 ± 0.2, kcat2 = 3.44 ± 0.12 s−1, K2 = 35 ± 6 mM, n2 = 1.0 ± 0.2 (pH 7.1, green). (C) Estimated kcat values (s−1) for full-length srTRPM2 (brown, calculated per subunit of protein) and srNUDT9-H (black), determined in the presence of saturating ADPR at pH 8.5 in presence of 16 mM Mg2+. Data are shown as mean ± SEM of at least 3 experiments. See also Figure 3—figure supplement 1.
-
Figure 3—source data 1
Enzymatic activity of full-length srTRPM2 and of the isolated srNUDT9-H domain.
- https://doi.org/10.7554/eLife.44556.010
Figure 3—figure supplement 1
Purification of srNUDT9-H.
(A) Gel flitration (SEC) profile of freshly purified srTRPM2 subjected to a second round of gel filtration (brown curve), and SDS PAGE image of the collected main peak fraction. Note broadened peak and rapid repopulation of the void fraction. Black curve replots the SEC profile of nvTRPM2 from Figure 2—figure supplement 1A as a comparison. (B) Gel filtration profile of wild-type srNUDT9-H and SDS PAGE image of the collected main peak fraction. Protein marker ladders are in kDa.
Figure 4 with 3 supplements
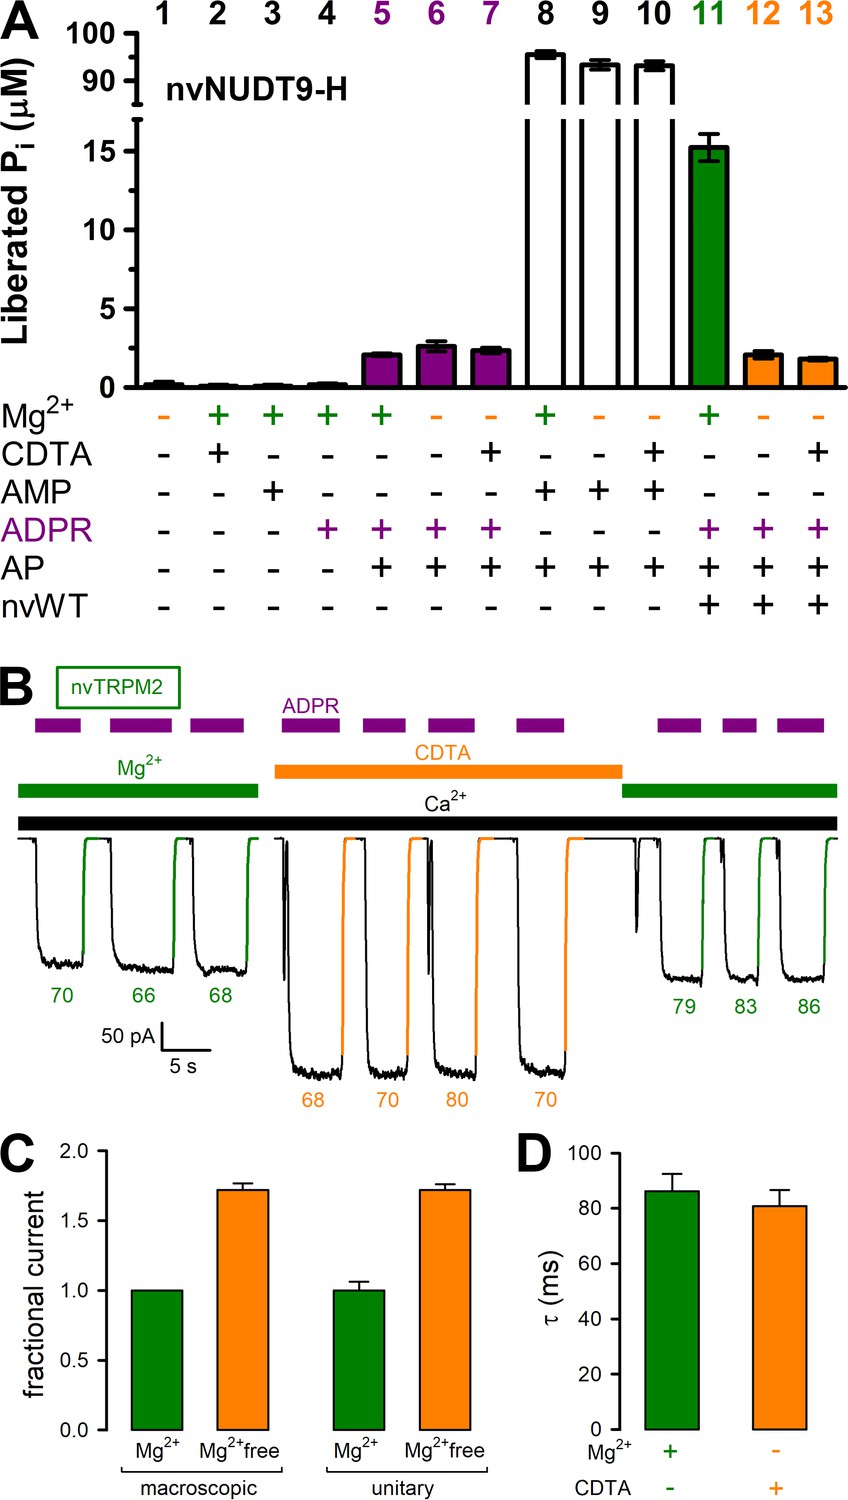
Mg2+removal abolishes hydrolytic activity but does not affect macroscopic gating parameters of nvTRPM2.
(A) ADPRase rates of WT nvNUDT9-H (nvWT), reported as Pi (in μM) released by co-applied alkaline phosphatase (AP), in sample mixtures containing, as indicated, MgCl2 (16 mM), CDTA (100 μM), AMP (100 μM), ADPR (100 μM), AP (2–3 U), nvNUDT9-H (0.5 nM), and incubated for 5 min at room temperature. Data are shown as mean ± SEM of 3 experiments. (B) Macroscopic inward currents at −20 mV membrane potential, activated by repeated exposures to 100 μM ADPR (purple bars) in the presence of 125 μM Ca2+ (black bar), in an inside-out patch excised from a Xenopus laevis oocyte injected with nvTRPM2 cRNA. Cytosolic (bath) solution contained either 2 mM added Mg(gluconate)2 (green bars) or no added Mg2+ but 100 μM CDTA (orange bar). Colored solid lines are exponentials fitted to the decay time courses, with time constants (in ms) indicated. (C) Fractional changes in macroscopic (left) and unitary (right) current amplitudes upon removal of cytosolic Mg2+ at −20 mV membrane potential. Macroscopic currents in the absence of cytosolic Mg2+ were normalized to those in the presence of 2 mM cytosolic Mg2+ within the same patch, left orange bar shows mean ± SEM from 11 patches. Average unitary current in the absence (right orange bar; mean ± SEM from 4 patches) and presence (right green bar; mean ± SEM from 3 patches) of cytosolic (2 mM) Mg2+ are shown normalized to the mean of the latter value (−2.5 pA). (D) Average time constants (mean ± SEM from 11 patches) of macroscopic current decay following ADPR removal in the presence (green) or absence (orange) of cytosolic Mg2+. See also Figure 4—figure supplement 1, Figure 4—figure supplement 2, and Figure 4—figure supplement 3.
-
Figure 4—source data 1
Mg2+removalabolishes hydrolytic activity but does not affect macroscopic gating parameters of nvTRPM2.
- https://doi.org/10.7554/eLife.44556.015
Figure 4—figure supplement 1
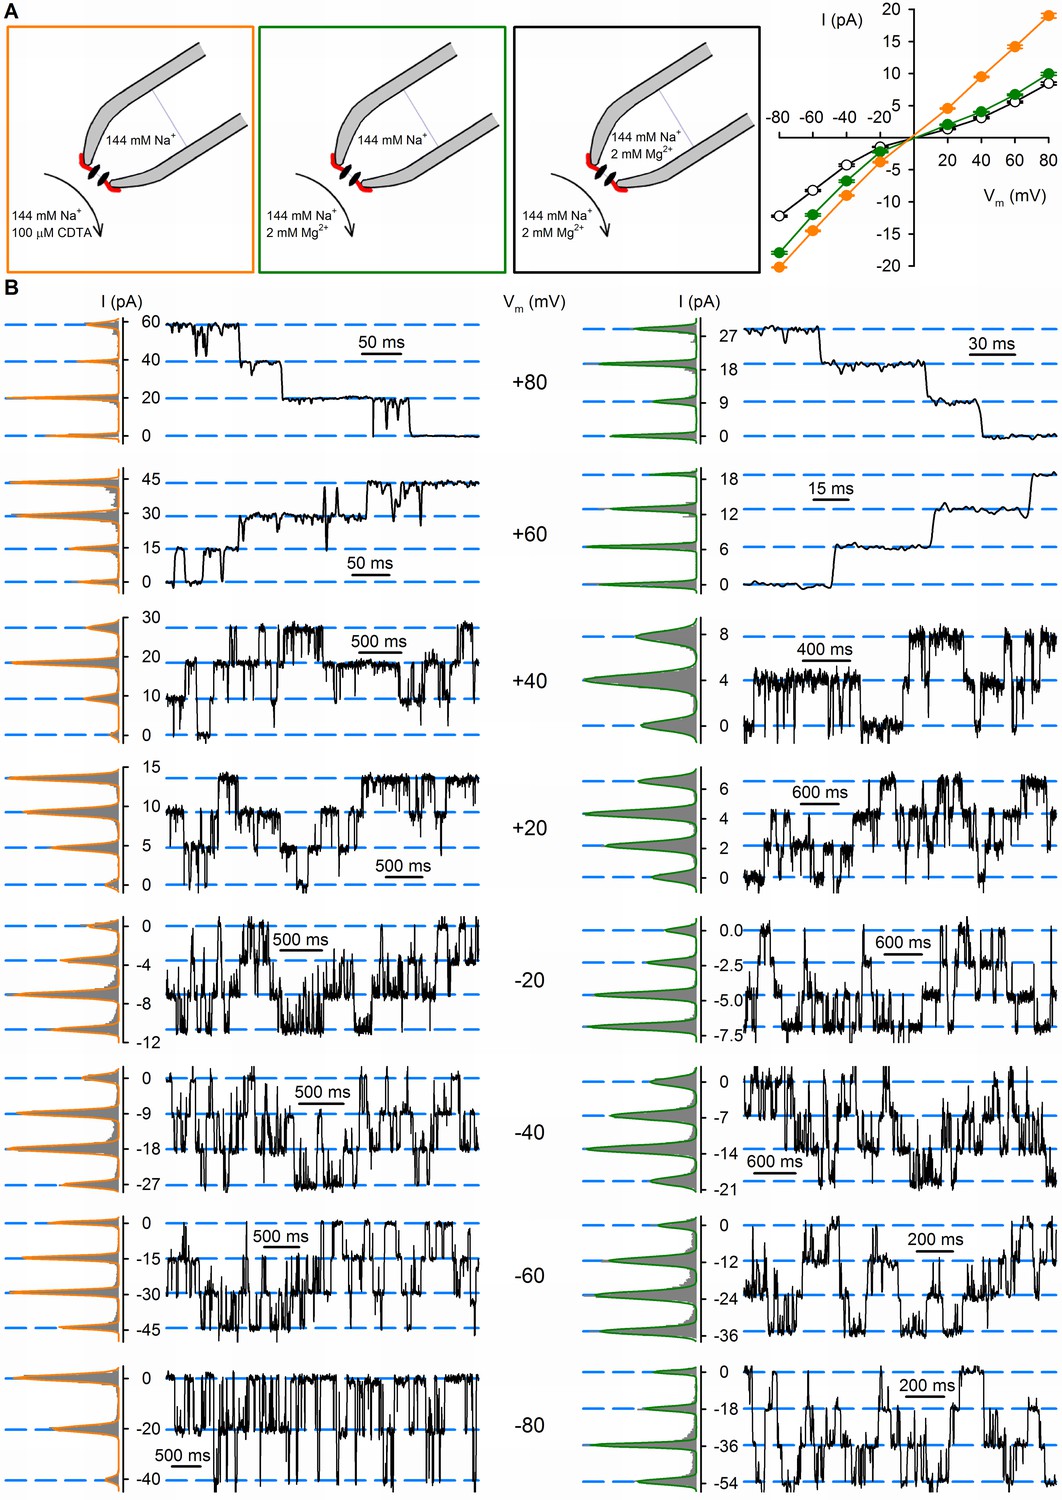
Effects of extra- and intracellular Mg2+ on unitary conductance properties of nvTRPM2.
(A) Unitary current-voltage (i–V) relationships of nvTRPM2 channels in symmetrical 144 mM Na+ as the main charge carrier, but with 2 mM Mg2+ present on both sides (open black symbols, replotted from Zhang et al., 2018), with 2 mM Mg2+ present only on the intracellular side (solid green symbols), or with Mg2+ omitted from both sides (solid orange symbols), of the membrane. Symbols represent mean ± SEM from at least 3 measurement. Cartoons to the left illustrate ionic conditions. (B) Unitary current transitions resolved from inside-out patches with multiple active nvTRPM2 channels at membrane potentials between −80 and +80 mV in the absence (left) or presence (right) of 2 mM cytosolic Mg2+. The pipette solution contained no added Mg2+. Fits of sums of Gaussian functions to all-points histograms (shown to the left of each current trace) were used to calculate the unitary current amplitudes shown in (A).
Figure 4—figure supplement 2
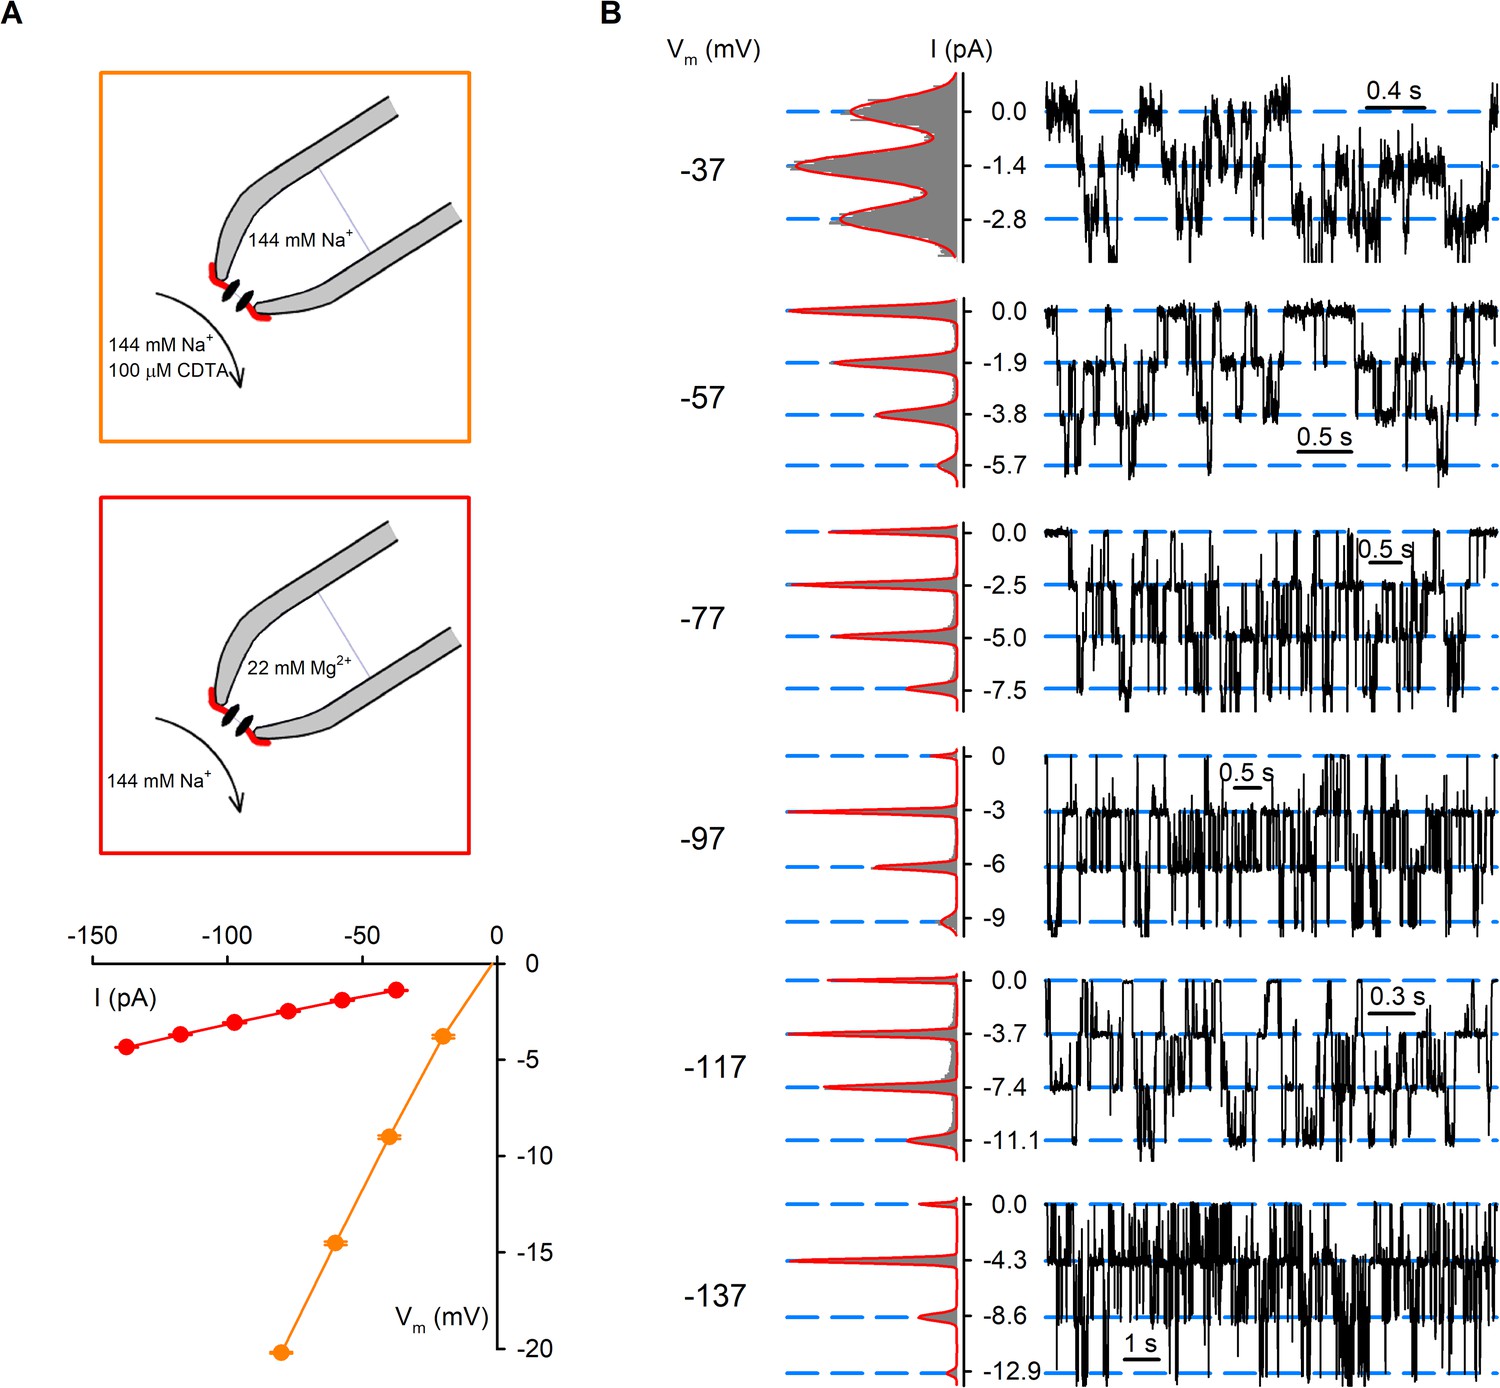
nvTRPM2 channels are permeable to Mg2+.
(A) Unitary current-voltage (i–V) relationships of nvTRPM2 channels in symmetrical 144 mM Na+ as the cation (orange symbols, replotted from Figure 4—figure supplement 1), or with 22 mM Mg2+ in the extracellular (pipette) and 144 mM Na+ in the intracellular (bath) solution (red symbols). For the 22 Mg2+/144 Na+ condition, voltages were corrected for the experimentally determined liquid junction potential (−17 mV); the fitted (red line) slope conductance was ~32 pS. Cartoons on top illustrate ionic conditions. (B) Unitary current transitions resolved from inside-out patches with multiple active nvTRPM2 channels at membrane potentials between −137 and −37 mV recorded with a pipette solution containing 22 mM Mg2+ as the sole cation, and 144 mM Na+ in the bath. Fits of sums of Gaussian functions to all-points histograms (shown to the left of each current trace) were used to calculate the unitary current amplitudes plotted in (A).
Figure 4—figure supplement 3
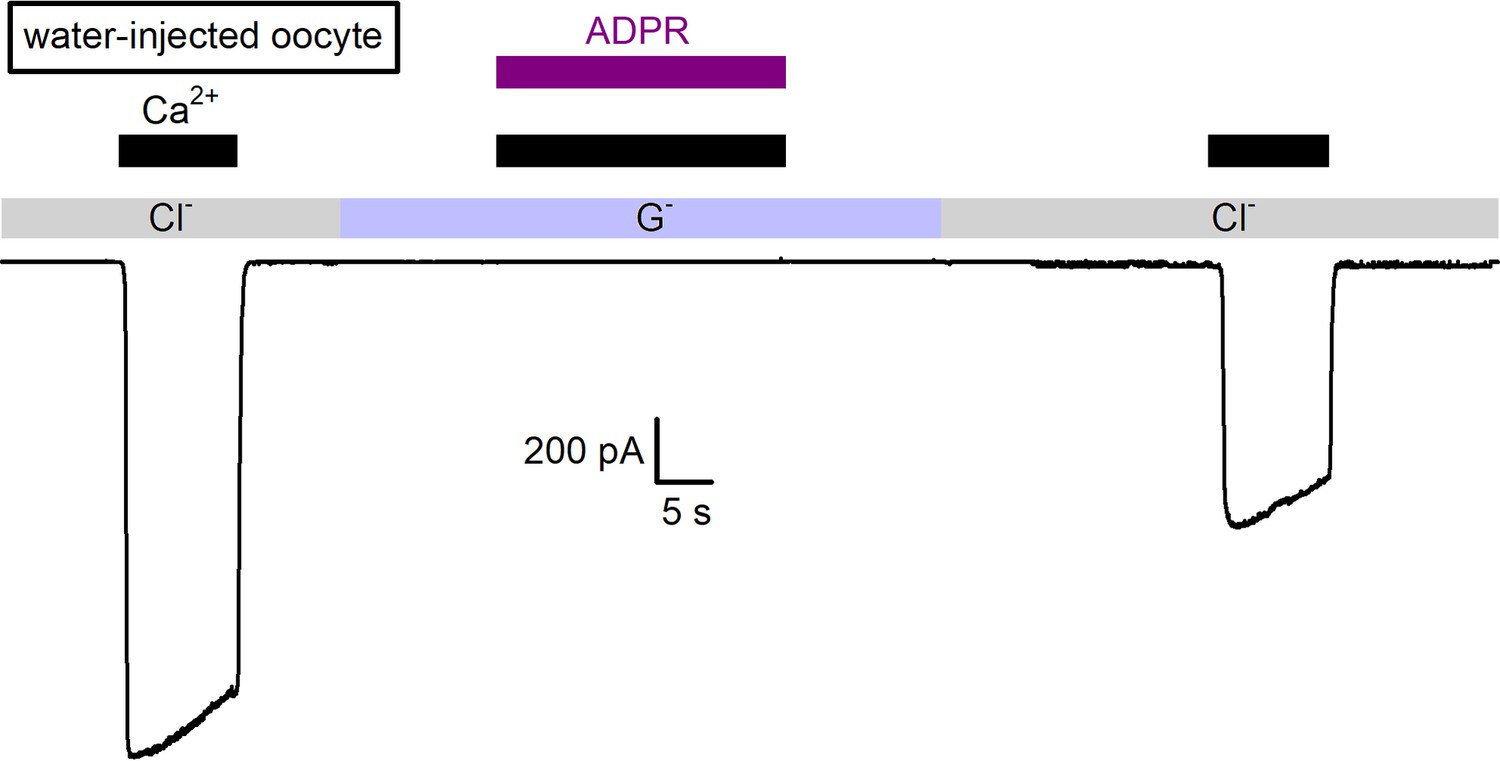
Lack of background currents in water-injected Xenopus laevis oocytes in symmetrical Na-gluconate solutions.
Macroscopic inward currents at −20 mV in an inside-out patch excised from a water-injected Xenopus laevis oocyte, obtained with a pipette filled with our standard Na-gluconate based pipette solution, but with the cytosolic surface exposed either to our standard Na-gluconate based bath solution (light violet bar), or to a NaCl based bath solution (gray bars). Note large endogenous chloride currents activated by exposure to 100 μM cytosolic Ca2+ (black bars) when chloride is present on the cytosolic side, but no current activated by 100 μM Ca2+ + 100 μM ADPR (purple bar) in the presence of cytosolic gluconate (cf., Csanády and Törocsik, 2009).
Figure 5
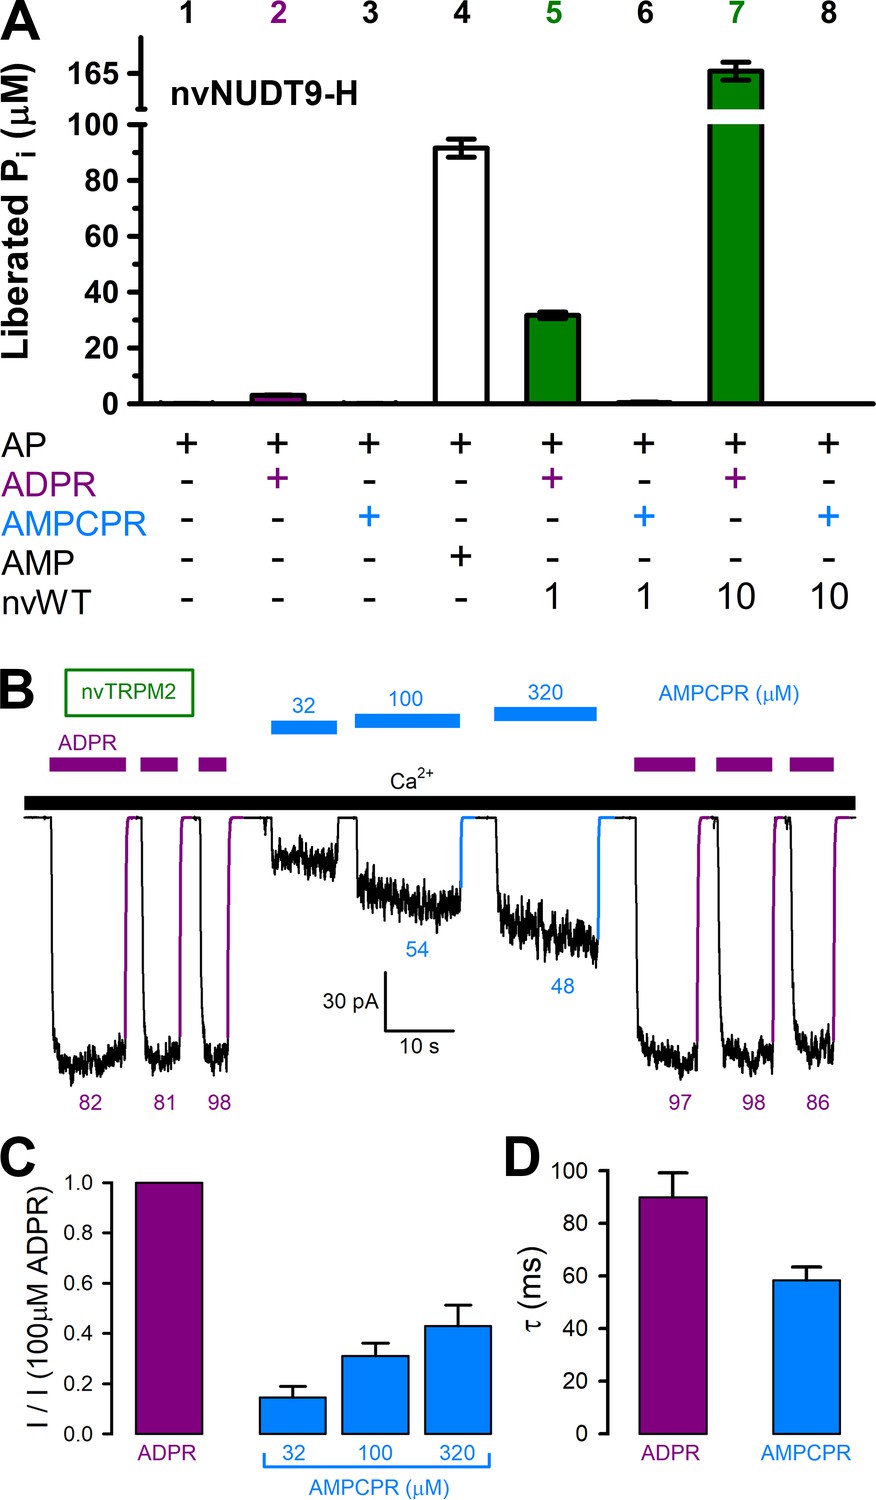
AMPCPR cannot be hydrolyzed by nvTRPM2, but still activates the channel.
(A) Nucleoside diphosphohydrolase rates of WT nvNUDT9-H (nvWT), reported as Pi (in μM) released by co-applied alkaline phosphatase (AP), in sample mixtures containing, as indicated, AP (2–3 U), ADPR (100 μM), AMPCPR (100 μM), AMP (100 μM), nvNUDT9-H (1 or 10 nM), and incubated for 5 min at room temperature in the presence of 16 mM Mg2+, pH=8.5. Data are shown as mean ± SEM of 3 experiments. (B) Macroscopic nvTRPM2 currents activated by repeated exposures to (100 μM) ADPR (purple bars) or various concentrations of AMPCPR (blue bars) in the presence of 125 μM Ca2+ (black bar). Colored solid lines are fitted exponentials with time constants (in ms) indicated. (C) Fractional current activation by indicated concentrations of AMPCPR (blue bars; mean ± SEM from 4 to 7 patches), normalized to the current elicited in the same patch by 100 μM ADPR (purple bar). (D) Average macroscopic current decay time constants (mean ± SEM from 5 patches) following removal of the activating nucleotide.
-
Figure 5—source data 1
AMPCPR cannot be hydrolyzed by nvTRPM2, but still activates the channel.
- https://doi.org/10.7554/eLife.44556.017
Figure 6 with 1 supplement

Nudix box substitutions impair catalytic activity, but not macroscopic gating properties, of nvTRPM2.
(A) Rates of ADPR hydrolysis by nvNUDT9-H WT (green), E1443I/F1444L (nvIL, red), and E1446K/E1447K (nvKK, blue) in 16 mM Mg2+, pH=8.5, as a function of [ADPR], normalized to the rate measured at 160 μM ADPR. Solid lines are fits to the Michaelis-Menten equation, KM values are indicated. (B) Estimated kcat values (s−1) for nvNUDT9-H WT (green), E1443I/F1444L (nvIL, red), E1446K/E1447K (nvKK, blue), estimated in the presence of saturating ADPR. Data are shown as mean ± SEM of at least 3 experiments. (C–E) Macroscopic currents of (C) WT, (D) E1443I/F1444L, and (E) E1446K/E1447K nvTRPM2 activated by exposures to various concentrations of ADPR (purple bars) in the presence of 125 μM Ca2+ (black bar). Colored solid lines are fitted exponentials with time constants (in ms) indicated. (F) Fractional current activation as a function of [ADPR] for WT (green), E1443I/F1444L (red), and E1446K/E1447K (blue) nvTRPM2, normalized to the current in 100 μM ADPR in the same patch. Symbols and error bars represent mean ± SEM (n = 3–6), solid lines are fits to the Hill equation with fit parameters indicated. (G) Average macroscopic current decay time constants (mean ± SEM from 6 patches) following ADPR removal for WT and mutant nvTRPM2.
-
Figure 6—source data 1
Nudix box substitutions impair catalytic activity, but not macroscopic gating properties, of nvTRPM2.
- https://doi.org/10.7554/eLife.44556.020
Figure 6—figure supplement 1
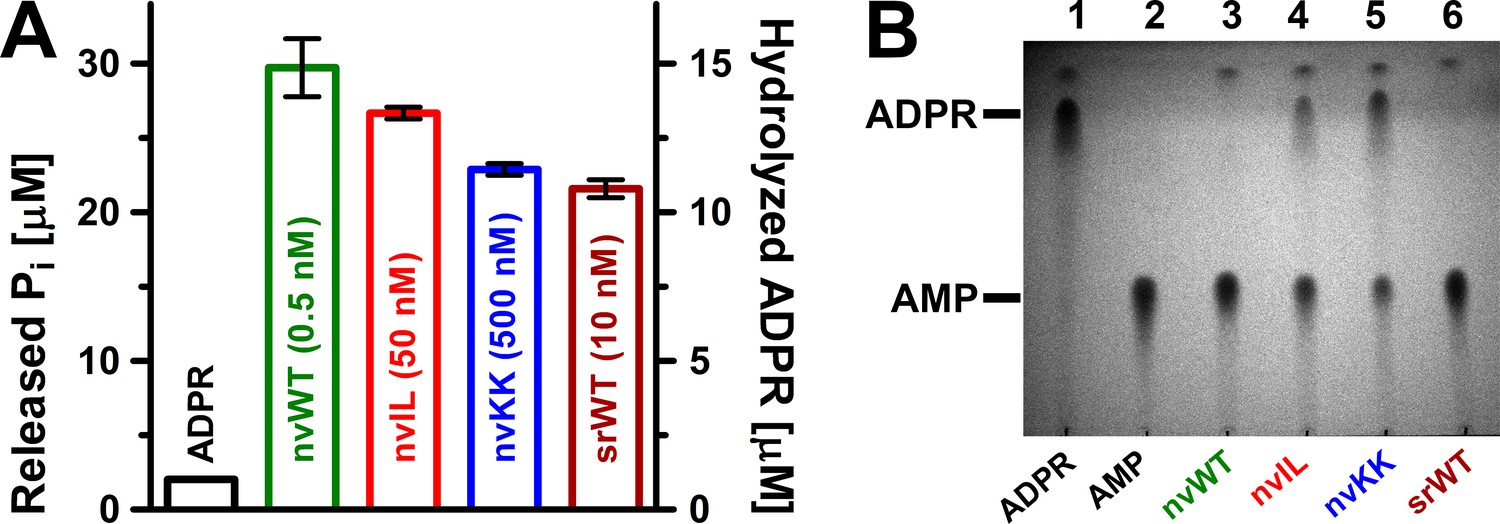
Sensitivity of the ADPRase assay allows reliable detection of enzymatic activity for mutant nvNUDT9-H and srNUDT9-H proteins.
(A) Detected release of Pi (in μM) by 0.5 nM nvNUDT9-H (nvWT, green), 50 nM nvNUDT9-H E1443I/F1444L (nvIL, red), 500 nM nvNUDT9-H E1446K/E1447K (nvKK, blue), or 10 nM srNUDT9-H (srWT, brown) in the presence of 100 μM ADPR, after 10 min incubation at room temperature in 50 mM Tris (pH 8.5) supplemented with 16 mM Mg2+ and ~2.5 U alkaline phosphatase. The Pi released from spontaneous degradation of ADPR under the same reaction conditions is shown for comparison (black). Data are shown as mean ±SEM of 3 experiments. Note, 2 mol Pi is released/mol hydrolyzed ADPR. (B) Thin-layer chromatography visualizing the conversion of 10 mM ADPR into one of the reaction products (AMP) by 0.1 μM nvWT (green, lane 3), 3 μM nvIL (red, lane 4), 40 μM nvKK (blue, lane 5), or 1 μM srWT (brown, lane 6) after 1 hr incubation at room temperature in 50 mM Tris (pH 8.5) supplemented with 16 mM Mg2+. 10 mM ADPR (lane 1) and 10 mM AMP (lane 2), incubated for 1 hr at room temperature in 50 mM Tris (pH 8.5)+16 mM Mg2+, serve as nucleotide position controls. The spontaneous degradation of ADPR is barely visible due to the limited sensitivity of the TLC detection (lane 1).
Figure 7 with 1 supplement

Mg2+removal and Nudix box mutations little affect steady-state single-channel gating kinetics of nvTRPM2 channels.
(A–C) Steady-state channel currents from patches containing (A) twelve WT (B) seven E1443I/F1444L and (C) nine E1446K/E1447K nvTRPM2 channels, activated by exposure to 125 μM Ca2+ and 100 μM ADPR (bars) in the presence of 2 mM cytosolic Mg2+; channel number was estimated in each patch as the maximum number of simultaneously open channels (see Materials and methods). In (A), WT channels were reopened by a second application of ADPR in the absence of bath Mg2+ (orange bar: Mg2+ removal + addition of 100 μM CDTA). Narrow yellow boxes highlight segments of record shown to the left/right at expanded time/current scales; note well resolved gating transitions. Bandwidth, 200 Hz. (D–F) Open probabilities (D), mean burst (E) and interburst (F) durations obtained from multi-channel fits (see Figure 7—figure supplement 1), for WT nvTRPM2 with (green) or without (orange) Mg2+, and for E1443I/F1444L (red) and E1446K/E1447K (blue) nvTRPM2 with Mg2+. Data are shown as mean ± SEM from 6 to 12 patches. See also Figure 7—figure supplement 1.
-
Figure 7—source data 1
Mg2+removal and Nudix box mutations little affect steady-state single-channel gating kinetics of nvTRPM2 channels.
- https://doi.org/10.7554/eLife.44556.023
Figure 7—figure supplement 1
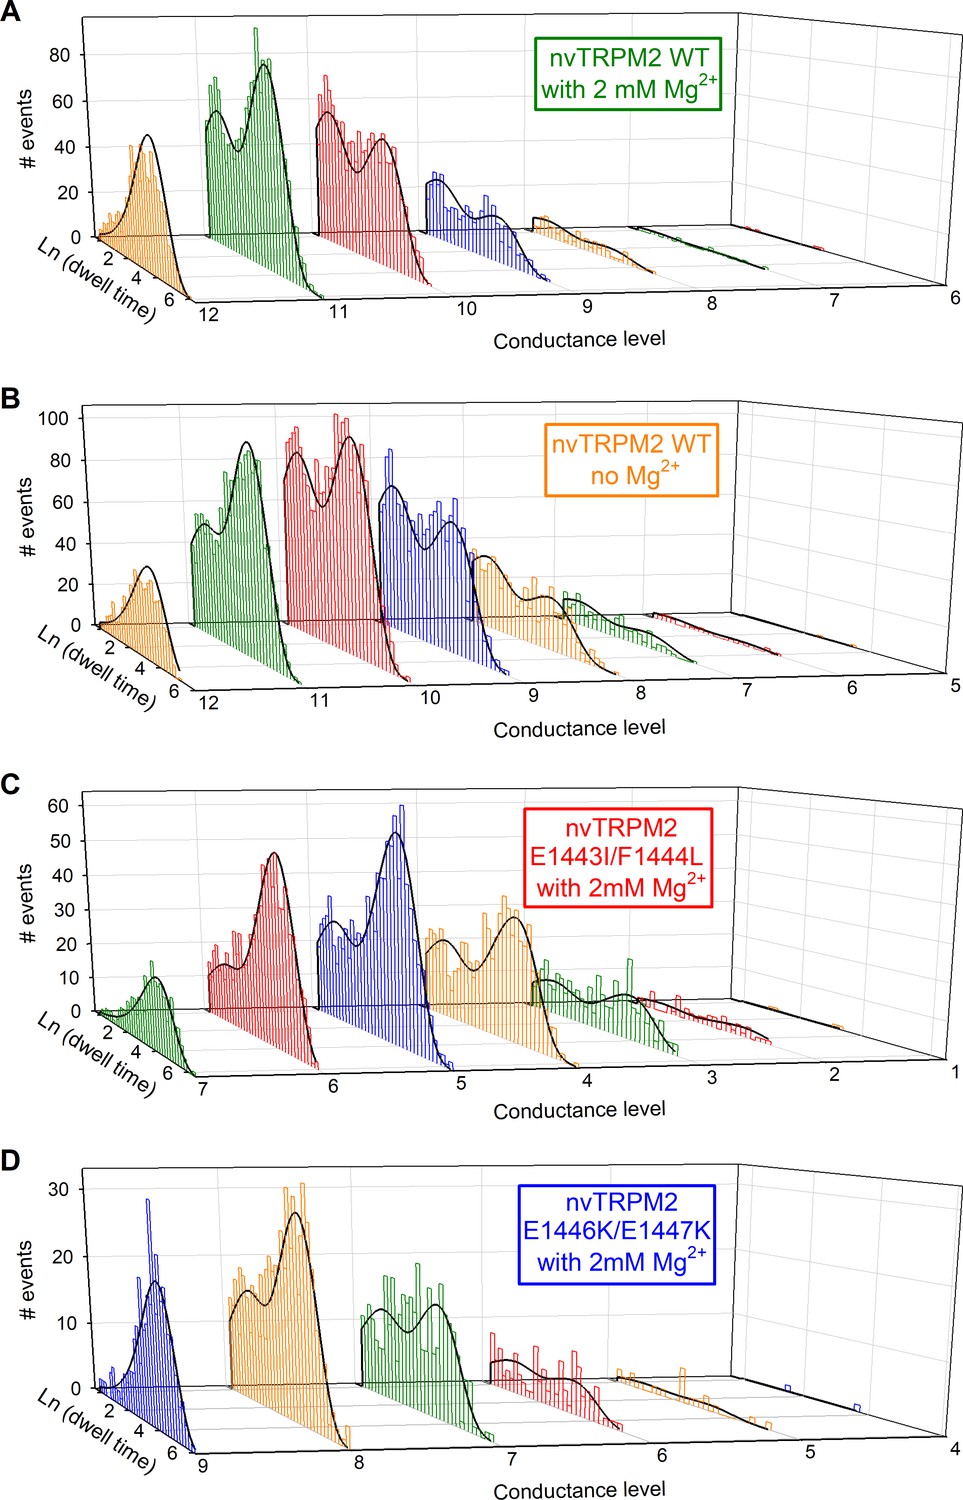
Kinetic analysis of multichannel patches by a simultaneous maximum likelihood fit to the dwell-time histograms of all conductance levels.
(A–D) Logarithmically binned dwell-time histograms (colored bar charts) of steady-state current segments in 125 μM Ca2+plus 100 μM ADPR for the recordings shown in Figure 7A–C, plotted individually for each conductance level (cf., dashed lines in Figure 7A–C), obtained by half-amplitude threshold crossing analysis using an imposed fixed dead time of 0.9 ms. The histogram sets in (A) (WT, +Mg2+), (B) (WT, −Mg2+), (C) (E1443I/F1444L), and (D) (E1446K/E1447K) contain 4560, 7061, 3505, and 1418 events, respectively, in total. Families of solid black curves illustrate the simultaneous maximum likelihood fits of the sets of dwell-time histograms by the Cslow(1)-O(3)-Cfast(2) scheme, accounting for the fixed dead time (Csanády, 2000), with the four rate constants r13, r31, r32, r23 as free parameters. Fitted rate constants were (A) r13 = 9.75 s−1, r31=0.880 s−1, r32=1.56 s−1, r23=633 s−1, (B) r13 = 6.94 s−1, r31=1.14 s−1, r32=2.28 s−1, r23=633 s−1, (C) r13 = 3.96 s−1, r31=1.29 s−1, r32=1.14 s−1, r23=504 s−1, and (D) r13 = 9.99 s−1, r31=1.02 s−1, r32=0.969 s−1, r23=463 s−1. Calculated bursting parameters (cf., Figure 7E–F) were (A) τb=1140 ms, τib=103 ms, (B) τb=881 ms, τib=144 ms, (C) τb=779 ms, τib=253 ms, and (D) τb=983 ms, τib=100 ms.
Figure 8

Pore structure and inactivation properties of invertebrate and vertebrate TRPM2 channels.
(A) Superposition of nvTRPM2 (salmon, PDBID: 6CO7) and hsTRPM2 (cyan, PDBID: 6MIX) pore structures, viewed from an angle parallel to (left, front and rear subunit removed), or perpendicular to (right, only pore helices, filters, and post-filter helices are shown), the membrane plane. Na+ ions in the nvTRPM2 structure are shown as magenta spheres, nvTRPM2 residues D1041, E1042, E1046, and E1050 (red), and hsTRPM2 residue P983 (blue) are shown as sticks. (B–E) Macroscopic currents of (B) srTRPM2, (C) nvTRPM2, (D) drTRPM2, and (E) hsTRPM2 channels activated by prolonged exposure to 100 μM ADPR (purple bars) plus 125 μM Ca2+ (black bars). In (B–D) Ca2+ or ADPR was briefly removed every ~5 min to verify seal integrity. Blue and red lines in (D–E) are fitted exponentials with time constants (in s) indicated.
-
Figure 8—source data 1
Pore structure and inactivation properties of invertebrate and vertebrate TRPM2 channels.
- https://doi.org/10.7554/eLife.44556.025
Tables
Key resources table
| Reagent type (species) or resource | Designation | Source or reference | Identifiers | Additional information |
|---|---|---|---|---|
| Gene (Salpingoeca rosetta TRPM2) | srTRPM2, srNUDT9-H | General Biosystems, Inc. | NCBI: XP_004993318 | species-optimized synthetic genes |
| Gene (Nematostella vectensis TRPM2) | nvTRPM2, nvNUDT9-H | General Biosystems, Inc. | NCBI: XP_001622235 | species-optimized synthetic genes |
| Strain, strain background (Escherichia coli BL21 (DE3)) | E.coli BL21 (DE3) | New England BioLabs | C2527H | |
| Cell line (Spodoptera frugiperda) | Sf9 | ATCC | CRL-1711 | authenticated and mycoplasma free by vendor |
| Cell line (Homo sapiens) | HEK293S GnTI- | ATCC | CRL-3022 | authenticated and mycoplasma free by vendor |
| Biological sample (Xenopus laevis) | Xenopus laevis oocytes | African Reptile Park | RRID:NXR_0.0080 | mandyvorster@xsinet.co.za |
| Commercial assay or kit | HiSpeed Plasmid Midi Kit | Qiagen | 12643 | |
| Commercial assay or kit | QuickChange II Mutagenesis Kit | Agilent Technologies | 200524–5 | |
| Commercial assay or kit | mMESSAGE mMACHINE T7 Transcription Kit | ThermoFisher | AM1344 | |
| Commercial assay or kit | NHS Activated Sepharose 4 Fast Flow | GE Healthcare | 17-0906-01 | |
| Commercial assay or kit | Superose 6 Increase 10/300 GL | GE Healthcare | 29-0915-96 | |
| Commercial assay or kit | Strep-Tactin MacroPrep cartridge | IBA GmbH | 2-1538-001 | |
| Chemical compound, drug | Avidin | IBA GmbH | 2-0204-015 | |
| Chemical compound, drug | D-Desthiobiotin | IBA GmbH | 2-1000-002 | |
| Chemical compound, drug | Adenosine 5′-diphosphoribose sodium (ADPR) | Sigma-Aldrich | A0752 | |
| Chemical compound, drug | 2,2-didecylpropane-1,3-bis-b-D-maltopyranoside (LMNG) | Anatrace | NG310 | |
| Chemical compound, drug | Cholesteryl hemisuccinate (CHS) | Anatrace | CH210 | |
| Chemical compound, drug | Digitonin | Sigma-Aldrich | D141 | |
| Chemical compound, drug | DMEM:F12, 1:1 Mixture with3.151 g/L glucose, HEPES, andL-glutamine | LONZA | 12–719F | |
| Chemical compound, drug | Fetal Bovine Serum (South America Origin), EU approved | LONZA | ECS0180L | Heat inactivated at 56°C for 30 min. |
| Chemical compound, drug | sf-900 II SFM medium | Gibco | 10902088 | |
| Chemical compound, drug | Freestyle 293 medium | Gibco | 12338018 | |
| Chemical compound, drug | Cellfectin II | Invitrogen | 10362100 | |
| Chemical compound, drug | Antibiotic-Antimycotic (100X) | Gibco | 15240062 | |
| Chemical compound, drug | Isopropyl β- D −1-thiogalactopyranoside (IPTG) | Invitrogen | 15529019 | |
| Chemical compound, drug | Bluo-GAL | Invitrogen | 15519028 | |
| Chemical compound, drug | Tetracycline | Sigma- Aldrich | T7660 | |
| Chemical compound, drug | Kanamycin | Sigma- Aldrich | K1377 | |
| Chemical compound, drug | Chloramphenicol | Sigma-Aldrich | C0378 | |
| Chemical compound, drug | Gentamicin | Sigma-Aldrich | G1397 | |
| Chemical compound, drug | Collagenase type II | Gibco | 17107–0125 | |
| Chemical compound, drug | PreScission Protease | GE Healthcare | 27084301 | |
| Software, algorithm | Pclamp9 | Molecular Devices | RRID: SCR_011323 | |
| Software, algorithm | Pymol | PyMOL | http://www.pymol.org |
Additional files
-
Transparent reporting form
- https://doi.org/10.7554/eLife.44556.026
Download links
A two-part list of links to download the article, or parts of the article, in various formats.
Downloads (link to download the article as PDF)
Open citations (links to open the citations from this article in various online reference manager services)
Cite this article (links to download the citations from this article in formats compatible with various reference manager tools)
Enzyme activity and selectivity filter stability of ancient TRPM2 channels were simultaneously lost in early vertebrates
eLife 8:e44556.
https://doi.org/10.7554/eLife.44556


