Decoys provide a scalable platform for the identification of plant E3 ubiquitin ligases that regulate circadian function
- Yale University, United States
- South China University of Technology, China
Figures
Figure 1
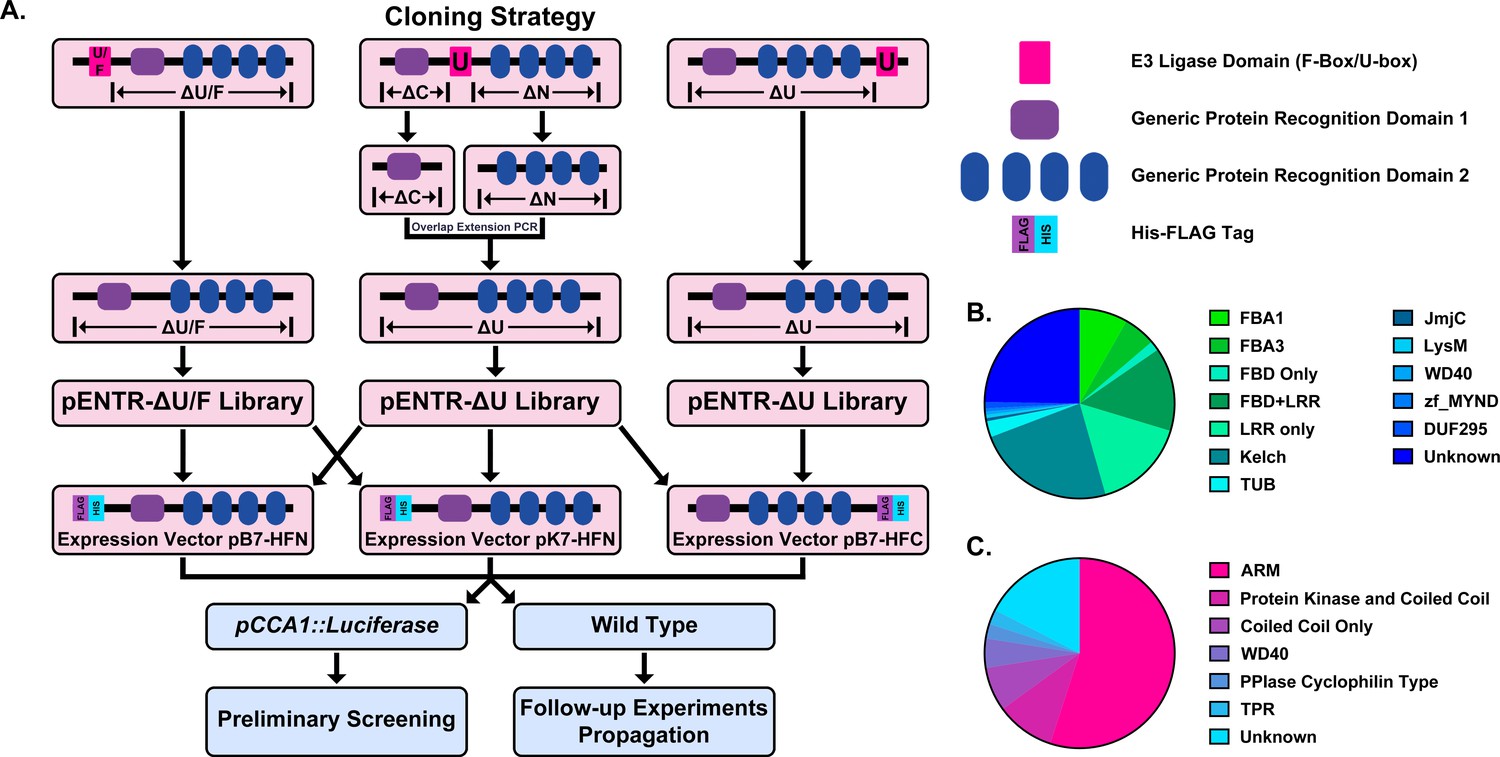
Construction of the Arabidopsis Decoy Library.
(A) Cloning and experimental workflow of the F-box and U-box decoy library. F-box decoys follow the same path as the N-terminal U-box decoys. (B) Distribution of protein recognition domains in the F-box decoy library (C) Distribution of protein recognition domains in the U-box decoy library.
Figure 2 with 1 supplement
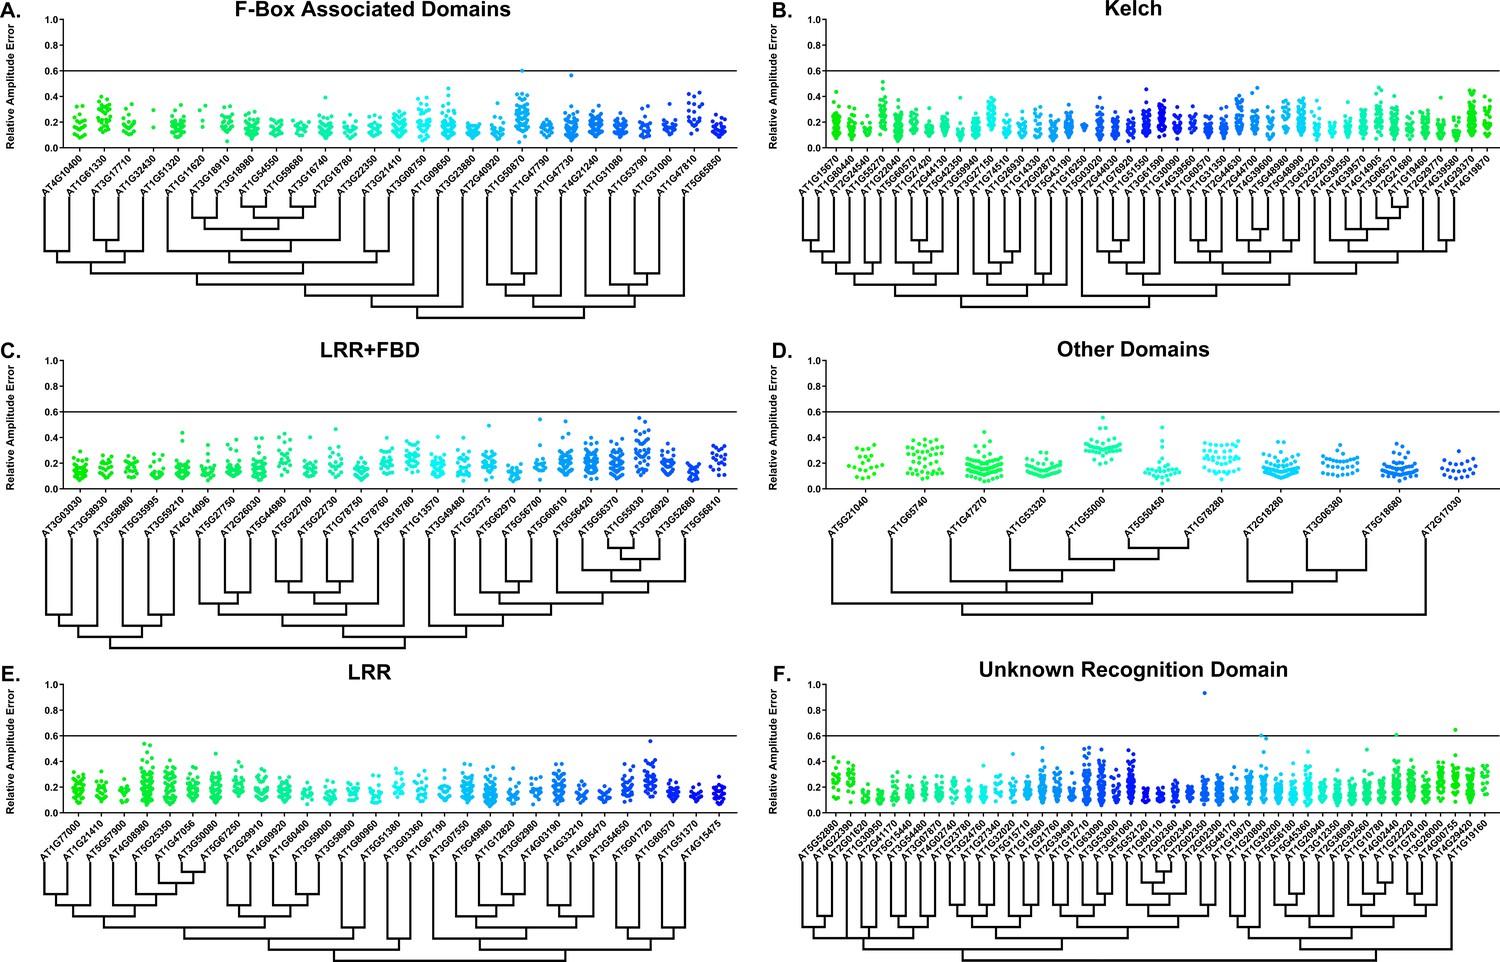
RAE distributions of F-box decoy plants.
Values presented are the RAE for each individual T1 seedling. The black line represents the standard RAE cutoff of 0.6. Genes are separated by protein recognition domain and ordered by closest protein homology using Phylogeny.Fr, (Dereeper et al., 2008), and a tree showing that homology is displayed beneath the graph. F-Box Associated Domains = FBA1, FBA3, and FBD only. Other Domains = TUB, JmjC, LysM, WD40, zf_MYND, and DUF295. Only data from those experiments where the control CCA1p::Luciferase plants display a standard deviation less than 0.75 were included in our analyses.
Figure 2—figure supplement 1
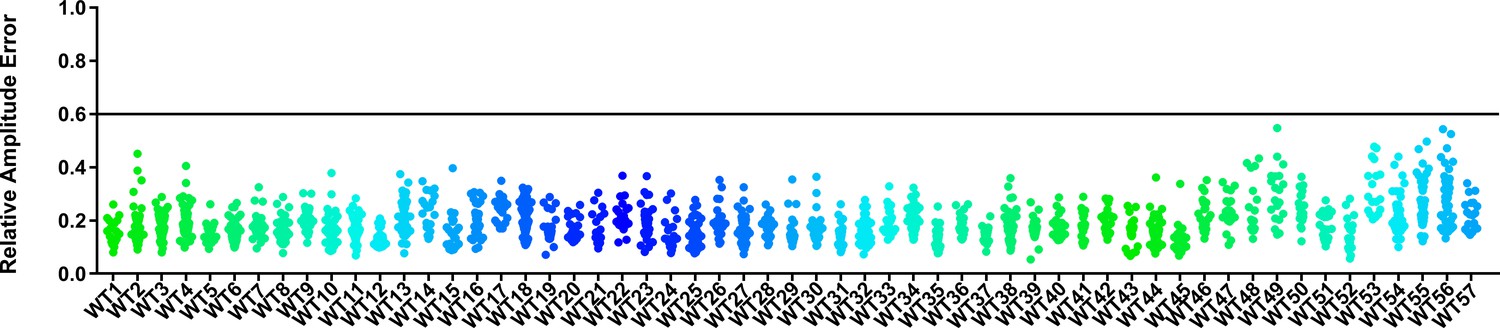
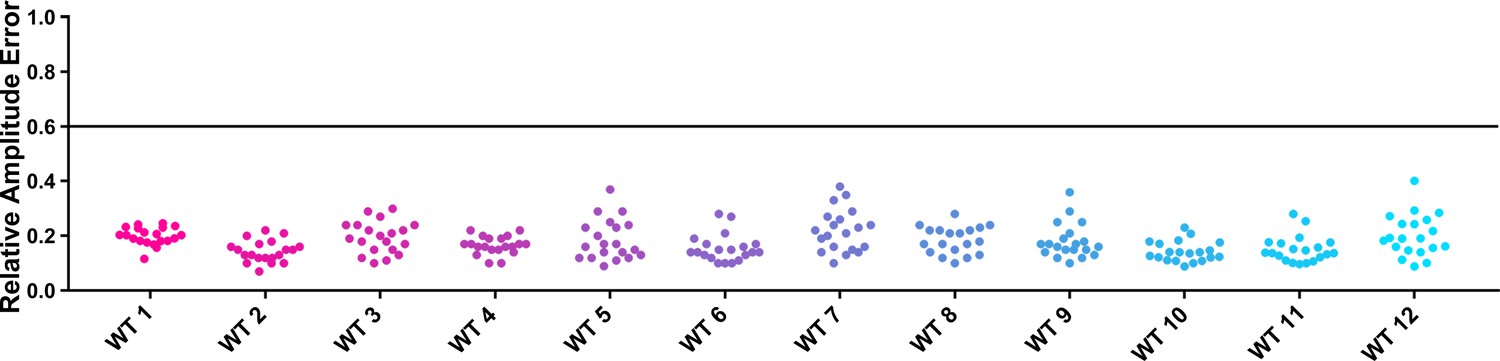
RAE distributions of control plants in F-box experiments.
Values presented are the RAE of each individual control plant. The black line represents the standard RAE cutoff of 0.6. Only data from those experiments where the control CCA1p::Luciferase plants display a standard deviation less than 0.75 were included in our analyses.
Figure 3 with 1 supplement
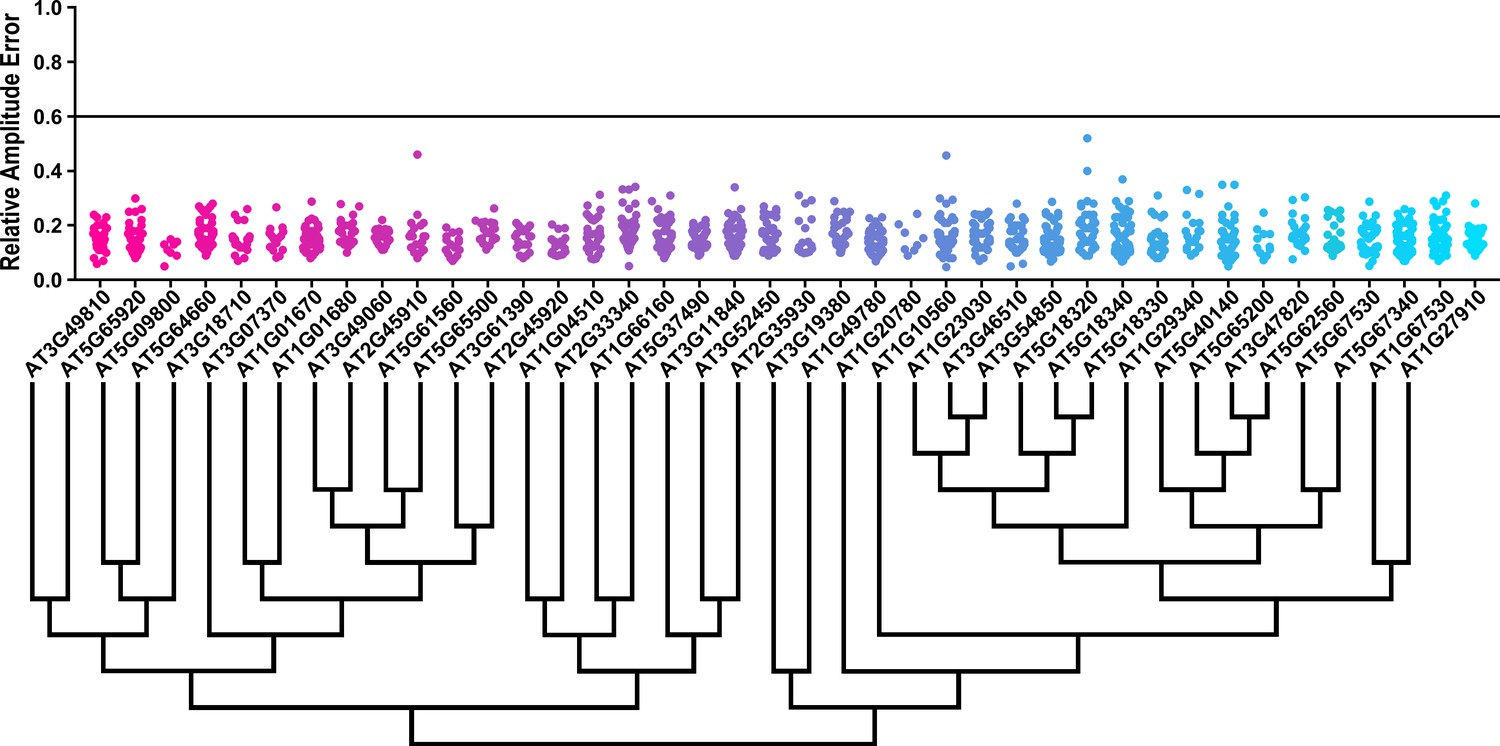
RAE distributions of U-box decoy plants.
Values presented are the RAE for each individual T1 seedling. The black line represents the standard RAE cutoff of 0.6. Genes are ordered by closest protein homology using Phylogeny.Fr, (Dereeper et al., 2008), and a tree showing that homology is displayed beneath the graph.
Figure 3—figure supplement 1
RAE distributions of control plants in U-box experiments.
Values presented are the RAE of each individual control plant. The black line represents the standard RAE cutoff of 0.6.
Figure 4 with 1 supplement
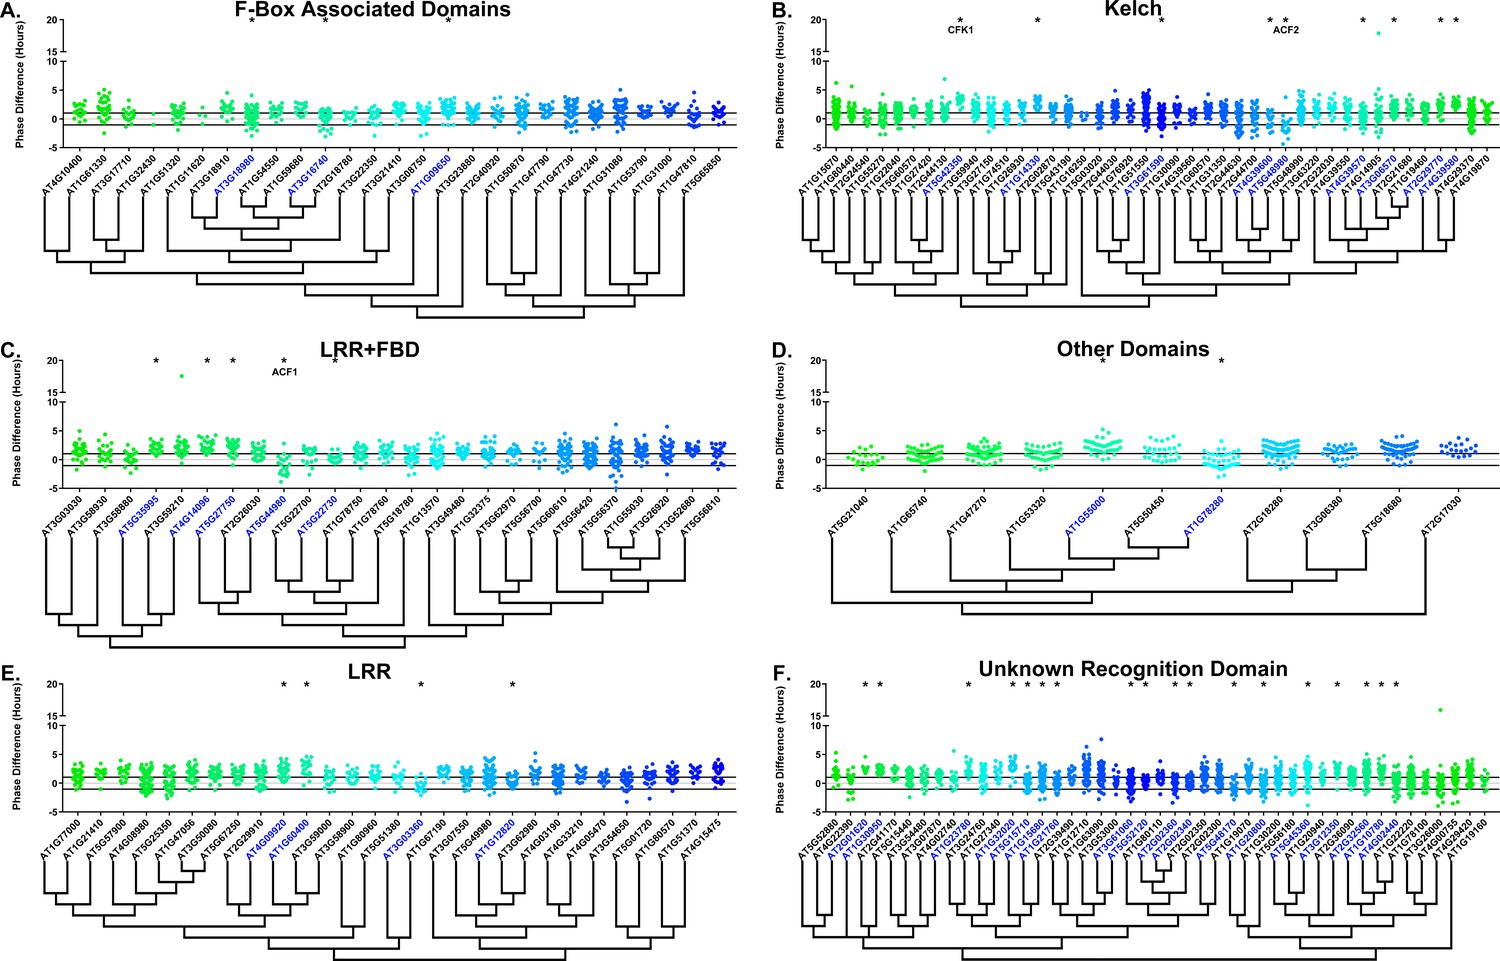
Phase distributions of F-box decoy plants.
Values presented are the difference between the period of the individual decoy plant and the average period of the CCA1p::Luciferase control in the accompanying experiment. The grey line is at the average control value and the black lines are at ±the standard deviation of the control plants. Genes are separated by protein recognition domain and ordered by closest protein homology using Phylogeny.Fr, (Dereeper et al., 2008), and a tree showing that homology is displayed beneath the graph. F-Box Associated Domains = FBA1, FBA3, and FBD only. Other Domains = TUB, JmjC, LysM, WD40, zf_MYND, and DUF295. * and blue gene names = The entire population differs from wildtype with a Bonferroni-corrected p<1.94×10⁻⁴. Only data from those experiments where the control pCCA1::Luciferase plants display a standard deviation less than 0.75 were included in our analyses.
Figure 4—figure supplement 1
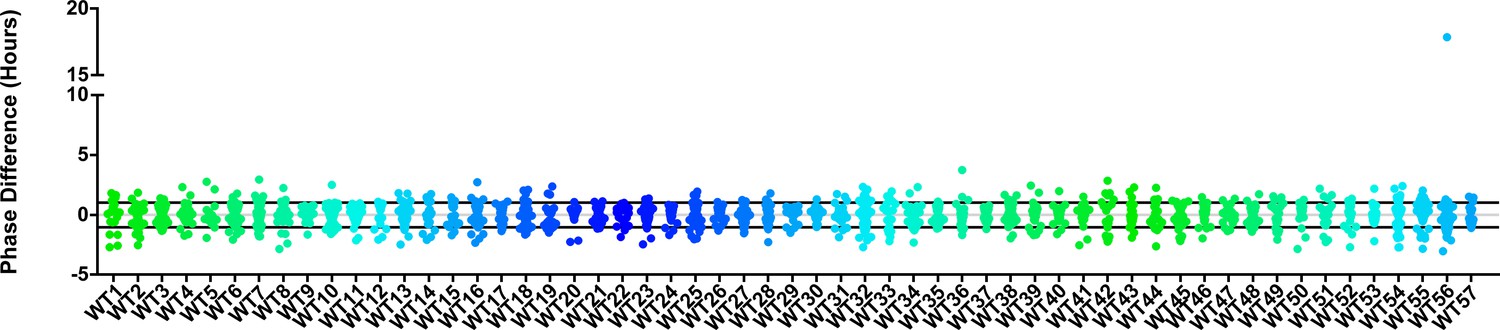
Phase distributions of control plants in F-box experiments.
Values presented are the difference between the phase of the individual control plant and the average phase of the CCA1p::Luciferase control in the accompanying experiment. The grey line is at the average control value and the black lines are at ± the standard deviation of the control plants. Only data from those experiments where the control CCA1p::Luciferase plants display a standard deviation less than 0.75 were included in our analyses.
Figure 5 with 1 supplement
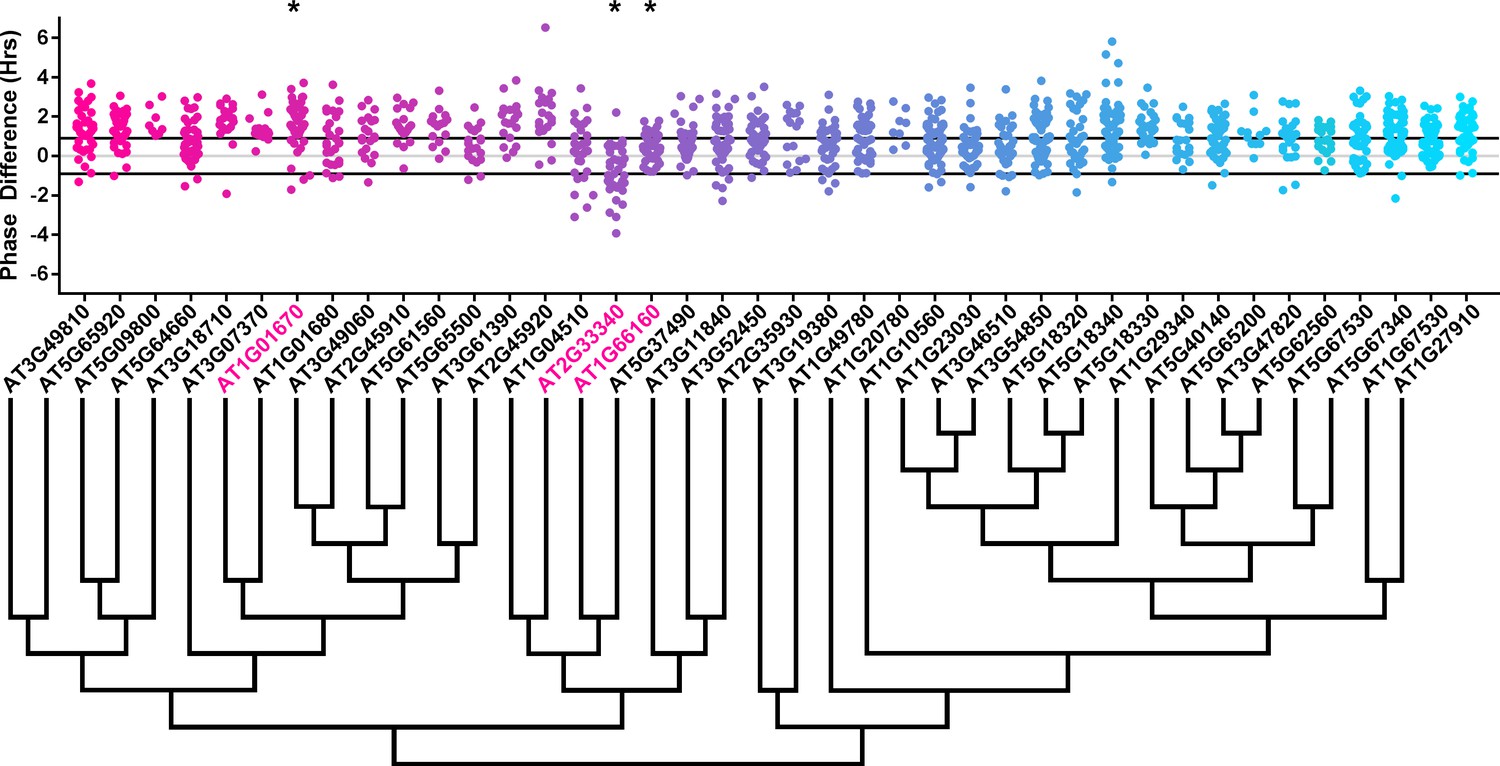
Phase distributions of U-box decoy plants.
Values presented are the difference between the period of the individual decoy plant and the average period of the CCA1p::Luciferase control in the accompanying experiment. The grey line is at the average control value and the black lines are at ±the standard deviation of the control plants. Genes are ordered by closest protein homology using Phylogeny.Fr, (Dereeper et al., 2008), and a tree showing that homology is displayed beneath the graph. * and pink gene names = The entire population differs from wildtype with a Bonferroni-corrected p<1.00×10⁻³.
Figure 5—figure supplement 1

Phase distributions of control plants in U-box experiments.
Values presented are the difference between the phase of the individual control plant and the average phase of the CCA1p::Luciferase control in the accompanying experiment. The grey line is at the average control value and the black lines are at ± the standard deviation of the control plants.
Figure 6 with 1 supplement
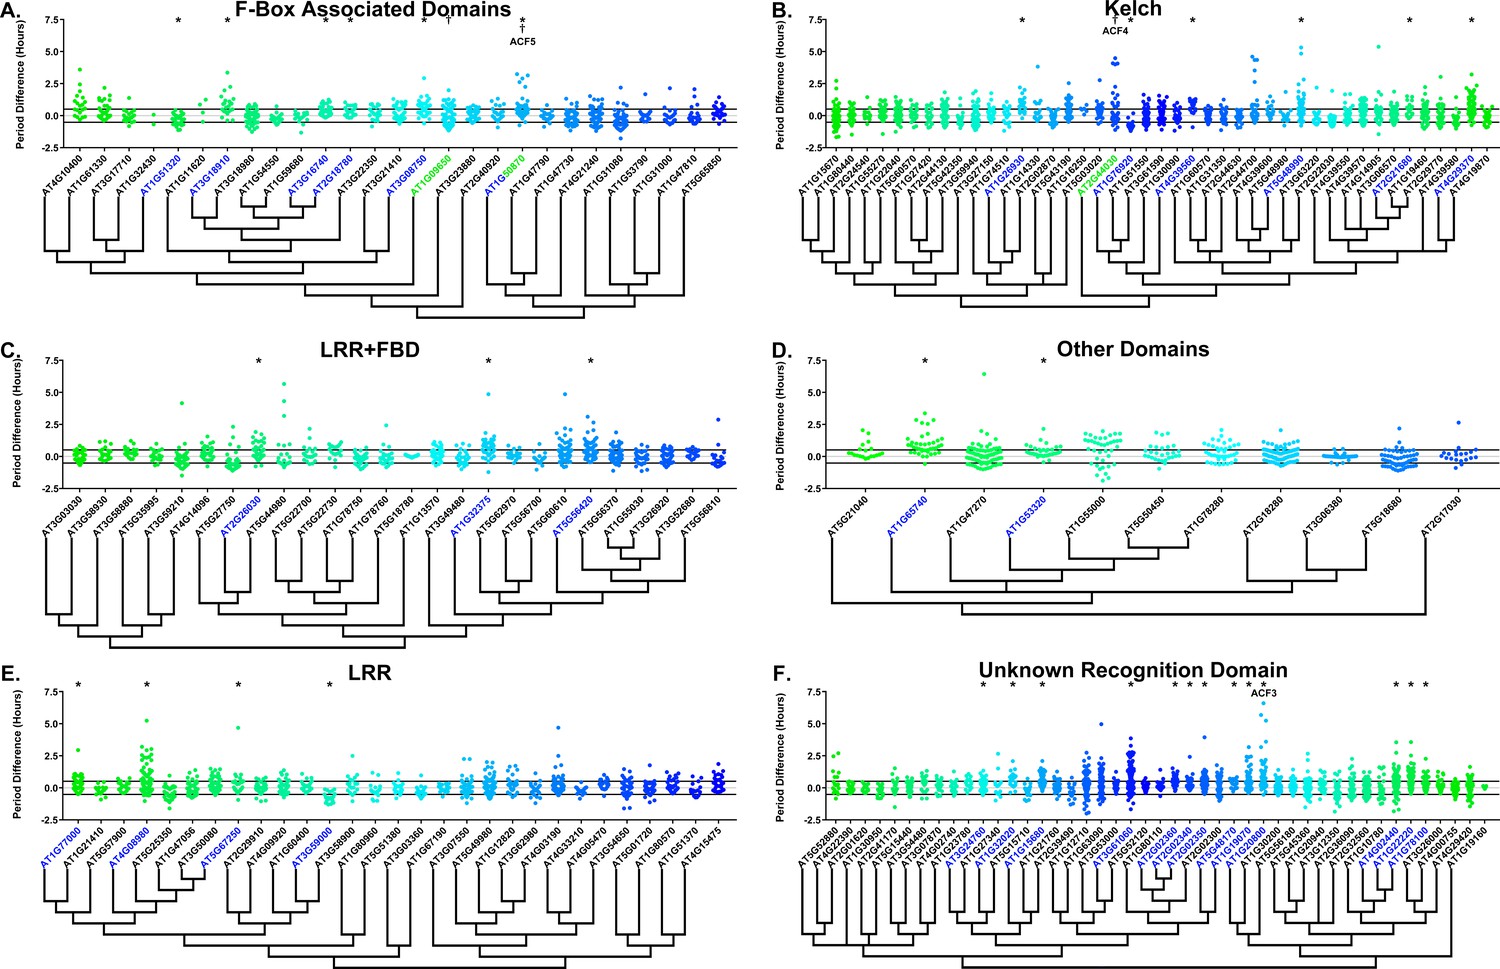
Period distributions of F-box decoy plants.
Values presented are the difference between the period of the individual decoy plant and the average period of the CCA1p::Luciferase control in the accompanying experiment. The grey line is at the average control value and the black lines are at ±the standard deviation of the control plants. Genes are separated by protein recognition domain and ordered by closest protein homology using Phylogeny.Fr, (Dereeper et al., 2008), and a tree showing that homology is displayed beneath the graph. F-Box Associated Domains = FBA1, FBA3, and FBD only. Other Domains = TUB, JmjC, LysM, WD40, zf_MYND, and DUF295. * and blue gene names = The entire population differs from wildtype with a Bonferroni-corrected p<2.55×10⁻⁴; † and green gene names = A subset of the population differs from wildtype with a Bonferroni-corrected p<2.55×10⁻⁴. Only data from those experiments where the control CCA1p::Luciferase plants display a standard deviation less than 0.75 were included in our analyses.
Figure 6—figure supplement 1
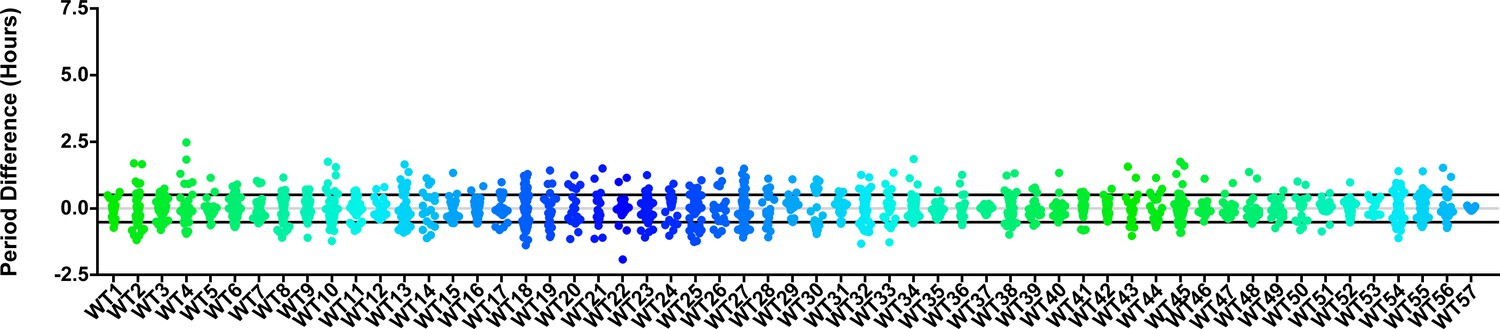
Period distributions of control plants in F-box experiments.
Values presented are the difference between the period of the individual control plant and the average period of the CCA1p::Luciferase control in the accompanying experiment. The grey line is at the average control value and the black lines are at ± the standard deviation of the control plants. Only data from those experiments where the control CCA1p::Luciferase plants display a standard deviation less than 0.75 were included in our analyses.
Figure 7
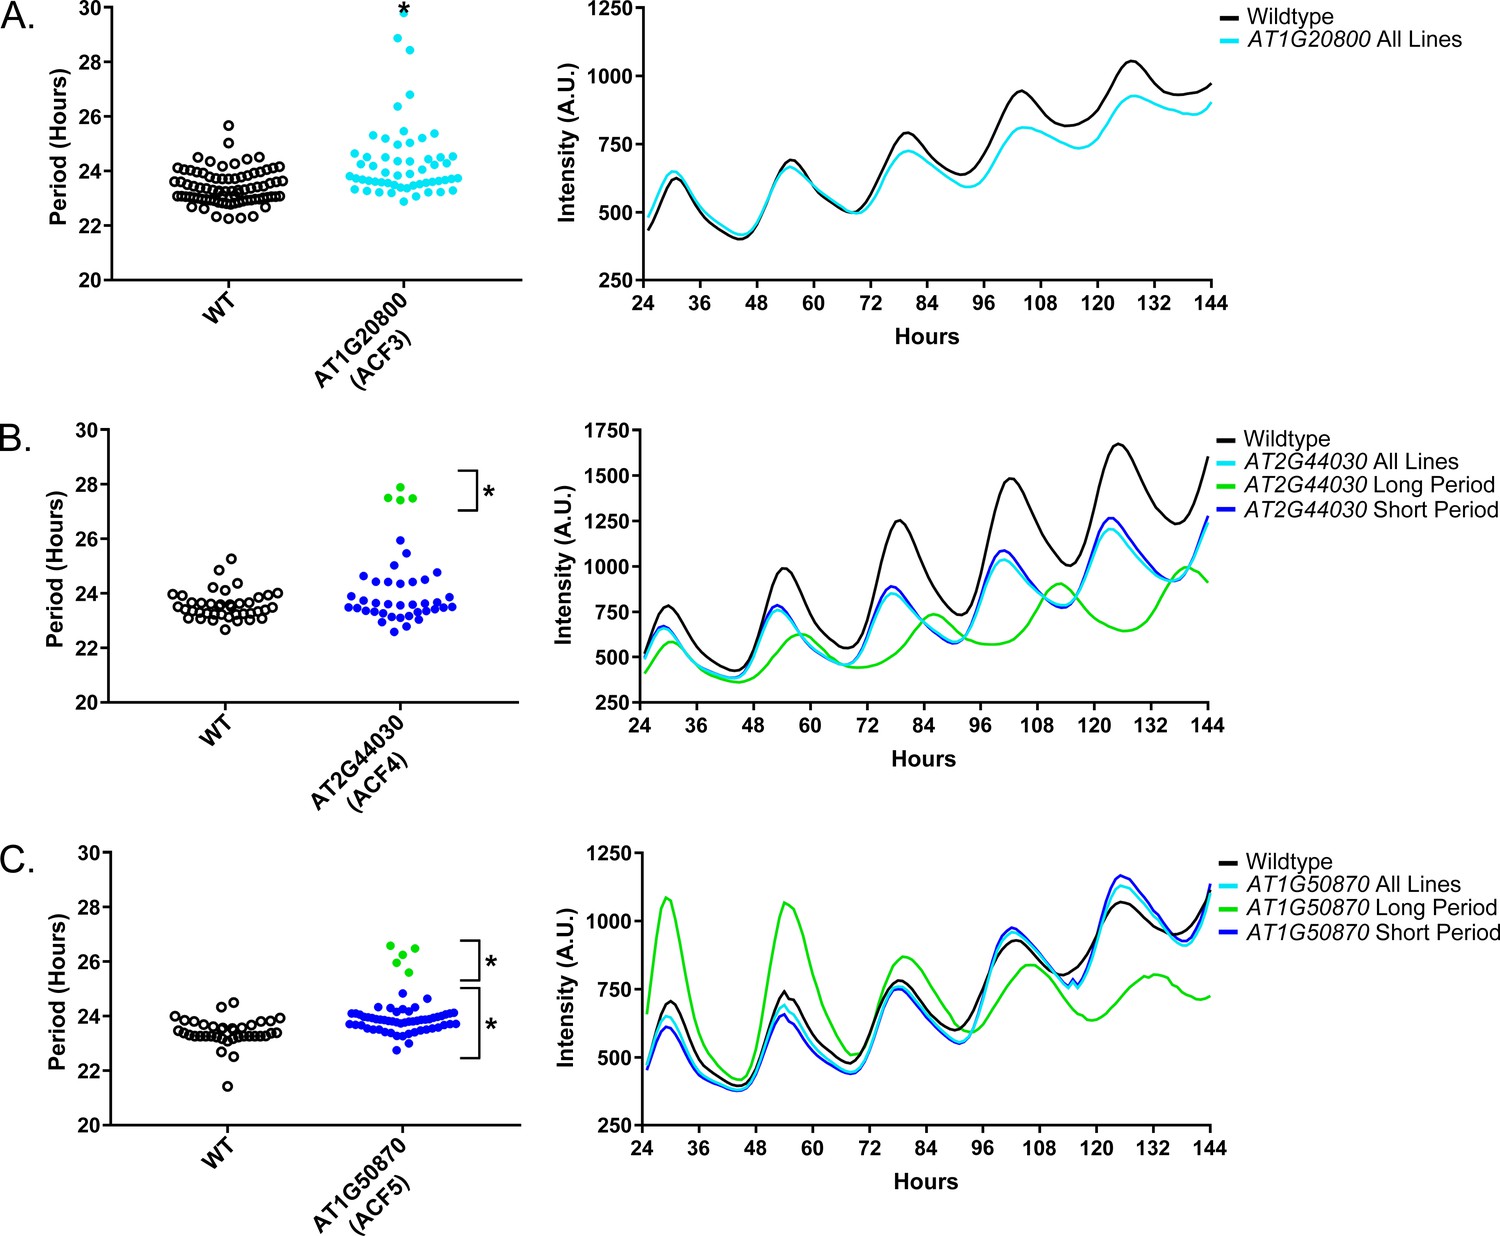
Circadian Phenotypes for selected high-priority F-box decoy populations.
Period values and average traces for decoy plants with significant differences from the control across the entire population or a sub-population of plants greater than 1. Period values presented are raw period lengths as determined by CCA1p::Luciferase, and traces are calculated from the average image intensity across each seedling at each hour throughout the duration of the imaging experiment. Time 0 is defined as the dawn of the release into LL. A) AT1G20800 (ACF3) decoy. B) AT2G44030 (ACF4) decoy. C) AT1G50870 (ACF5) decoy. Brackets define individual groups used for statistical testing against the wildtype control using a Welch’s t-test with a Bonferroni-corrected α of 2.55 × 10⁻⁴. * represents p<α. When multiple subpopulations were detected, the members of each group were separately averaged and presented in the traces along with the average of all plants.
Figure 8 with 1 supplement
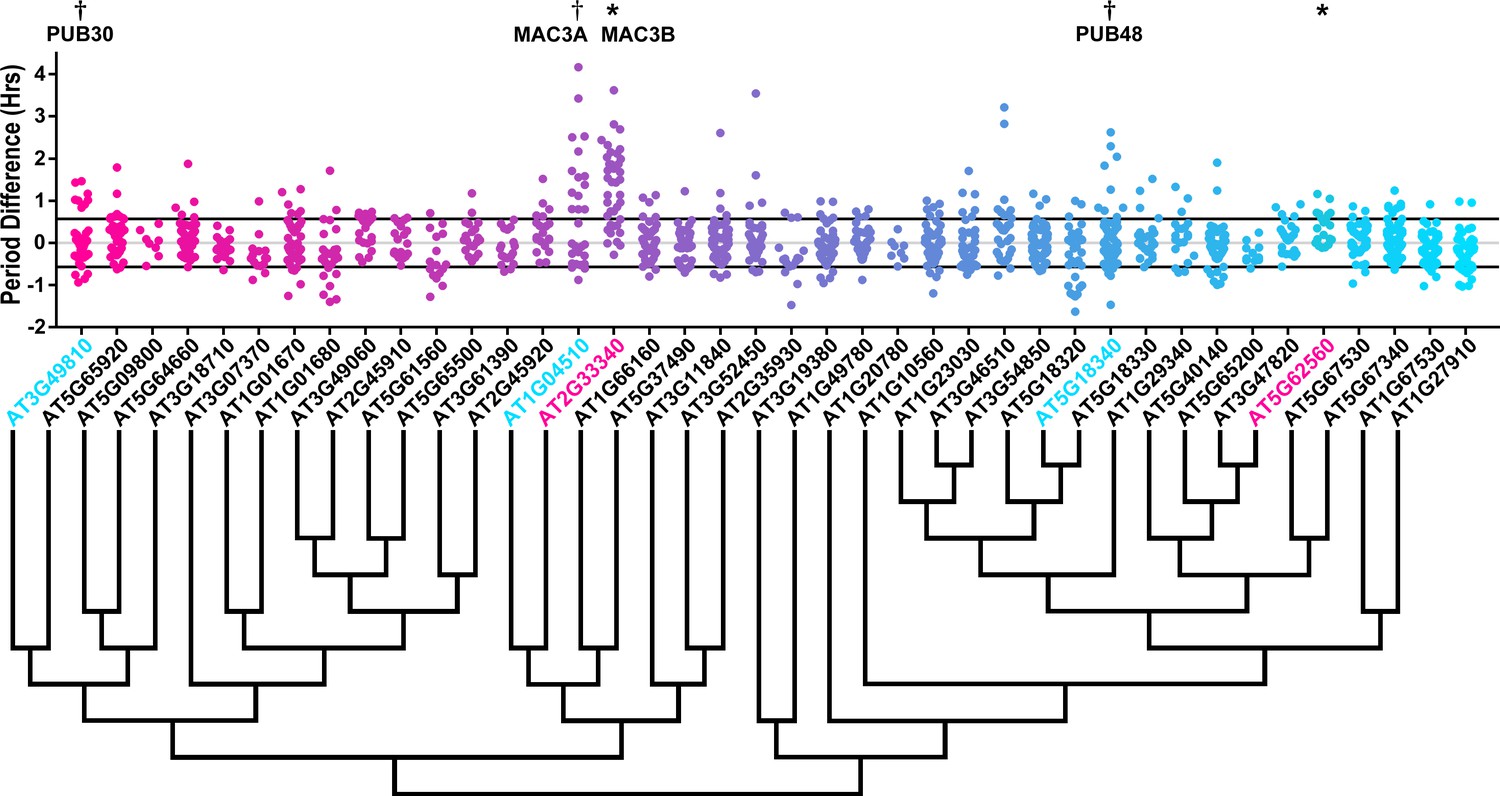
Period distributions of U-box decoy plants.
Values presented are the difference between the period of the individual decoy plant and the average period of the CCA1p::Luciferase control in the accompanying experiment. The grey line is at the average control value and the black lines are at ±the standard deviation of the control plants. Genes are ordered by closest protein homology using Phylogeny.Fr, (Dereeper et al., 2008), and a tree showing that homology is displayed beneath the graph. * and pink gene names = The entire population differs from wildtype with a Bonferroni-corrected p<1.09×10⁻³; † and cyan gene names = A subset of the population differs from wildtype with a Bonferroni-corrected p<1.09×10⁻³.
Figure 8—figure supplement 1

Period distributions of control plants in U-box experiments.
Values presented are the difference between the period of the individual control plant and the average period of the CCA1p::Luciferase control in the accompanying experiment. The grey line is at the average control value and the black lines are at ±the standard deviation of the control plants.
Figure 9
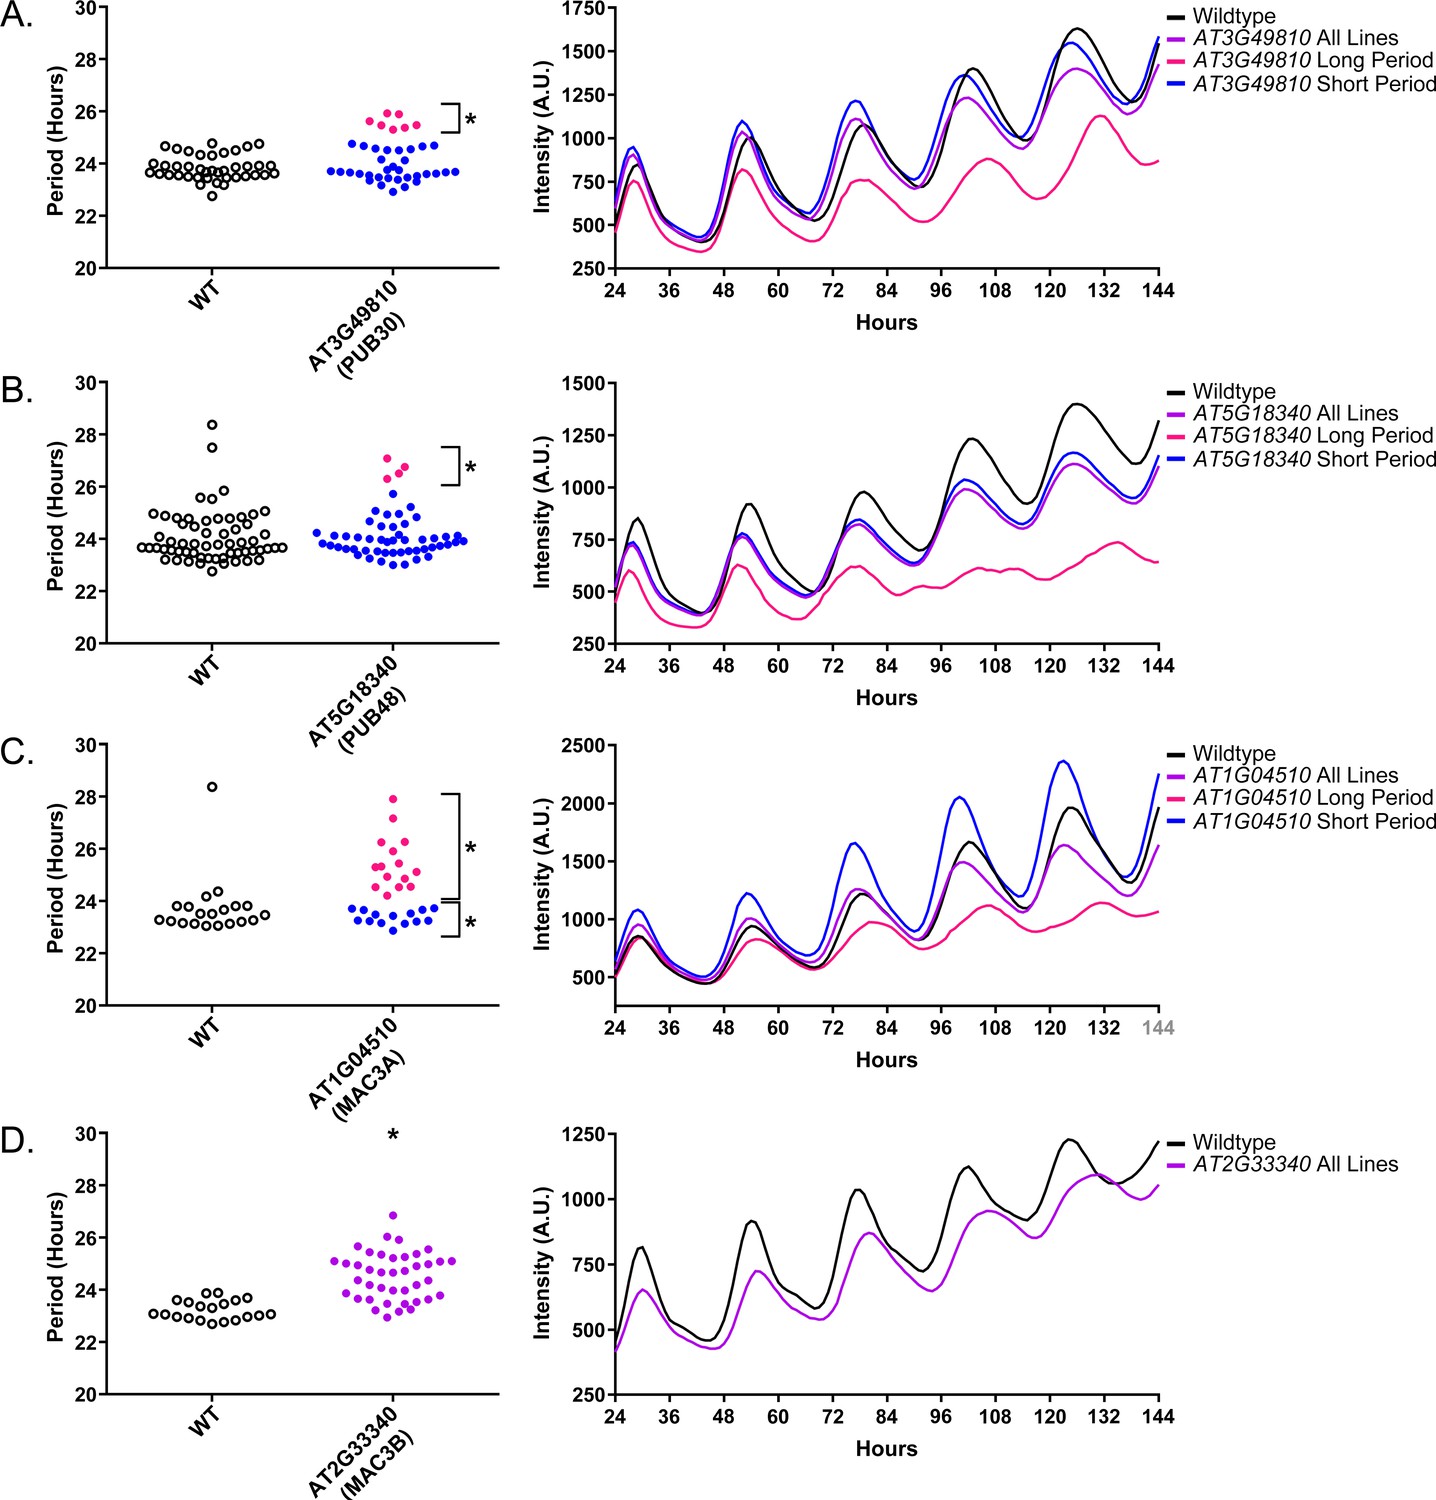
Circadian Phenotypes for selected high-priority U-box decoy populations.
Period values and average traces for decoy plants with significant differences from the control across the entire population or a sub-population of plants greater than 1. Period values presented are raw period lengths as determined by CCA1p::Luciferase, and traces are calculated from the average image intensity across each seedling at each hour throughout the duration of the imaging experiment. Time 0 is defined as the dawn of the release into LL. (A) AT3G49810 (PUB30) decoy. (B) AT5G18340 (PUB48) decoy. (C) AT104510 (MAC3A) decoy. D) AT2G33340 (MAC3B) decoy. Brackets define individual groups used for statistical testing against the wildtype control using a Welch’s t-test with a Bonferroni-corrected α of 1.09 × 10⁻³. * represents p<α. When multiple subpopulations were detected, the members of each group were separately averaged and presented in the traces along with the average of all plants.
Figure 10

qRT-PCR of clock gene expression in mac3a/mac3b mutants.
(A,C,E) CCA1 and (B,D,F)TOC1 expression was measured using quantitative RT-PCR in wildtype or homozygous (A-B) mac3a, (C-D) mac3b, and (E-F) mac3a/mac3b mutants under constant light conditions. Quantifications are the average of three biological replicates with error bars showing standard deviation. (G) FFT-NLLS analysis through the Biodare2 analysis platform shows altered phasing in the mac3a/mac3b double mutant. Error bars represent the standard deviation. * represents p<a Bonferroni-corrected alpha of 1.67 × 10⁻².
Figure 11

qRT-PCR of PRR9 splicing in mac3a/mac3b mutants.
PRR9 isoform expression was measured using quantitative RT-PCR in mac3a/mac3b mutants. (A) PRR9a, (B) PRR9b, and (C) PRR9c isoforms were analyzed. Quantifications are the average of three biological replicates with error bars showing standard deviation. (D) FFT-NLLS analysis through the Biodare2 platform suggests altered isoform amplitude in the mac3a/mac3b double mutant. Error bars represent the standard deviation.
Figure 12
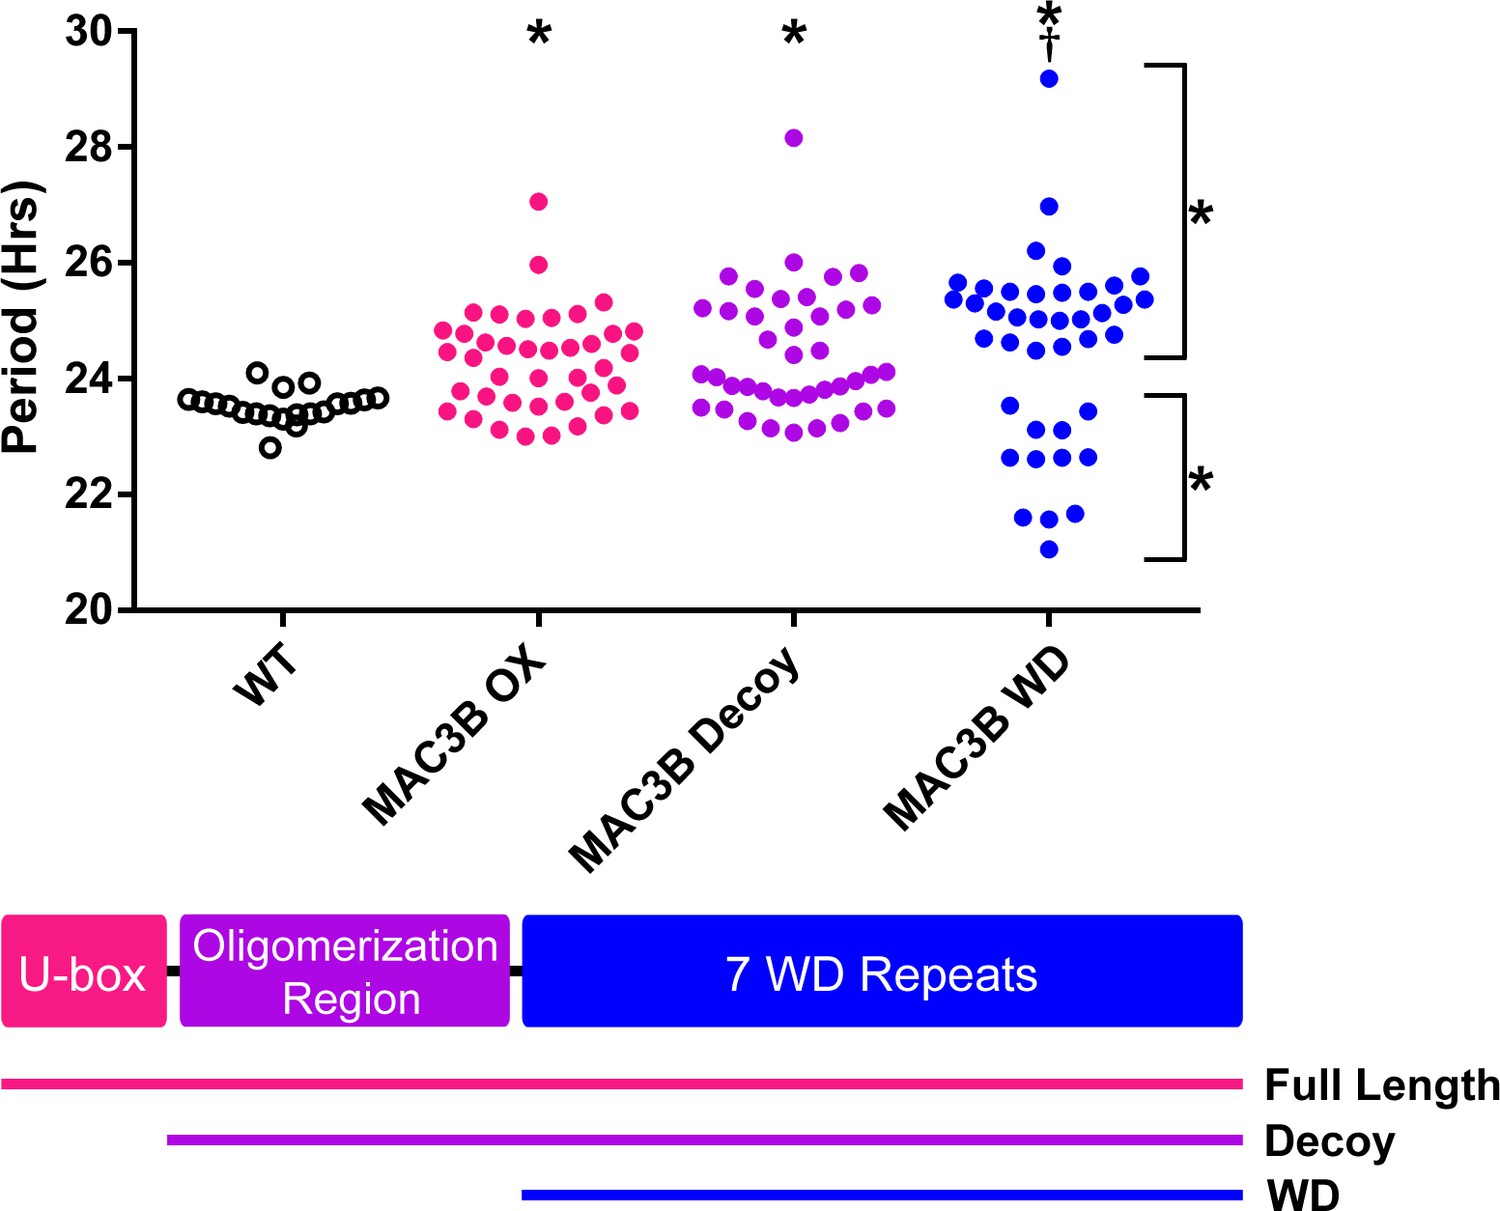
Period analyses of MAC3B overexpression constructs.
Period was measured in T1 MAC3B full length, MAC3B decoy, and MAC3B WD insertion plants. Period values presented are raw period values measured by CCA1p::Luciferase expression. A schematic of which domains are in each construct is included below.
Tables
Table 1
Publically available data for strong candidate F-box phase regulators.
Circadian expression data is from the Diurnal Project gene expression tool (Mockler et al., 2007). Tissue specific expression is from the Arabidopsis eFP browser (Klepikova et al., 2016; Winter et al., 2007). The closest homolog was determined by WU-BLAST2 using BLASTP and the Araport11 protein sequences database. N/A indicates that data is not available.
| Locus ID | Gene name | Circadian expression | Tissue specific expression | Closest homolog | Publications (PMID) | |||||||||
|---|---|---|---|---|---|---|---|---|---|---|---|---|---|---|
| LDHC | LL_LDHC | LL12_LDHH | LL23_LDHH | |||||||||||
| Phase | Correlation | Phase | Correlation | Phase | Correlation | Phase | Correlation | Developmental map (eFP) | Klepikova atlas | Locus | E-Value | |||
| AT5G44980 | ACF1 | 16 | 0.50 | 23 | 0.38 | 14 | 0.69 | 4 | 0.43 | Global, especially senescent leaf | Global, stamen | AT5G44960 | 1.60 × 10−146 | N/A |
| AT5G48980 | ACF2 | N/A | N/A | N/A | N/A | N/A | N/A | N/A | N/A | N/A | Silique with seed, seed | AT5G48990 | 1.10 × 10−124 | N/A |
| AT5G42350 | CFK1 | N/A | N/A | N/A | N/A | N/A | N/A | N/A | N/A | Global, especially pollen | Global | AT5G42360 | 3.60 × 10−298 | 23475998 |
Table 2
Publically available data for strong candidate F-box period regulators.
Circadian expression data is from the Diurnal Project gene expression tool (Mockler et al., 2007). Tissue specific expression is from the Arabidopsis eFP browser (Klepikova et al., 2016; Winter et al., 2007). The closest homolog was determined by WU-BLAST2 using BLASTP and the Araport11 protein sequences database. N/A indicates that data is not available.
| Locus ID | Gene name | Circadian expression | Tissue specific expression | Closest homolog | Publications (PMID) | |||||||||
|---|---|---|---|---|---|---|---|---|---|---|---|---|---|---|
| LDHC | LL_LDHC | LL12_LDHH | LL23_LDHH | |||||||||||
| Phase | Correlation | Phase | Correlation | Phase | Correlation | Phase | Correlation | Developmental map (eFP) | Klepikova atlas | Locus | E-Value | |||
| AT1G20800 | ACF3 | 18 | 0.51 | 4 | 0.66 | 15 | 0.65 | 16 | 0.66 | N/A | Young flower, stamen, ovule | AT1G20803 | 1.6 × 10−87 | N/A |
| AT2G44030 | ACF4 | 18 | 0.73 | 5 | 0.54 | 6 | 0.62 | 22 | 0.79 | Seed, pollen | Young stamen, flower buds | AT3G46050 | 2.5 × 10−59 | N/A |
| AT1G50870 | ACF5 | N/A | N/A | N/A | N/A | N/A | N/A | N/A | N/A | N/A | AT1G47790 | 1.2 × 10−102 | N/A | |
Table 3
Publically available data for strong candidate U-box period regulators.
Circadian expression data is from the Diurnal Project gene expression tool (Mockler et al., 2007). Tissue specific expression is from the Arabidopsis eFP browser (Klepikova et al., 2016; Winter et al., 2007). The closest homolog was determined by WU-BLAST2 using BLASTP and the Araport11 protein sequences database.
| Locus ID | Gene name | Circadian expression | Tissue specific expression | Closest homolog | Publications (PMID) | |||||||||
|---|---|---|---|---|---|---|---|---|---|---|---|---|---|---|
| LDHC | LL_LDHC | LL12_LDHH | LL23_LDHH | |||||||||||
| Phase | Correlation | Phase | Correlation | Phase | Correlation | Phase | Correlation | Developmental map (eFP) | Klepikova atlas | Locus | E-Value | |||
| AT5G18340 | PUB48 | 19 | 0.68 | 17 | 0.86 | 20 | 0.63 | 14 | 0.86 | Global, especially young flower and senescent leaf | Young flower bud, Stamen, mature leaf mature petiole | AT5G18320 | 3.8 × 10−127 | 28077082 |
| AT1G04510 | MAC3A | 20 | 0.84 | 18 | 0.72 | 23 | 0.48 | 14 | 0.83 | Global | Global | AT2G33340 | 1.2 × 10−233 | 29437988 28947490 19629177 |
| AT2G33340 | MAC3B | 15 | 0.49 | 8 | 0.56 | 17 | 0.80 | 8 | 0.73 | Global | Global | AT1G04510 | 7.2 × 10−229 | 29437988 28947490 19629177 |
| AT3G49810 | PUB30 | 2 | 0.87 | 1 | 0.59 | 3 | 0.76 | 0 | 0.91 | Global | Everywhere except young seed and young silique | AT5G65920 | 1.2 × 10−171 | 28865087 25410251 |
Table 4
Selected IP-MS results from the MAC3B decoy.
MAC3B decoy peptide hits are from one IP-MS experiment using the MAC3B decoy as the bait. Combined control peptide hits are summed from the independent control experiments of wildtype Col-0 and 35S::His-FLAG-GFP expressing plants.
| Locus | Protein name | Total spectral counts | |
|---|---|---|---|
| MAC3B decoy | Combined controls | ||
| AT2G33340 | MAC3B | 294 | 15 |
| AT1G04510 | MAC3A | 129 | 0 |
| AT1G09770 | CDC5 | 36 | 0 |
| AT1G07360 | MAC5A | 24 | 44 |
| AT3G18165 | MOS4 | 35 | 0 |
| AT4G15900 | MAC2/PRL1 | 19 | 23 |
Key resources table
| Reagent type (species) or resource | Designation | Source or reference | Identifiers | Additional information |
|---|---|---|---|---|
| Genetic Reagent (Arabidopsis thaliana) | CCA1p::Luciferase | Pruneda-Paz et al., 2009 | Dr. Pruneda-Paz | |
| Genetic Reagent (A. thaliana) | mac3a | Monaghan et al., 2009 | Dr. Xin Li | |
| Genetic Reagent (A. thaliana) | mac3b | Arabidopsis Biological Resource Center | SALK 144856C | |
| Genetic reagent (A. thaliana) | mac3a/mac3b | Monaghan et al., 2009 | Dr. Xin Li | |
| Antibody | Monoclonal mouse anti-FLAG antibody | Sigma | Cat#: F3165 RRID:AB_259529 | Conjugated to Dynabeads M-270 Epoxy (Thermo Fisher Scientific, cat# 14311D) |
Additional files
-
Source code 1
MATLAB script called by outlier_analysis that determines the number of subpopulations within a dataset.
- https://doi.org/10.7554/eLife.44558.025
-
Source code 2
MATLAB script called by batch_outlier to compare individual datasets to the control dataset.
- https://doi.org/10.7554/eLife.44558.026
-
Source code 3
MATLAB script used to batch-process circadian imaging data.
- https://doi.org/10.7554/eLife.44558.027
-
Supplementary file 1
All generated data and publications which reference genes in our decoy library.
- https://doi.org/10.7554/eLife.44558.028
-
Supplementary file 2
IP-MS results from the MAC3B decoy.
- https://doi.org/10.7554/eLife.44558.029
-
Supplementary file 3
Primers used in this Study.
- https://doi.org/10.7554/eLife.44558.030
-
Supplementary file 4
ABRC Stock numbers for pENTR-decoy vectors, 35S:HIS-FLAG-decoy vectors, and 35S:HIS-FLAG-decoy transgenic seed stocks.
- https://doi.org/10.7554/eLife.44558.031
-
Transparent reporting form
- https://doi.org/10.7554/eLife.44558.032
Download links
A two-part list of links to download the article, or parts of the article, in various formats.
Downloads (link to download the article as PDF)
Open citations (links to open the citations from this article in various online reference manager services)
Cite this article (links to download the citations from this article in formats compatible with various reference manager tools)
Decoys provide a scalable platform for the identification of plant E3 ubiquitin ligases that regulate circadian function
eLife 8:e44558.
https://doi.org/10.7554/eLife.44558


