Stress-mediated exit to quiescence restricted by increasing persistence in CDK4/6 activation
- Department of Chemical and Systems Biology, Stanford University School of Medicine, United States
- Department of Pathology and Cell Biology, Columbia University Medical Center, United States
- Laboratory of Cancer Biology and Genetics, Center for Cancer Research, National Cancer Institute, United States
- Department of Molecular Biology and Genetics, Johns Hopkins University School of Medicine, United States
- Department of Bioengineering, Stanford University School of Medicine, United States
- Department of Cell and Developmental Biology, Weill Cornell Medical College, United States
Figures
Figure 1 with 4 supplements
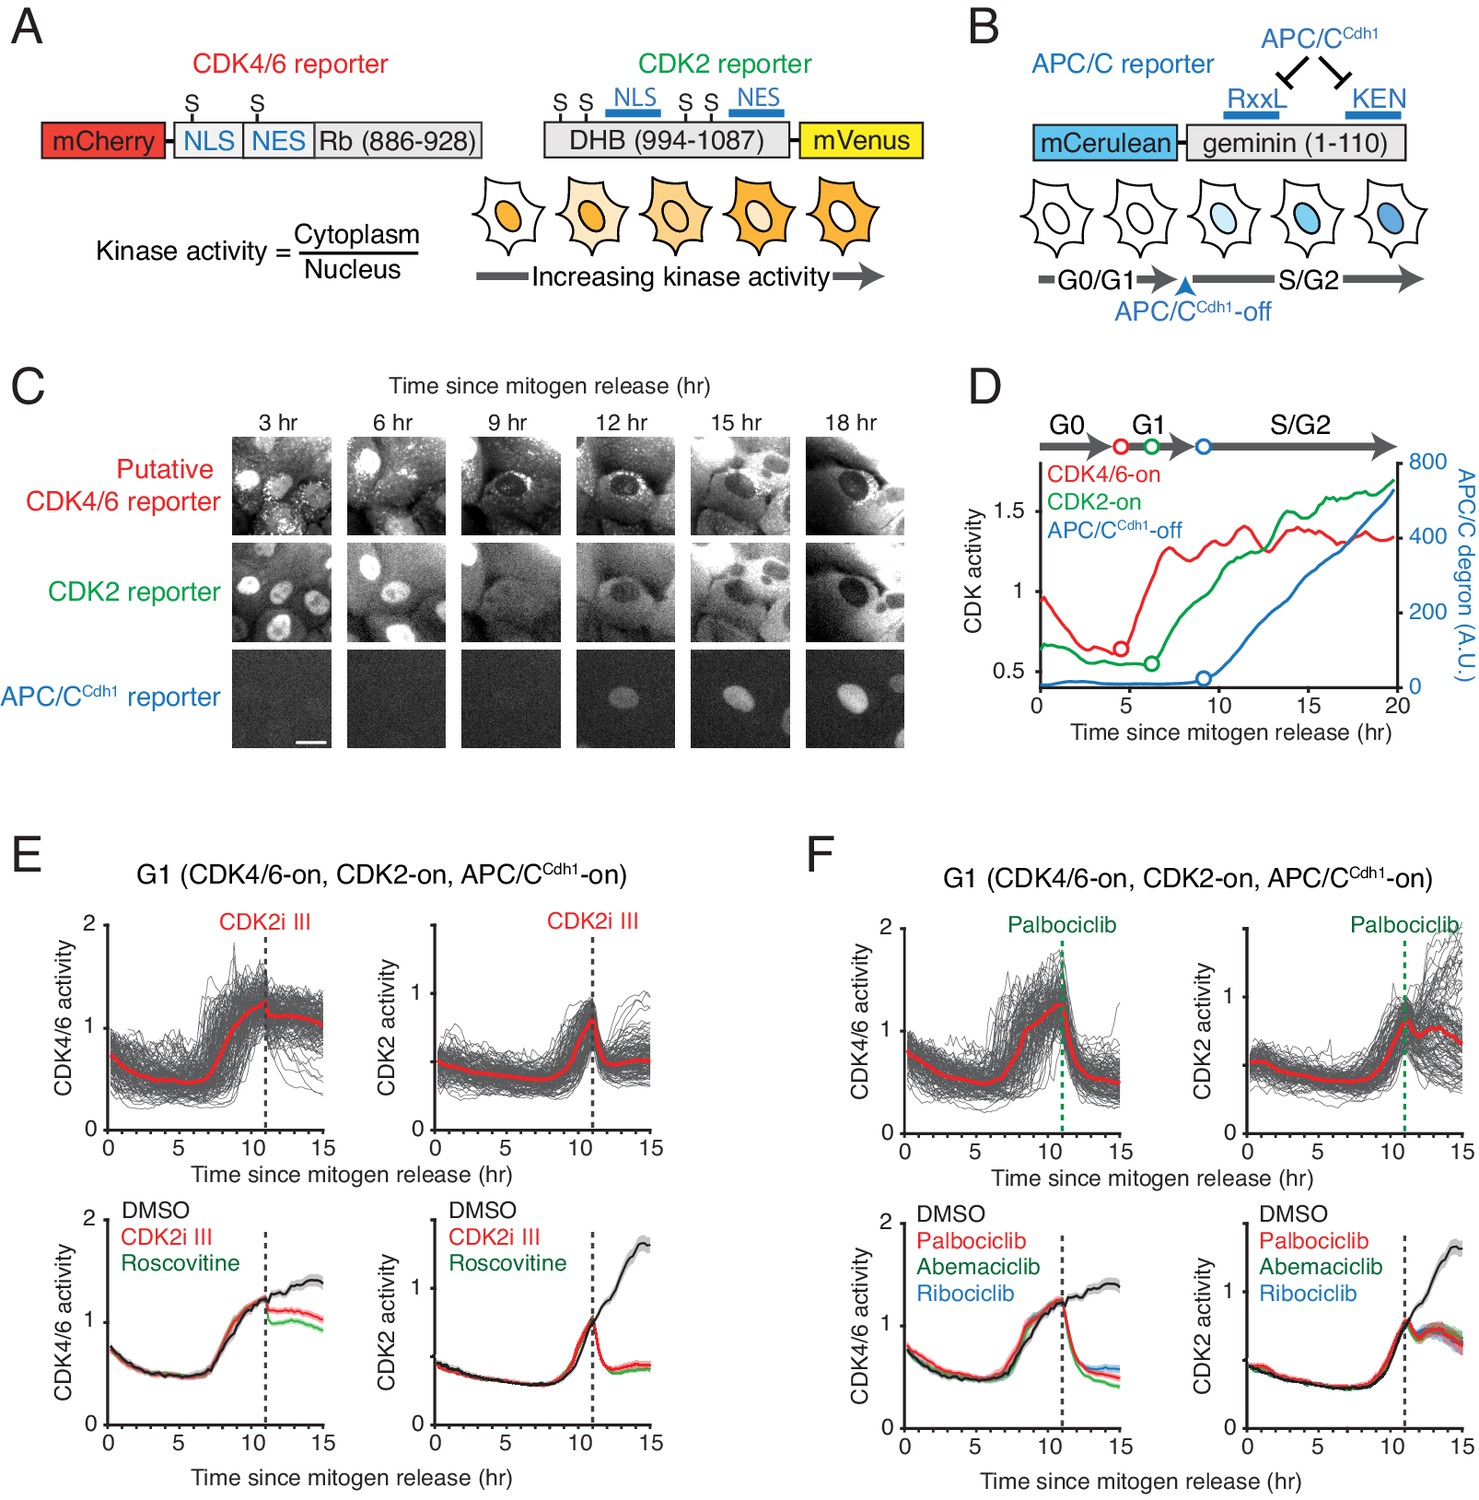
Characterization of the selectivity of the putative CDK4/6 reporter.
(A) Schematics of CDK4/6 and CDK2 reporters. Increased CDK kinase activity increasingly phosphorylates a larger fraction of the respective reporter and promotes an increased relative cytoplasmic versus nuclear localization of the reporter. (B) Schematic of the APC/CCdh1 reporter. Once APC/CCdh1 is inactivated at the G1/S transition, the intensity of the reporter starts to gradually increase. (C) Example of a time series of images of the three reporters used for automated analysis of the respective signaling activities in the same cell. Scale bar is 10 µm. (D) An example of three cell-cycle activity time courses corresponding to the cell in the center of the images in (C). (E, F) Response of the two CDK reporters in G1 phase to (E) CDK2 inhibitors, CDK2i III (60 µM) and Roscovitine (60 µM), and (F) CDK4/6 inhibitors, Palbociclib (1 µM), Abemaciclib (1 µM), and Ribociclib (1 µM). Multiple single-cell time courses are shown (top; red line indicates median value). Median values and confidence intervals are also shown (bottom: shade indicates 95% confident interval) (n > 90 cells). Only cells with activated CDK4/6 and CDK2 were selected. Inhibitors were added at 11 hr after mitogen release (dotted line).
Figure 1—figure supplement 1
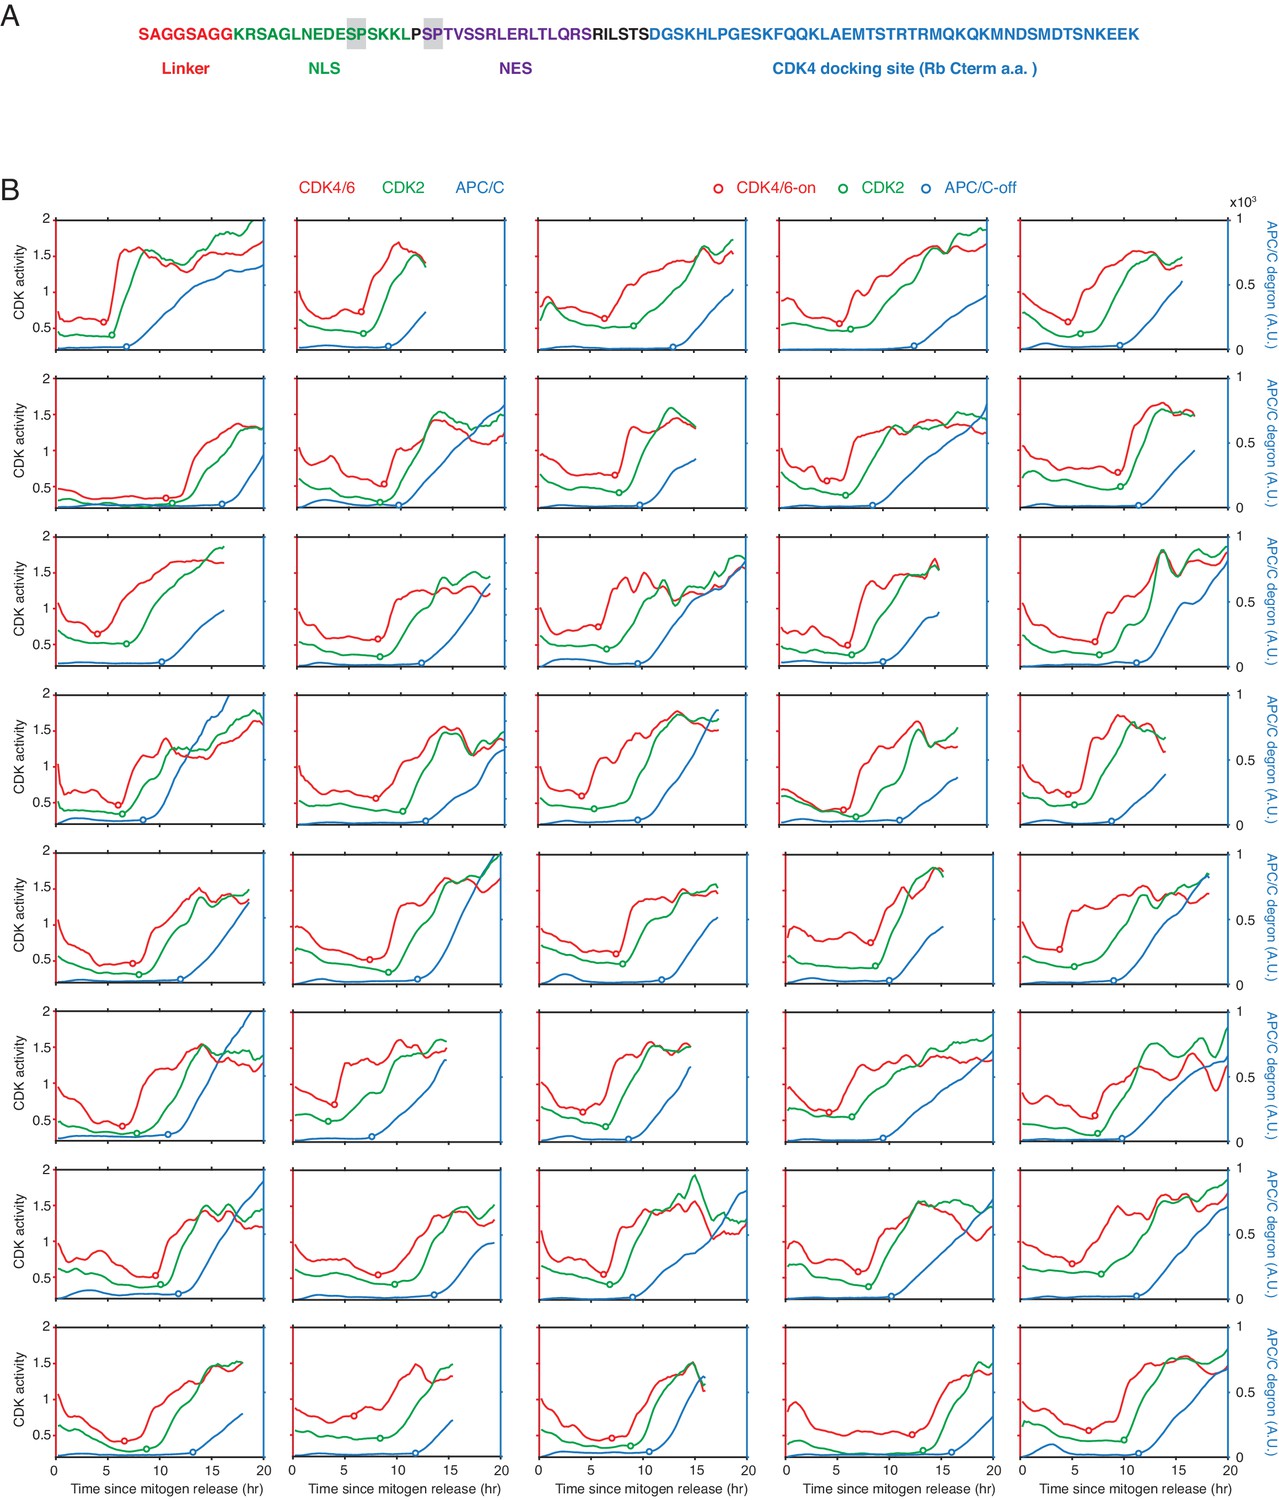
Design of CDK4/6 reporter and examples of single-cell traces of CDK4/6, CDK2, and APC/C reporter signals after mitogen release.
(A) Modular design of CDK4/6 reporter, two potential CDK phosphorylation sites in the reporter are shaded in grey. (B) Single-cell time courses of CDK4/6, CDK2 and APC/CCdh1 activities in the same cell during mitogen-triggered cell-cycle entry as in Figure 1D.
Figure 1—figure supplement 2
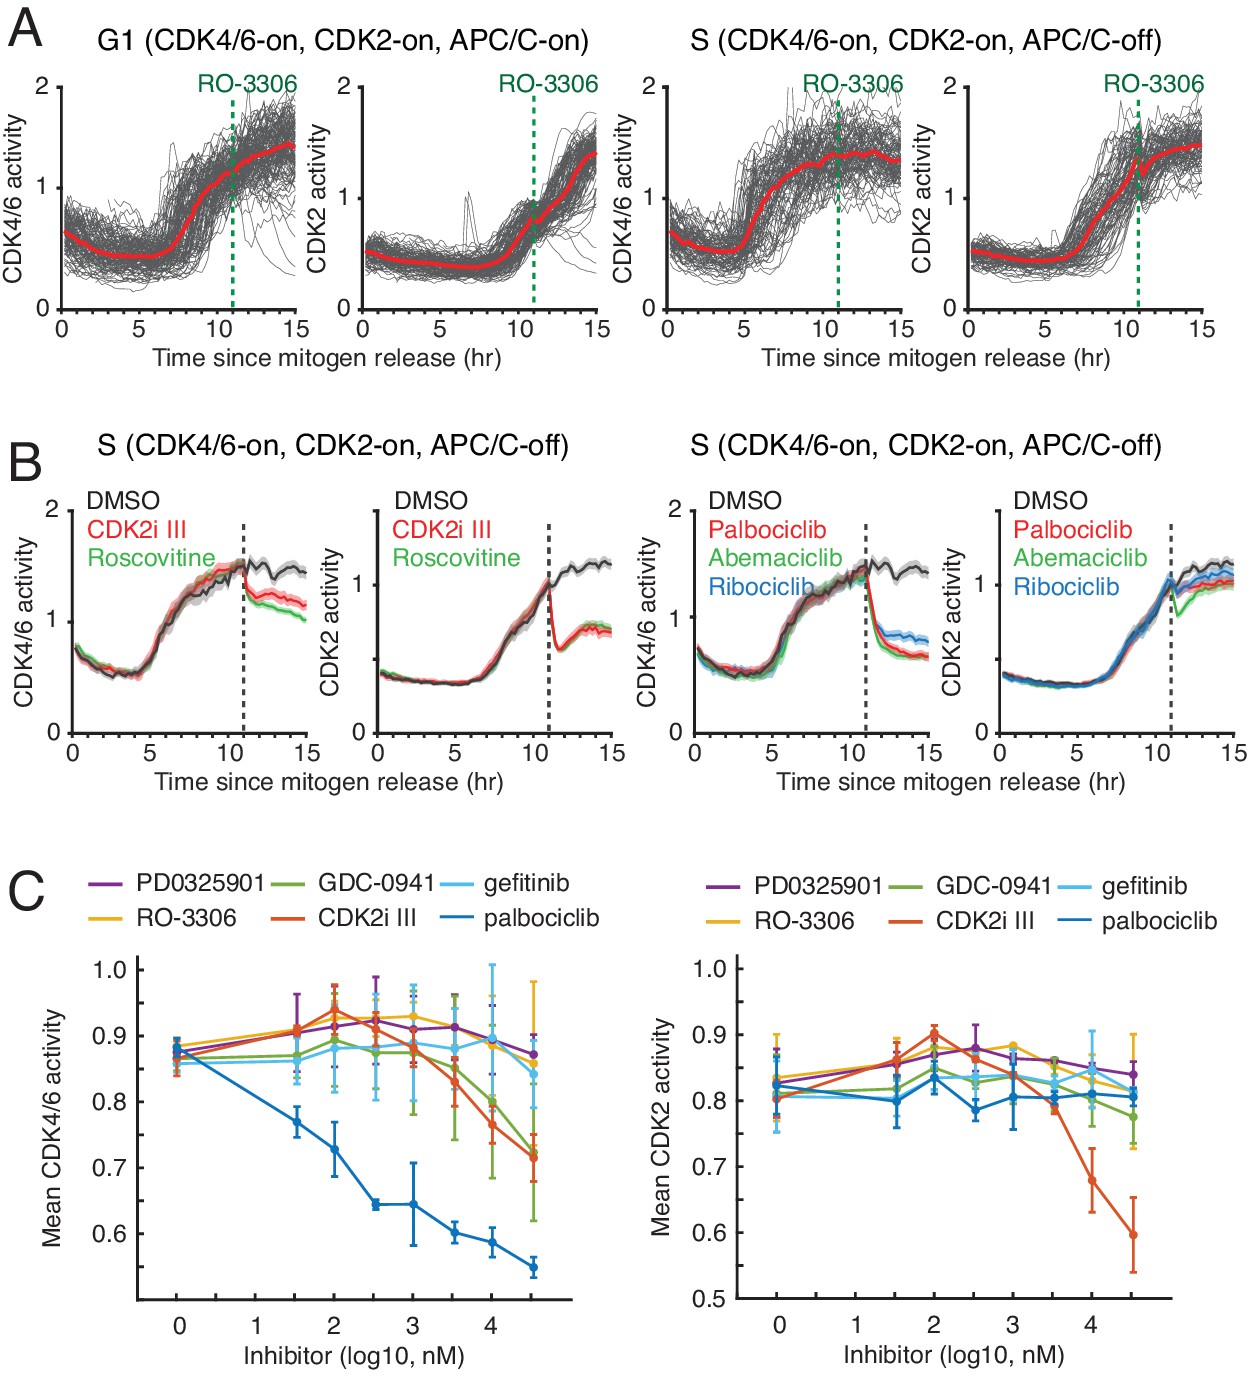
Response of CDK4/6 and CDK2 reporters to CDK inhibitors.
(A) Response of the two CDK reporters to CDK1 inhibitor (RO3306, 10 uM) in G1 (left) or S (right). Red line indicates median values of each traces (n > 90 cells). (B) Response of the two CDK reporters in S phase to (left) CDK2i III (60 µM; partially selective for CDK2) and Roscovitine (60 µM; selective for cyclin E/A-CDK2/1), and (right) palbociclib (1 µM), abemaciclib (1 µM), and ribociclib (1 µM)(selective for cyclin D-CDK4/6). Shade area indicates 95% confident interval (n > 50 cells). Only cells with both active CDK4/6 and CDK2 were selected. Inhibitors were added at 11 hr after mitogen release (dotted line). (C) Control experiments showing the sensitivity of the CDK4/6 reporter in cycling cells against different kinase inhibitors PD0325901 (MEK), GDC-0941 (PI3Kα/β), RO-3306 (CDK1), gefitinib (EGFR), palbociclib (CDK4/6), and CDK2i III (8-fold selectivity CDK2 over CDK1). Cells were incubated with indicated drugs for an hour prior to fixation. Data are mean ± s.d. (three independent experiments).
Figure 1—figure supplement 3
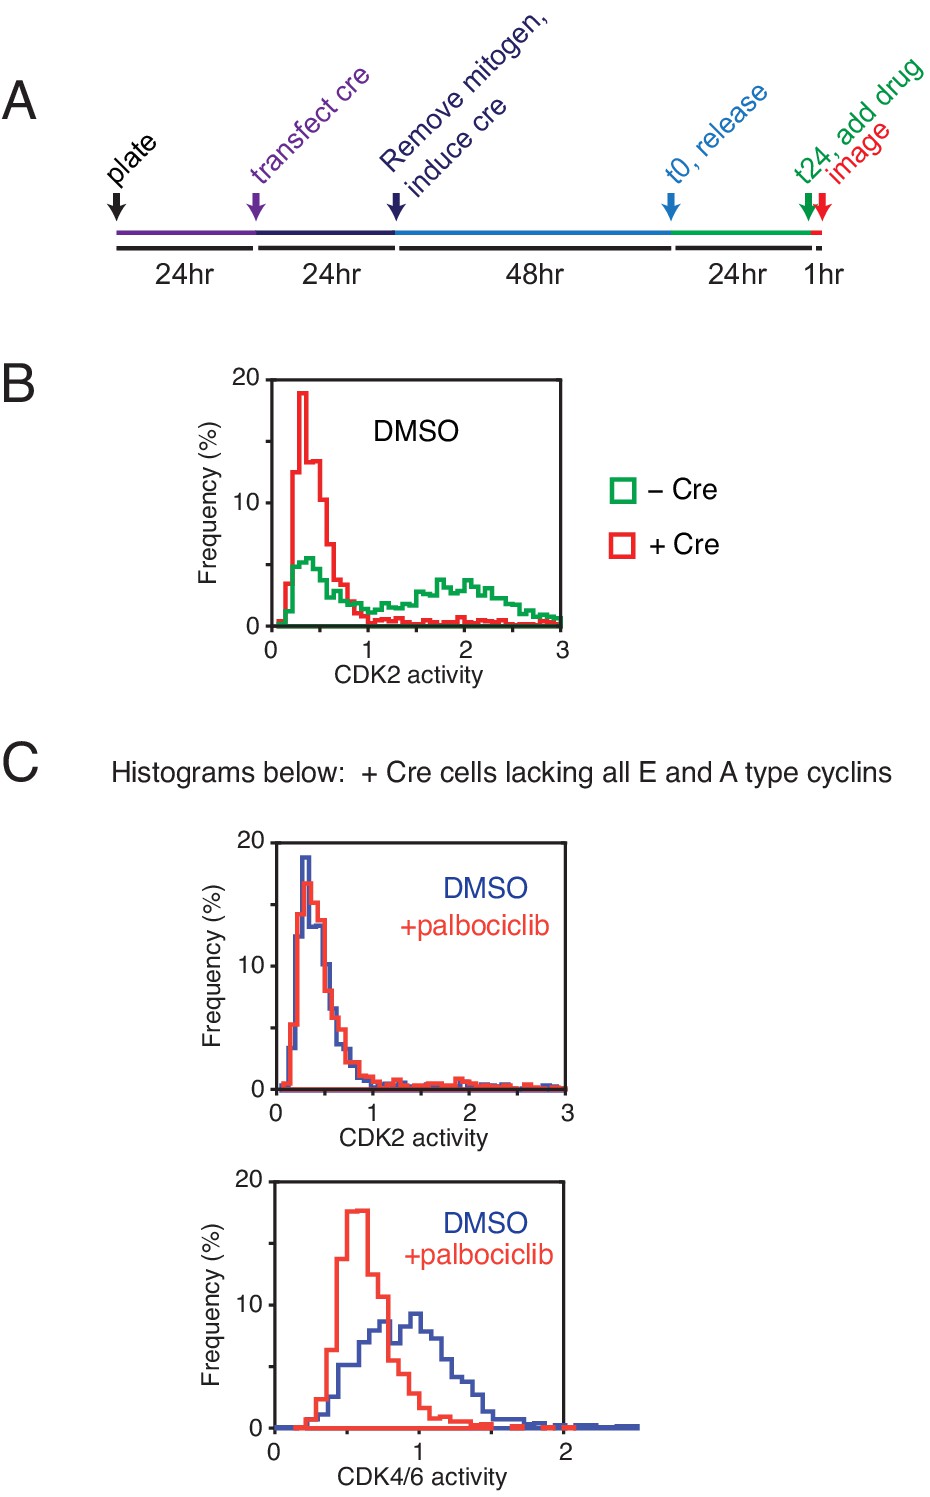
Knockout control experiments of cyclin Es and As to exclude the possibility that CDK2 plus CDK4/6 activity is required for generating a CDK4/6 reporter signal.
(A) Experimental design of experiments using cyclin E1/E2/A1 null MEFs with a Cre-inducible cyclin A2 knockout. Protocol used to knockout all four cyclin E and A genes. (B) Histogram analysis of asynchronously cycling cells shows that Cre-induced MEFs lacking all cyclin E/A lost all CDK2 reporter signal. (C) Top, CDK4/6 inhibition has no significant effect on CDK2 activity in cyclin E/A knockout cells. Bottom, CDK4/6 inhibition (palbociclib, 1 µM for an hour) suppresses the CDK4/6 reporter signal. These control experiments argue that both cyclin E and A are not needed for the phosphorylation of the reporter, implying that cyclin D and CDK4/6 are sufficient to generate a CDK4/6 reporter signal.
Figure 1—figure supplement 4

Derivation of a corrected CDK4/6 activity using simultaneously measured CDK2 activity to subtract a contribution to the reporter signal from CDK2 activity.
(A) Validation experiment in cells exiting quiescence showing that a 35% subtraction of a proportional CDK2 signal from the CDK4/6 reporter signal leads to a complete loss of the corrected CDK4/6 activity when CDK4/6 activity is inhibited after cells enter S-phase. (B) Same correction for cells exiting mitosis, in this case also showing the contribution of the CDK2 activity to the total signal using a CDK2 inhibitor. (C) Time course of the mean CDK4/6 and corrected CDK4/6 activities for the experiments in (B). All time courses in (B and C) were aligned by addition of the inhibitors while gating only for cells that exited mitosis −3 to −5 hr before inhibitor addition.
Figure 2 with 2 supplements
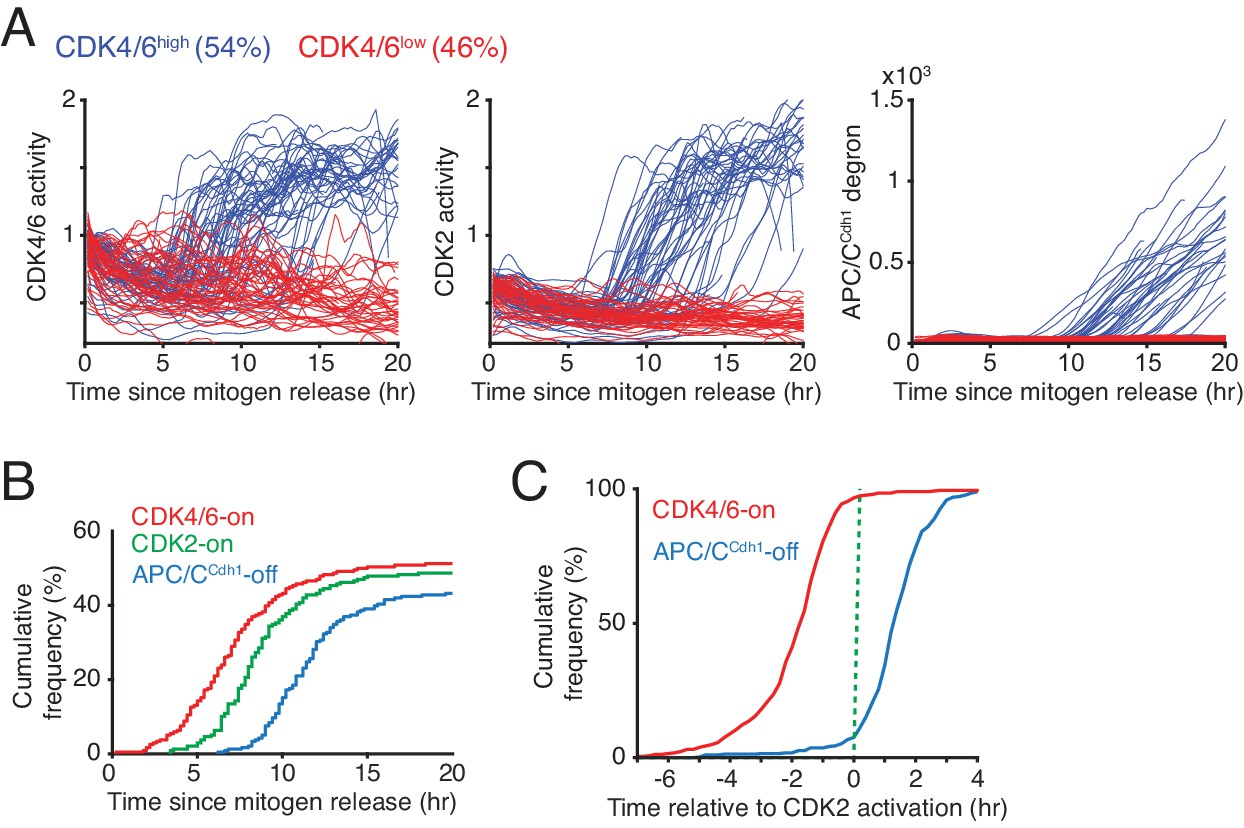
Rapid CDK4/6 activation after a long delay - followed by sequential CDK2 activation and APC/CCdh1 inactivation in cells exiting quiescence.
(A) Single-cell activity traces of CDK4/6, CDK2, and APC/CCdh1. Cells were stimulated with mitogens after serum starvation and classified based on the detection of CDK4/6-on point (CDK4/6high or CDK4/6low). (B) Cumulative plot of activation of CDK4/6 and CDK2, and inactivation of APC/CCdh1 as a function of time after mitogen release (n > 200 cells; CDK4/6-on, CDK2-on and APC/C-off points shown in Figure 1D). (C) Cumulative plots of the fraction of cells activating CDK4/6 and inactivating APCCdh1 as a function of time relative to CDK2 activation (n > 350 cells).
Figure 2—figure supplement 1
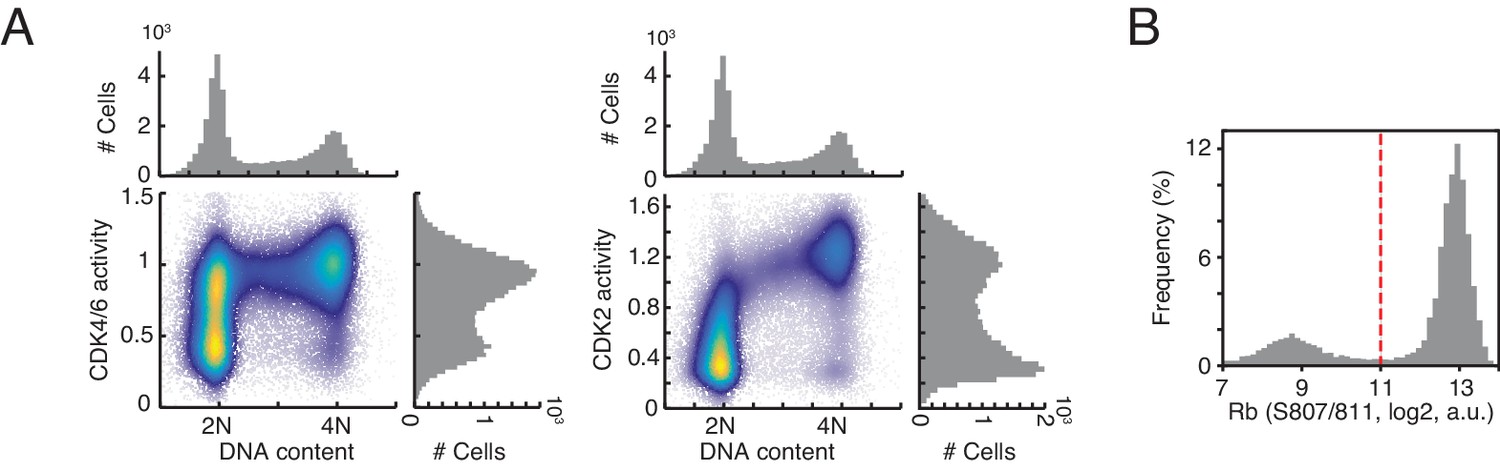
Bimodal distribution of cyclin D-CDK4/6 activity in G1 phase.
(A) Density scatter plots showing CDK4/6 activity and CDK2 activity versus DNA staining (n > 10,000 cells). (B) Histogram of Rb phosphorylation (S807/811). Dotted line indicates a threshold used to classify Rb phosphorylation.
Figure 2—figure supplement 2
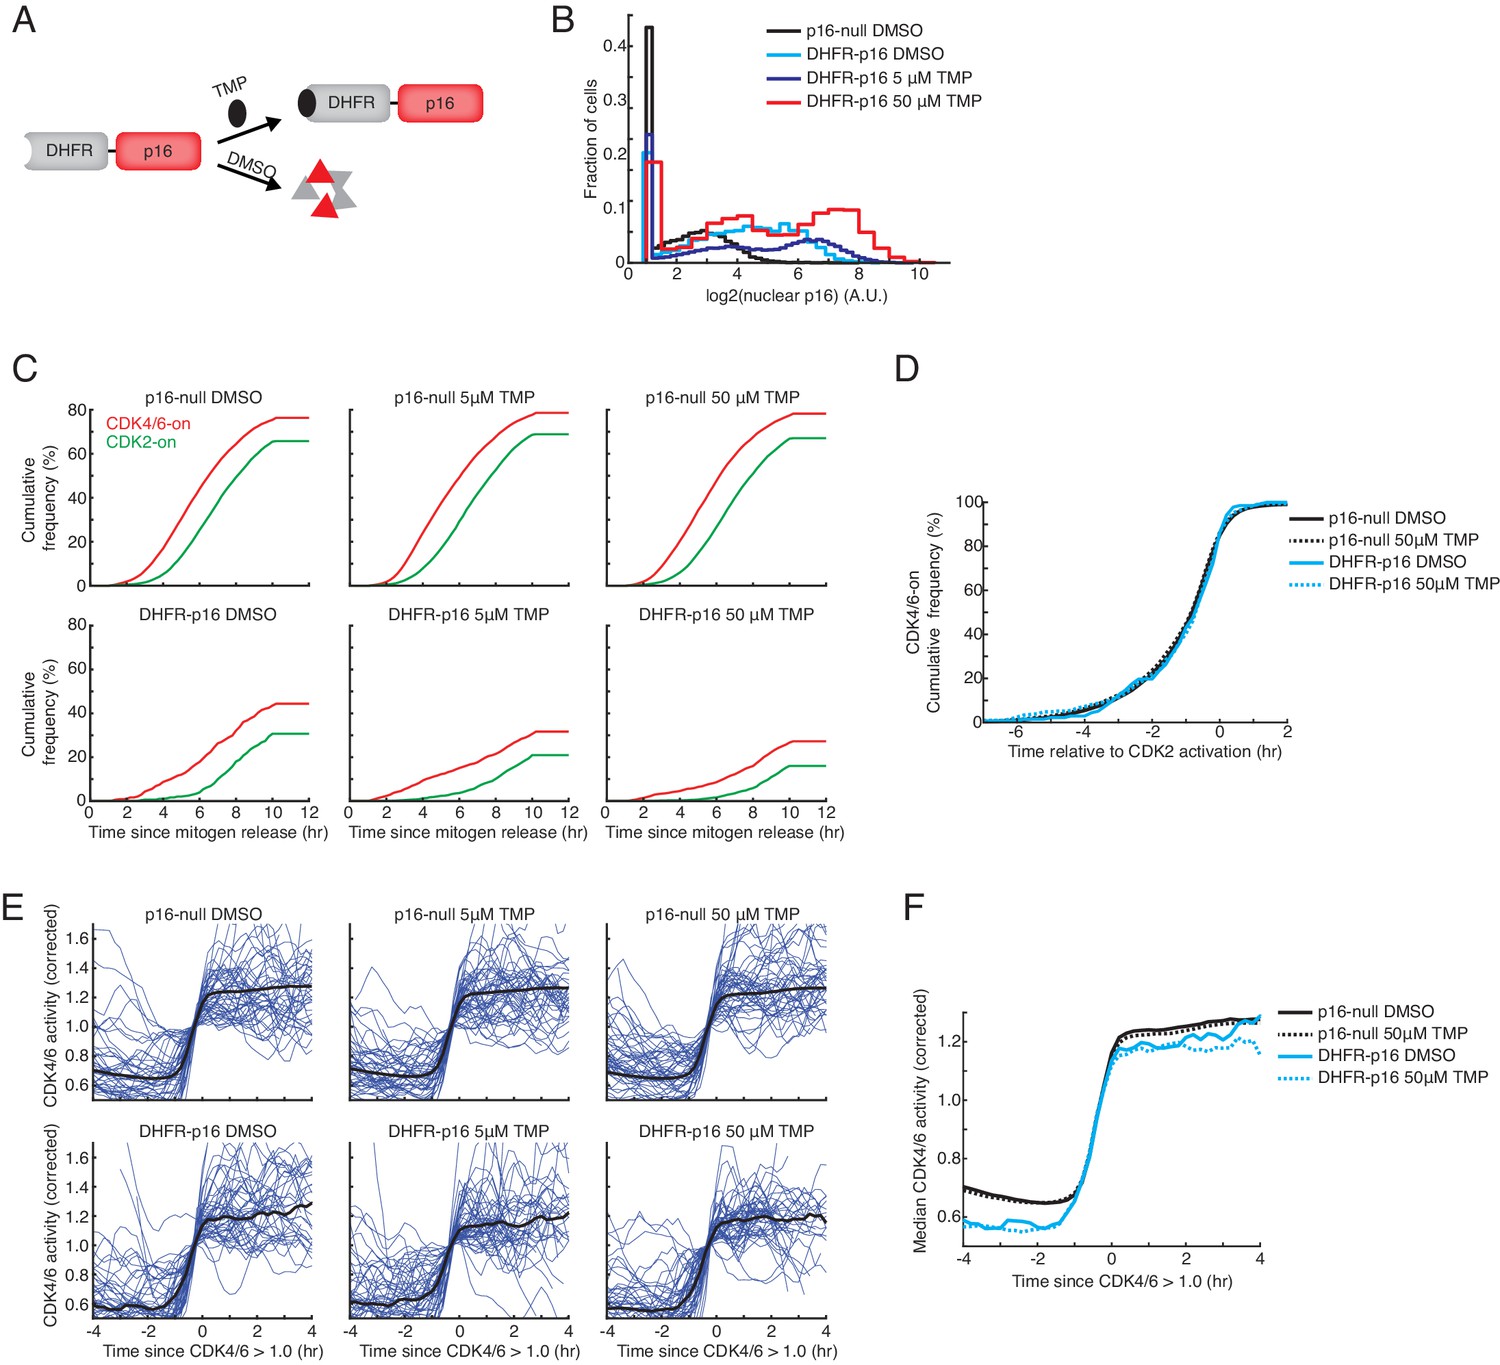
p16 suppresses the fraction of cells activating CDK4/6 but does not affect the rate of CDK4/6 activation or the sequential activation kinetics of CDK2 relative to CDK4/6.
(A) Schematic of DHFR-p16 fusion protein. In the absence of trimethoprim (TMP), DHFR-p16 is destabilized and persistently degraded. Following TMP addition, the fusion protein is stabilized. (B) Comparison of nuclear p16 intensity in wild-type MCF10A cells, which lack an endogenous copy of p16, to MCF10A cells expressing DHFR-p16 fusion construct. Immunofluorescence was performed 12 hr after the addition of DMSO or TMP. (C) Cumulative plot of activation of CDK4/6 and CDK2 as a function of time after mitogen release (n > 500 cells in each condition) in wild-type or DHFR-p16 expressing cells. TMP or DMSO was added at the time of mitogen release. (D) Cumulative plots of the fraction of cells activating CDK4/6 as a function of time relative to CDK2 activation (n > 500 cells in each condition). (E) Single cell traces (blue) and correspond median traces (black) in wild-type and DHFR-p16 expressing MCF10A cells stimulated with mitogens and DMSO or TMP. Traces were aligned to the timepoint where corrected CDK4/6 activity first exceeded 1.0. (F) Median traces from (E) visualized on the same plot to compare CDK4/6 activation kinetics in the presence or absence of p16.
Figure 3 with 1 supplement
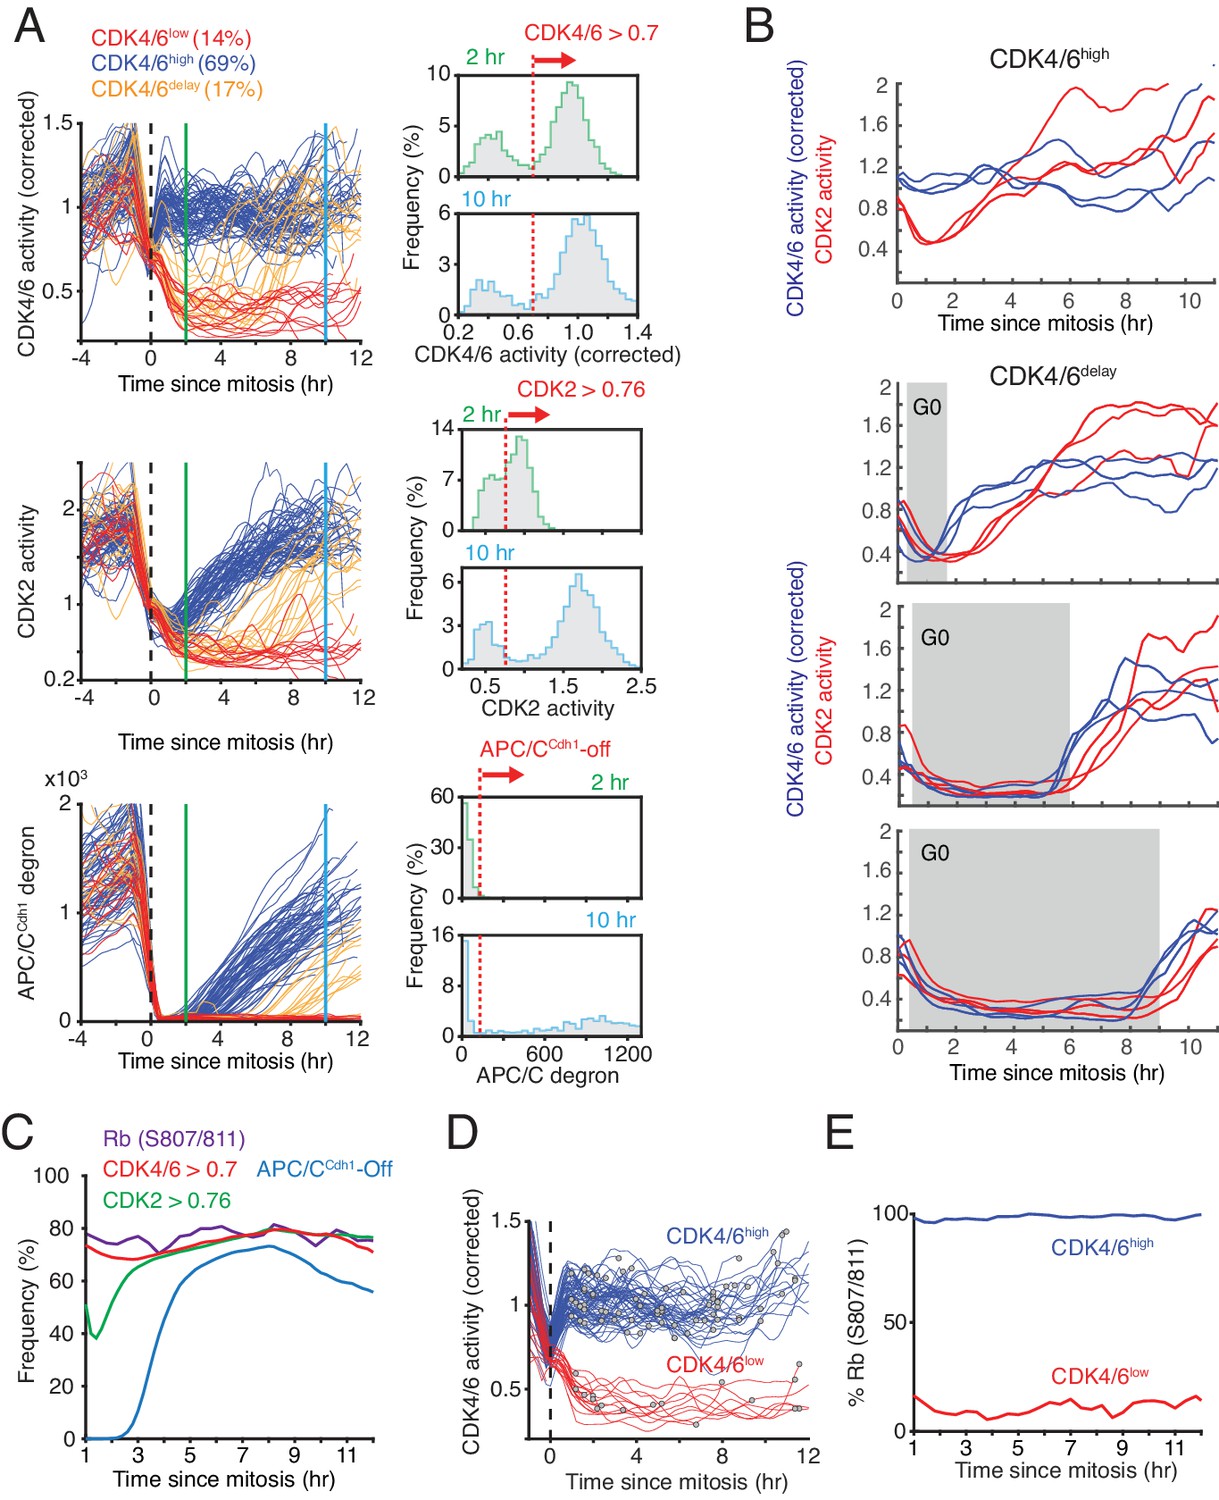
Bimodal CDK4/6 activity correlates with a bifurcation in Rb hyperphosphorylation and CDK2 activation in cells exiting mitosis or a variable period of low CDK4/6 activity after mitosis.
(A) Left: Asynchronously cycling cells aligned by the end of the mitosis (anaphase), comparing CDK4/6, CDK2, and APC/CCdh1 activity changes. Corrected CDK4/6 activity signals are shown. Cells were classified by their CDK4/6 activity 2 hr after anaphase as being CDK4/6high or CDK4/6low, and a subset of CDK4/6low cells were further classified as CDK4/6delay if they had initially low CDK4/6 activity but later again increased CDK4/6 activity. Right: Activity histograms show that CDK4/6 but not CDK2 activity is rapidly activated with a bimodal activity distribution 2 hr after mitosis. Dotted line indicates the threshold used to classify the subpopulation of cells with CDK4/6, CDK2 or APC/CCdh1 activity on or off (n > 2,000 cells). (B) Examples of cells that either kept CDK4/6 activity on at mitotic exit (top), or exited to an approximately 2, 6 or 9 hr long transient G0 with low CDK4/6 activity (lower three panels). Corresponding CDK2 activities are shown to highlight that both CDK activities are low during a transient G0 and are sequentially activated (3 cells shown for each transient G0 time period). (C) A cumulative representation of the fraction of cells with active CDK4/6 (>0.7), hyperphosphorylated Rb (see Figure 2—figure supplement 1B), activated CDK2 (>0.76) and inactivated APC/CCdh1 as a function of time after mitosis (n > 2,000 cells). (D,E) Live-fixed analysis of cells in the same population with active or inactive CDK4/6 at different times after anaphase. The plot in (E) shows the fraction of cells that have Rb phosphorylated or not in cells were CDK4/6 activity is high or low as a function of time after anaphase (n > 2,000 cells).
Figure 3—figure supplement 1
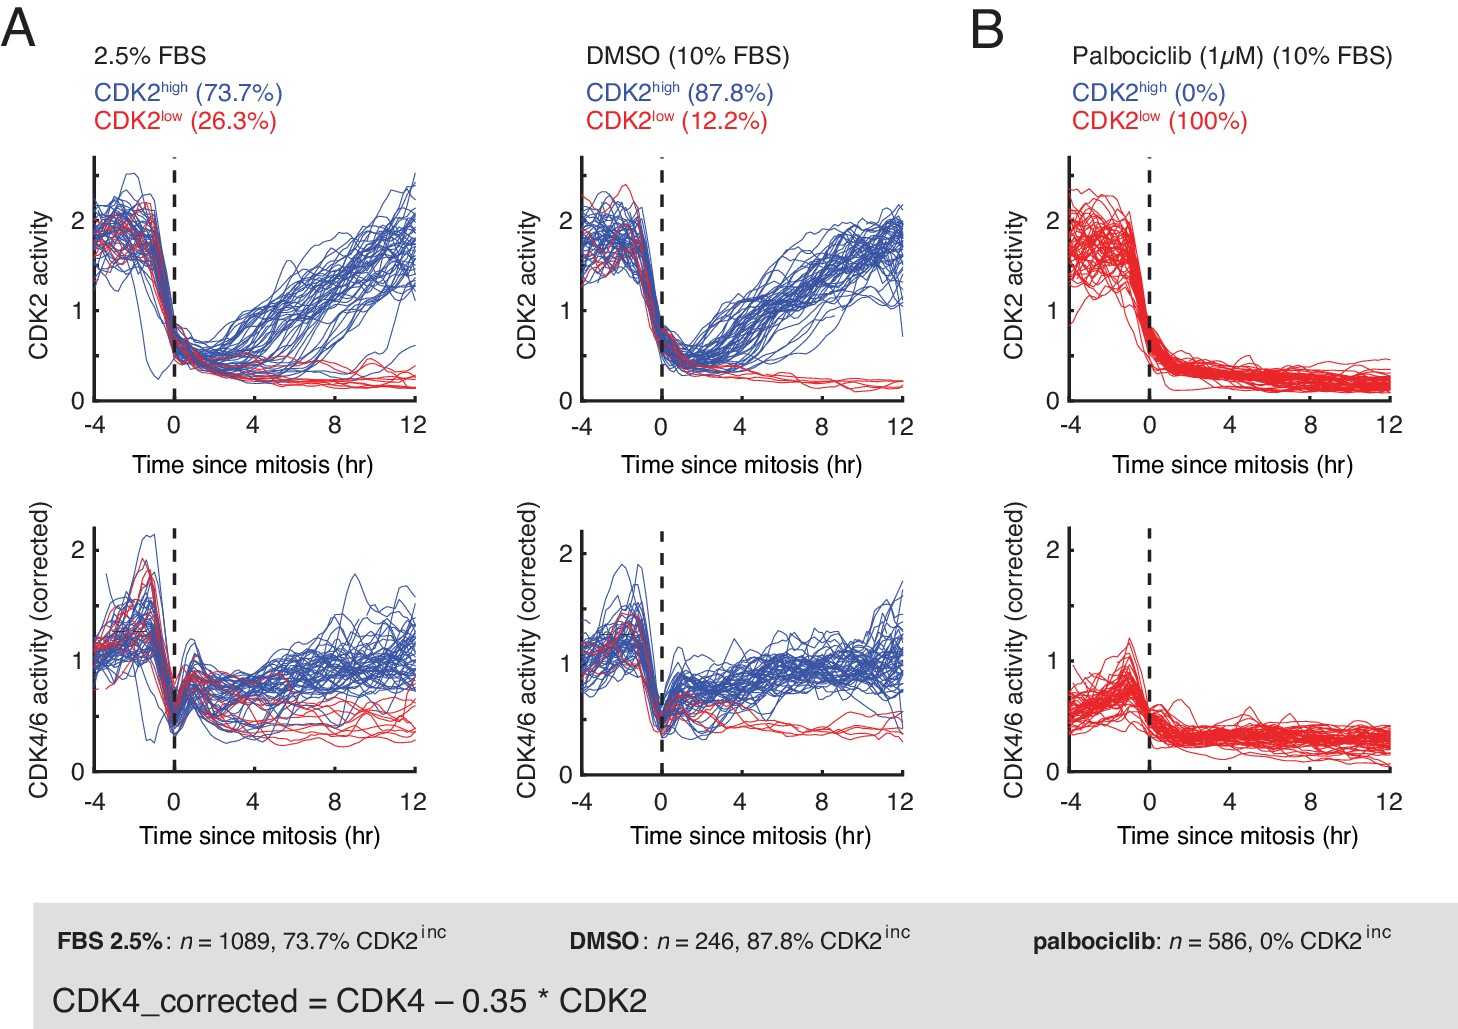
CDK2 and CDK4/6 activity time-courses in asynchronously cycling RPE-1 hTERT cells with and without inhibition of CDK4/6 activity by palbociclib.
(A) Asynchronously cycling RPE-1 hTERT cells grown in growth media containing 2.5% or 10% FBS, aligned by the end of the mitosis (anaphase) and analyzing CDK2 or CDK4/6 activity changes. Corrected CDK4/6 activity signals are shown. As a control, cells were treated with either DMSO or Palbociclib (1 µM) before imaging was initiated and cells that were tracked for at least three hours before mitosis were analyzed. (B) Following mitosis, both CDK2 and CDK4/6 activity were low in cells treated with palbociclib.
Figure 4 with 2 supplements
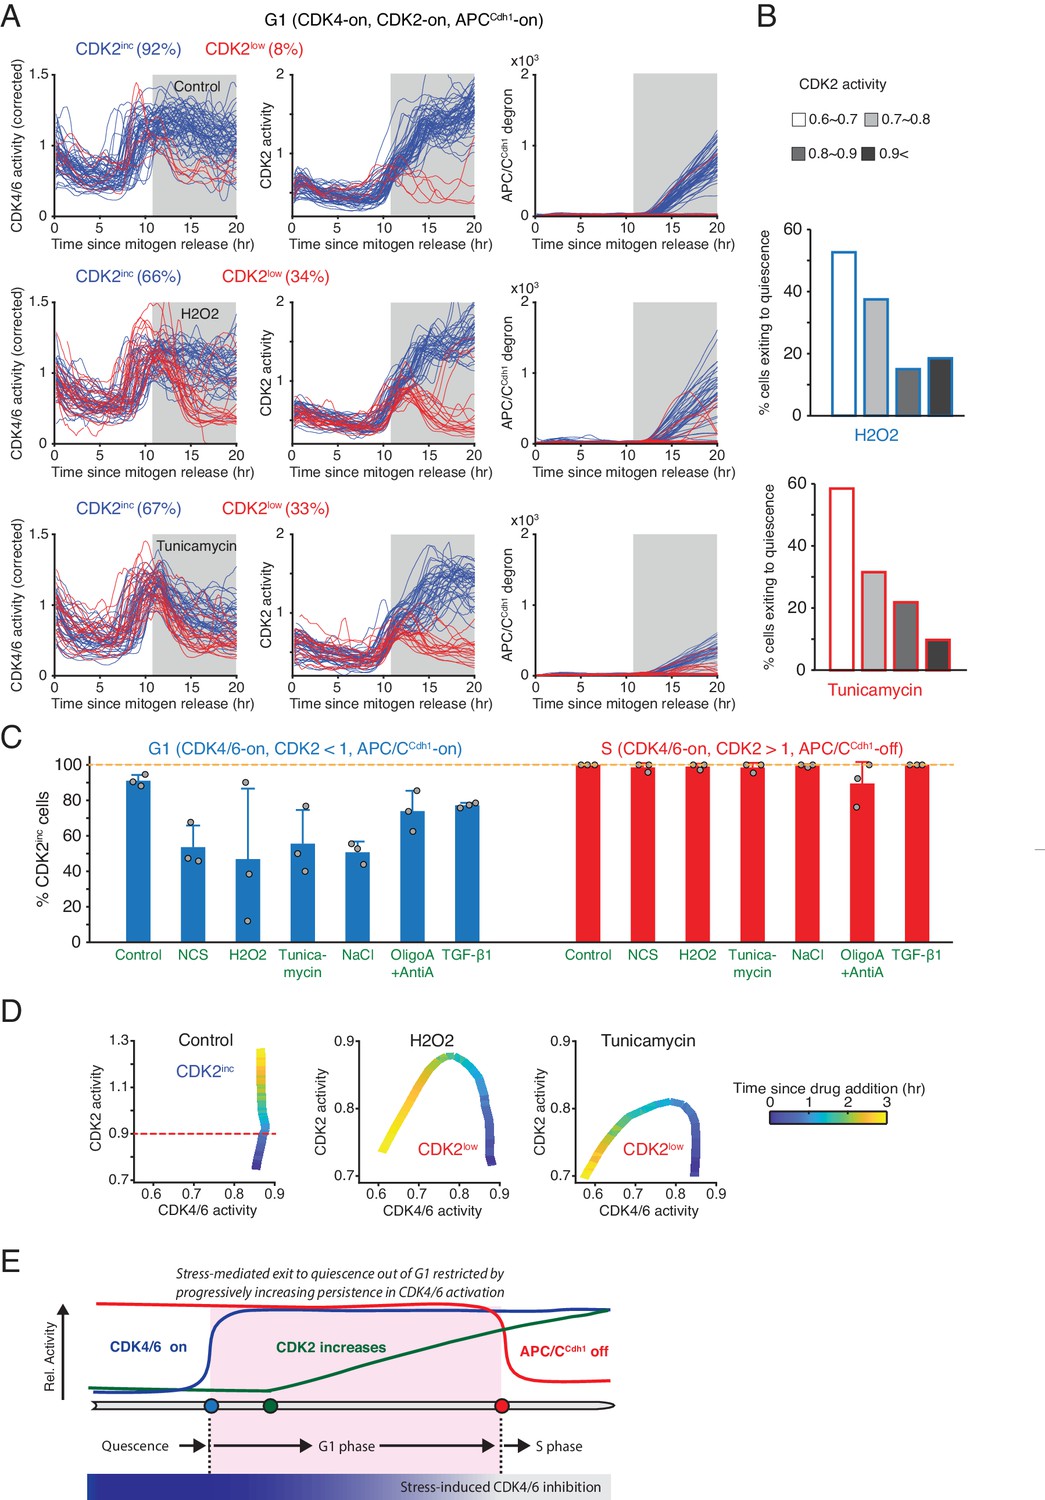
Increased resistance against stress-mediated CDK4/6 inactivation as cells increase CDK2 activity towards the end of G1 phase.
(A) Activity changes of the two CDK reporters and APC/CCdh1 in G1 phase in response to stress: H2O2 (200 µM) and Tunicamycin (5 µM). Cells were classified based on the resulting CDK2 activity changes after addition of stresses (CDK2inc or CDK2low, measured at 15 hr). Cells included in the analysis were selected if they had active CDK4/6 and CDK2 activity and no APC/C degron signal at 11 hr after mitogen release when the stresses were applied (gray area). (B) % cells inactivating CDK2 activity in response to H2O2 and tunicamycin. Cells were classified based on CDK2 activity when stresses were added (n > 20 cells from 3 independent experiments). (C) % of CDK2inc cells in response to various types of stresses. Data are mean ± s.d. (3 independent experiments). (D) Phase plot analysis of CDK2 versus CDK4/6 activity after application of different stresses. Time is color-coded (n > 35 cells from 3 independent experiments). (E) Schematic representation of the progressive loss in stress sensitivity of CDK4/6 activity as cells approach the onset of S phase.
Figure 4—figure supplement 1
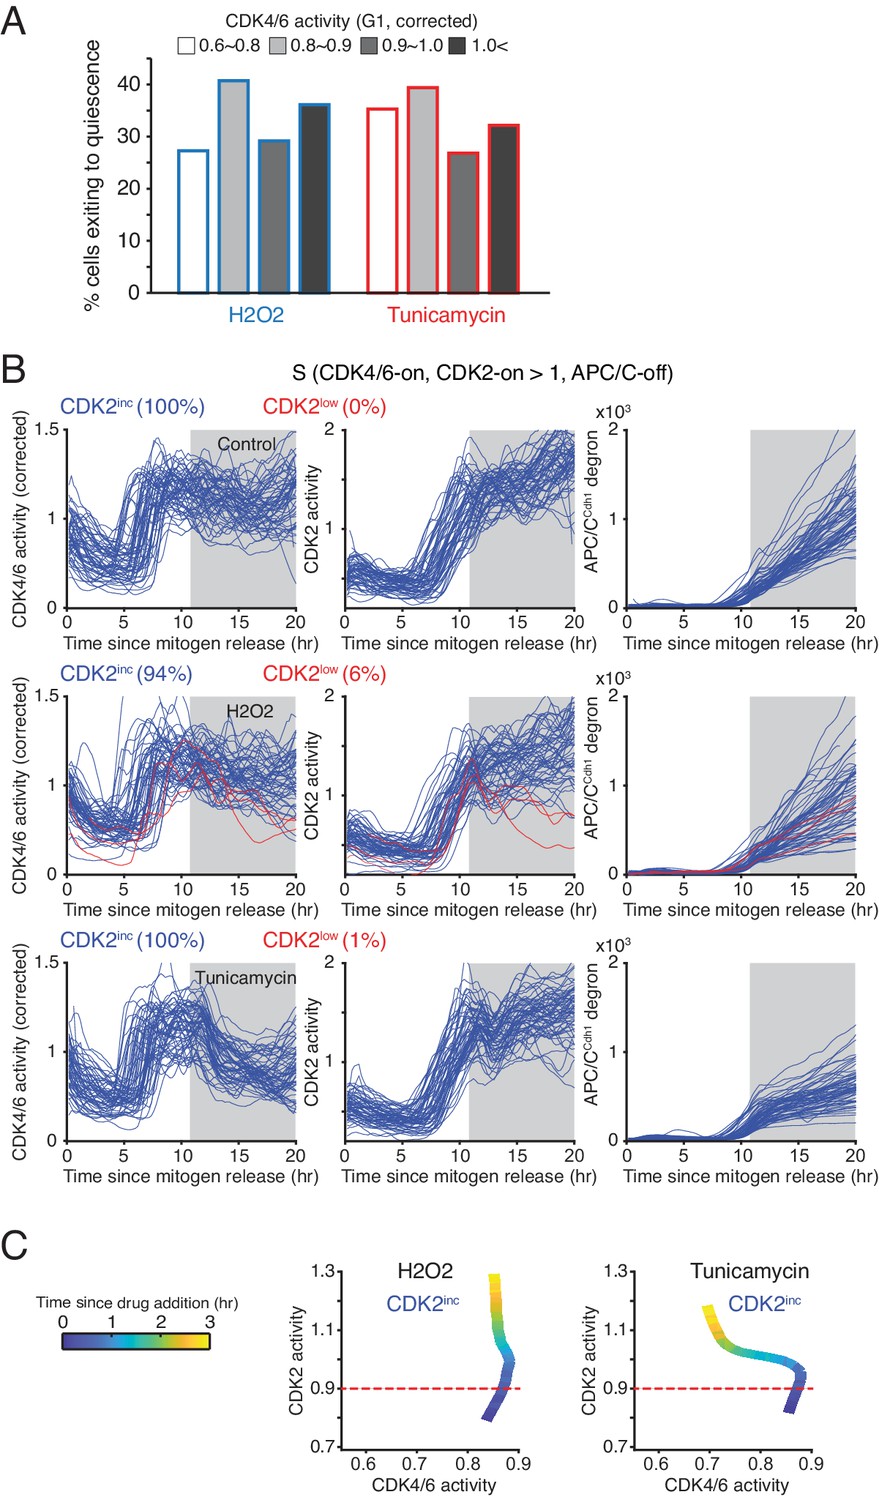
Control experiments showing that cells become resistant to stress in S phase.
(A) % cells inactivating CDK2 activity in response to H2O2 and tunicamycin. Cells were classified based on CDK4/6 activity when stresses were applied (n > 20 cells from 3 independent experiments). (B) Response of the CDK reporters and APC/CCdh1 in S phase following H2O2 and Tunicamycin addition. Cells were classified based on their CDK2 activity after addition of stresses (CDK2inc or CDK2low). Only cells with high CDK4/6 and CDK2 at 11 hr were selected for the analysis. Stresses were applied at 11 hr after mitogen release (gray area). (C) Phase plot of CDK activities in S phase after application of stresses. Time is color-coded (n > 100 cells).
Figure 4—figure supplement 2
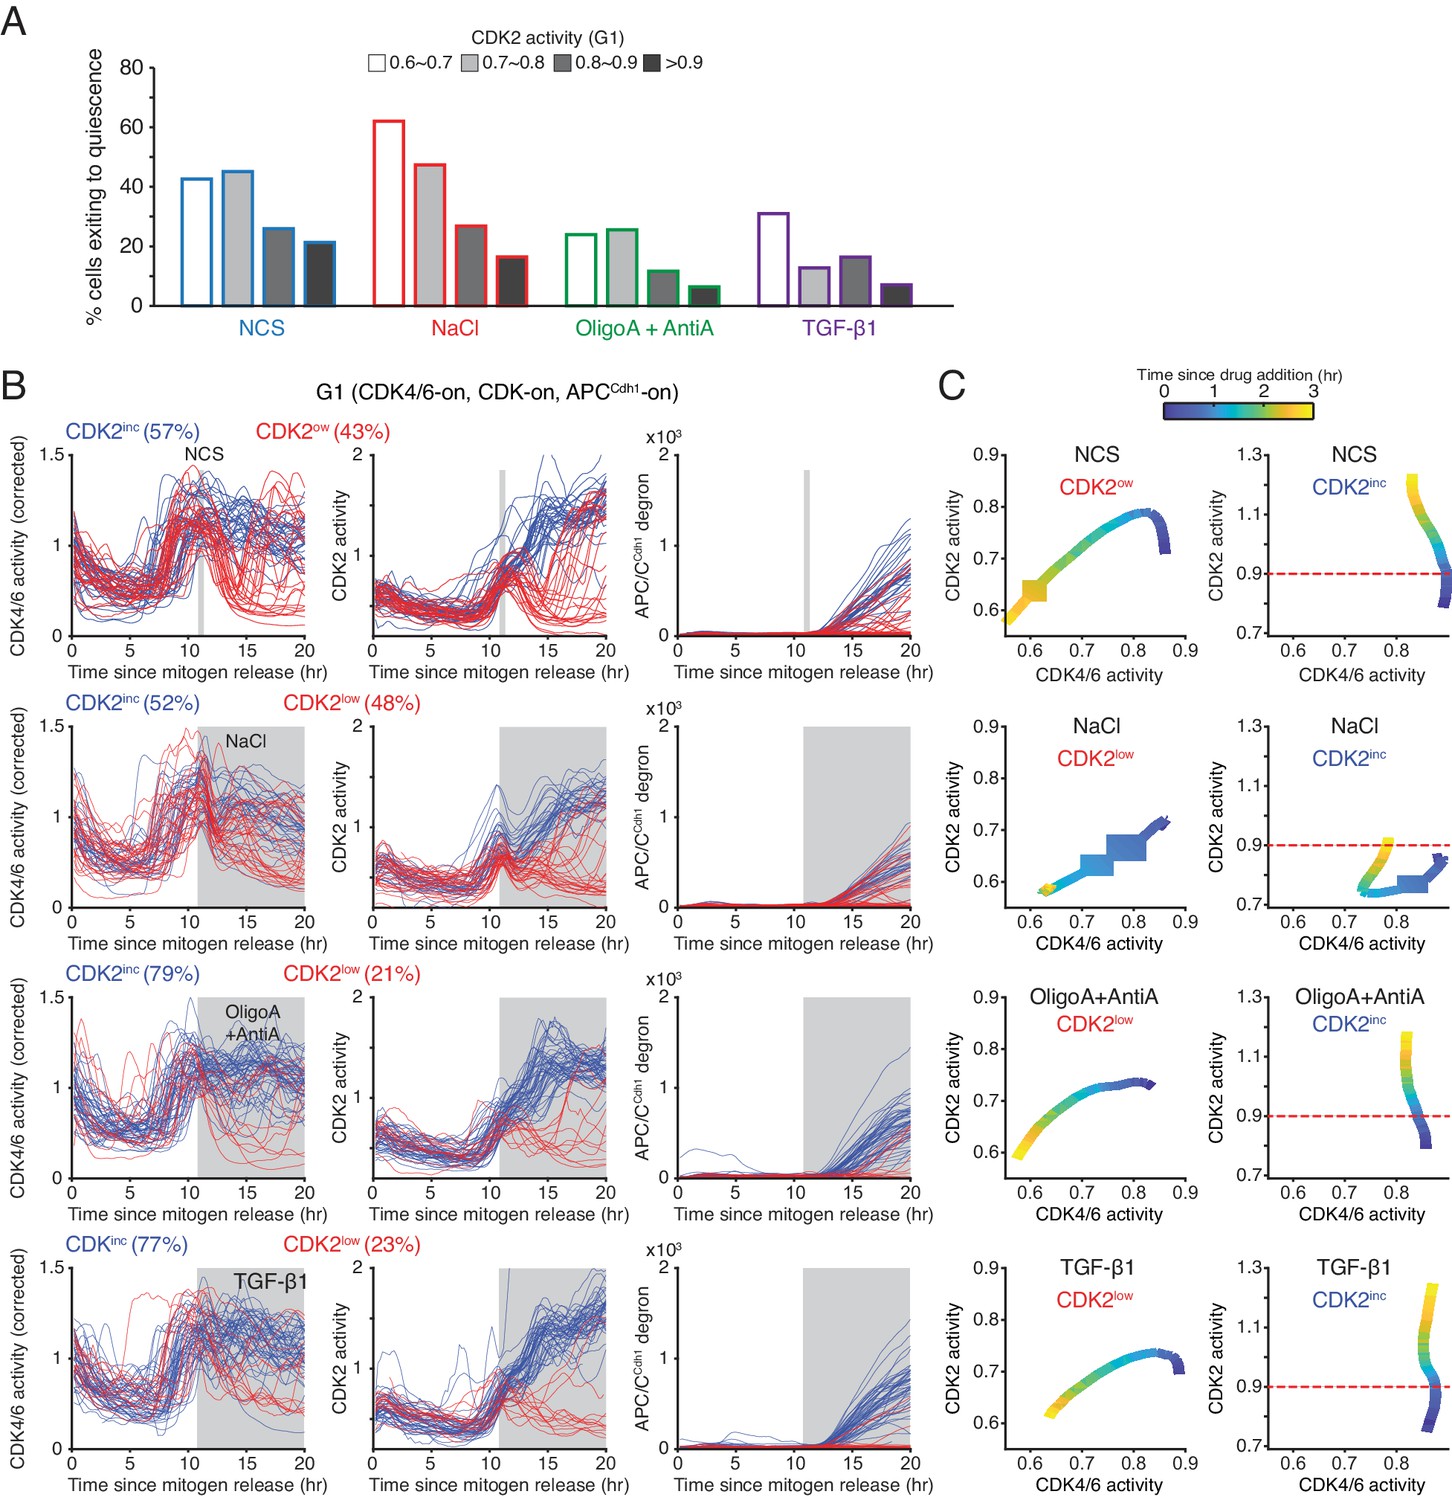
Probability of cells reversing CDK4/6 activation and cell-cycle entry decreases with increasing CDK2 activity.
(A) % cells inactivating CDK2 activity in response to Neocarziostatin (NCS, 200 ng/ml), NaCl (200 mM), Oligomycin A (1 µM) + Antimycin A (1 µM), and TGF-β1 (4 ng/ml). Only cells with active CDK4/6 and CDK2 in G1 at 11 hr after mitogen release were selected (n > 20 cells from 3 independent experiments). (B) Response of the CDK reporters and APC/C in G1 phase to various stress and TGF-β1 stimulation. Stresses were applied at 11 hr after mitogen release (gray area). NCS was added for 10 min and washed out with full growth media (gray area). Cells were classified based on their CDK2 activity after addition of stresses (CDK2inc or CDK2low). (C) Phase plot analysis of CDK2 versus CDK4/6 after application of various stresses. Time is color-coded (n > 30 cells from 3 independent experiments).
Additional files
-
Source data 1
Original data used for analysis in different figure panels figures.
- https://cdn.elifesciences.org/articles/44571/elife-44571-data1-v2.zip
-
Transparent reporting form
- https://cdn.elifesciences.org/articles/44571/elife-44571-transrepform-v2.docx
Download links
A two-part list of links to download the article, or parts of the article, in various formats.
Downloads (link to download the article as PDF)
Open citations (links to open the citations from this article in various online reference manager services)
Cite this article (links to download the citations from this article in formats compatible with various reference manager tools)
Stress-mediated exit to quiescence restricted by increasing persistence in CDK4/6 activation
eLife 9:e44571.
https://doi.org/10.7554/eLife.44571


