Cell-sized confinement controls generation and stability of a protein wave for spatiotemporal regulation in cells
- Keio University, Japan
- Tohoku University Katahira, Japan
- AIST, Japan
- The University of Tokyo, Japan
Figures
Figure 1 with 3 supplements
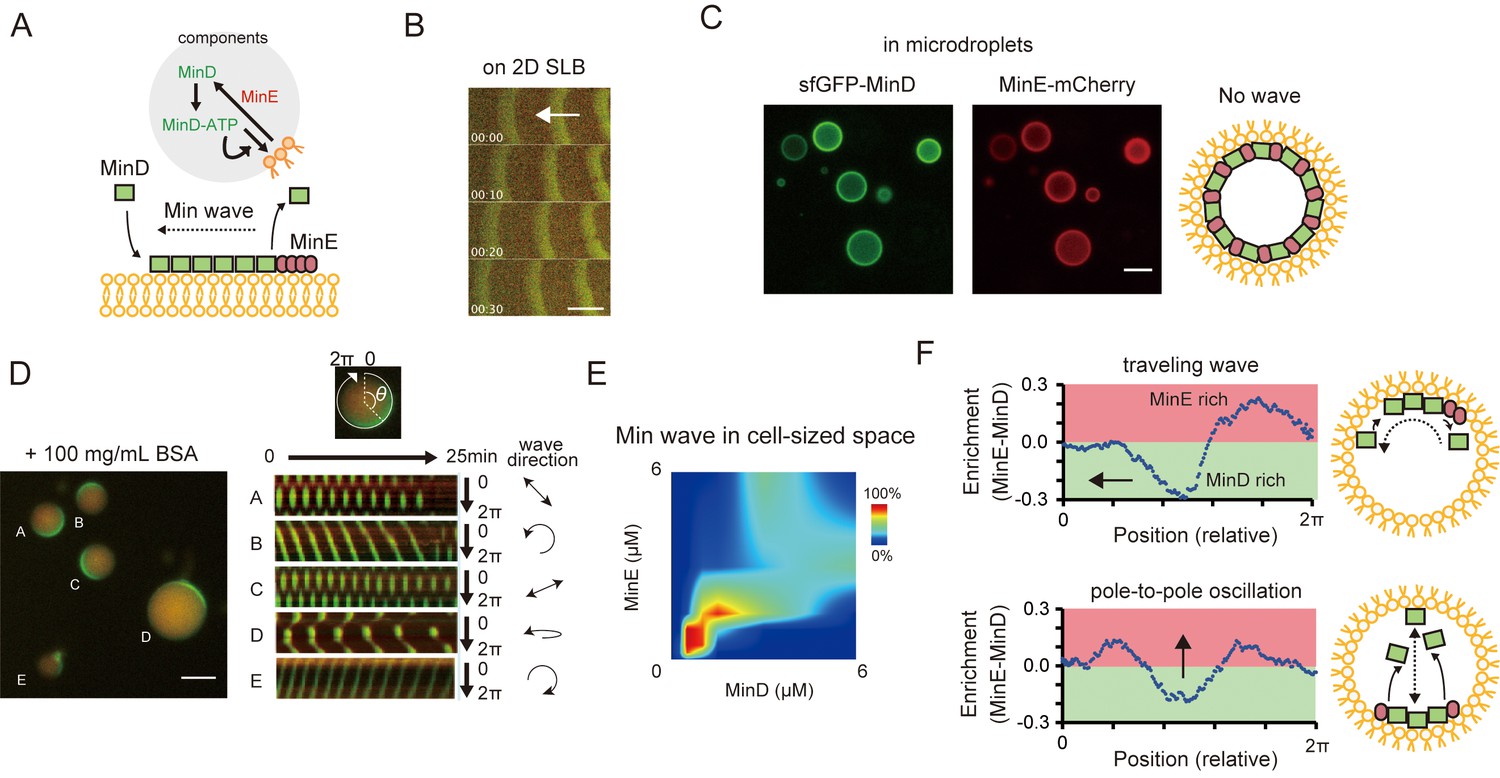
Min waves emergence in microdroplets as a result of high-concentration BSA addition.
(A) Schematic illustration of a simplified molecular mechanism underlying Min wave propagation and the experimental system. (B) Min waves on 2D supported lipid bilayers (SLB). (C,D) Microdroplets encapsulating 1 μM sfGFP-MinD, MinE-mCherry, and 2.5 mM ATP in the absence (C) or the presence of 100 mg/mL BSA (D). Scale bars: 10 μm. (D) Kymographs of sfGFP-MinD (green) and MinE-mCherry (red) in the proximity of membranes in each droplet are shown in the right half of the panel. Kymographs were generated by tracking fluorescence intensities along circumference lines on the membrane surface. Arrows beside the kymographs show the direction and mode of the Min wave. Single-round and double-headed arrows indicate a traveling wave and pole-to-pole oscillation, respectively. (E) Probability of inhomogeneous localization and wave propagation revealed by the reconstitution experiments at various concentrations of sfGFP-MinD and MinE-mCherry in microdroplets. (F) Enrichment profiles of MinD and MinE derived from normalized surface plots.
-
Figure 1—source data 1
Numerical data of Figure 1E.
- https://doi.org/10.7554/eLife.44591.006
Figure 1—figure supplement 1
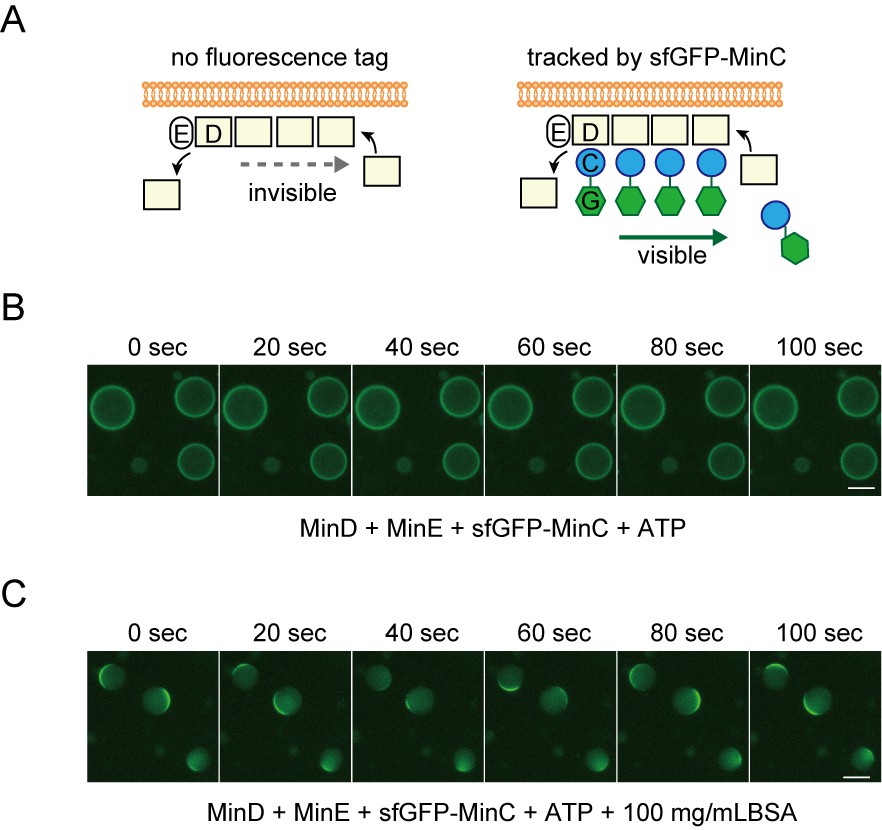
Tracking MinD by fluorescence-tagged MinC.
(A) Representative illustration of MinD tracking through the used of MinC fused with sfGFP at it's amino-terminal. The letters C, D, E, and G indicate MinC, MinD, MinE, and sfGFP, respectively. Because of interaction between MinD and MinC, sfGFP-MinC can track the movement of no-tagged MinD. (B, C) Time-lapse images of MinD tracked by sfGFP-tracking without (B) or with (C) 100 mg/mL BSA.
Figure 1—figure supplement 2
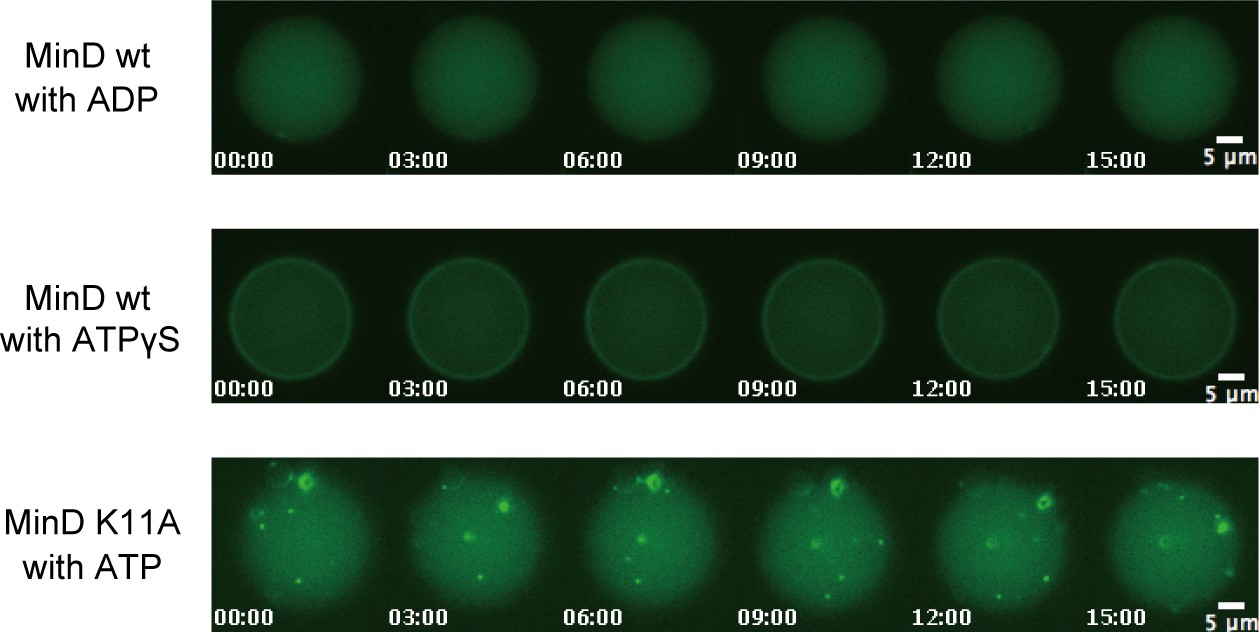
ATP dependence of the Min system for wave propagation in microdroplets containing 100 mg/mL BSA.
The ATP requirements of the Min wave were examined by replacing ATP with ADP or ATPγS, and MinD with an ATPase-deficient MinD mutant (K11A) (Zhou et al., 2005). Time-lapse images of MinD or its mutant in a representative droplet are shown.
Figure 1—figure supplement 3
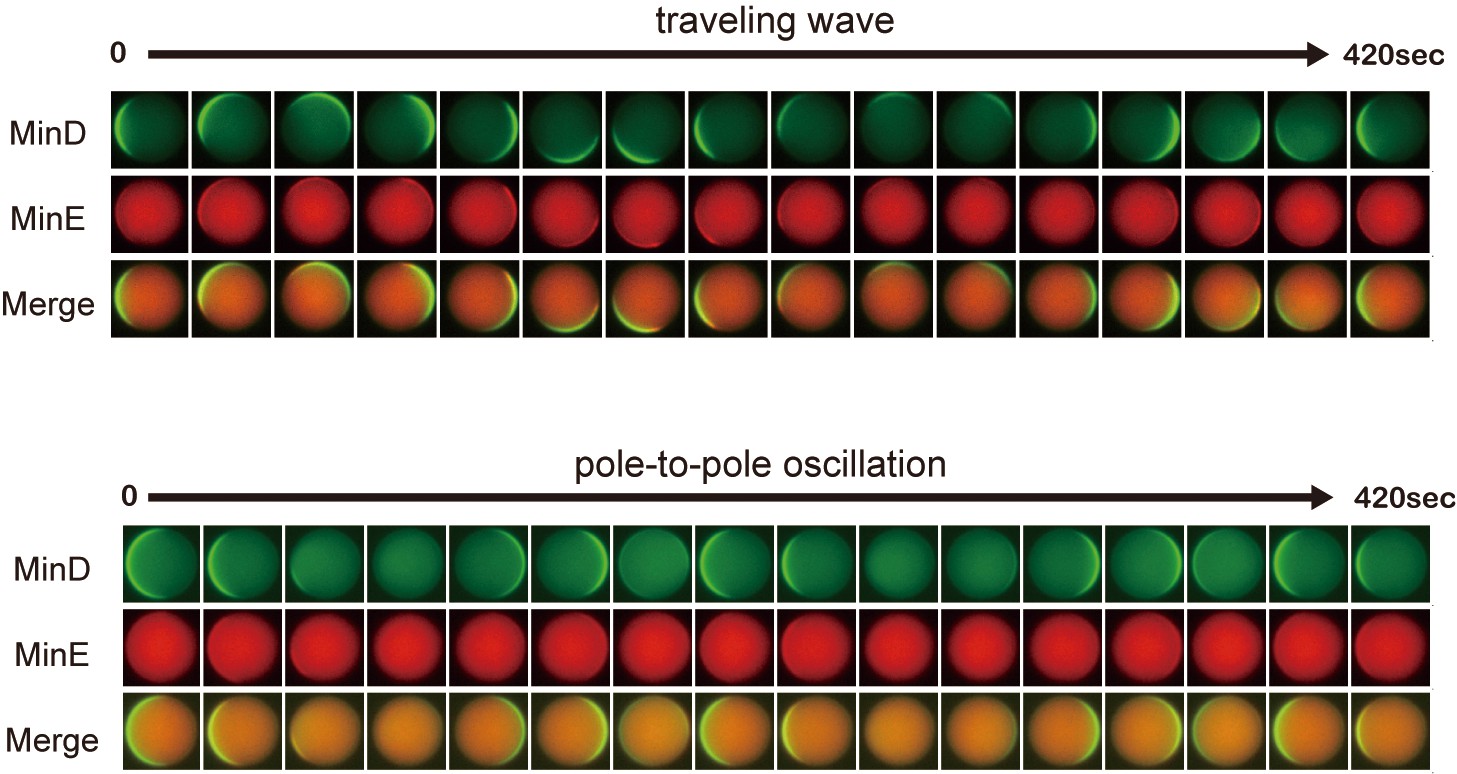
Time-lapse images of propagation waves in microdroplets.
Representative time-lapse images of traveling wave and pole-to-pole oscillation in microdroplets. The diameters of microdroplets are 25 μm (traveling waves) and 22 μm (pole-to-pole oscillation).
Figure 2 with 2 supplements
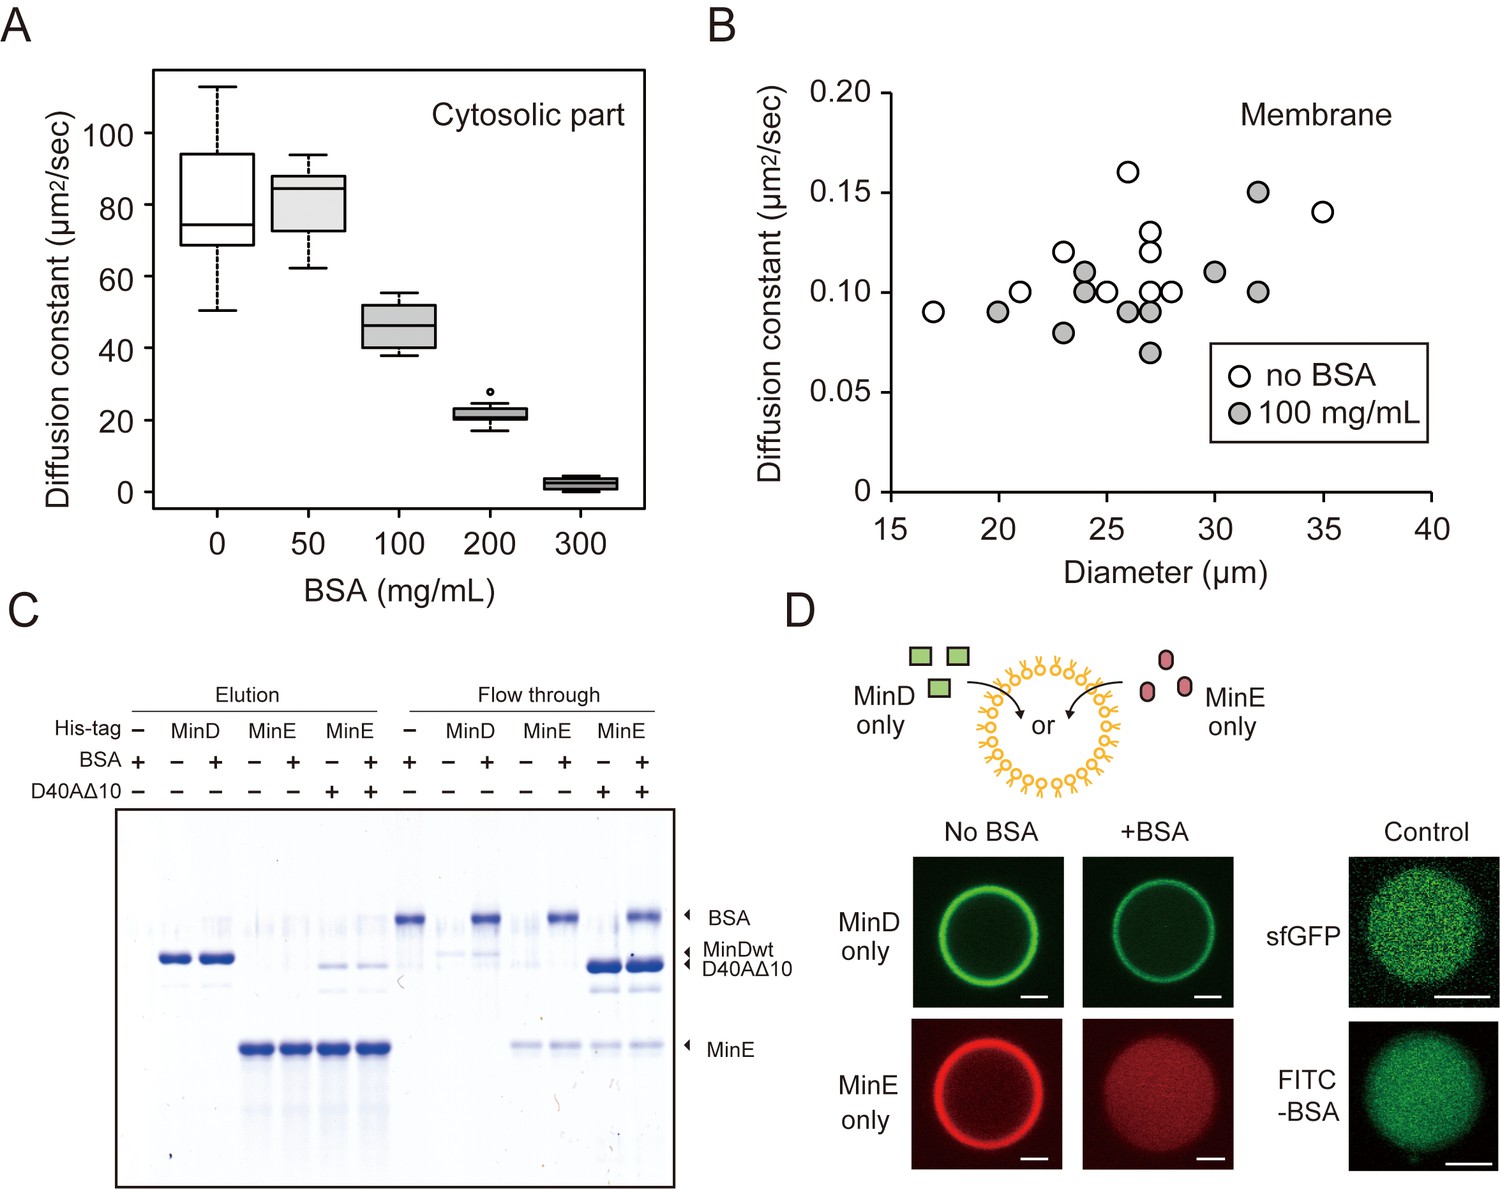
The effects of BSA on Min wave elements in cell-sized droplets.
(A) Diffusion coefficients of sfGFP in solutions with various BSA concentrations entrapped in microdroplets (n = 10). (B) Diffusion coefficients of sfGFP-MinD attached on lipid membranes with or without 100 mg/mL BSA (n = 10) plotted as a function of microdroplet diameters. (C) Pull-down assay for BSA and Min proteins. His-sfGFP-MinD, MinE-mCherry-His, or sfGFP-MinDD40AΔ10 with MinE-mCherry-His was incubated with Ni-NTA resins with or without BSA. The fractions eluted by imidazole and the flow through were visualized by CBB staining. (D) Inhibition of spontaneous binding between membranes and Min proteins by BSA. Either sfGFP-MinD or MinE-mCherry was encapsulated in the presence or absence of 50 mg/mL BSA. Microdroplets of 20 µm diameter are shown. As a control, the same experiments were performed using 1 μM sfGFP only or 5 μM FITC-labelled BSA with 5 μM BSA (total 0.67 mg/mL). Scale bars represent 5 μm.
Figure 2—figure supplement 1
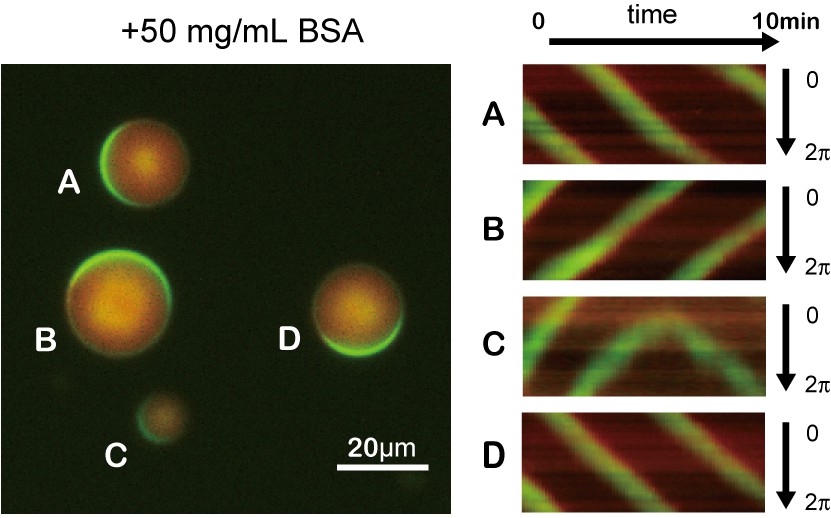
Traveling waves emerging in microdroplets containing 50 mg/mL BSA.
Kymographs of MinD and MinE on the membrane of each droplet. Green and red indicates sfGFP-MinD and MinE-mCherry, respectively.
Figure 2—figure supplement 2

Diffusion coefficients of MinE-mCherry attached on lipid membranes without BSA.
Diffusion coefficients are plotted as a function of microdroplet diameters.
Figure 3
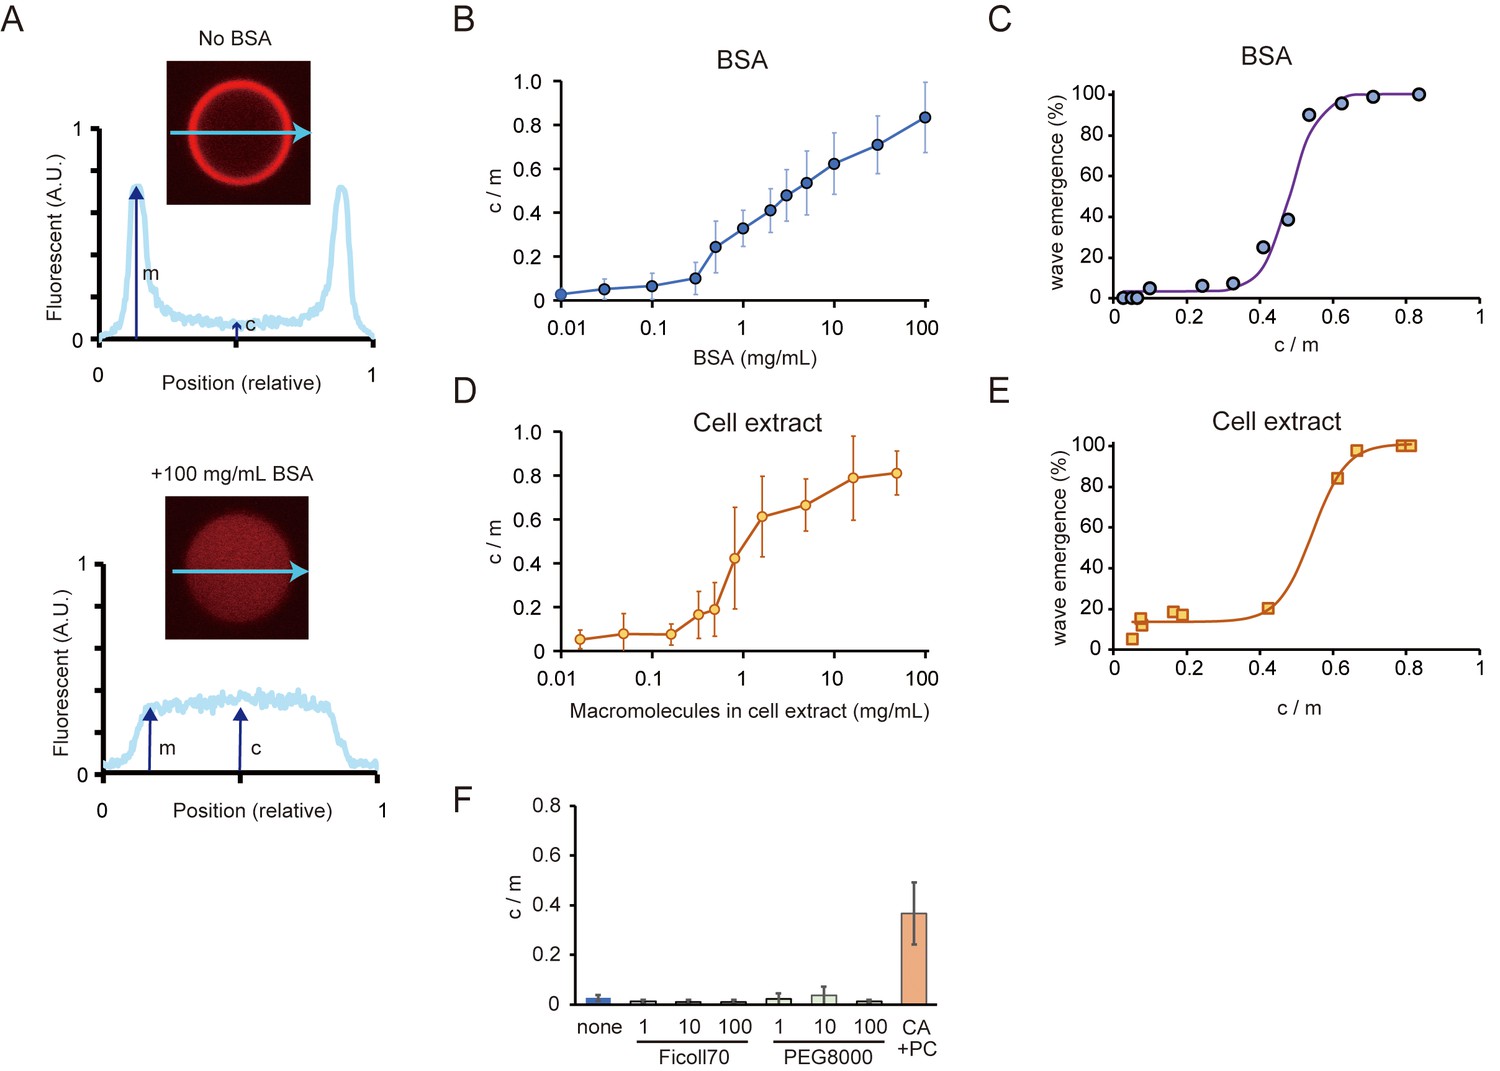
Relations between the rate of spontaneous localization of MinE on membranes and Min wave emergence.
(A) Schematic illustrations of the method to evaluate MinE localization (c/m). (B, D) Changes of c/m of MinE-mCherry at various BSA concentrations (B) and for different concentrations of macromolecules in the cell extract (D). (C, E) Percentages of microdroplets that have a Min wave plotted as a function of c/m as determined by BSA concentration(B) or concentration of E. coli cell extract (D), respectively. The fitting lines are sigmoidal curves. (F) Effects of macromolecular crowding agents (1, 10, 100 mg/mL) and the modified lipid condition (15% cardiolipin and 85% DOPC condition, abbreviated as CA + PC) on the c/m of MinE-mCherry. Microdroplets smaller than 30 μm in diameter were selected and the c/m of 1 µM MinE-mCherry was evaluated.
Figure 4 with 2 supplements
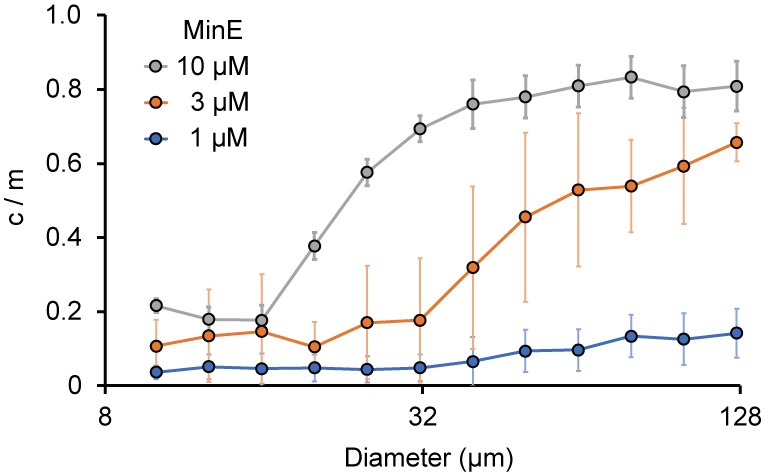
Size-dependence of c/m.
Spontaneous localization of MinE-mCherry is plotted against size of microdroplets. The average of c/m ratio at each 0.1 logarithmic scale are shown (n = 208 for 1 µM, 386 for 3 µM, and 184 for 10 µM). Error bars indicate standard deviations.
Figure 4—figure supplement 1
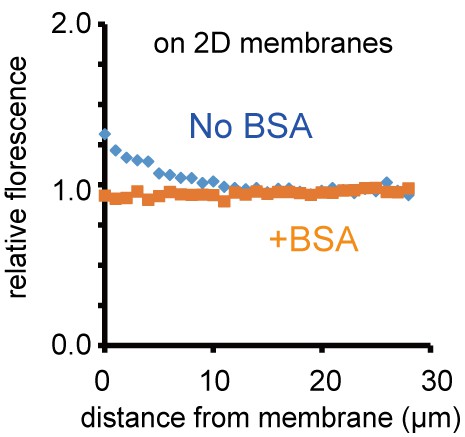
Localization of MinE near the two-dimensional planar membrane.
Localization of MinE near the two-dimensional SLB was analysed by confocal microscopy. Relative fluorescence intensity is plotted as a function of distance from the SLB. Fluorescence intensity was normalized by the value of 100 μm from two-dimensional SLB after subtraction of background noise.
Figure 4—figure supplement 2

Size-dependence of c/m in microdroplets contacting 10 mg/mL BSA.
Spontaneous localization ratios (c/m) of MinE-mCherry in microdroplets contacting 10 mg/mL BSA plotted against size of microdroplets.
Figure 5 with 1 supplement
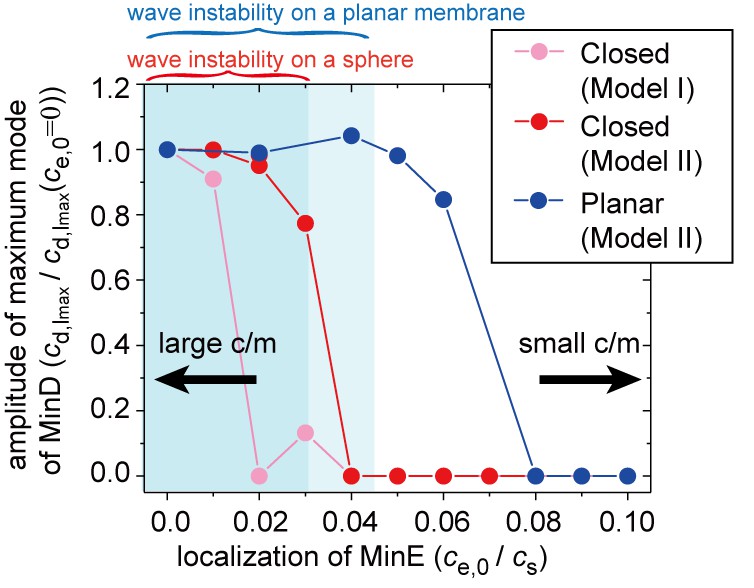
Simulation results for wave generation in the presence of membrane-attached MinE.
The simulation results for wave generation in the presence of spontaneous MinE interaction at = 0.5 and = 0.8 (see 'Materials and methods') are shown. Results are shown for the closed spherical membrane and for the planar membrane. Waves are characterized by the amplitude of the first mode () in spherical harmonics expansion of the closed membrane, and by the maximum amplitude at a finite wave number in the planar membrane. The amplitude is normalized by its value without spontaneous MinE localization. Stability data for the homogeneous state, calculated from the real part of the maximum eigenvalue, show that the homogeneous state is stable in the closed membrane (dark-shaded area) and planar membrane (light shaded area), but linearly unstable otherwise.
Figure 5—figure supplement 1
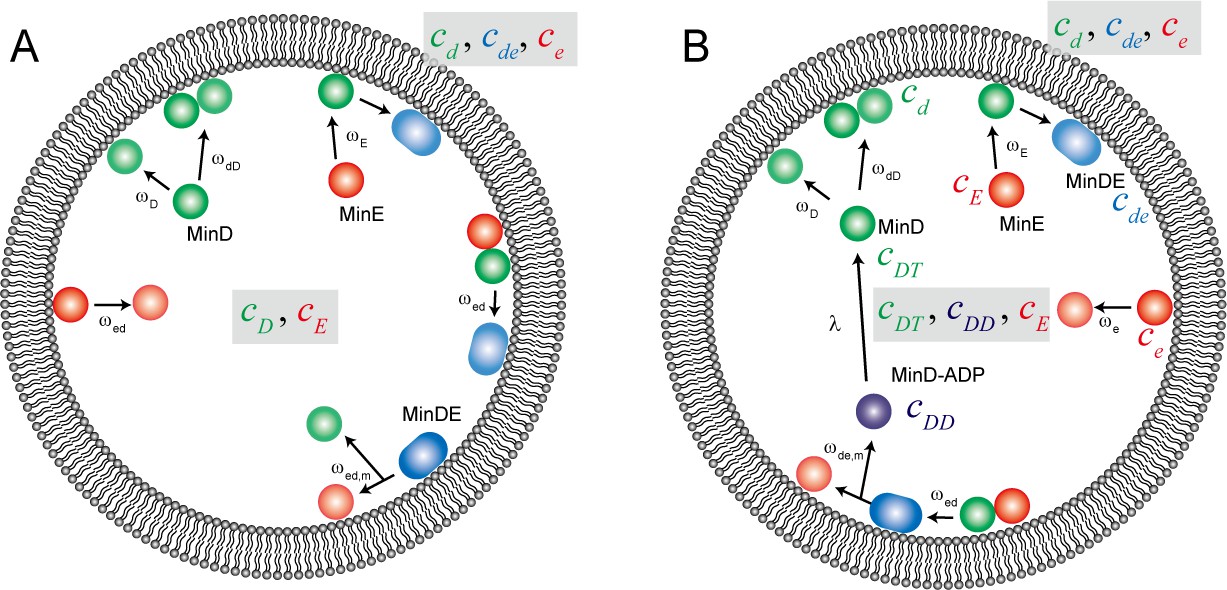
Reaction scheme for computational simulation of Min waves in a cell-sized space.
Schematic illustration of the reaction constants used in our computational simulation model ((A) for model I, (B) for model II).
Figure 6 with 1 supplement
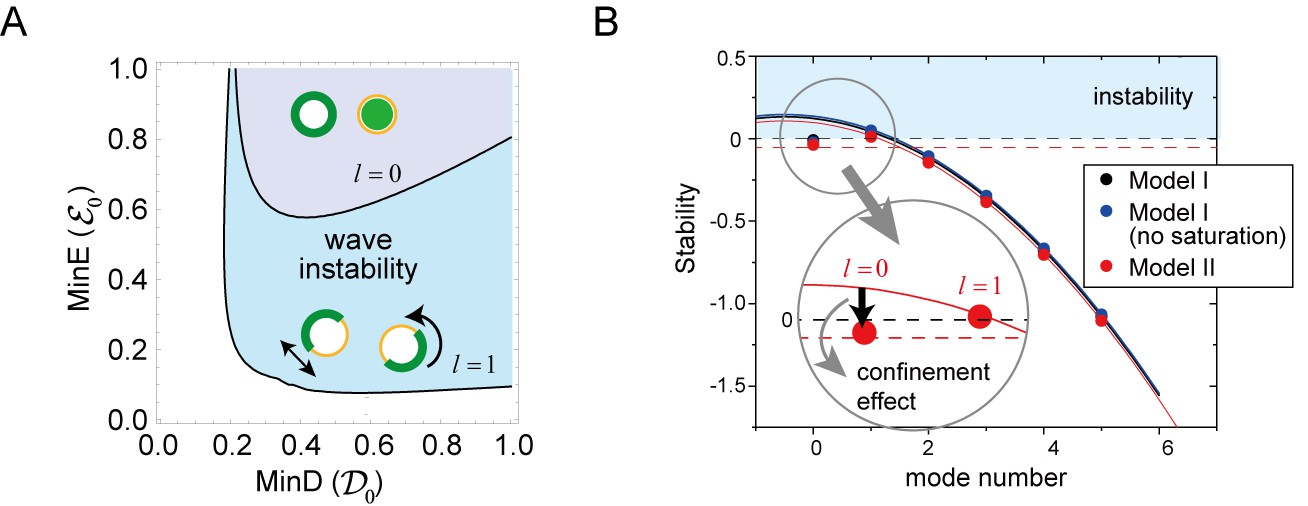
Regulation of the generation and stability of Min waves by confinement.
(A) The phase diagram obtained from linear stability analysis of wave instability (the first mode, ) and homogeneous oscillation (the zero mode, ) under various total concentrations of MinD and MinE in the closed membrane of size in Model II. (B) Stability of the homogeneous state for each mode obtained by a real part of the eigenvalue in different models near the transition point of wave generation, = 0.2 and = 0.8. Instability is demonstrated by positive eigenvalues. The black dashed line indicates neutral stability in which the real part of the eigenvalue is zero. The theoretical results, which are an under approximation that neglect the effect of bulk dynamics, are demonstrated by the solid lines (see 'Materials and methods' and Figure 6—figure supplement 1). Each color (blue and red) corresponds to a different model. The dashed red line shows the stability of the homogeneous state theoretically obtained by including the effect of confinement.
-
Figure 6—source data 1
Numerical data of Figure 6B.
- https://doi.org/10.7554/eLife.44591.026
Figure 6—figure supplement 1
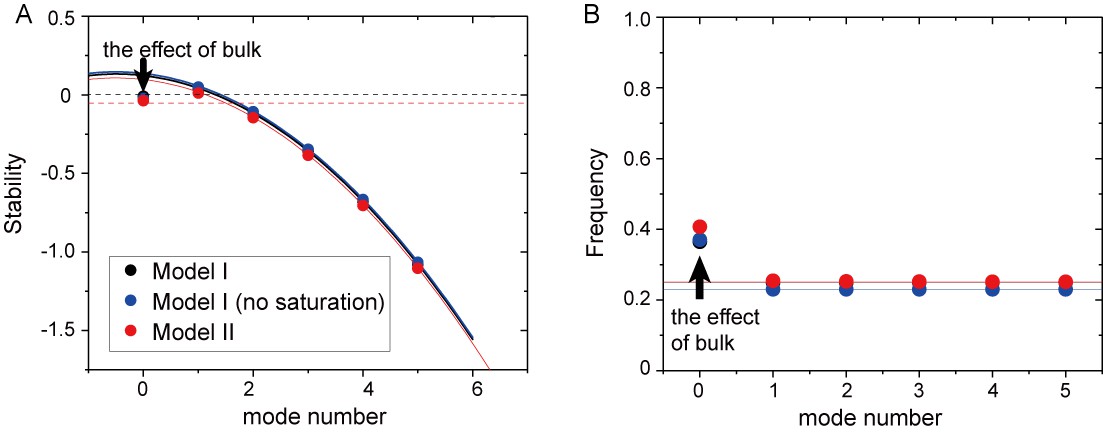
Mode dependence of stability and frequency in the different models obtained from linear stability analysis.
(A) Real part of eigenvalues. The dashed black line denotes a zero eigenvalue. (B) Imaginary part of eigenvalues. The stability and frequency obtained from the analysis without the effect of bulk is shown by solid lines for Model I (black), Model I without saturation term (blue), and Model II (red). The dashed red line in (A) shows the stability of the homogeneous state with the effect of confinement.
Figure 7
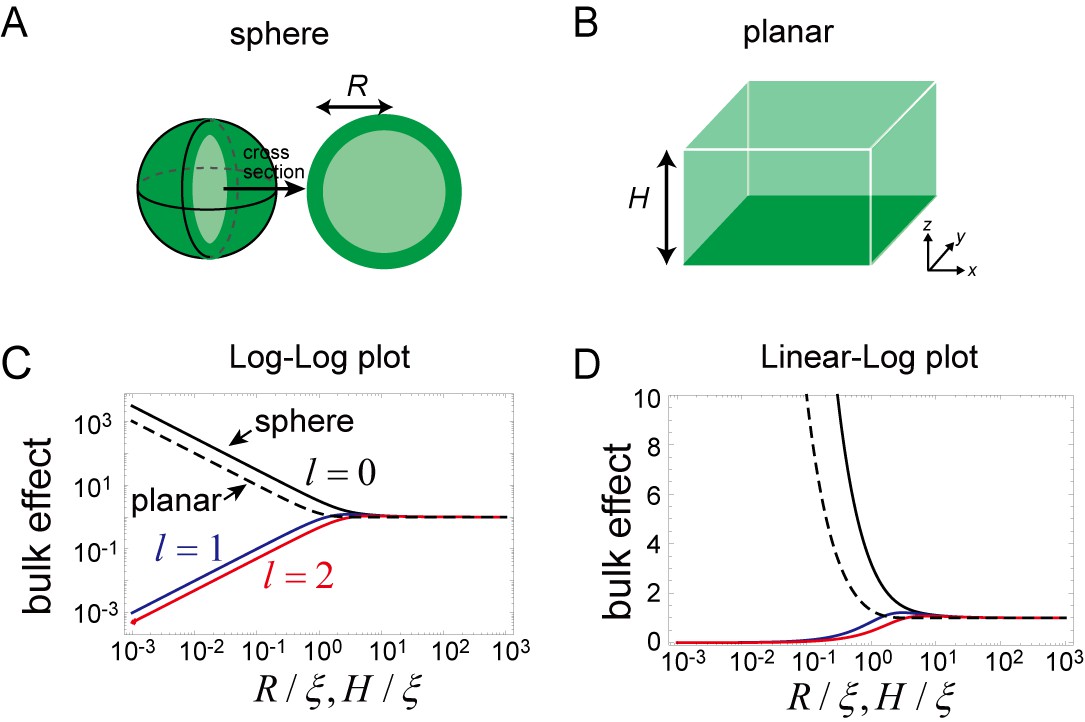
Effects of bulk in the models.
(A, B) Schematic illustration of a closed membrane with the radius R (A) and a planar membrane with the height H(B). Membrane-bound proteins are denoted by dark green color, while bulk proteins are shown in light green. (C, D) The log-log (C) and log-linear (D) plots of as a function of . The homogeneous mode (, black) and the two lowest inhomogeneous modes (, blue, and , red) are shown as solid lines. The corresponding term in the planar membrane, as a function of , is shown as a dashed line.
Figure 8
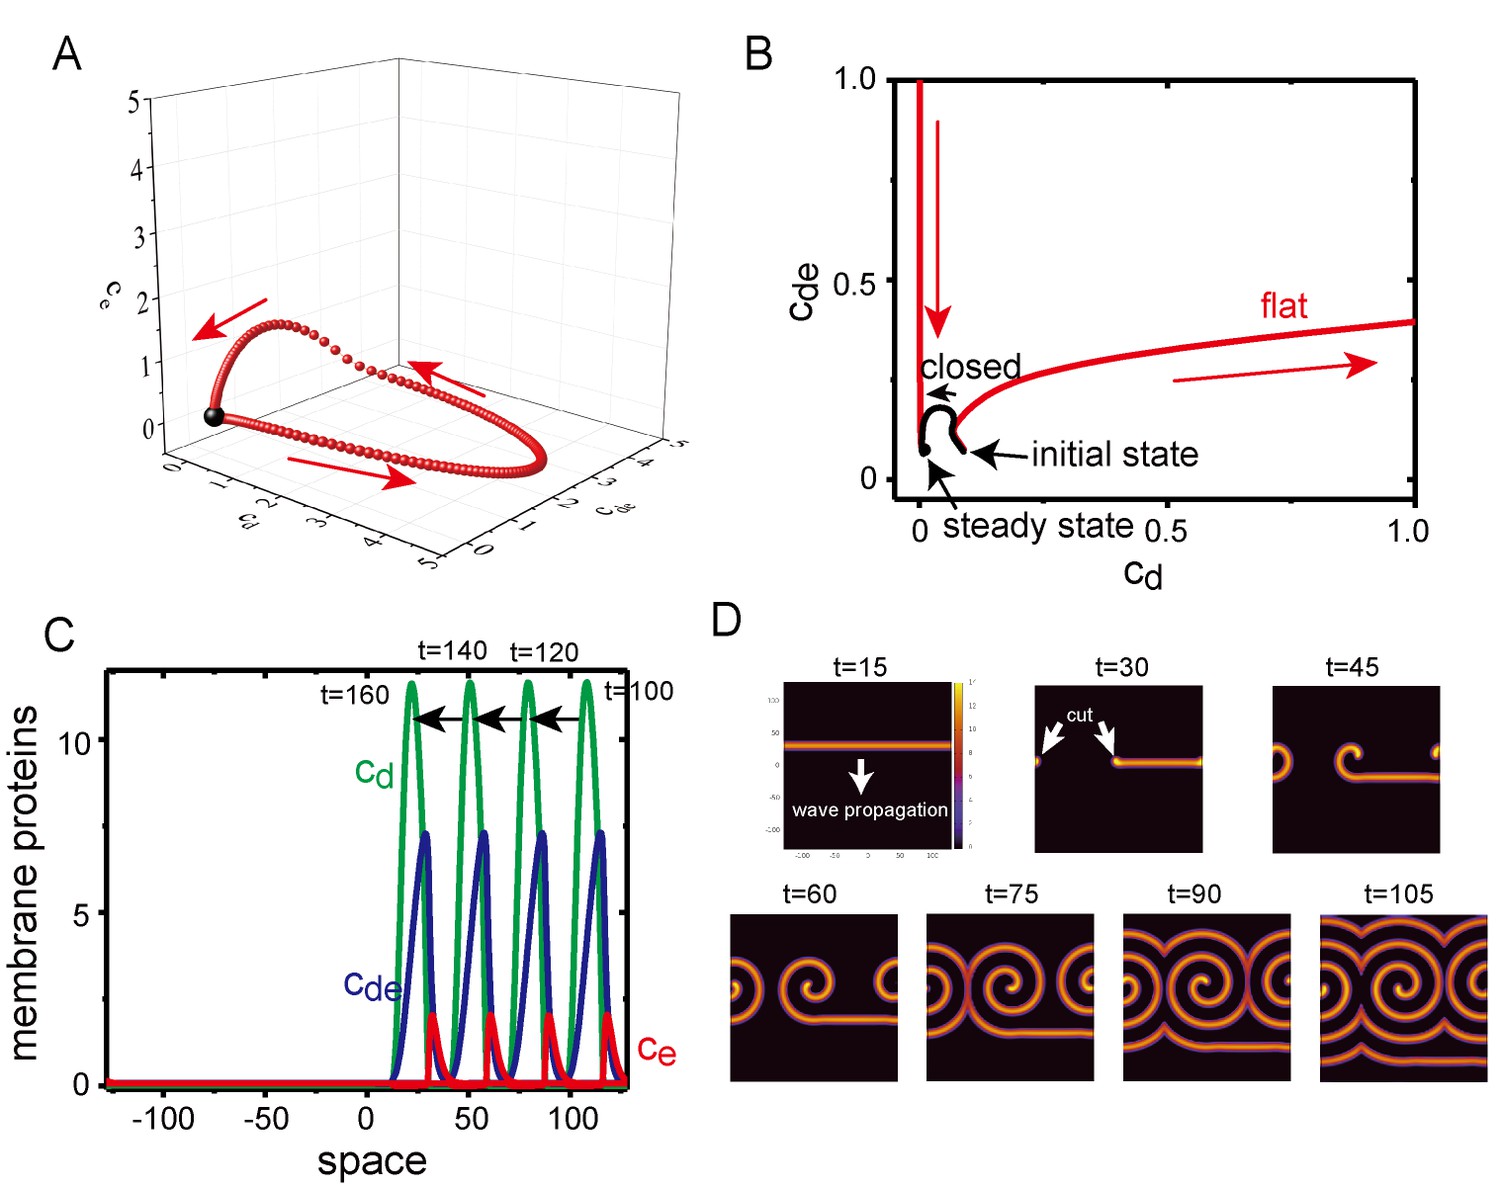
Excitability of Min waves on the planar membranes.
(A) Trajectory of the concentrations of membrane proteins in coordinates starting from the initial condition slightly shifted from the homogeneous stationary state at = 0.5, = 0.8 and . (B) Trajectory near the stationary state in the plane on aplanar membrane (, red) and on a closed membrane (, black). (C) A propagating pulse in a one-dimensional membrane surrounded by a two-dimensional bulk. (D) A propagating band and a spiral wave in a two-dimensional planar membrane underneath the three-dimensional bulk. Initially, an isolated band is prepared and allowed to propagate, before being cut at to make a spiral wave.
-
Figure 8—source data 1
Numerical data of Figure 8A.
- https://doi.org/10.7554/eLife.44591.029
Figure 9
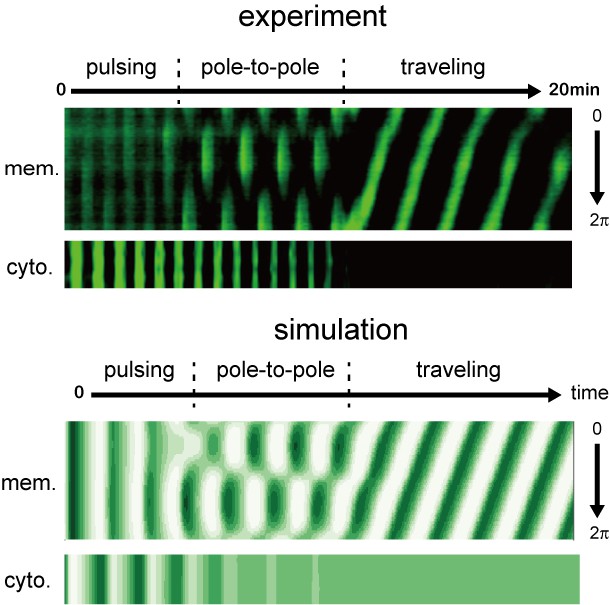
Early stages of Min wave emergence inside microdroplets and on 2D membranes.
Transition of patterns from pulsing during the initial stage of wave emergence to the formation of a stable traveling wave. Kymographs of sfGFP-MinD in the membranes and inner media of droplets obtained by experiments (top) and numerical simulation without noise (bottom) are shown.
Videos
Video 1
Behaviors of Min proteins entrapped in microdroplets.
https://doi.org/10.7554/eLife.44591.007
Video 2
Wave propagation of Min proteins in microdroplets with a lipid mixture (85% DOPC and 15% cardiolipin).
https://doi.org/10.7554/eLife.44591.008
Video 3
Wave propagation of Min proteins in microdroplets containing 100 mg/mL BSA.
https://doi.org/10.7554/eLife.44591.009
Video 4
Behavior of Min proteins entrapped in microdroplets containing 100 mg/mL PEG8000.
https://doi.org/10.7554/eLife.44591.010
Video 5
Behavior of Min proteins entrapped in microdroplets containing 100 mg/mL Ficoll70.
https://doi.org/10.7554/eLife.44591.011
Video 6
Wave propagation of non-tagged MinD tracked by sfGFP-MinC in microdroplets containing 100 mg/mL BSA.
https://doi.org/10.7554/eLife.44591.012
Video 7
Wave propagation of Min proteins in microdroplets containing 16 mg/mL macromolecules in cell extract.
https://doi.org/10.7554/eLife.44591.017
Video 8
Time development during the initial stages of MinD single waves in lipid droplets using Model I (simulation).
https://doi.org/10.7554/eLife.44591.021
Video 9
The initial stages of the emergence of MinD single waves in lipids droplets.
https://doi.org/10.7554/eLife.44591.031Additional files
-
Transparent reporting form
- https://doi.org/10.7554/eLife.44591.032
Download links
A two-part list of links to download the article, or parts of the article, in various formats.
Downloads (link to download the article as PDF)
Open citations (links to open the citations from this article in various online reference manager services)
Cite this article (links to download the citations from this article in formats compatible with various reference manager tools)
Cell-sized confinement controls generation and stability of a protein wave for spatiotemporal regulation in cells
eLife 8:e44591.
https://doi.org/10.7554/eLife.44591


