Independent amylase gene copy number bursts correlate with dietary preferences in mammals
- University at Buffalo, The State University of New York, United States
- Foundation for Research and Technology – Hellas, Greece
- Plattsburgh State University, United States
- Cornell University, United States
- Friedrich-Loeffler-Institut, Federal Research Institute for Animal Health, Germany
Figures
Figure 1 with 1 supplement
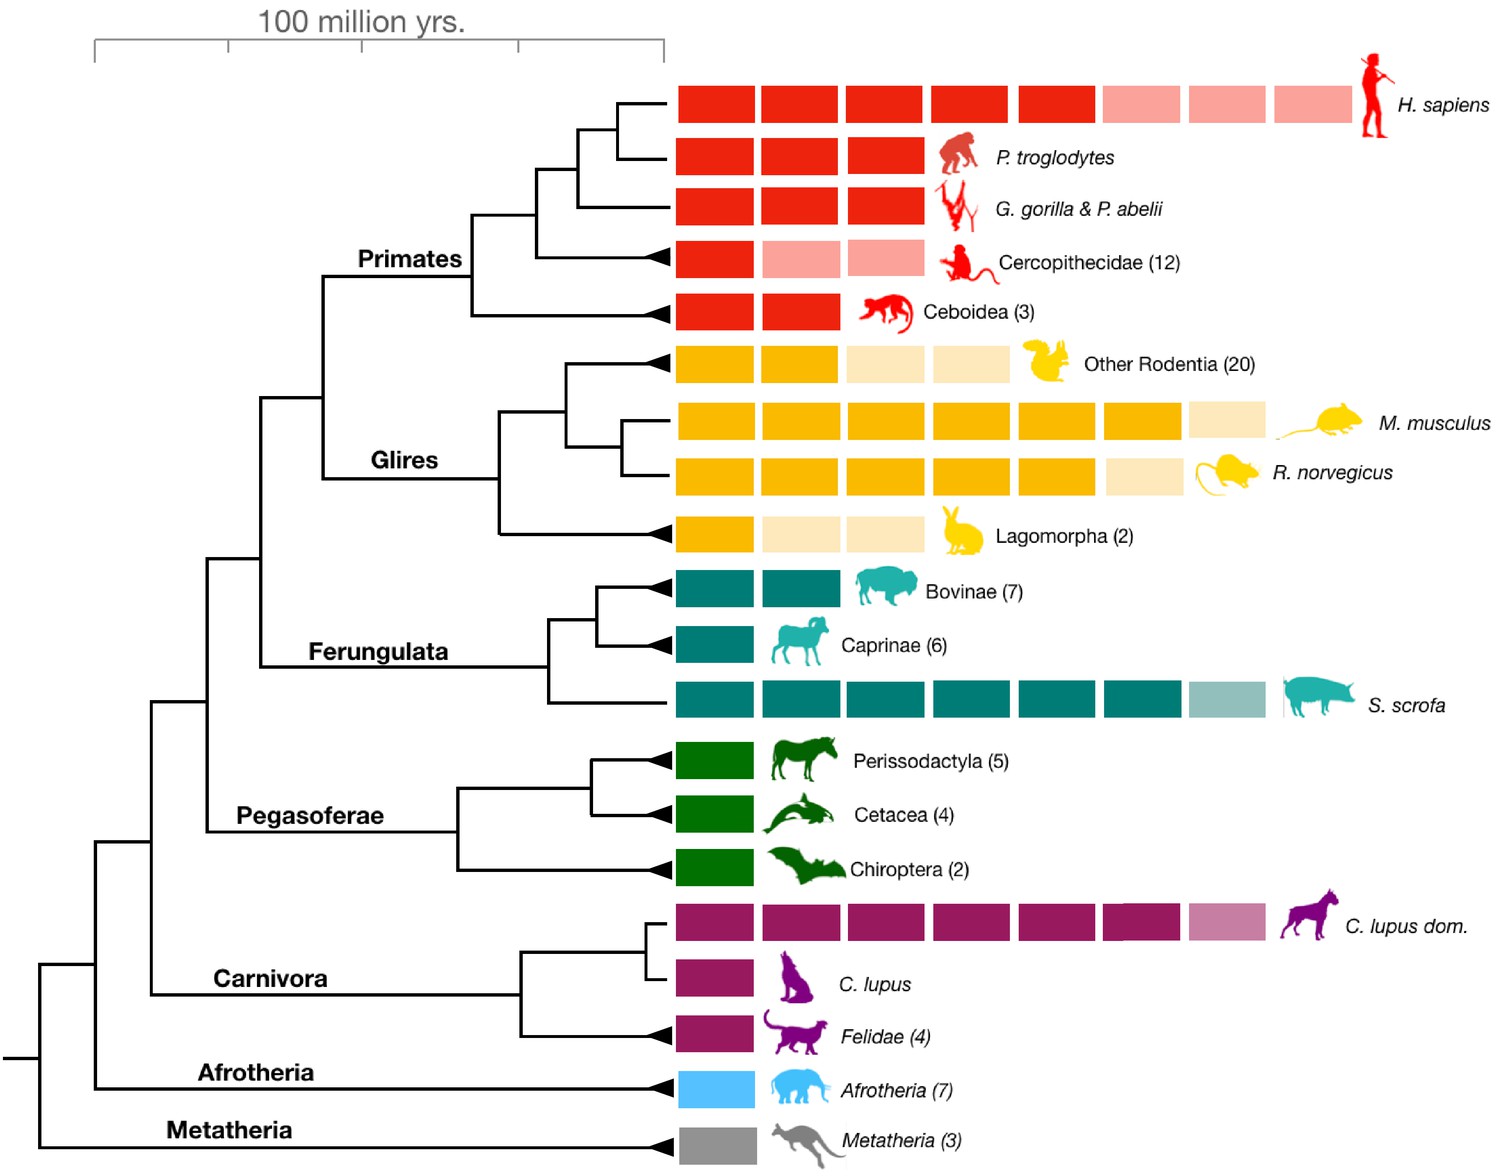
Amylase gene copy number bursts across mammals.
Boxes represent all haploid amylase gene copies found in representative species or among clades across the mammalian phylogeny (see Supplementary file 1 for a comprehensive dataset). Lighter colored boxes represent the variation in copy numbers found in at least two individuals of a given species or in reference genomes of at least two species within a clade. Triangles at the end of branches indicate that copy numbers of more than one species belonging to the same clade were shown together as a single column. The numbers in parentheses following clade names indicate the number of species used for estimating the gene copy numbers.
Figure 1—figure supplement 1

Primer design and ddPCR accuracy.
(a) Primer/probe sets were designed to match all the AMY gene copies in a given reference genome. For example, in the case of the five haploid copies in humans, the primers and probe were designed to match 100% to all five gene copies of amylase. (b) A schematic phylogeny showing the strategy behind primer design for species where a reference genome was not available. For example, to design a primer/probe set for zebra, we designed oligonucleotide sequences that match the closest relatives of zebra for which reference genomes were available (in this case: donkey and horse). (c) Correlation between AMY gene copy numbers estimated by BLAST analysis of reference genomes and our estimates by ddPCR analysis (mean gene copy number of all individuals measured for any given species). The y-axis represents the haploid copy numbers obtained from available references genomes. The x-axis represents copy numbers derived from our ddPCR analysis (n = 31 species). A linear regression line is plotted to visualize the correlation.
Figure 2 with 2 supplements
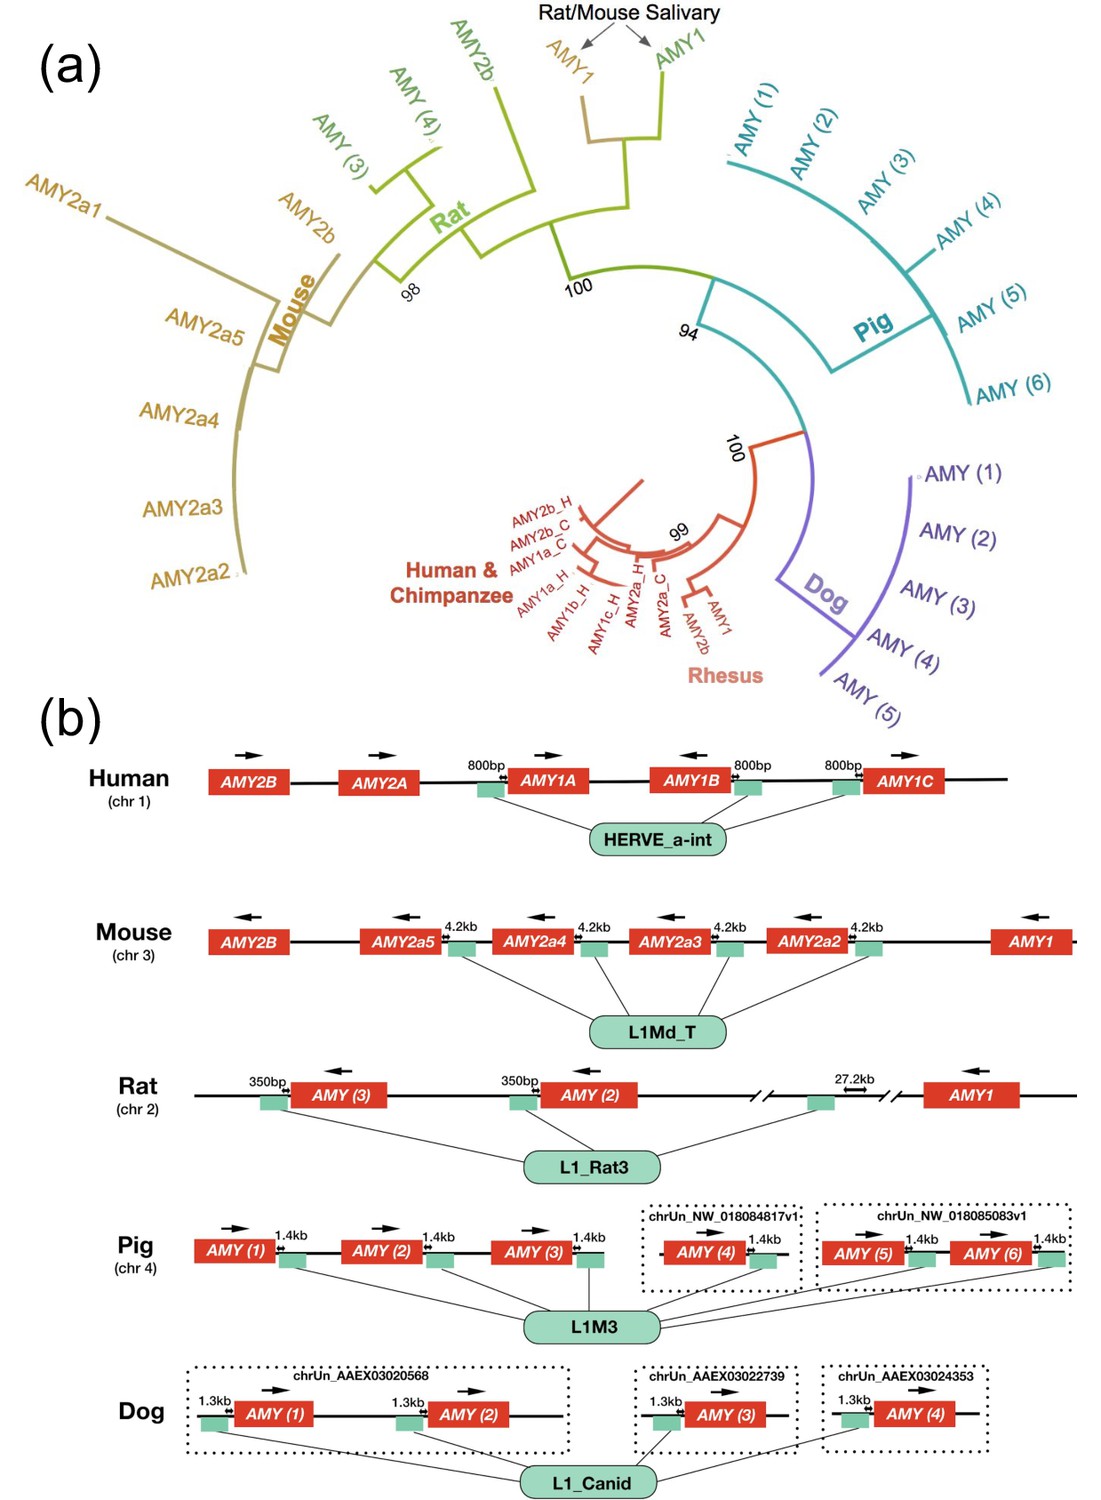
Amylase duplications evolved independently.
(a) Maximum likelihood tree based on phylogenetic similarity of amino acid sequences of amylase gene copies translated from copies identified by BLAST. Bootstrap values are shown next to the major branch splits. A larger tree containing all bootstrap values and additional outgroup species can be found in Figure 2—figure supplement 1. (b) Types and locations of retrotransposons associated with amylase gene copies found in human, mouse, rat, dog and pig reference genomes. Small green boxes symbolize the positions of the retrotransposons. Arrows above individual amylase gene copies indicate the direction of transcription. Distances in kilobases between amylase gene copies and associated retrotransposons are shown above the green boxes. Non-assembled contigs are shown in dotted frames. Two major gaps around the third retrotransposon in the rat amylase locus are indicated as line breaks.
Figure 2—figure supplement 1
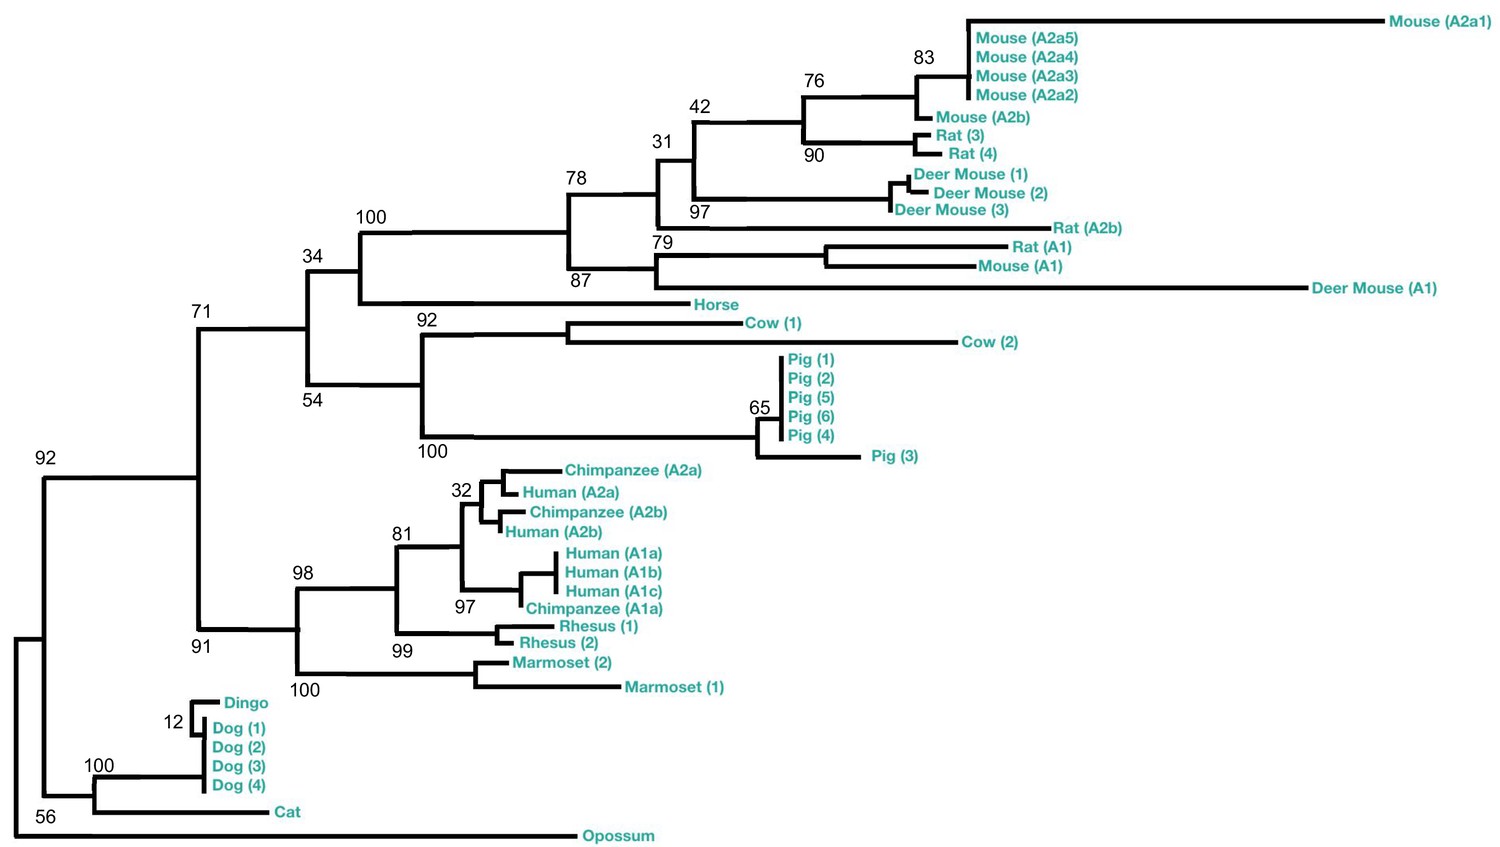
Expanded maximum likelihood amylase gene tree of mammalian reference genome sequences (PhyML).
The number in parentheses distinguishes specific amylase genes in a given species. If AMY gene copies were previously annotated, we used that annotation (e.g. A2a5 in the mouse is amylase A2a5 by USCS Gene Track). If the gene copy was not annotated, numbers were used for different copies (shown in parentheses).
Figure 2—figure supplement 2

RNA-sequencing data for expression of amylase genes in mouse parotid salivary gland.
Green boxes on the x-axis represent the gene order on the mouse reference genome. The y-axis is drawn in log scale and represents the fragments per kilobase of exon per million reads (FPKMS) from RNA sequencing. Vertical bars designate the average FPKMS read coverage for RNA from two adult mice (12 weeks of age) for their parotid salivary glands. The gene schematic diagram displays the RNA sequencing coverage across the exons of amy1. Data were extracted from Gluck et al. (2016).
Figure 3
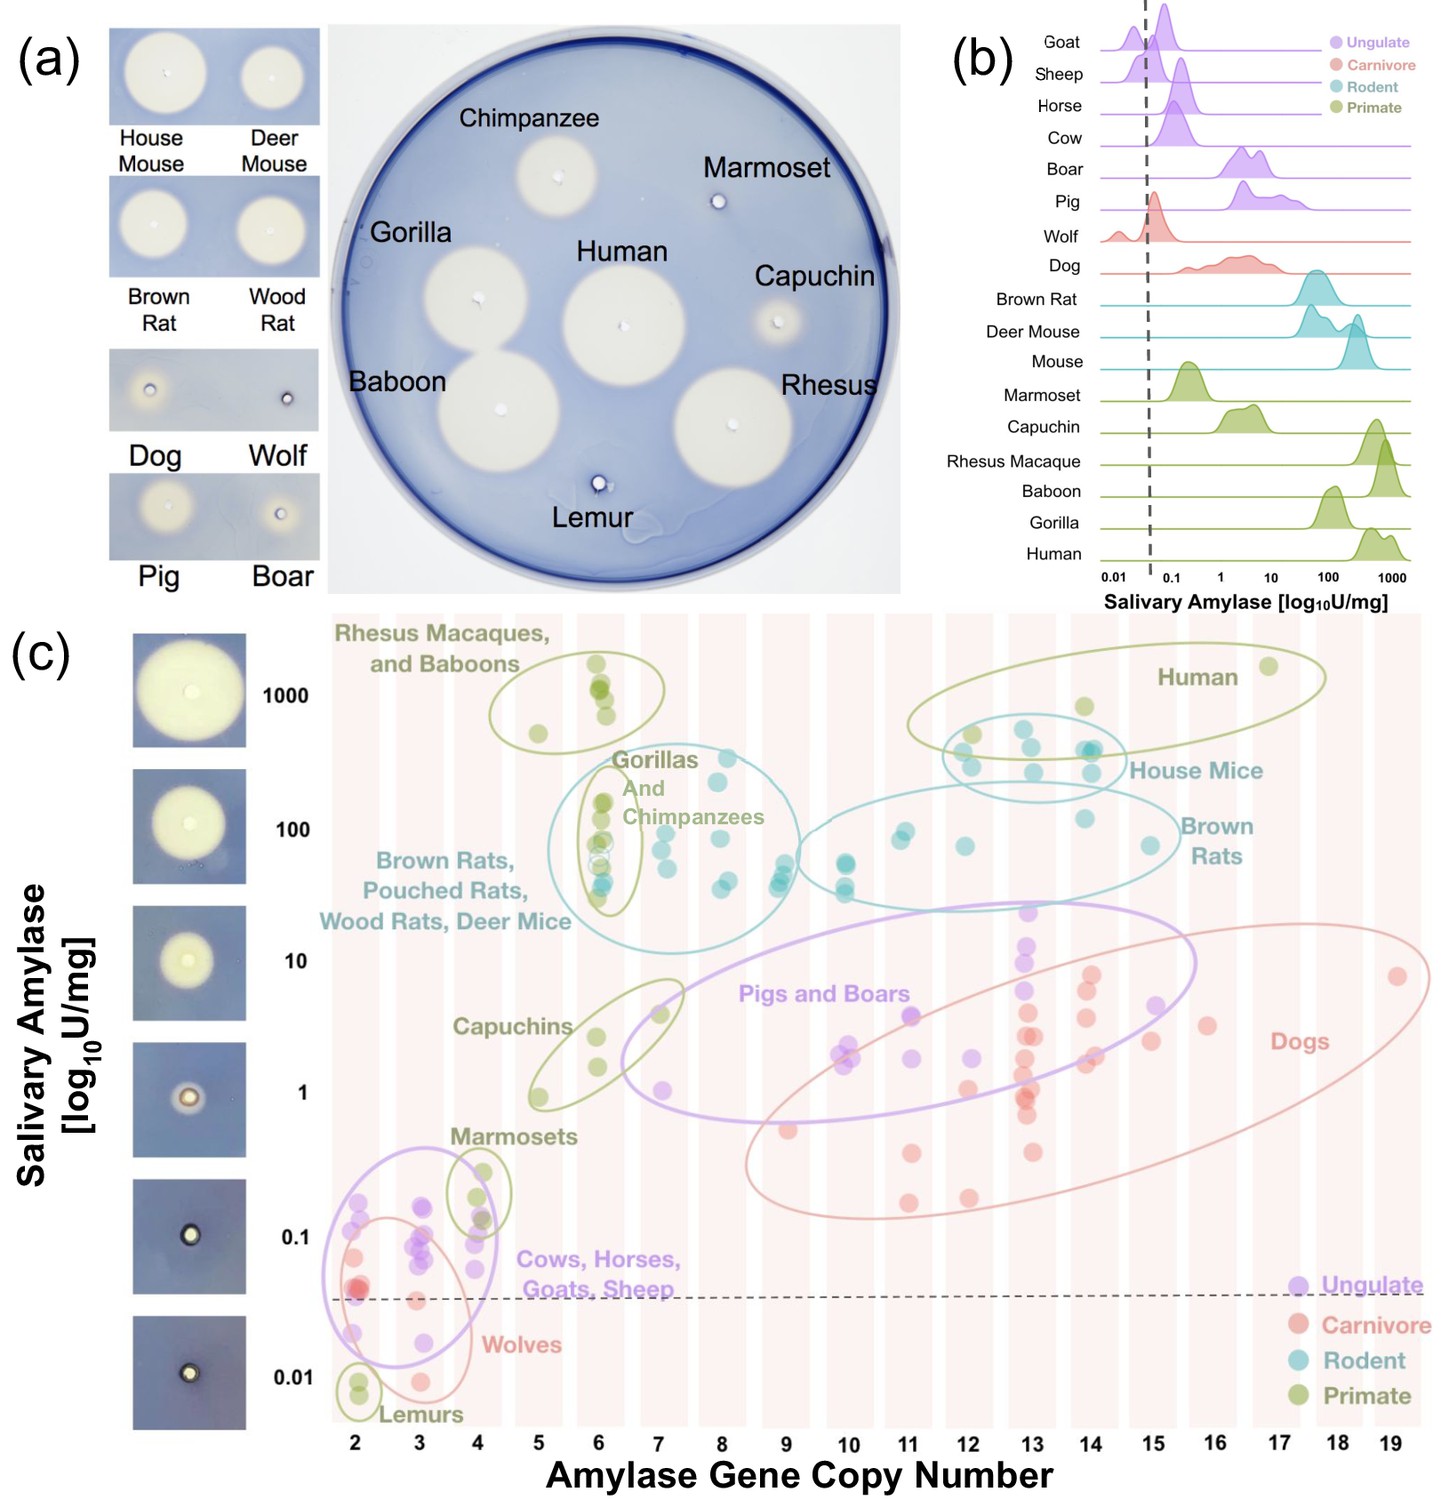
Salivary amylase activity and relationship to gene copy number.
(a) Representative starch lysis plate assay showing the extent of lysis caused by the enzymatic activity of amylase in the saliva of various mammalian species. The left panel shows side-by-side comparisons of domesticated species and their counterparts in the wild. The agar plate shows the lysis caused by representative primate saliva samples. (b) Density plots showing salivary amylase activity in different species as measured by a high-sensitivity colorimetric assay. The dotted line represents the mean amylase activity level determined in the serum of humans, rats, pigs, boars, and gorilla (mean: 0.034 U/mg, range: 0.01–0.077 U/mg). A full dataset can be found in Supplementary file 1. (c) Scatter plot of amylase activity and gene copy number in multiple species as measured by ddPCR. The dotted line represents the same serum activity shown in (b). Images of starch plate lysis caused by standard dilutions of amylase are shown to the left of the y-axis next to their corresponding activity values.
Figure 4

Amylase gene copy numbers and salivary enzyme activity in species with different dietary preferences.
Box plots representing (a) AMY gene copy numbers and (b) salivary amylase activities (in units per milligram of total salivary protein) in mammalian species assigned by their dietary preferences into either specialized (carnivore or herbivore) or broad-range. The species consuming a broad-range diet were further sub-grouped into two categories based on the relative amounts of starch in their diet. (c) Estimates of statistical significances for the differences found between dietary groups. p-values were calculated for independent contrasts to account for phylogenetic confounding effects.
Figure 5
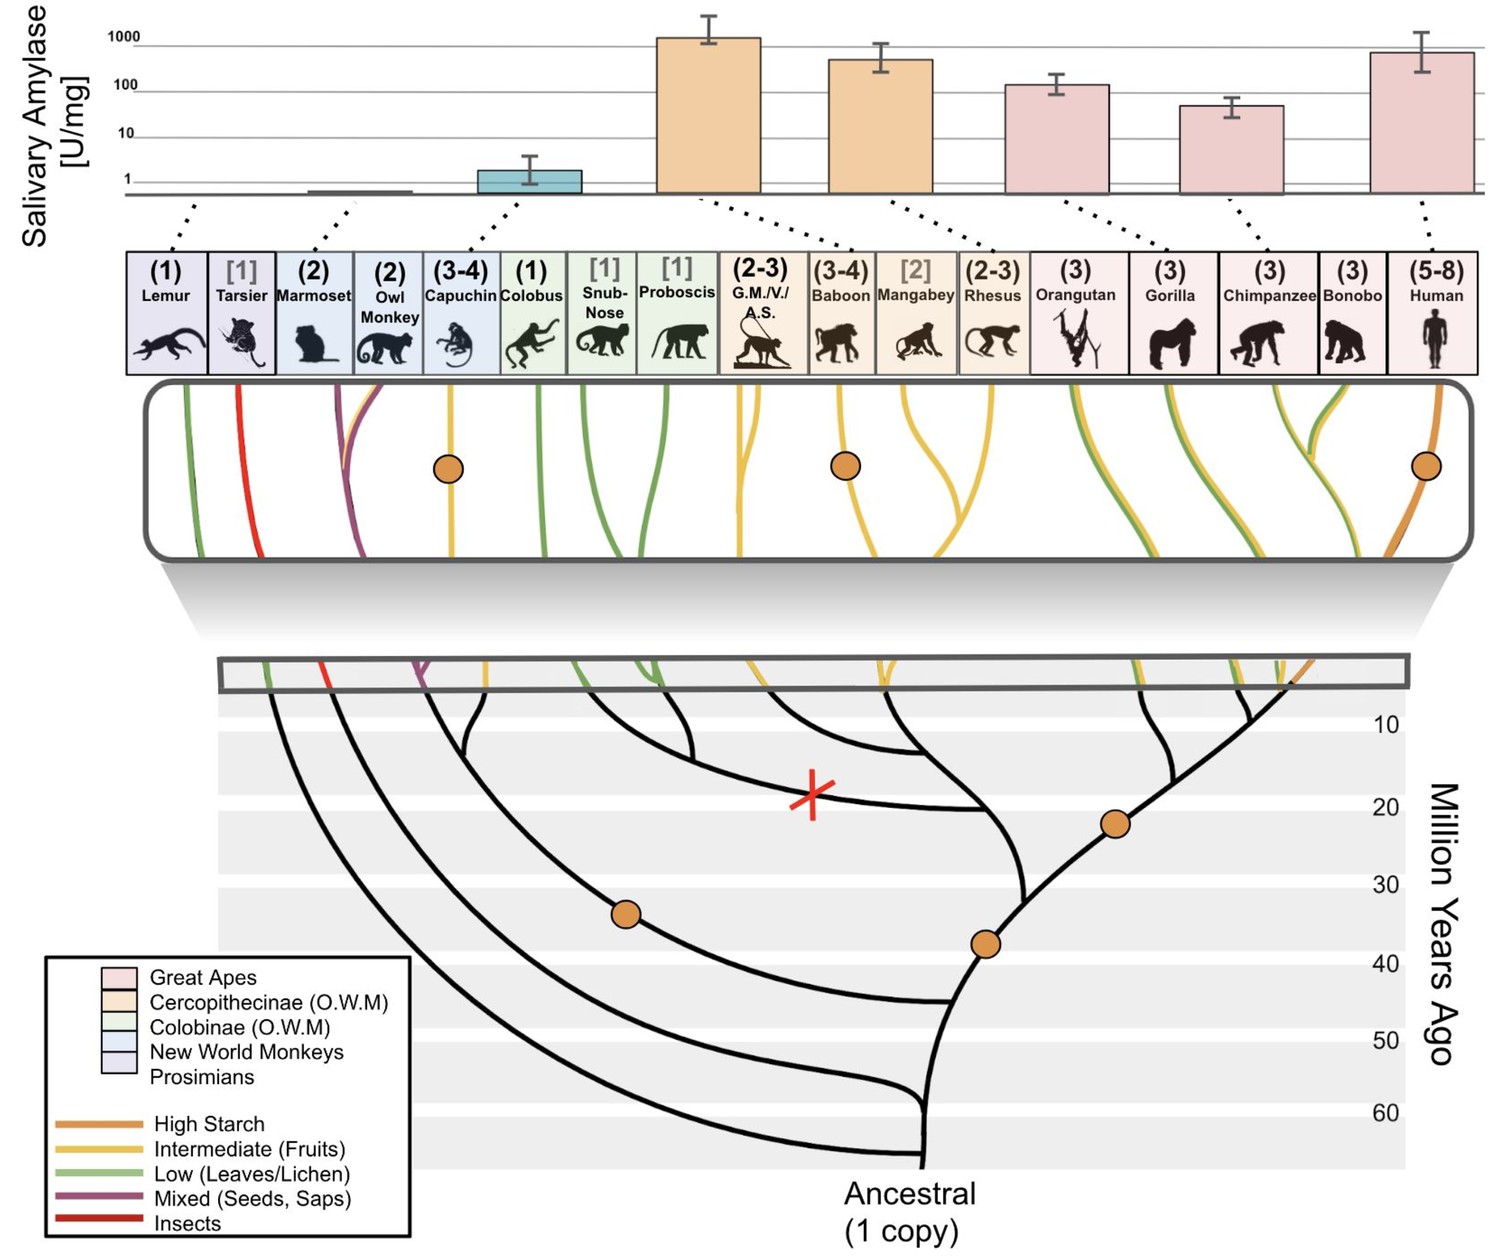
Amylase gene copy number duplication events and salivary activities across the primate phylogeny.
Bars in the upper part of the diagram represent mean amylase activities in saliva of corresponding primate species (indicated by the dotted lines). Orange dots in the branches of the phylogenetic tree show the presumed occurrences of gene duplication events. The red X indicates a likely gene loss event. Haploid amylase gene copy numbers are indicated in parentheses above the species name. The copy numbers determined through genotyping by ddPCR are shown in black round parentheses, while those based on reference genomes are shown in gray square brackets. Phylogenetic branches are colored according to dietary preferences (see boxed legend). The upper boxed section is a zoomed-in version of the tree. Abbreviations: G.M., green monkey; V, vervet; A.S., Allen’s swamp monkey; O.W.M., Old World monkeys.
Figure 6
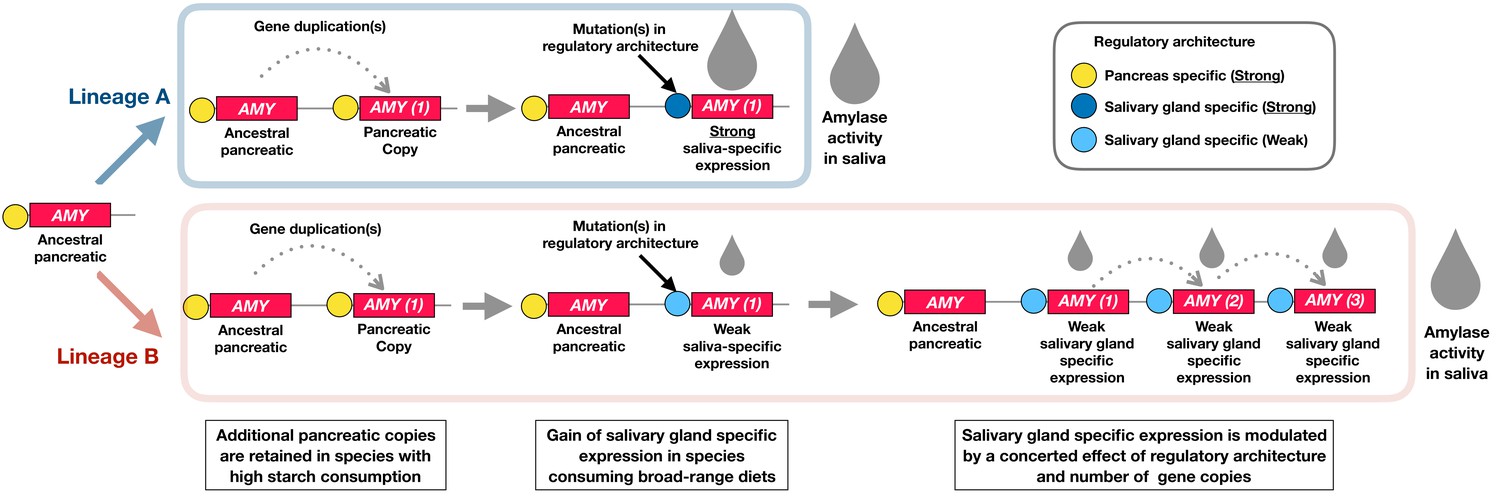
A working model to explain the evolution of the amylase locus.
The schematic diagram illustrates how the amylase gene locus could have independently evolved in different lineages (Lineage A and B) of the mammalian phylogeny. Our results are consistent with a model where the enzymatic expression in saliva is gained through the concerted effect of gene duplications and regulatory architecture. Our findings suggest that at least one gene duplication is required for salivary-gland-specific expression. Our suggested model posits that along with the strength of the regulatory architecture and the dietary context, additional gene duplications drive the evolution of amylase expression in saliva. Examples representative of Lineage A are muroidea and cercopithecinae. Examples representative of Lineage B are dogs, pigs, and humans.
Additional files
-
Supplementary file 1
Primary datasets used in our study including amylase enzymatic activity in saliva and gene copy numbers across mammalian species (tab 1: data used for Figures 3 and 5), as well as dietary preferences across species (tab 2: data used for Figure 4), and amylase copy numbers found in available reference genomes (tab 3: data used for Figure 1—figure supplement 1).
- https://doi.org/10.7554/eLife.44628.012
-
Supplementary file 2
Details of the primer and probe sets that we used in this study.
- https://doi.org/10.7554/eLife.44628.013
-
Supplementary file 3
Results of our analysis of retrotransposons associated with the amylase gene copies depicted in Figure 2B.
Figure supplements
- https://doi.org/10.7554/eLife.44628.014
-
Transparent reporting form
- https://doi.org/10.7554/eLife.44628.015
Download links
A two-part list of links to download the article, or parts of the article, in various formats.
Downloads (link to download the article as PDF)
Open citations (links to open the citations from this article in various online reference manager services)
Cite this article (links to download the citations from this article in formats compatible with various reference manager tools)
Independent amylase gene copy number bursts correlate with dietary preferences in mammals
eLife 8:e44628.
https://doi.org/10.7554/eLife.44628


