Comprehensive substrate specificity profiling of the human Nek kinome reveals unexpected signaling outputs
- Massachusetts Institute of Technology, United States
- Yale School of Medicine, United States
- University of Toronto, Canada
- University of Copenhagen, Denmark
- University Health Network, Canada
- Harvard Medical School, United States
Figures
Figure 1 with 4 supplements
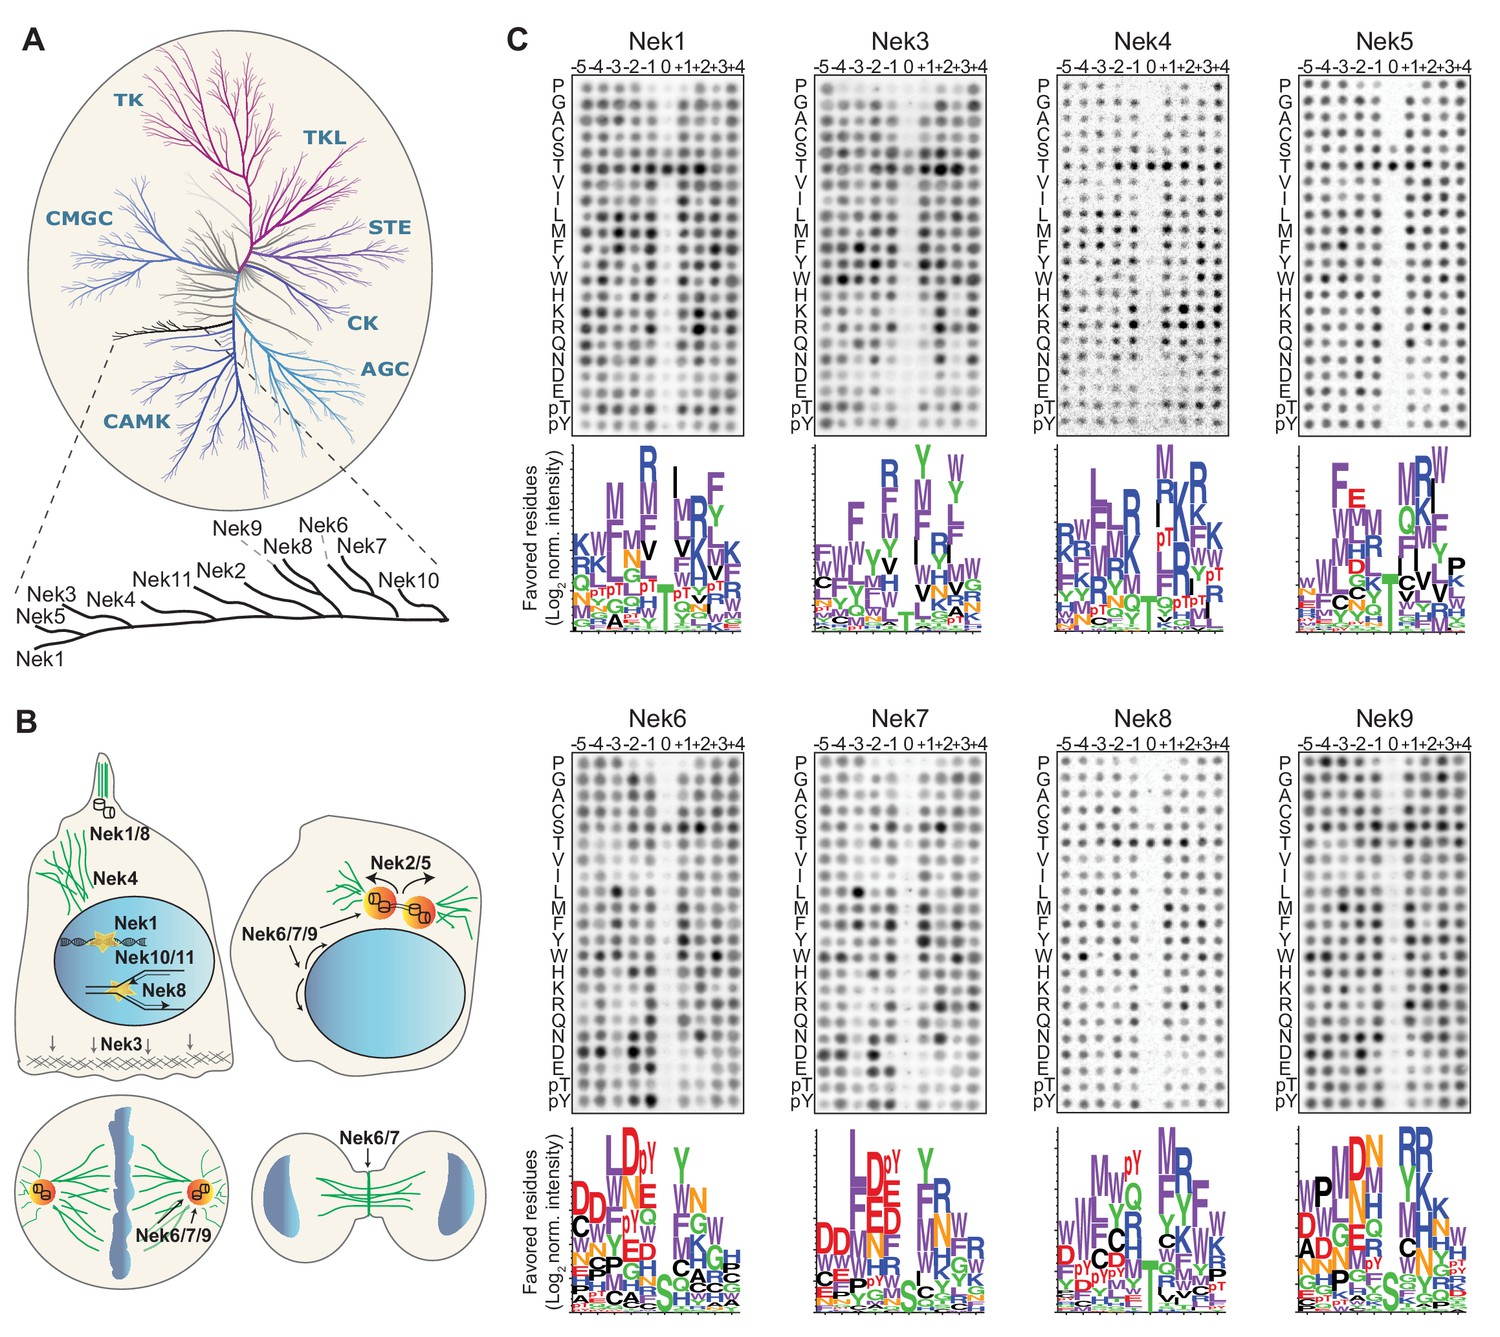
Phosphorylation-site motifs for the human NimA-related kinases.
(A) Dendrogram showing the phylogenetic relationship between all human kinases. The branch containing the Nek-family is magnified in the inset. Adapted from Manning et al. (2002). (B) Cartoon depicting the identified and suggested functions for the Nek kinases in interphase cells (top left panel) and cells in different stages of mitosis (other three panels). See introduction for details. (C) Phosphorylation-site motifs of the Nek-family members were determined by OPLS. Shown are representative OPLS dot blots, and sequence logos of the favored residues quantified over multiple assays (n ≥ 2).
Figure 1—figure supplement 1
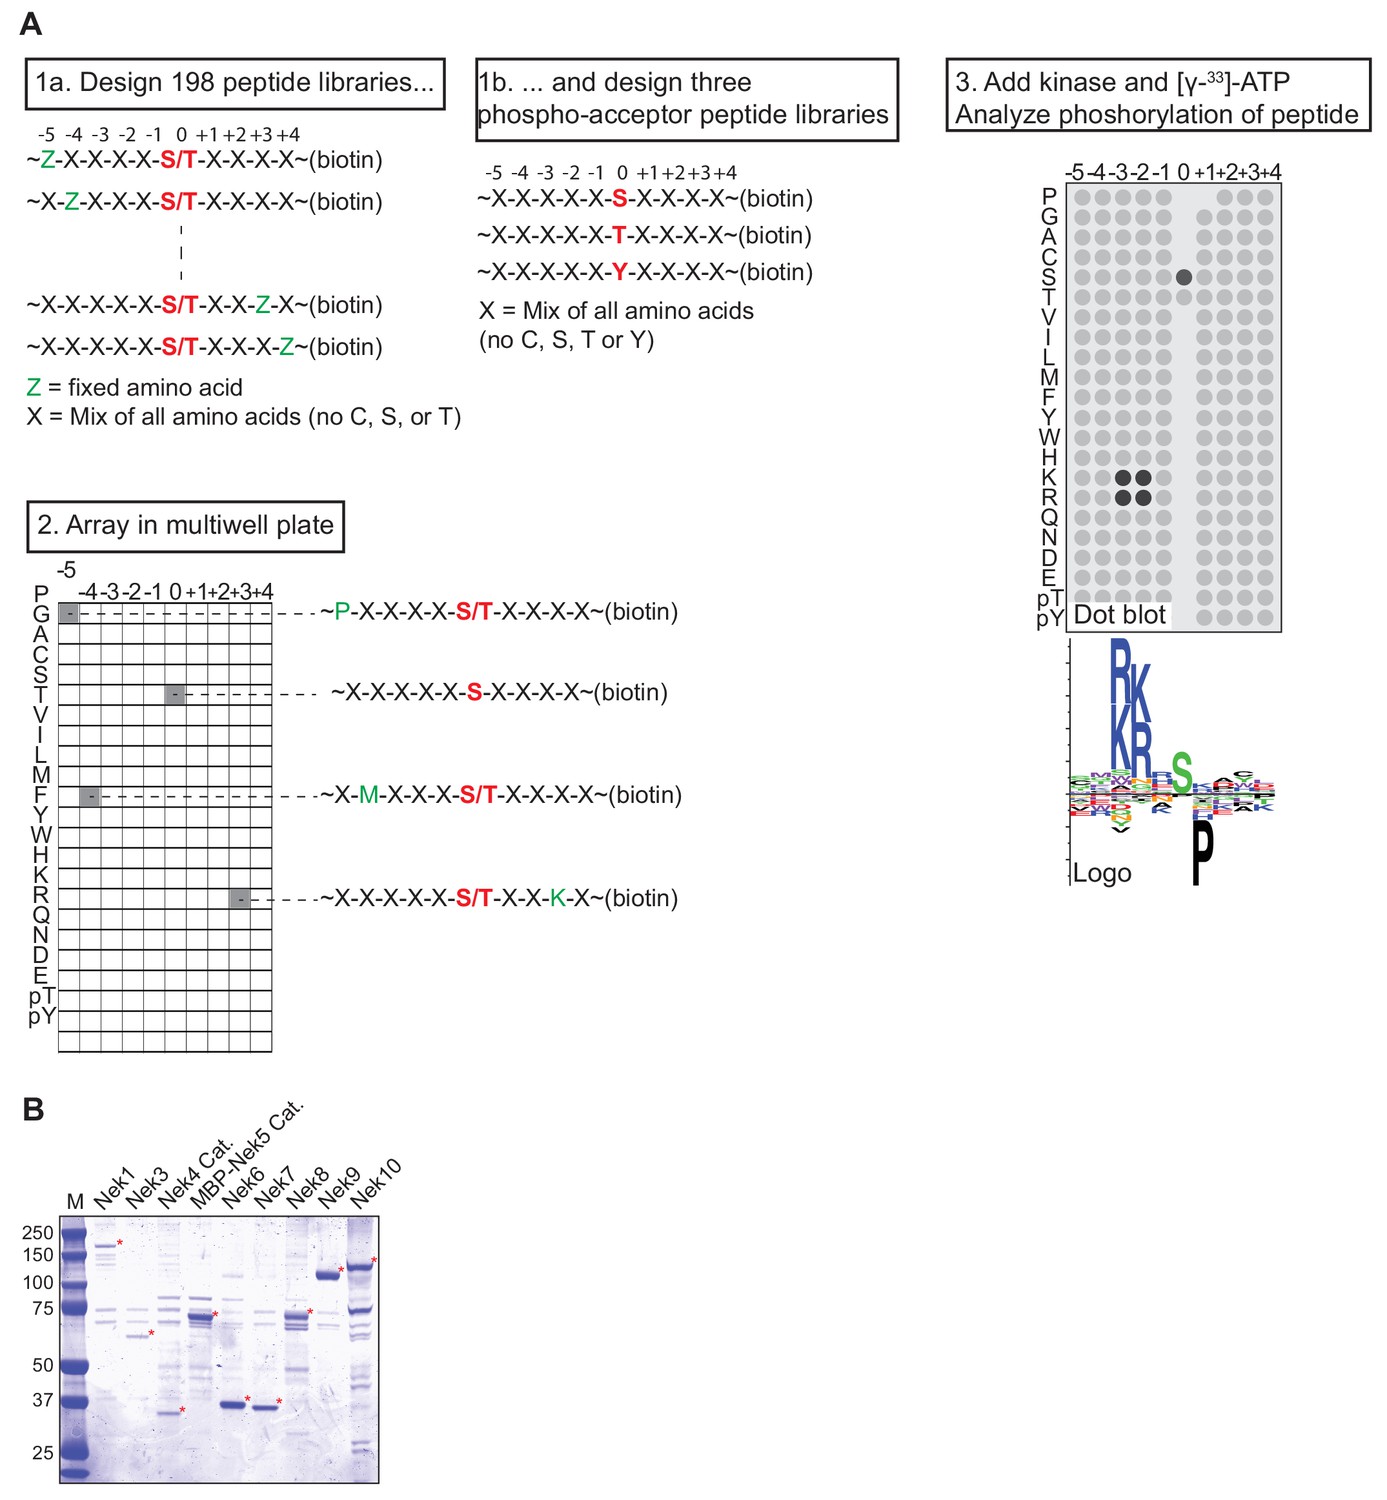
OPLS experimental design and Nek kinase isolation.
(A) Experimental lay-out of an OPLS-experiment. Biotinylated peptide libraries are incubated in vitro with an isolated kinase and radiolabeled ATP, in independent reactions in a multiwell plate. The peptide libraries are then transferred to a streptavidin membrane, and the level of phosphorylation is quantified by measuring the intensity of radiolabel incorporation using a phosphorimager. The example shows a basophilic kinase with a preference for basic residues on the −2 and −3 positions, a preference for a serine as the phospho-acceptor site, and a strong selection against a proline in the +1 position. (B) FLAG-tagged(3x) variants of either full-length Nek kinases or catalytic domains (Cat.) of Nek4 or Nek5 were isolated by anti-FLAG IP from lysates of transfected HEK 293T cells and eluted from the beads with FLAG-peptide. A fraction of the eluate was analyzed by SDS-PAGE followed by Coomassie staining. Asterisks indicate Nek kinases, MBP = maltose-binding protein.
Figure 1—figure supplement 2
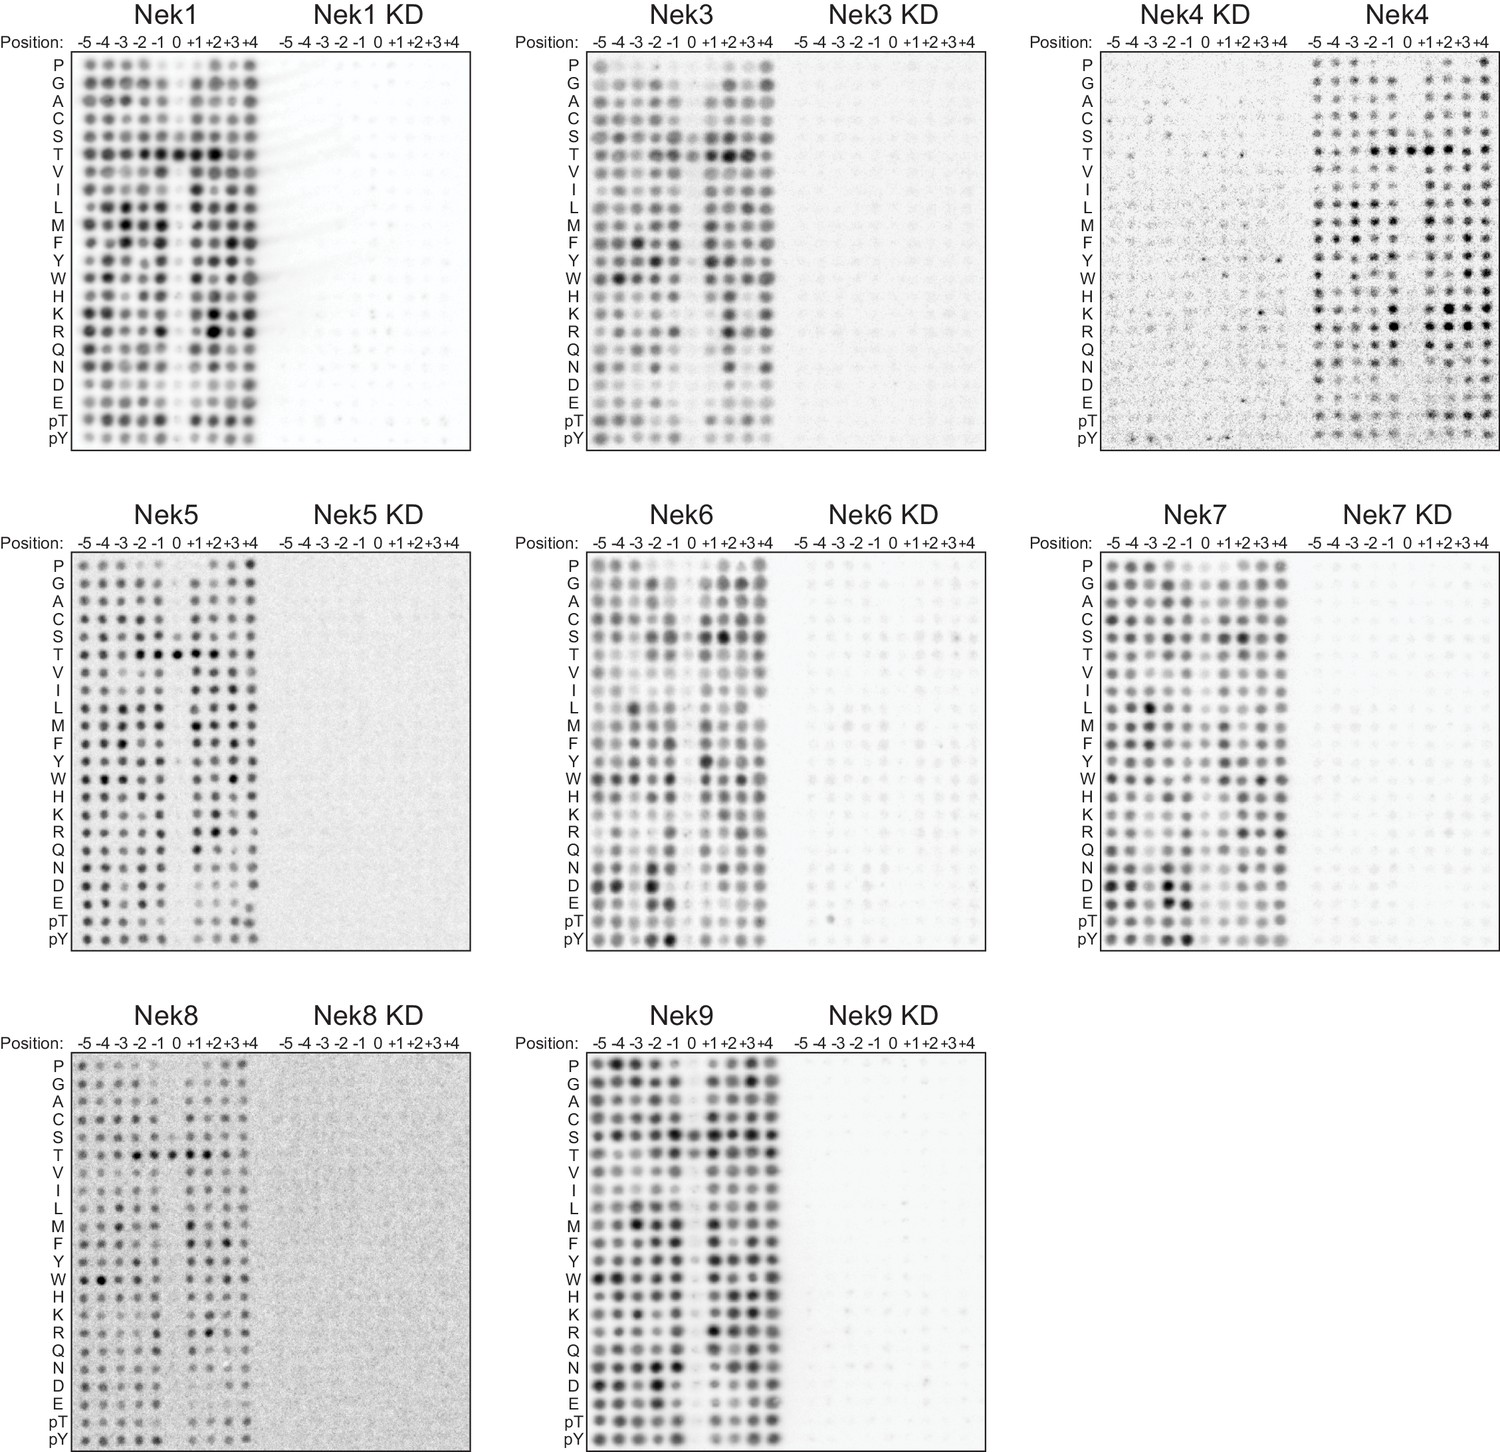
OPLS-results for kinase-dead Nek mutants.
Representative OPLS-blots of every Nek kinase together with their kinase-dead (KD) mutants on the same blot.
Figure 1—figure supplement 3
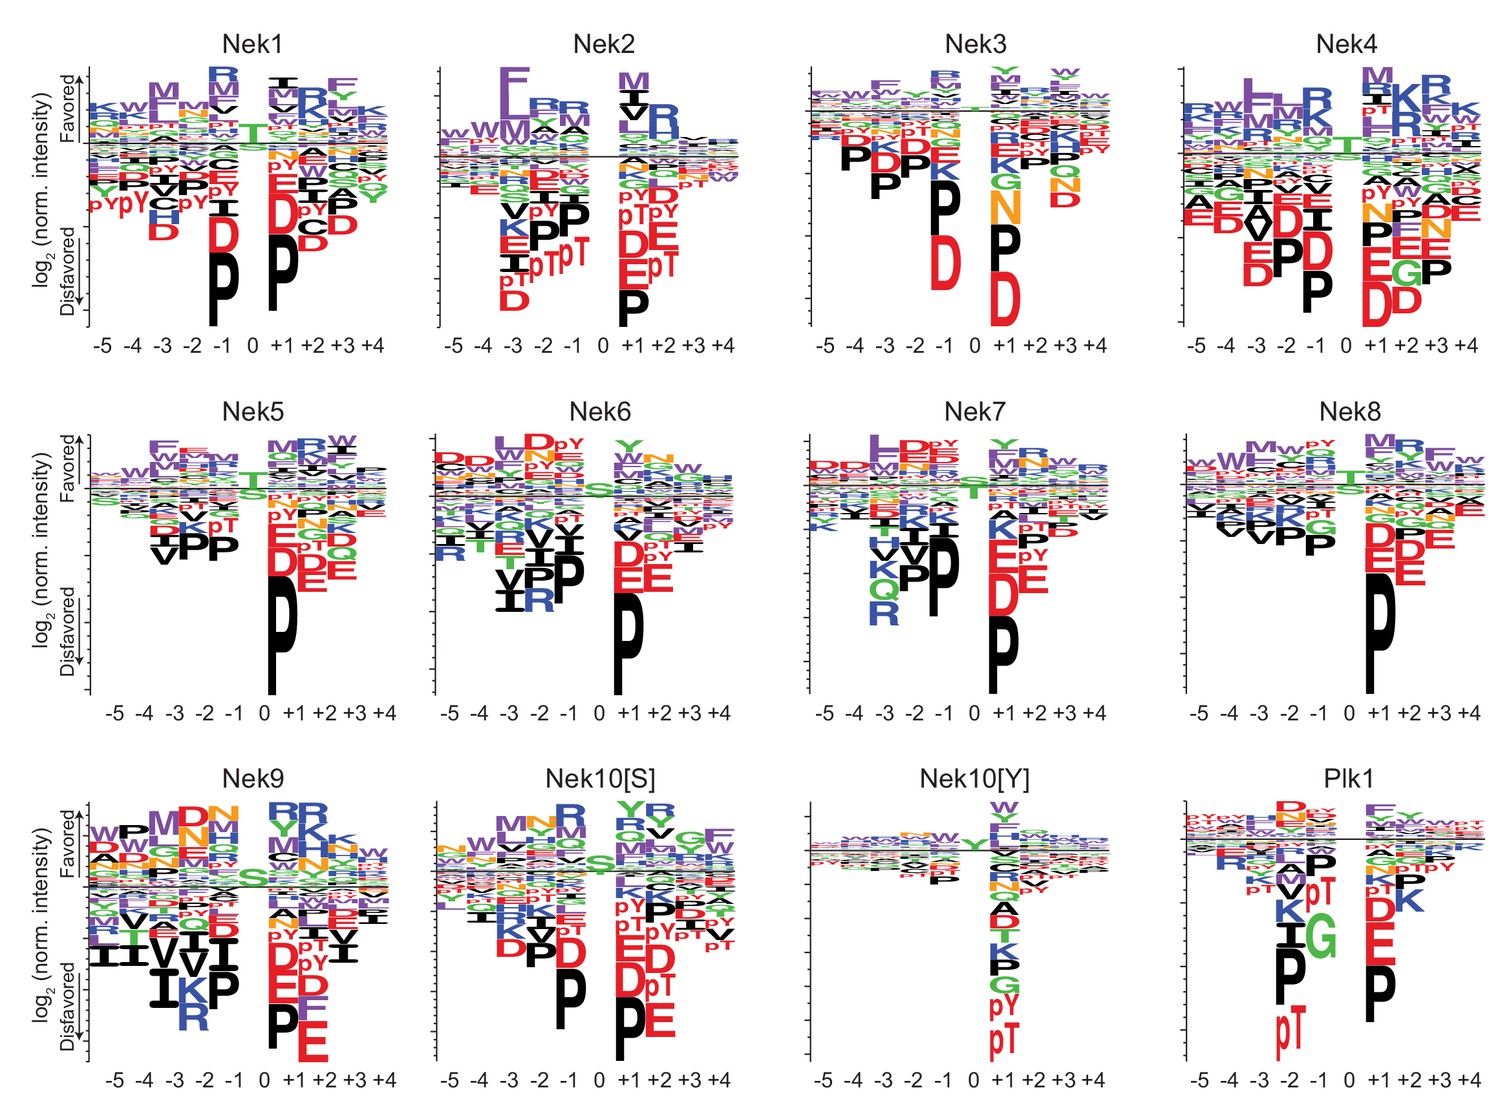
Phosphorylation-site motifs for the Nek kinases and Plk1.
Complete sequence logos of the phosphorylation-site motifs for Nek1-Nek10, and for Plk1 emphasizing both positive and negative selections. Nek10[S] and Nek10[Y] indicate the phosphorylation-site motif of Nek10 on a serine-substrate library or a tyrosine-substrate library, respectively. The phosphorylation-site motifs for Nek1 and Nek3-Nek10 were determined in this study, the phosphorylation-site motifs for Nek2 and Plk1 were determined in Alexander et al. (2011).
Figure 1—figure supplement 4
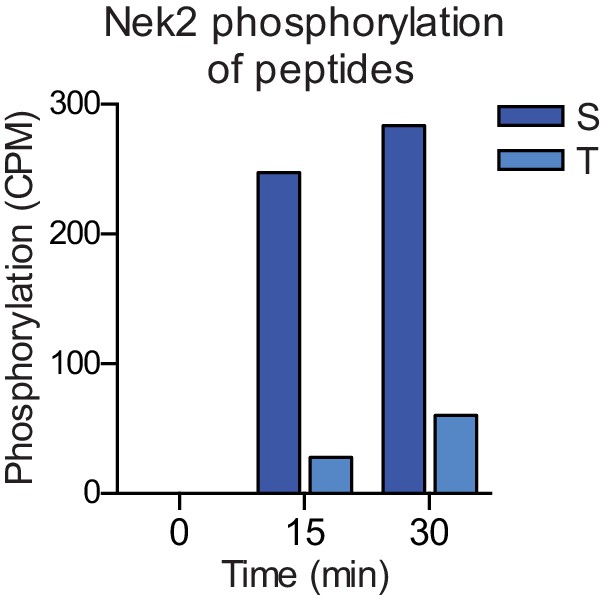
Nek2 preferentially phosphorylates a serine, rather than a threonine, phosphoacceptor residue.
Purified Nek2 was incubated in vitro with radiolabeled ATP and a degenerate peptide substrate containing either a serine (S) or threonine (T) phospho-acceptor site, as described in Figure 1—figure supplement 1A. Peptide phosphorylation was quantified by scintillation counting (CPM = counts per minute).
Figure 2
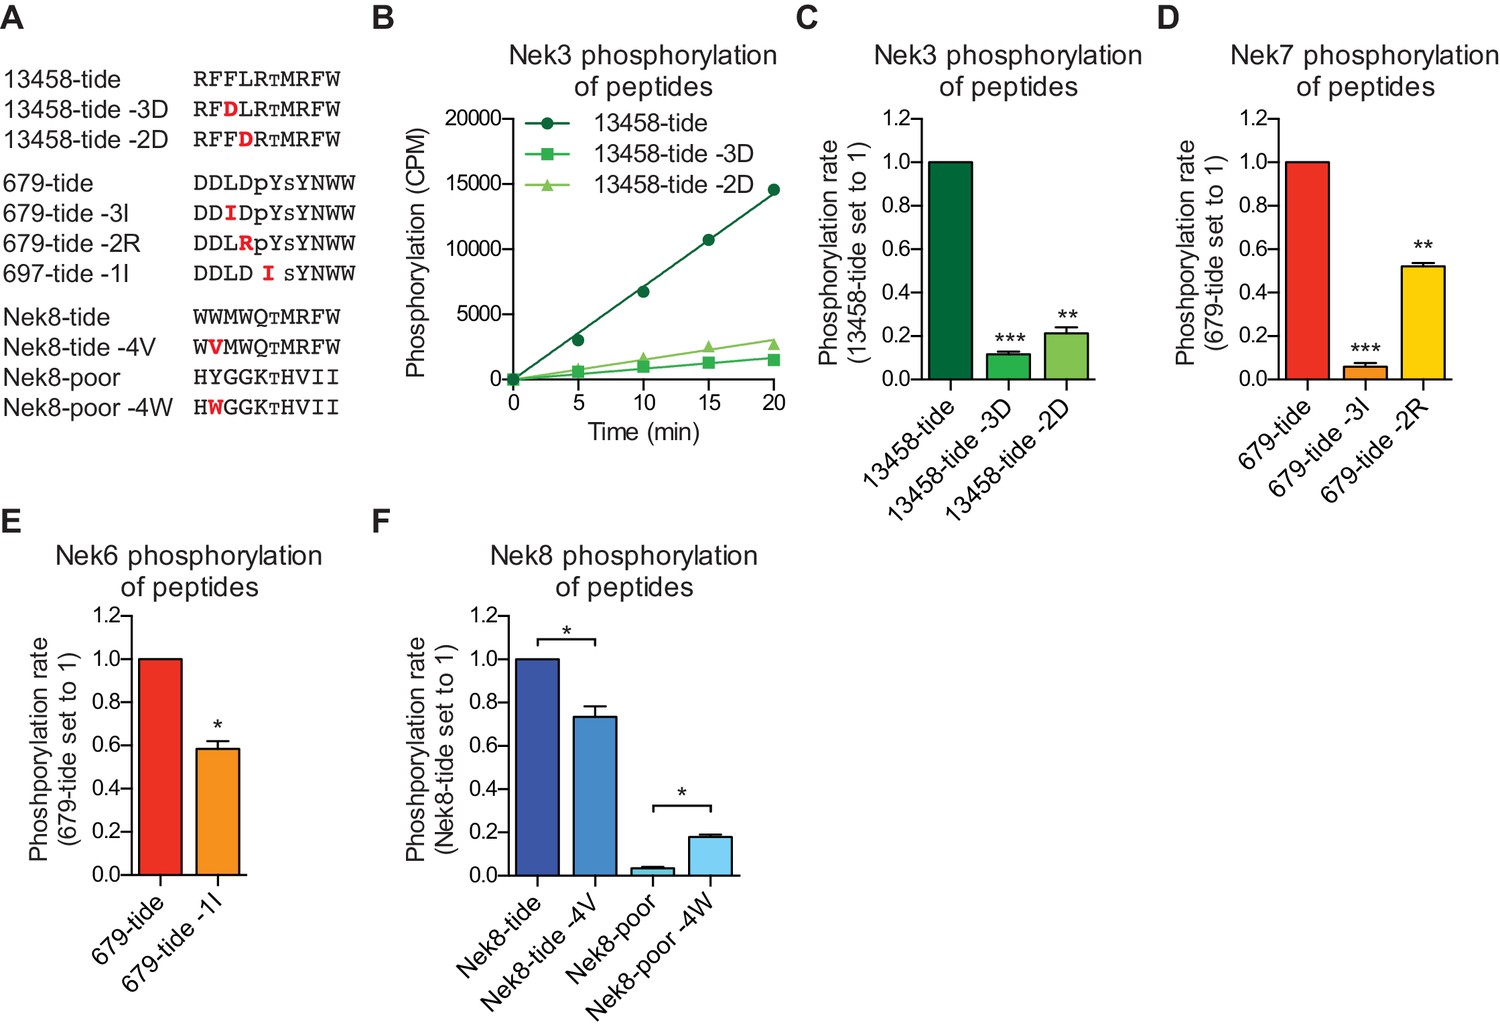
Validation of the phosphorylation-site motifs for the Nek kinases.
(A) Peptides used in the studies depicted in panels B-F. Small font S or T indicates the phospho-acceptor site, pY indicates a phosphorylated tyrosine residue. (B) Purified Nek3 was incubated with the indicated peptide substrates and radiolabeled ATP. Peptide phosphorylation was quantified by scintillation counting (Mean ± SEM, n = 3; CPM = counts per minute). (C) The data depicted in panel (B) were analyzed by linear regression and the slopes of the regression curves were calculated to determine the phosphorylation rate (Mean ± SEM, n = 3, **p<0.005, ***p<0.0005). (D) As in panel (C), but for Nek7 (Mean ± SEM, n = 3, **p<0.005, ***p<0.0005). (E) As in panel (C), but for Nek6 (Mean ± SEM, n = 3, *p<0.05). (F) As in panel (C), but for Nek8 (Mean ± SEM, n = 3, *p<0.05).
Figure 3 with 3 supplements
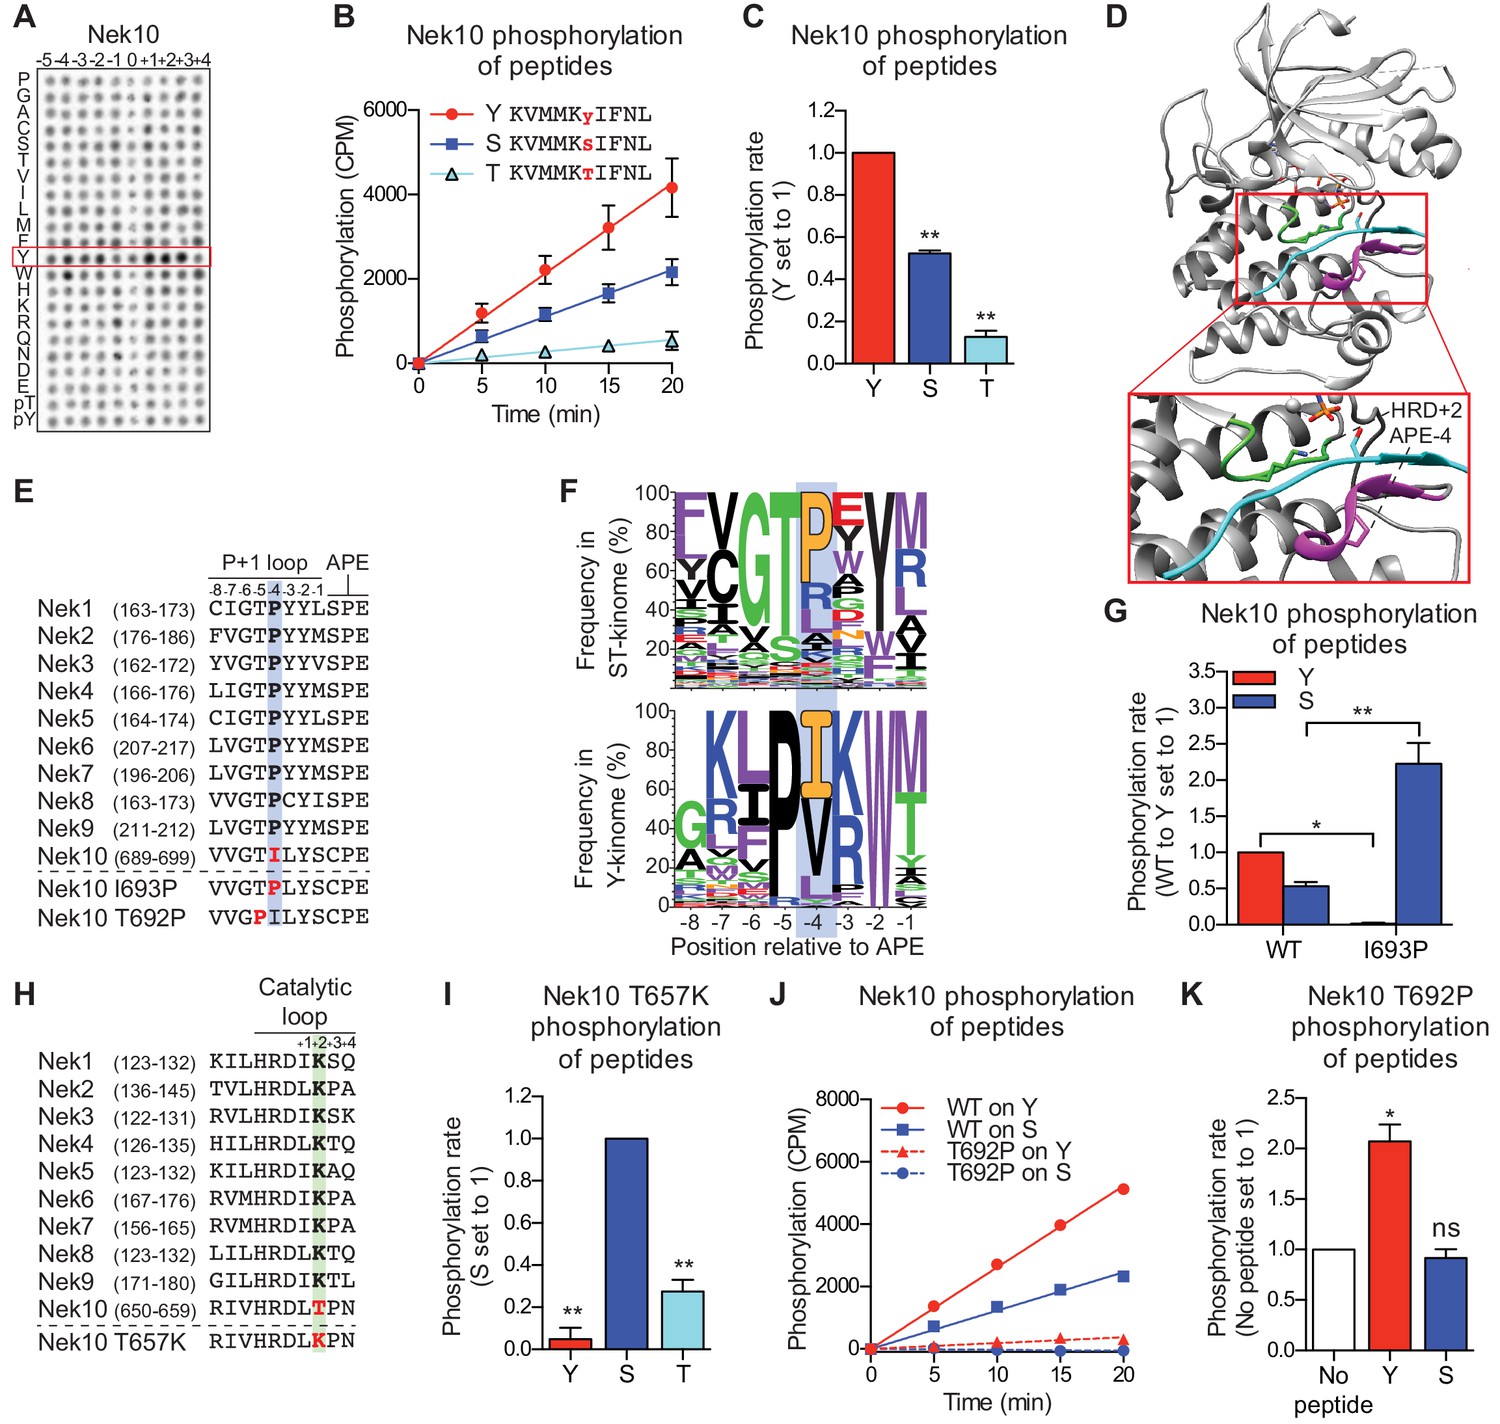
Nek10 is a dual-specificity kinase.
(A) Representative blot showing the OPLS results for wild-type Nek10 on the serine-threonine peptide library. (B) Purified Nek10 was incubated with the indicated peptide substrates and radio-labeled ATP. Peptide phosphorylation was quantified by scintillation counting. (Mean ± SEM, n = 3). (C) The data depicted in panel (B) were analyzed by linear regression and the slopes of the regression curves were calculated to determine the phosphorylation rate (Mean ± SEM, n = 3, **p<0.005). (D) Cartoon representation of the Akt/GSK3-peptide structure (PDB: 1O6L). The kinase domain, activation loop, and the P+1 loop are shown in gray, green and magenta, respectively. The GSK3 peptide is shown in cyan, side chain shown is of the phospho-acceptor serine. (E) Amino acid sequence alignment of the P+1 loop and APE motif of Nek1 to Nek10, and including the Nek10 I693P and T692P variants. (F) Logo depicting the frequency of amino acids in the P+1 loop of either all human serine/threonine (ST) kinases, but excluding the tyrosine kinase like group (upper panel), or all human tyrosine (Y) kinases (lower panel). (G) As in panel (C), but for Nek10 WT and the I693P variant (Mean ± SEM, n = 3, *p<0.05, **p<0.005). (H) Amino acid sequence alignment of the catalytic loop of Nek1 to Nek10, including the Nek10 T657K variant. (I) As in panel (C), but for the Nek10 T657K variant (Mean ± SEM, n = 3, **p<0.005). (J) As in panel (B), but for Nek10 WT and the T692P variant. (K) As in panel (C) but for the Nek10 T692P variant. In order to obtain accurate rate calculations, the experiment shown in panel J was repeated x3 with longer incubation times (Mean ± SEM, n = 4, *p<0.05). The signal observed in the ‘no peptide’ sample results from binding of auto-phosphorylated kinase to the phosphocellulose paper.
Figure 3—figure supplement 1
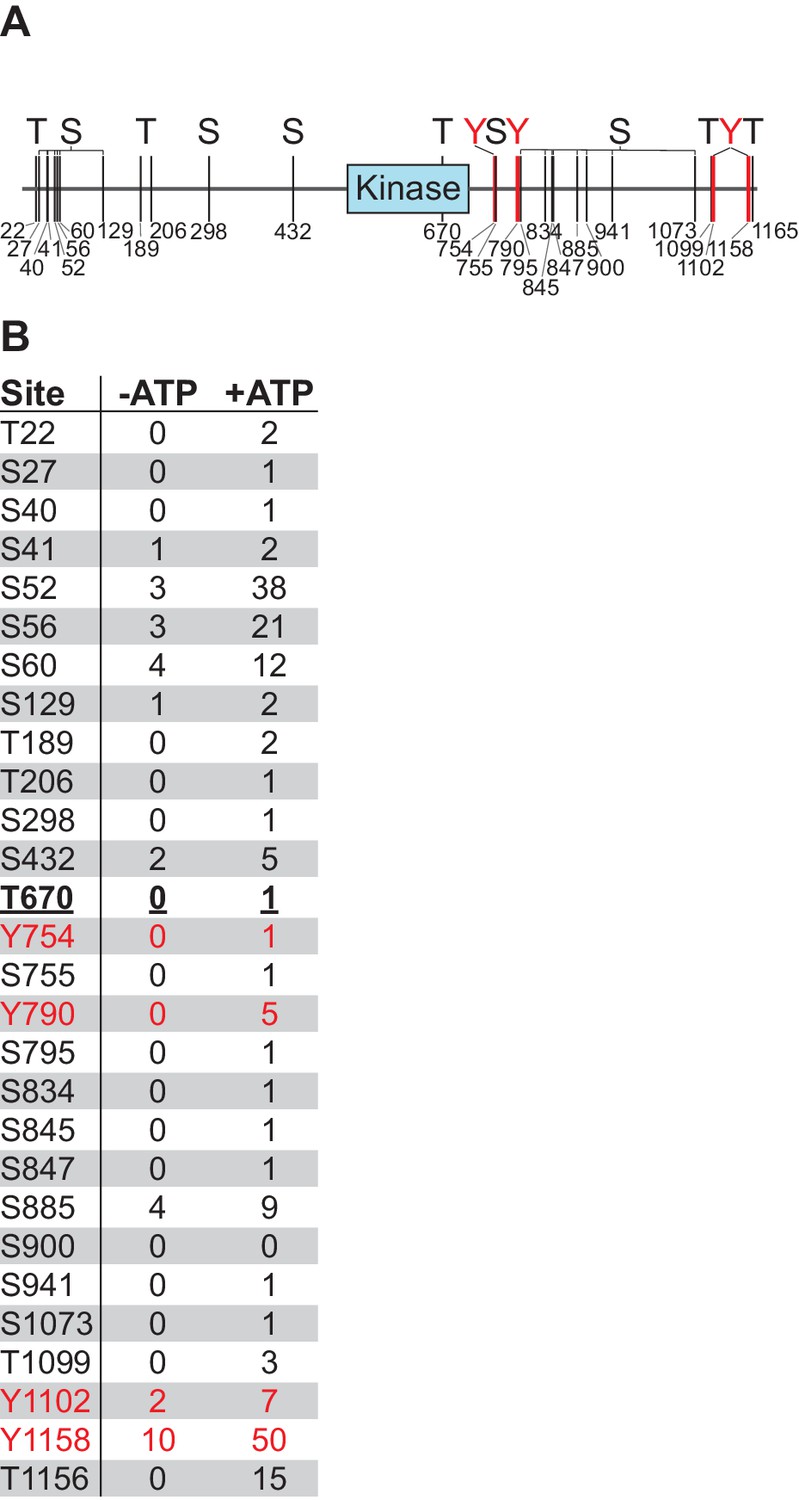
Nek10 autophosphorylates on serine, threonine, and tyrosine in vitro.
(A and B) Flag-tagged Nek10 was expressed and isolated from Nek10-deficient HEK 293T cells, and incubated in an in vitro kinase reaction with or without ATP, followed by mass spectrometry to analyze phosphorylation status. Indicated sites had a phosphopeptide spectral count that was at least two-fold higher for the +ATP than the -ATP sample. Mapping of phosphorylation sites was not comprehensive (The Y644-containing tryptic peptide, for example, is only four amino acids long, and was not detected in either the phosho- or non-phospho form). For panel (A), the blue box indicates the kinase domain, and mapped tyrosine phosphosites are indicated in red. For panel (B), tyrosine phosphopeptides are indicated in red, T670 in bold underlined font is located in the kinase domain.
Figure 3—figure supplement 2
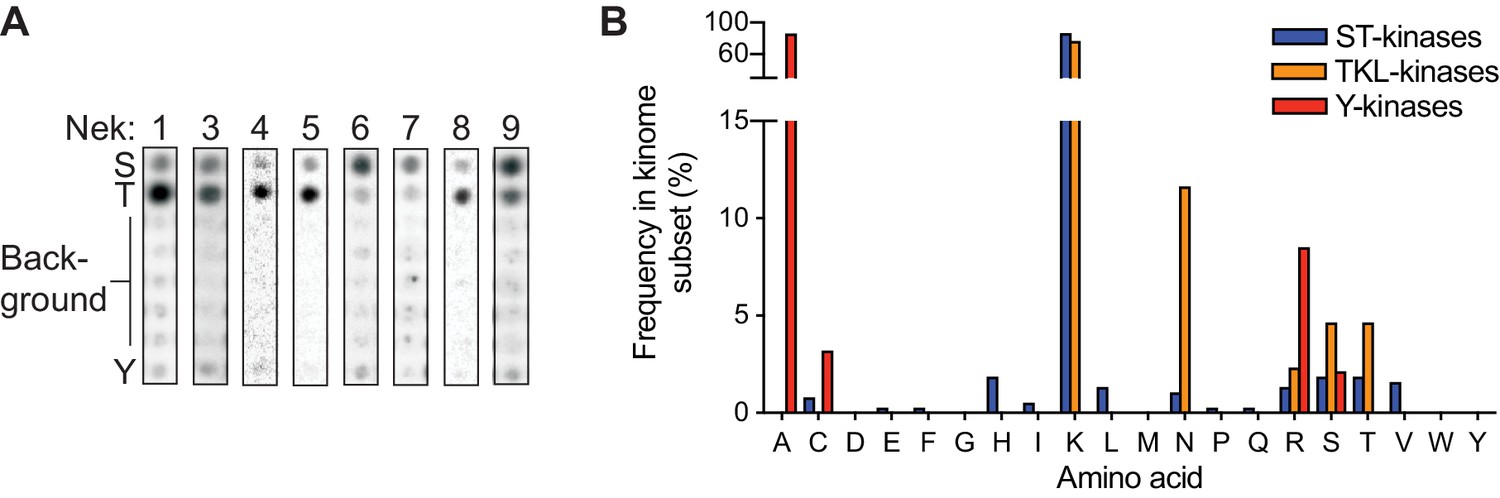
The ability of Nek10 to phosphorylate on tyrosine is unique within the Nek family.
(A) Reproduction of the column in the 0 position of the OPLS-dot blots shown in Figure 1C, which contain the degenerate peptide libraries used to determine phospho-acceptor site specificity. (B) Frequency of each amino acid in the HRD+2 position, which is the position equivalent to Nek10 T657, in all human serine/threonine (ST) kinases, all human tyrosine-kinase-like (TKL) kinases, or all human tyrosine (Y) kinases. Note that a lysine in this position is extremely common in serine/threonine kinases, while the threonine residue found in Nek10 is quite rare.
Figure 3—figure supplement 3
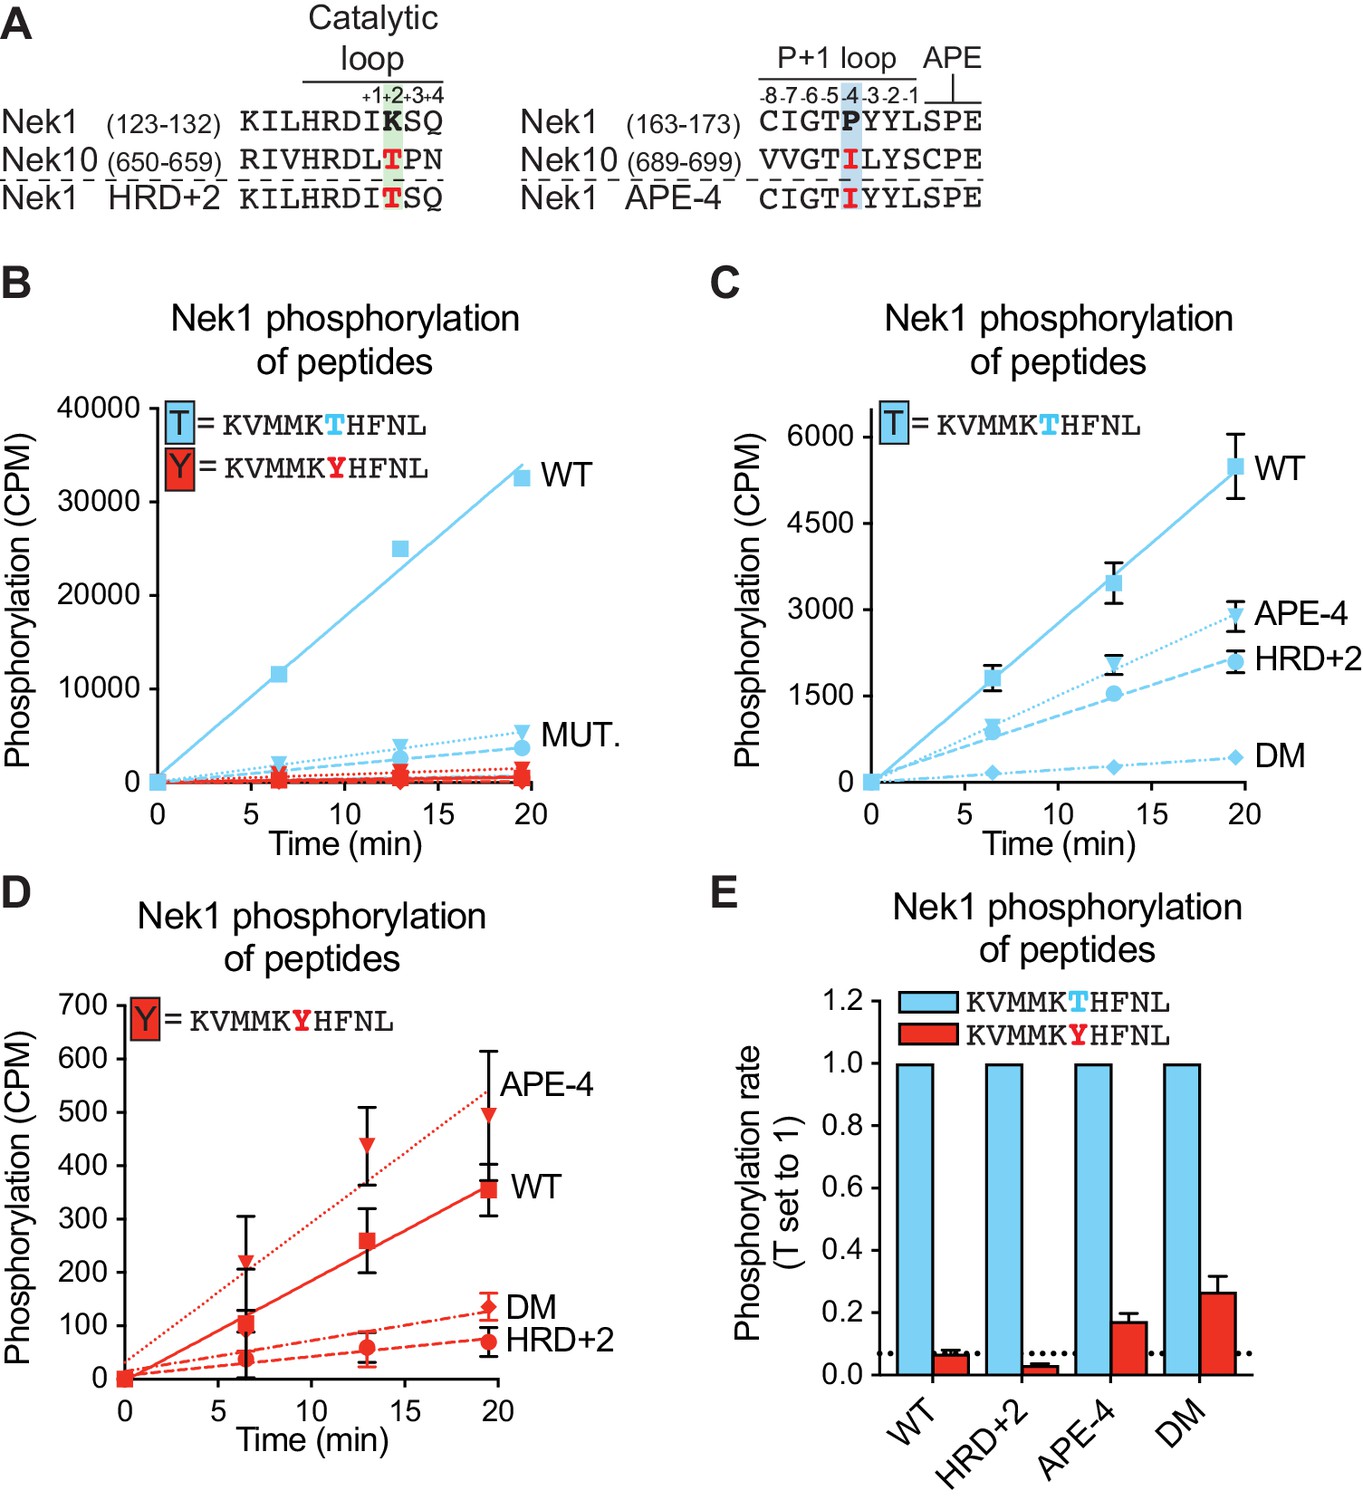
An APE-4 isoleucine in Nek1 enhances substrate phosphorylation on tyrosine residues.
(A) Amino acid sequence alignment of the catalytic loop (left panel) and of the P+1 loop and APE motif (right panel), of Nek1 and Nek10, including the Nek1 HRD+2 and APE-4 mutants. (B) Purified Nek1 WT, Nek1 K130T (HRD+2), Nek1 P168I (APE-4) and Nek1 double mutant (DM) were incubated with the indicated peptide substrates and radio-labeled ATP. Peptide phosphorylation was quantified by scintillation counting (n = 1; CPM = counts per minute). (C) and (D) As in B, now with sixfold reduced concentration of Nek1 WT compared to the Nek1 mutants (Mean ± SEM, n = 3). The curves for T-peptide (C) and Y-peptide (D) phosphorylation are plotted separately on scaled Y-axes to facilitate interpretation of the difference between the curves. (E) The data depicted in panels (C) and (D) were analyzed by linear regression and the slopes of the regression curves were calculated to determine the phosphorylation rate (Mean ± SEM, n = 3). Dotted line indicates the level of tyrosine phosphorylation of Nek1 WT.
Figure 4 with 1 supplement
Phosphorylation-site motifs for Nek10 on tyrosine and serine target sites.
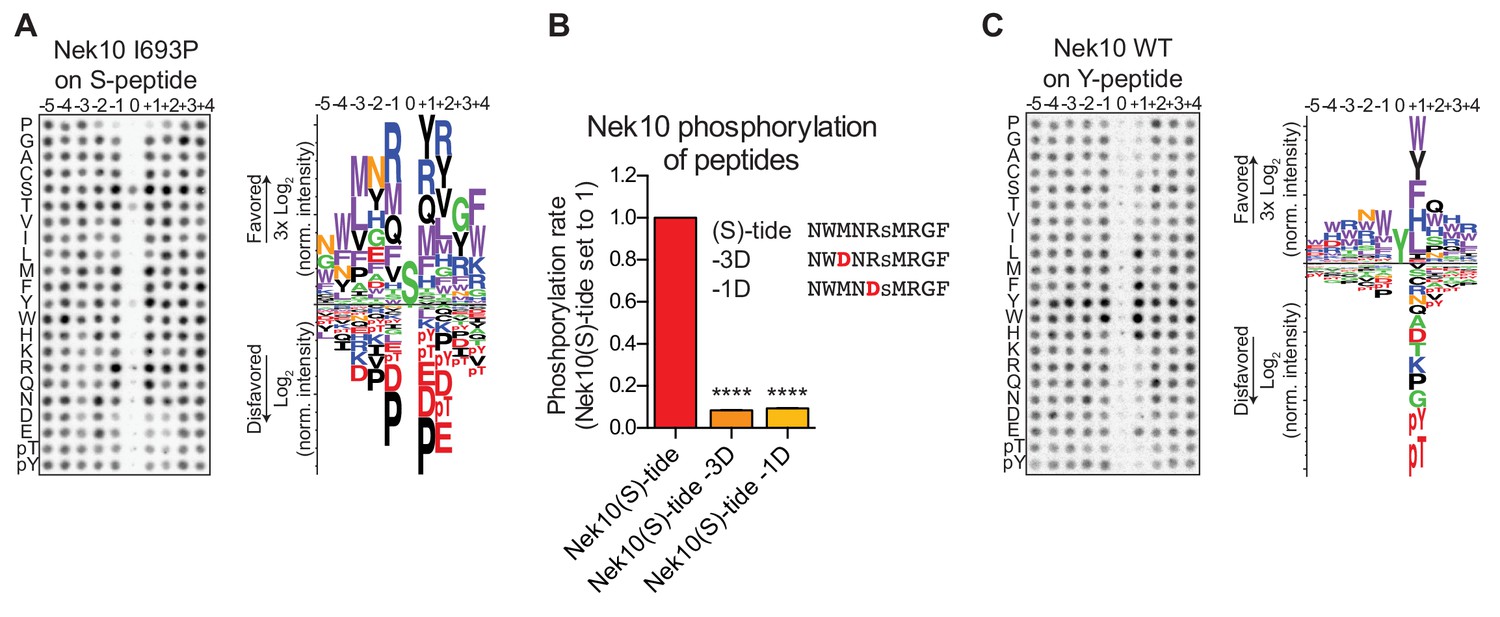
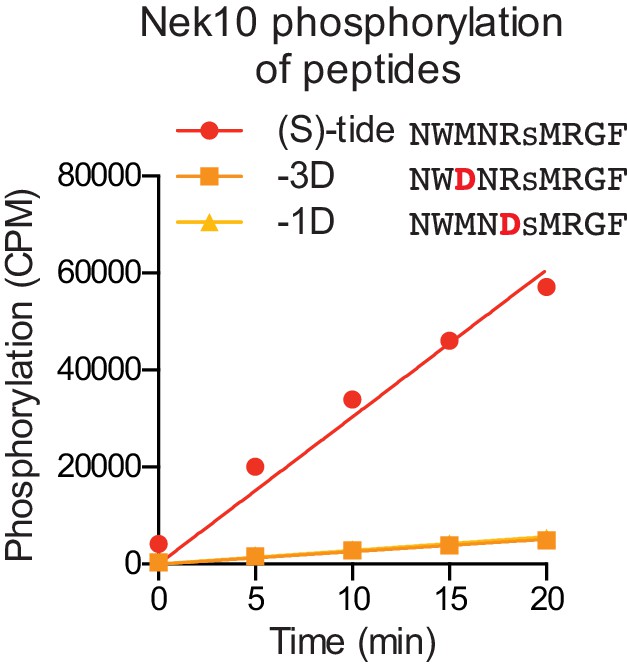
(A) The phosphorylation-site motif of Nek10 I693P was determined by OPLS. Shown are a representative blot, and a sequence logo of data quantified over two independent OPLS-experiments, showing both the favored and disfavored amino acids. (B) Purified Nek10 was incubated with the indicated peptide substrates and radiolabeled ATP. Peptide phosphorylation was quantified by scintillation counting. The phosphorylation rate was determined by linear regression (Mean ± SEM, n = 3, ****p<0.00005). (C) As in panel (A), but now for WT Nek10, and using a peptide library with a fixed tyrosine as the phosphoacceptor site (n = 3). Note that in this case the 0 position column contains no peptide libraries.
Figure 4—figure supplement 1
Validation of the Nek10 phosphorylation-site motif on serine-substrates.
Purified Nek10 was incubated with the indicated peptide substrates and radiolabeled ATP. Peptide phosphorylation was quantified by scintillation counting (Mean ± SEM, n = 3; CPM = counts per minute).
Figure 5 with 1 supplement
Nek10 autophosphorylates on both tyrosine and serine residues.
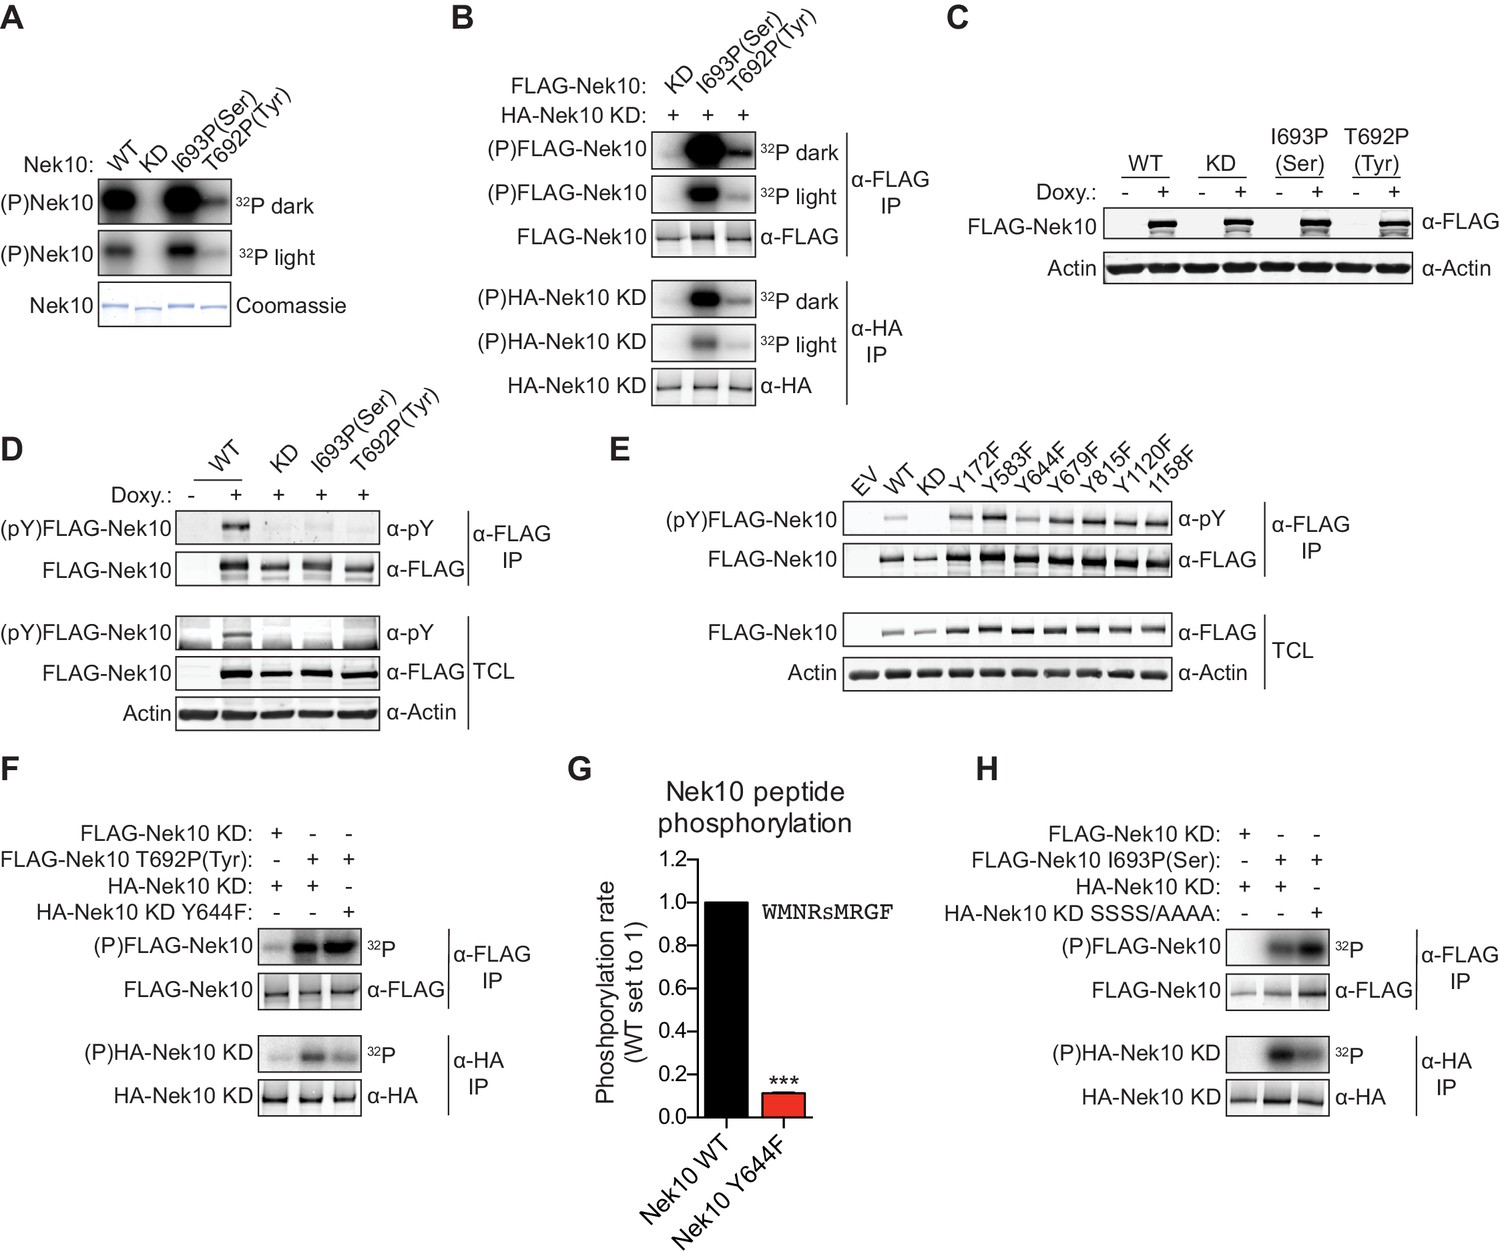
(A) Purified wild-type (WT), kinase-dead (KD), serine-specific (I693P(Ser)), or tyrosine-specific (T692P(Tyr)) Nek10 was incubated in vitro with radiolabeled ATP. Total Nek10 levels were analyzed by coomassie-staining, while phosphorylated (P) Nek10 was detected by phosphorimaging. 32P dark and 32P light respectively indicate a longer and shorter exposure of the same gel. (B) In vitro kinase assay with indicated FLAG-tagged Nek10 variants as the kinase, and HA-tagged Nek10 KD as the substrate. Kinase-proficient and kinase-dead Nek10 were separated by anti-FLAG and anti-HA IP respectively, and analyzed by immunoblotting and phosphorimaging. (C) Nek10 KO U-2 OS cells were reconstituted with doxycycline (Doxy) inducible FLAG-Nek10 variants and treated with 2 µg/ml doxycycline for 7 days, or left untreated. FLAG-Nek10 levels were analyzed by immunoblotting. (D) Cells described in panel (C) were treated with doxycycline for 2 days, and FLAG-Nek10 was isolated by α-FLAG IP, followed by immunoblotting to detect total Nek10 (α-FLAG) and tyrosine-phosphorylated Nek10 (α-pY) (TCL = total cell lysate). (E) Wild-type, non-edited U-2 OS cells were transfected with an empty vector control (EV) or the indicated FLAG-Nek10 variants. For WT and KD Nek10, less plasmid was transfected than for the Nek10 Y-to-F mutants. FLAG-Nek10 was isolated by α-FLAG IP and analyzed by immunoblotting. (F) As in panel (B), now using FLAG-tagged Nek10, either KD or tyrosine-specific (T692P(Tyr)), as the kinase, and HA-tagged Nek10 KD, either lacking additional mutations or with a Y644F mutation, as the substrate. (G) Purified Nek10 WT or the Y644F mutant was incubated with a peptide substrate and radiolabeled ATP. Peptide phosphorylation was quantified by scintillation counting. The phosphorylation rate was determined by linear regression (Mean ± SEM, n = 3, ***p<0.0005). Note that the autophosphorylation-defective Y644F mutant has dramatically reduced activity. (H) As in panel (B), now using FLAG-tagged Nek10, either KD or serine-specific (I693P(Ser)), as the kinase, and HA-tagged Nek10 KD, either lacking additional mutations or with a S353A/S356A/S358A/S359A quadruple mutation (SSSS/AAAA), as the substrate.
Figure 5—figure supplement 1
Nek10 autophosphorylates on Y644 and S358/359.
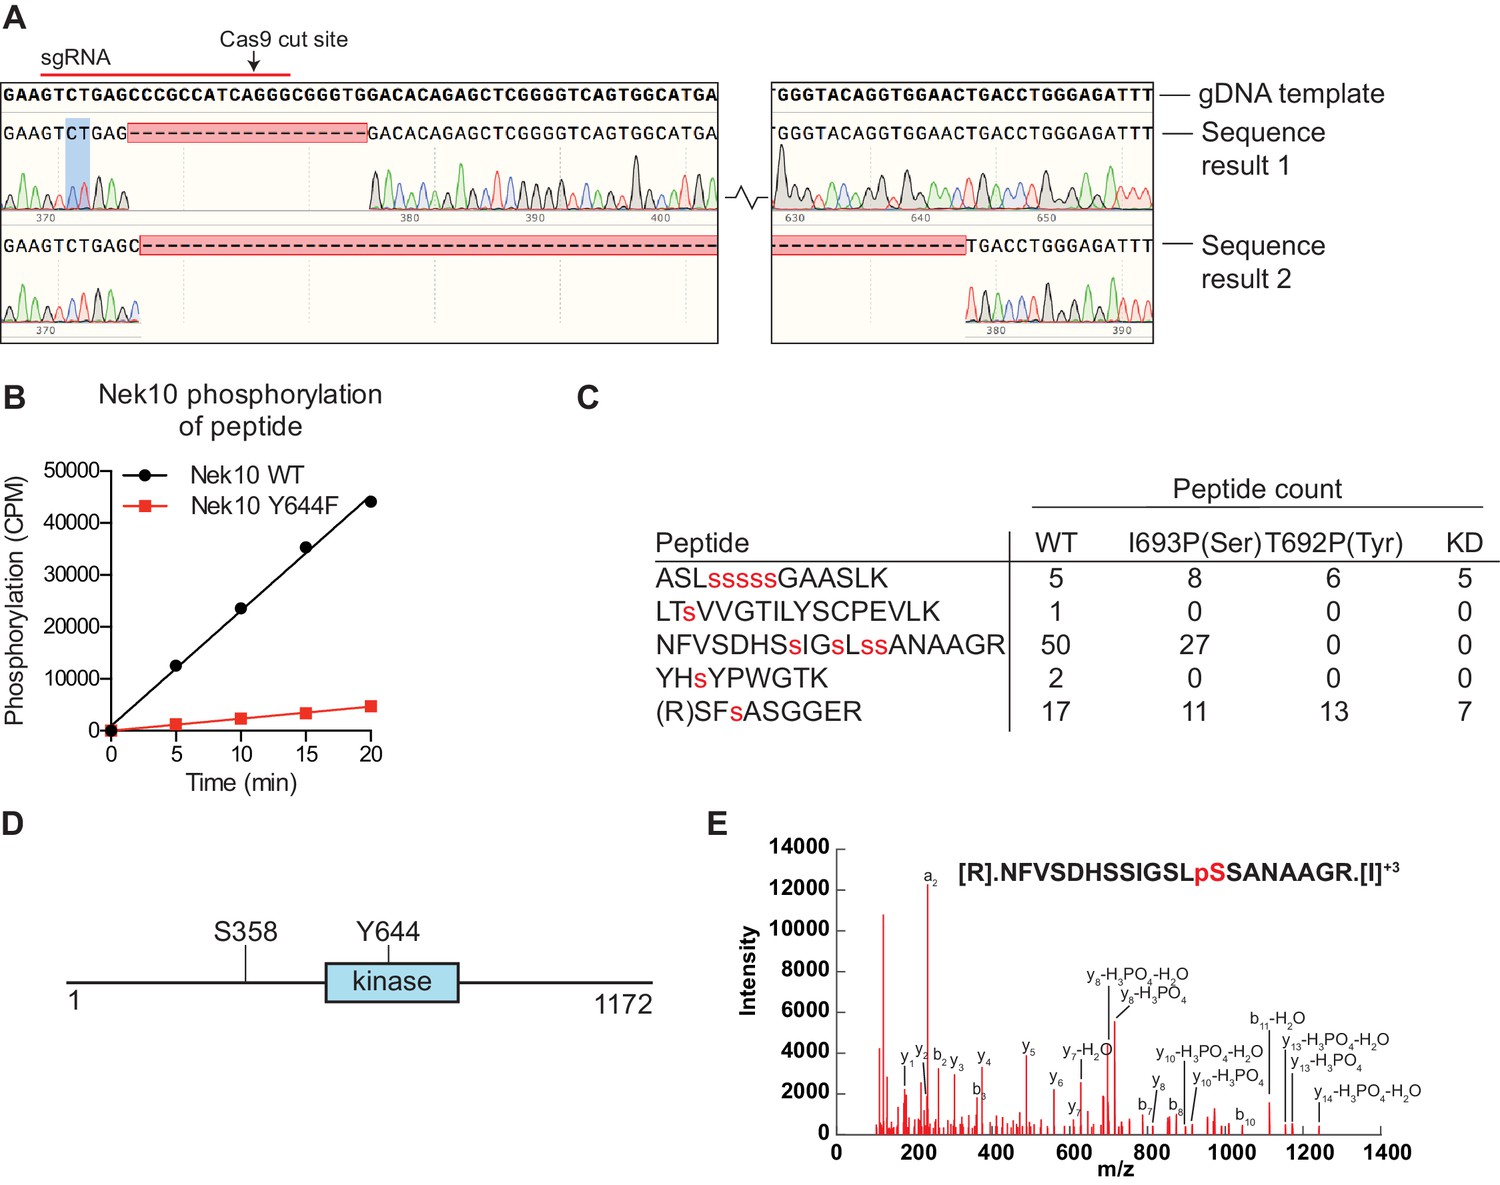
(A) Sequencing results of the U-2 OS Nek10 knockout cells confirm out-of-frame editing of both alleles of Nek10 using CRISPR. Chromatograms and DNA sequence alignment of the sgRNA target site (exon 5) to the sequencing result of the U-2 OS Nek10 KO clone are presented. Shown are bases 23,286 till 23,592, with the exception of a 220 bp stretch as indicated by the gap between the two sequence panels. Sequencing of multiple PCR products indicated that all Nek10 alleles were edited. Sequence 1 contains a 19 bp deletion in combination with a 5 bp insertion further downstream (not shown). Sequence 2 contains a large deletion of 281 bp. (B) Purified Nek10 WT or a Y644F mutant were incubated with a tyrosine peptide substrate with the sequence EWMNWYWQRR and radiolabeled ATP. Peptide phosphorylation was quantified by scintillation counting (CPM = counts per minute). (C) Nek10 wild-type (WT), serine-specific (I693P(Ser)), tyrosine-specific (T692P(Tyr)) or kinase-dead (KD) was isolated from the cells described in Figure 5C and analyzed by mass spectrometry. Table shows the peptide count of each identified Nek10 phosphopeptide for each of the Nek10 variants. Phosphorylated sites are indicated by red lower case letters. (D) Cartoon representation of the Nek10 protein domain structure. Sites of Nek10 autophosphorylation are indicated. (E) Representative MS/MS spectrogram of the Nek10 peptide containing phosphorylated S358.
Figure 6 with 1 supplement

The Nek family diverges into four specificity-groups.
(A) Similarity matrix and dendrogram depicting the Pearson correlation between the phosphorylation-site motifs of the Nek kinase family members. (B) Similarity matrix and dendrogram showing the percentage identity between the amino acid sequences of the Nek kinase domains. (C) Heatmap depicting the OPLS data for the phospho-acceptor site position. Measured intensities of individual dots on OPLS dot blots were normalized to the average of all values in the position (e.g. −1 position), averaged over multiple experiments, and log2-transformed (n ≥ 2). Nek family members are ordered according to the clustering shown in panel (A). For each Nek the amino acid C-terminal to the DFG-motif (DFG+1) is depicted underneath the heatmap. (D) As in panel (A), but the phospho-acceptor specificity data was excluded from the clustering analysis. (E) As in panel (C), but for the −5 (left panel), −4 (middle panel) and −2 (right panel) position to emphasize the distinct specificities of the Nek6/7/9 group (boxed sections). (F) Surface representation of the substrate binding sites of Nek1 (PDB: 4APC) and Nek7 (PDB:5DE2). Surface is shaded according to electrostatic potential. The dotted yellow lines indicate specific basic patches in the Nek7 structure that potentially interact with acidic residues in the substrate. Peptide and ANP-Mn was modeled into the Nek1 and Nek7 structures by alignment with the Akt/GSK3-peptide structure (PDB: 1O6L; Figure 3D). (G) Purified Nek3 (left panel) or Nek7 (right panel) was incubated with peptide substrates and radiolabeled ATP. Peptide phosphorylation was quantified by scintillation counting. The phosphorylation rate was determined by linear regression (Mean ± SEM, n = 3, **p<0.005).
Figure 6—figure supplement 1
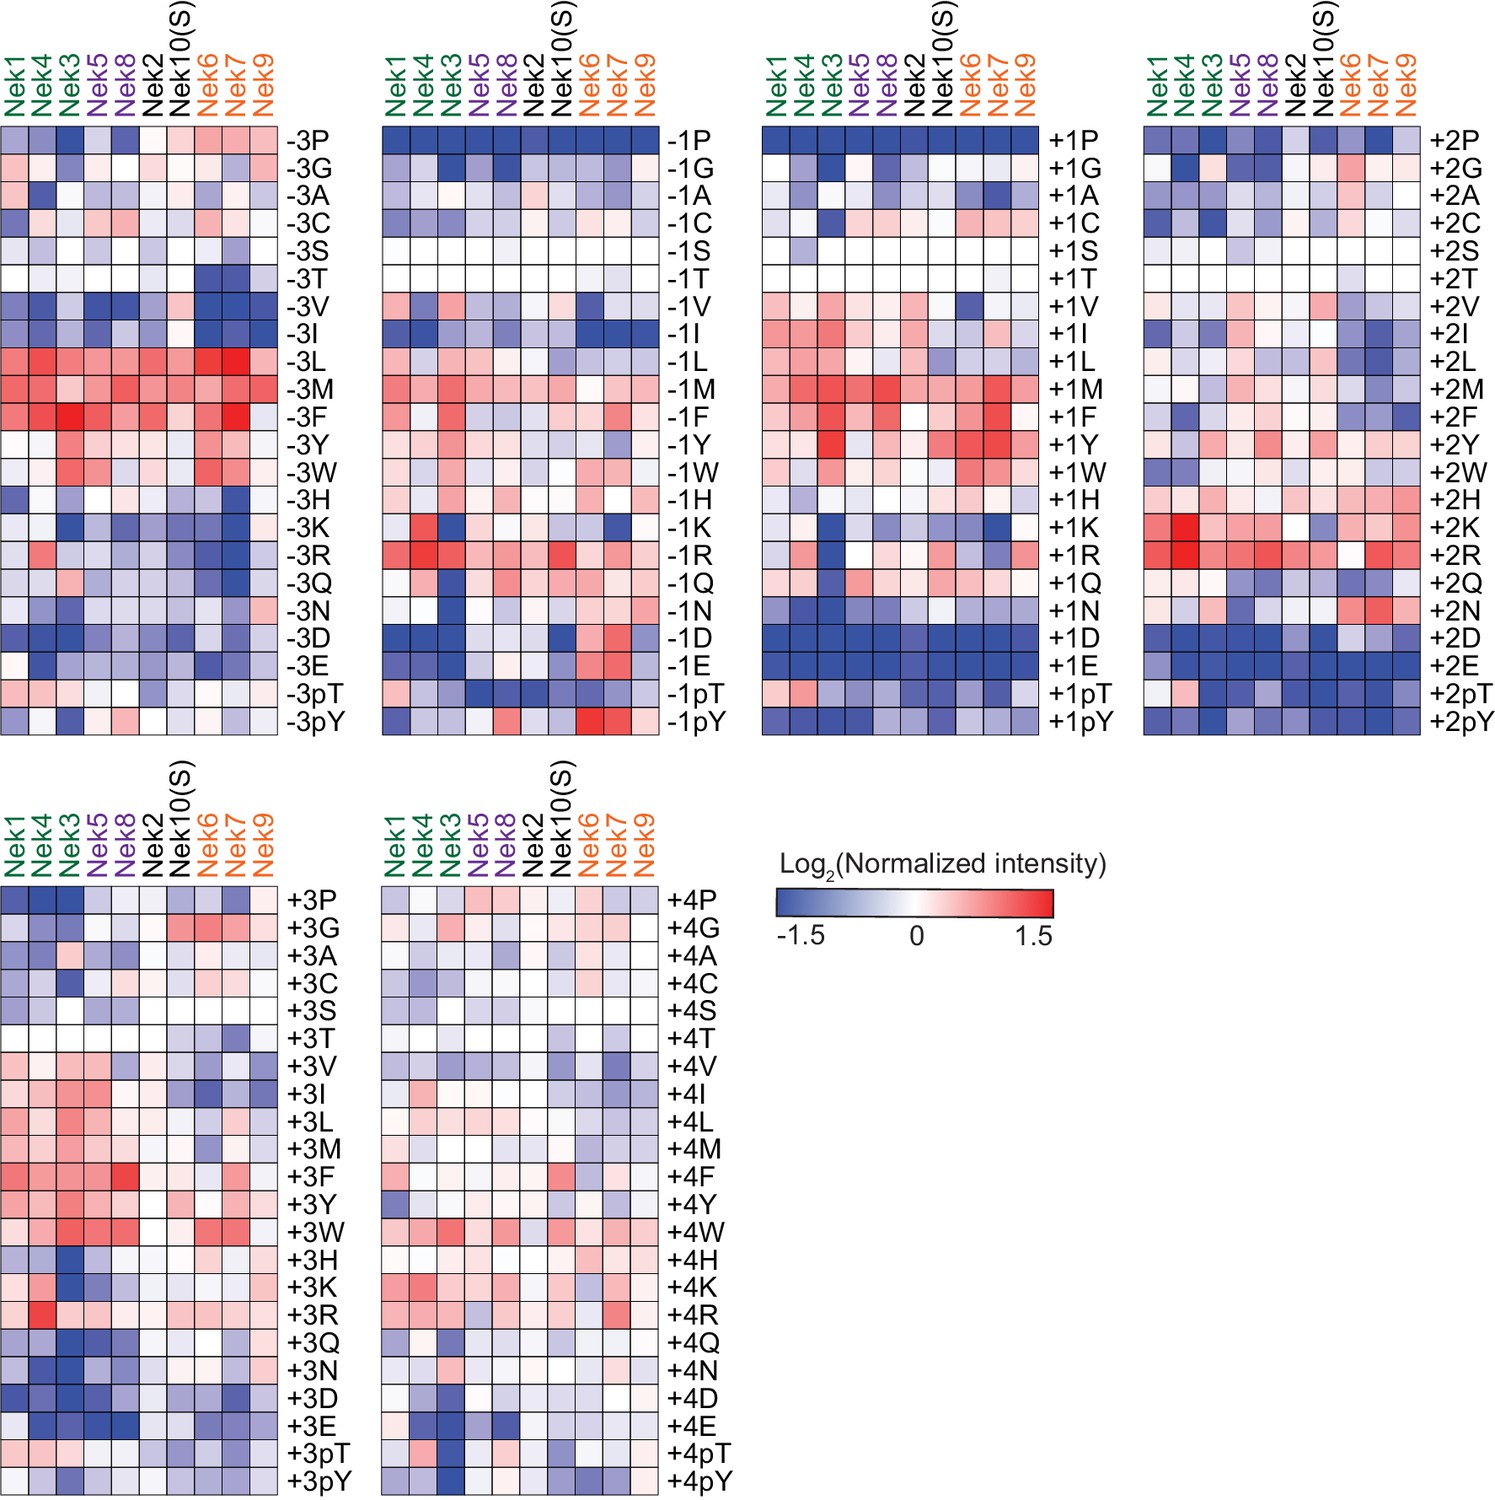
Comparison of Nek-family phosphorylation-site motifs.
Heatmaps depicting the OPLS data for the indicated positions. Data are represented as log2-transformations of measured intensities normalized to the average of all values measured for that position. Nek family members are ordered according to the clustering shown in Figure 6A.
Figure 7 with 1 supplement

Plk1 and Nek6, 7 and 9 share a common phosphorylation-site motif.
(A) Table depicting the consensus phosphorylation-site motifs for the different Nek specificity groups, and for Plk1, with Ø indicating hydrophobic amino acids. The Plk1 motif was generated from data published in Alexander et al. (2011). (B) Similarity matrix and dendrogram depicting the Pearson correlation between the phosphorylation-site motifs of the Nek family members, and Plk1. (C) Sites in the Phosphositeplus database were scored using the Scansite algorithm for their match to the phosphorylation-site motifs of Plk1, Nek6, Nek7 and Nek9. The best scoring 10% were plotted in the Venn diagram to indicate the fraction of good potential target sites shared between the kinases. (D) Sites with reduced phosphorylation upon Plk1 inhibition or knockdown, as reported by Santamaria et al. (2011), were scored for their match to the Plk1 or Nek7 phosphorylation-site motif using the Scansite algorithm. Note that the lower the score, the better the phosphorylation site sequence matches the optimal motif, with a score of 0 indicating a perfect match. Dotted lines indicate the 25% cut-off for best scoring sites. (E) Purified wild-type (WT) or kinase-dead (KD) Plk1 or Nek7 was incubated with HA-tagged Cdc27 WT or S434A/S435A double mutant (SS/AA), followed by phosphorimaging (32P) and immunoblotting for kinase and Cdc27 substrate levels. To quantify the level of phosphorylation (32P/HA), the 32P signals were corrected for HA signal, and the resulting value for the WT kinase with WT substrate sample (lane 3) was set to 1. (F) As in panel (E), now using RacGAP1 WT or S170A mutant as substrate. (G) A model of the signaling interactions and common phosphorylation site motif shared between Plk1, Nek9, Nek6, Nek7 that result in potential phospho-motif amplification during mitosis.
Figure 7—figure supplement 1
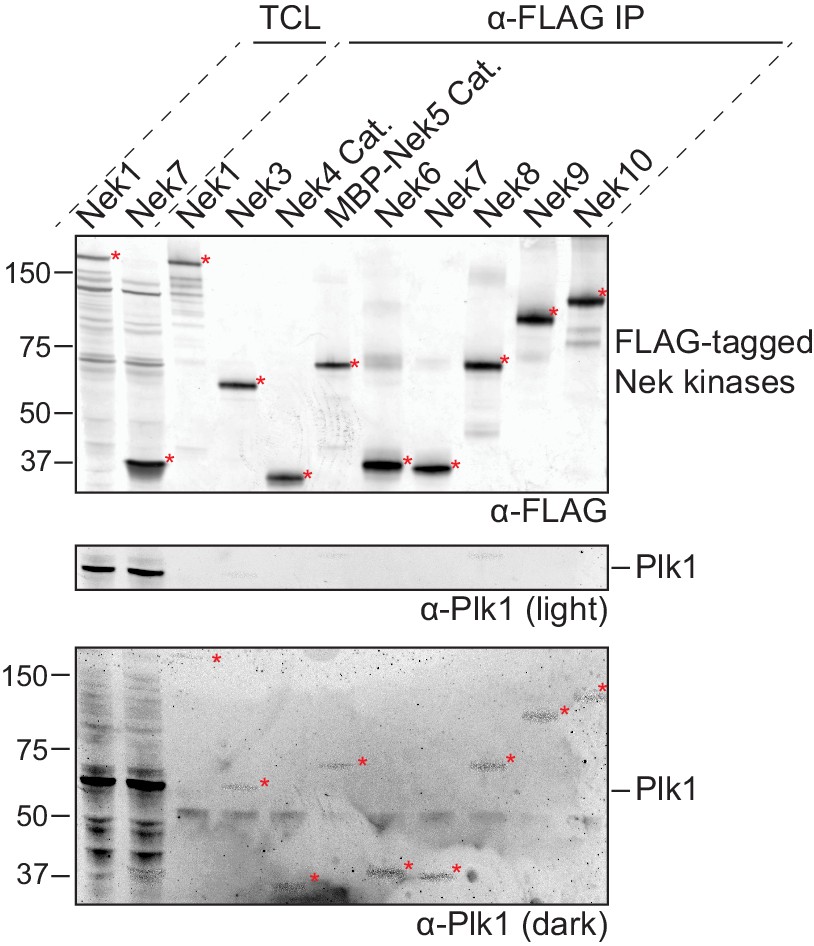
Preparations of isolated Nek kinases are free of Plk1.
FLAG-tagged(3x) variants of either full-length Nek kinases or catalytic domains (Cat.) of Nek4 or Nek5 were isolated by anti-FLAG IP from lysates of transfected HEK 293T cells and eluted from the beads with FLAG-peptide. A fraction of the Total Cell Lysate (TCL) of selected Nek kinases, and of the eluates of all Nek kinases (α-FLAG IP), were analyzed by immunoblotting for FLAG-tagged Nek kinase and for Plk1, followed by read-out on the Odyssey infrared imager. FLAG-tagged Nek kinase was detected in the 670 channel, but due to the high quantities of Nek kinase on the membrane, some signal was present in the 800 channel as well. This can be observed in the bottom panel which depicts a dark representation of the 670 channel used to detect Plk1. Red asterisks indicate Nek kinases, MBP = maltose-binding protein.
Author response image 1
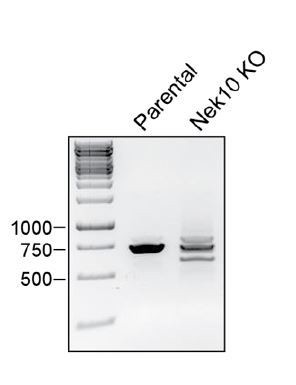
RNA was harvested from WT U-2 OS cells (parental) or a Nek10 KO U-2 OS clone (Nek10 KO), and reverse transcribed to generate cDNA.
A PCR with primers spanning the Nek10 sgRNA target locus was performed and analyzed by electrophoresis.
Tables
Key resources table
| Reagent type (species) or resource | Designation | Source or reference | Identifiers | Additional information |
|---|---|---|---|---|
| Cell line (Homo sapiens) | HEK 293T | ATCC | ATCC Cat# CRL-3216, RRID:CVCL_0063 | |
| Cell line (Homo sapiens) | U-2 OS | ATCC | ATCC Cat# HTB-96, RRID:CVCL_0042 | |
| Cell line (Homo sapiens) | U-2 OS Nek10 KO | This paper | Nek10 gene was edited by CRISPR technique, selected clone | |
| Cell line (Homo sapiens) | U-2 OS Nek10KO + ind Nek10 | This paper | Dox-inducible Nek10 was introduced in the Nek10 KO clone | |
| Antibody | Mouse monoclonal anti-FLAG M2 | Sigma | Sigma-Aldrich Cat# F1804, RRID:AB_262044 | WB 1:1000 |
| Antibody | Rabbit monoclonal anti-FLAG | Sigma | Sigma-Aldrich Cat# F7425, RRID:AB_439687 | WB 1:1000 |
| Antibody | Rat monoclonal anti-HA 3F10 | Roche | Roche Cat# ROAHAHA, RRID:AB_2687407 | WB 1:500 |
| Antibody | Mouse monoclonal anti-B-Actin | Sigma | Sigma-Aldrich Cat# A2228, RRID:AB_476697 | WB 1:10,000 |
| Antibody | Rabbit polyclonal anti-B-Actin | Cell Signaling Technology | Cell Signaling Technology Cat# 4967, RRID:AB_330288 | WB 1:1000 |
| Antibody | Rabbit monoclonal anti-phosphotyrosine | Cell Signaling Technology | Cell Signaling Technology Cat# 8954, RRID:AB_2687925 | WB 1:2000 |
| Antibody | Rabbit polyclonal anti-Plk1 | Santa Cruz Biotechnology | Santa Cruz Biotechnology Cat# sc-5585, RRID:AB_2167406 | WB 1:100 |
| Antibody | Mouse monoclonal anti-Plk1 | Santa Cruz Biotechnology | Santa Cruz Biotechnology Cat# sc-17783, RRID:AB_628157 | WB 1:100 |
| Antibody | Goat polyclonal -anti-Mouse 800/680 | LI-COR Biosciences | LI-COR Biosciences Cat# 926–32210, RRID:AB_621842 | WB 1:10,000 |
| Antibody | Goat polyclonal-anti-Rabbit 800/680 | LI-COR Biosciences | LI-COR Biosciences Cat# 926–32211, RRID:AB_621843 | WB 1:10,000 |
| Antibody | Goat polyclonal-anti-Rat 800 | LI-COR Biosciences | LI-COR Biosciences Cat# 926–32219, RRID:AB_1850025 | WB 1:10,000 |
| Antibody | Anti-FLAG M2 affiinity gel | Sigma | Sigma-Aldrich Cat# A2220, RRID:AB_10063035 | |
| Antibody | Anti-HA affinity matrix | Roche | Roche Cat# 11815016001, RRID:AB_390914 | |
| Recombinant DNA reagent | V1900-Nek3-3xFLAG (idem for Nek4-Nek9) | This paper | Gateway cloned from ORFeome into V1900 (pCMV-Sp6 with C-term. FLAG-tag) | |
| Recombinant DNA reagent | pcDNA3-3xFLAG | This paper | A 3xFLAG primer dimer was cloned by restrion ligation into pcDNA3 for C- or N-terminal tagging | |
| Recombinant DNA reagent | pcDNA3-Nek1-3xFLAG | This paper | PCR NEK1 from ORFeome, cloned into pcDNA3-3xFLAG | |
| Recombinant DNA reagent | pcDNA3-Nek4 Cat.-3xFLAG | This paper | PCR Nek4 Catalytic domain from V1900-Nek4, cloned into pcDNA-3xFLAG | |
| Recombinant DNA reagent | pcDNA3-MBP-3xFLAG | This paper | PCR maltose binding protein, cloned into pcDNA-3xFLAG (N-term.) | |
| Recombinant DNA reagent | pcDNA3-MBP-3xFLAG-Nek5 | This paper | PCR Nek5 Catalytic domain from V1900-Nek5, cloned into pcDNA-MBP-3xFLAG | |
| Recombinant DNA reagent | pcDNA3-3xFLAG-TEV-2xstrep-6xHIS | This paper | A gene block with the complete tag was cloned into pcDNA3 | |
| Recombinant DNA reagent | pcDNA3-Nek2-3xFLAG-TEV- 2xstrep-6xHIS | This paper | Nek2 Catalytic domain PCR from copy-DNA, cloned into pcDNA3-3xFLAG-TEV-2xstrep-6xHIS | |
| Recombinant DNA reagent | pCMV-3xFLAG-Nek10 | PMID: 20956560 | ||
| Recombinant DNA reagent | pcDNA-3xFLAG-Nek10 | this paper | PCR correction of missing cDNA fragment, cloning into pcDNA3 | |
| Recombinant DNA reagent | pET-RSF-Plk1 Cat Domain | This paper | PCR Cat domain Plk1, cloning into pET-RSF | |
| Recombinant DNA reagent | pcDNA-2xHA-Strep | This paper | pcDNA3 modified with a 2xHA-1xStrepTAGII | |
| Recombinant DNA reagent | pcDNA-2xHA-Strep-Cdc27 | This paper | PCR Cdc27 from copy-DNA cloe into pcDNA-2xHA-Strep | |
| Recombinant DNA reagent | pcDNA-2xHA-Strep-RacGAP1 | This paper | PCR RacGAP1 from copy-DNA cloe into pcDNA-2xHA-Strep | |
| Recombinant DNA reagent | LentiGuide-Puro | Addgene 52963 | RRID:Addgene_52963 | |
| Recombinant DNA reagent | LentiGuide-Puro Nek10 sgRNA | This paper | GTCTGAGCCCGCCATCAGGG | |
| Recombinant DNA reagent | LentiGuide-Puro Cas9 sgRNA | This paper | CTTGTACTCGTCGGTGATCA | |
| Recombinant DNA reagent | pLVX-Cas9-Zsgreen | This paper | Cas9 from addgene 50661 into pLVX-ZsGreen | |
| Recombinant DNA reagent | pX335-Cas9(D10A) | Addgene 42335 | RRID:Addgene_42335 | |
| Recombinant DNA reagent | pCW-3xFLAG-Nek10-T2A-eGFP | This paper | Replace Cas9 in addgene50661 with Nek10-T2A-eGFP, replace puromycin with blasticidin cassette | |
| Peptide, recombinant protein | 3xFLAG peptide | APExBIO | 3xFLAG peptide_APExBIO:A6001 | |
| Peptide, recombinant protein | Kinase substrate library group I | Anaspec | Kinase substrate library group I_Anaspec:AS-62017–1 | |
| Peptide, recombinant protein | Kinase substrate library group II | Anaspec | Kinase substrate library group II_Anaspec:AS-62017–1 | |
| Peptide, recombinant protein | Kinase substrate library 0 column S/T/Y | Anaspec | Custom order | |
| Peptide, recombinant protein | Tyrosine peptide library | JPT | Custom order | |
| Chemical compound, drug | Odyssey blocking buffer | LI-COR Biosciences | Odyssey blocking buffer in PBS_LI-COR:927–40000 | |
| Software, algorithm | Morpheus | https://software.broadinstitute.org/morpheus/ | ||
| Other | Pintool | V and P Scientific | Tube style floating pin_V and P Scientific:FP3S200 | |
| Other | Mantis nanodispenser | Formulatrix | Manti liquid handler_Formulatrix | |
| Other | p81 phosphocellulose paper | Reaction biology | P81 Ion exchange celluose chromatography paper_Reaction Biology Corp | |
| Other | Strep-Tactin XT superflow | IBA lifesciences | Strep-Tactin XT superflow_IBA Life sciences:2–4010 | |
| Other | Nickel-column | GE healthcare | Ni Sepharose 6 Fast flow_GE healthcare:17531801 | |
| Other | Streptavidin membrane | Promega | SAM2 Biotin capture mebrane_Promega:V686X |
Additional files
-
Source data 1
PSSMs of Nek family phosphorylation site motifs.
- https://doi.org/10.7554/eLife.44635.020
-
Supplementary file 1
List of sites phosphorylated by the Nek kinases.
The Phosphositeplus database was mined for sites on human substrates that have been reported to be phosphorylated by any of the Nek kinases for which we determined the motif in this manuscript. The −3 column is shaded yellow. Leucine, methionine and phenylalanine are colored in purple in the −3 and + 1 positions for all Nek kinases, asparigine is colored in red in the −2 position for Nek6, and basic residues are colored in blue in the −1 and +2 positions for Nek1 and Nek3.
- https://doi.org/10.7554/eLife.44635.021
-
Transparent reporting form
- https://doi.org/10.7554/eLife.44635.022
Download links
A two-part list of links to download the article, or parts of the article, in various formats.
Downloads (link to download the article as PDF)
Open citations (links to open the citations from this article in various online reference manager services)
Cite this article (links to download the citations from this article in formats compatible with various reference manager tools)
Comprehensive substrate specificity profiling of the human Nek kinome reveals unexpected signaling outputs
eLife 8:e44635.
https://doi.org/10.7554/eLife.44635


