TERRA regulate the transcriptional landscape of pluripotent cells through TRF1-dependent recruitment of PRC2
- Spanish National Cancer Centre (CNIO), Spain
Figures
Figure 1 with 2 supplements

Transcriptome of TRF1-depleted iPS cells.
(A) Western blot of TRF1 protein and actin (ACT) as the loading control in control and TRF1-depleted iPS cells. (B–J) Gene expression data obtained by RNA-seq of two independent experiments of TRF1-depletion in iPS cells, analyzed by Gene Set Enrichment Analysis (GSEA) to determine significantly enriched gene sets. Highly significant gene sets are shown here. Genes that were downregulated upon TRF1 deletion were enriched in targets of MYC (B), SOX2 (C), NANOG (D) and BMP2 (G). They were also enriched in genes that are expressed in ES cells (E) and in genes that are downregulated during differentiation (F). Genes that are upregulated upon TRF1 deletion were enriched in genes that are also upregulated during differentiation (H) and in targets of SUZ12 (I) and BMP2 (J). (K) Changes of gene expression in TRF1-depleted iPS cells analyzed by RNA-seq. The table summarizes the numbers of expressed transcripts that are expressed differentially in TRF1-depleted and control iPS cells. (L) Analysis using Enrichr of genes that are downregulated in TRF1-deleted iPS cells relative to control cells. The clustergram, representing the results of a CHEA analysis, shows that an important number of downregulated genes are targets of numerous pluripotency factors. The numbers on the top of the clustergram indicate the percentage of all of the downregulated genes that are targets of each pluripotency factor. Note that more than 40% of all downregulated genes are bound by OCT4. (M) Analysis using Enrichr of genes that are upregulated in TRF1-deleted iPS cells relative to control cells. The clustergram, representing the results of a CHEA analysis, shows that an important number of upregulated genes are mainly targets of polycomb-related proteins (red) and differentiation-related proteins (blue). The numbers on the top of the clustergram indicate the percentage of all of the upregulated genes that are targets of each factor.
Figure 1—figure supplement 1

TRF1 abrogation in 2i-grown iPS cells does not increase DNA damage.
(A) Left, representative telomeric FISH imaging of metaphase-stage control and TRF1-depleted Trp53–/– 2i-grown iPS cells. White arrows point to the presence of multitelomeric signals (MTS). Right, quantification of the number of MTS per metaphase. Note the dramatic increase in MTS upon TRF1 depletion. N = number of metaphases. Error bars = standard errors of the means (SE). Statistical analysis was carried out using Student's t-test. The experiment was performed once. (B) (Left) Representative image of Western blots of γH2AX and SMC1 (as loading control) from control and TRF1-depleted iPS cells. (Right) Quantification of γH2AX levels in four independent experiments. Note that γH2AX levels are not affected by the depletion of TRF1 protein. n = number of independent experiments. Error bars = SE. Statistical analysis, Student's t-test. (C) (Left) Representative double-immunofluorescence imaging of telomeric protein RAP1 and the DNA-damage marker γH2AX in control iPS and TRF1-depleted iPS. (Right) Quantification of γH2AX intensity per nucleus. Note that there is no increase of DNA damage upon TRF1 abrogation. Data were obtained from one experiment. n = number of cells analyzed from each sample. Error bars = SE. Statistical analysis, Student's t-test. (D) Quantification of the number of TIFs (telomere induced foci) present in the cells shown in (C), measured as the number of colocalizations of the telomeric protein RAP1 with the DNA damage marker γH2AX. Note that there is no increase of telomeric damage upon TRF1 deletion in these conditions. Data were obtained from one experiment. n = number of cells analyzed from each sample. Error bars = SE. Statistical analysis, Student's t-test.
Figure 1—figure supplement 2
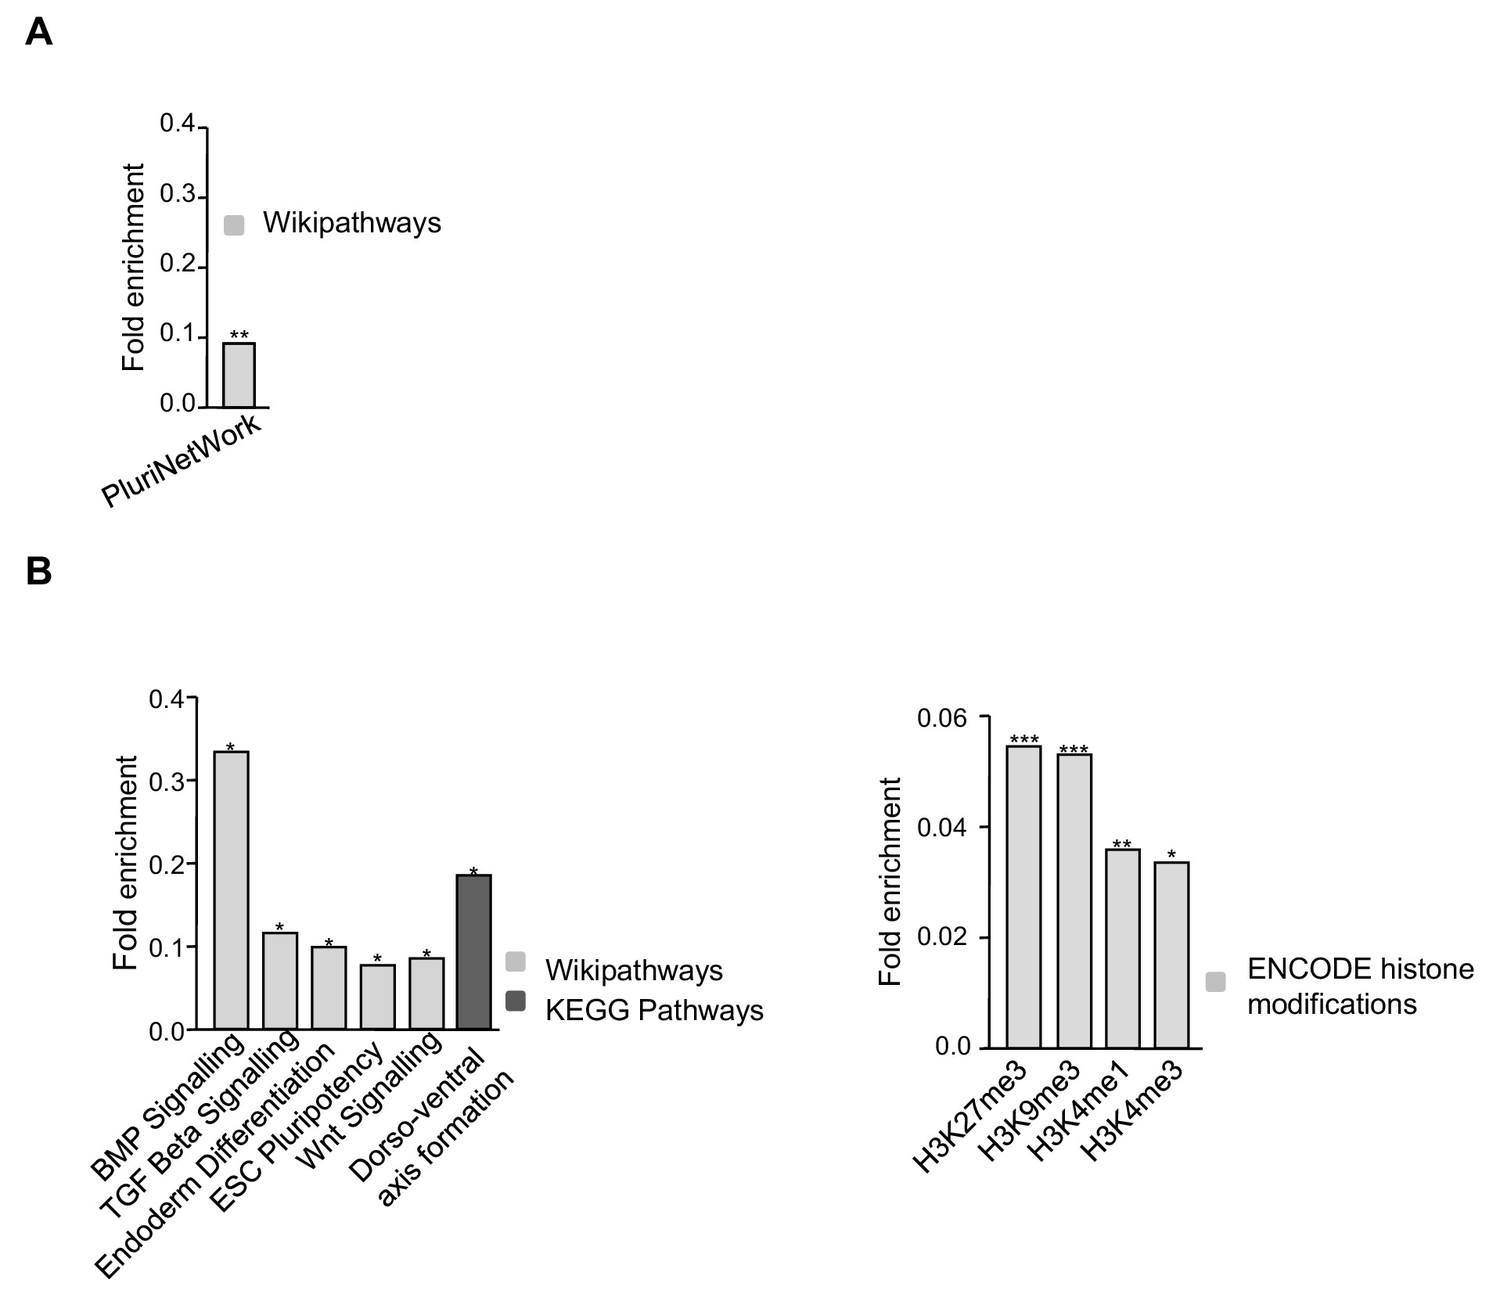
Functional annotation of genes altered when depleting TRF1.
(A) Genes that are downregulated upon TRF1 deletion are involved in signaling pathways that regulate the pluripotency of stem cells. (B) Genes that are upregulated upon TRF1 deletion were enriched in important pathways regulating pluripotency and differentiation (left) and in several epigenetics marks (right), including the polycomb-related chromatin marks H3K27me3 and H3K4me3.
Figure 2 with 4 supplements
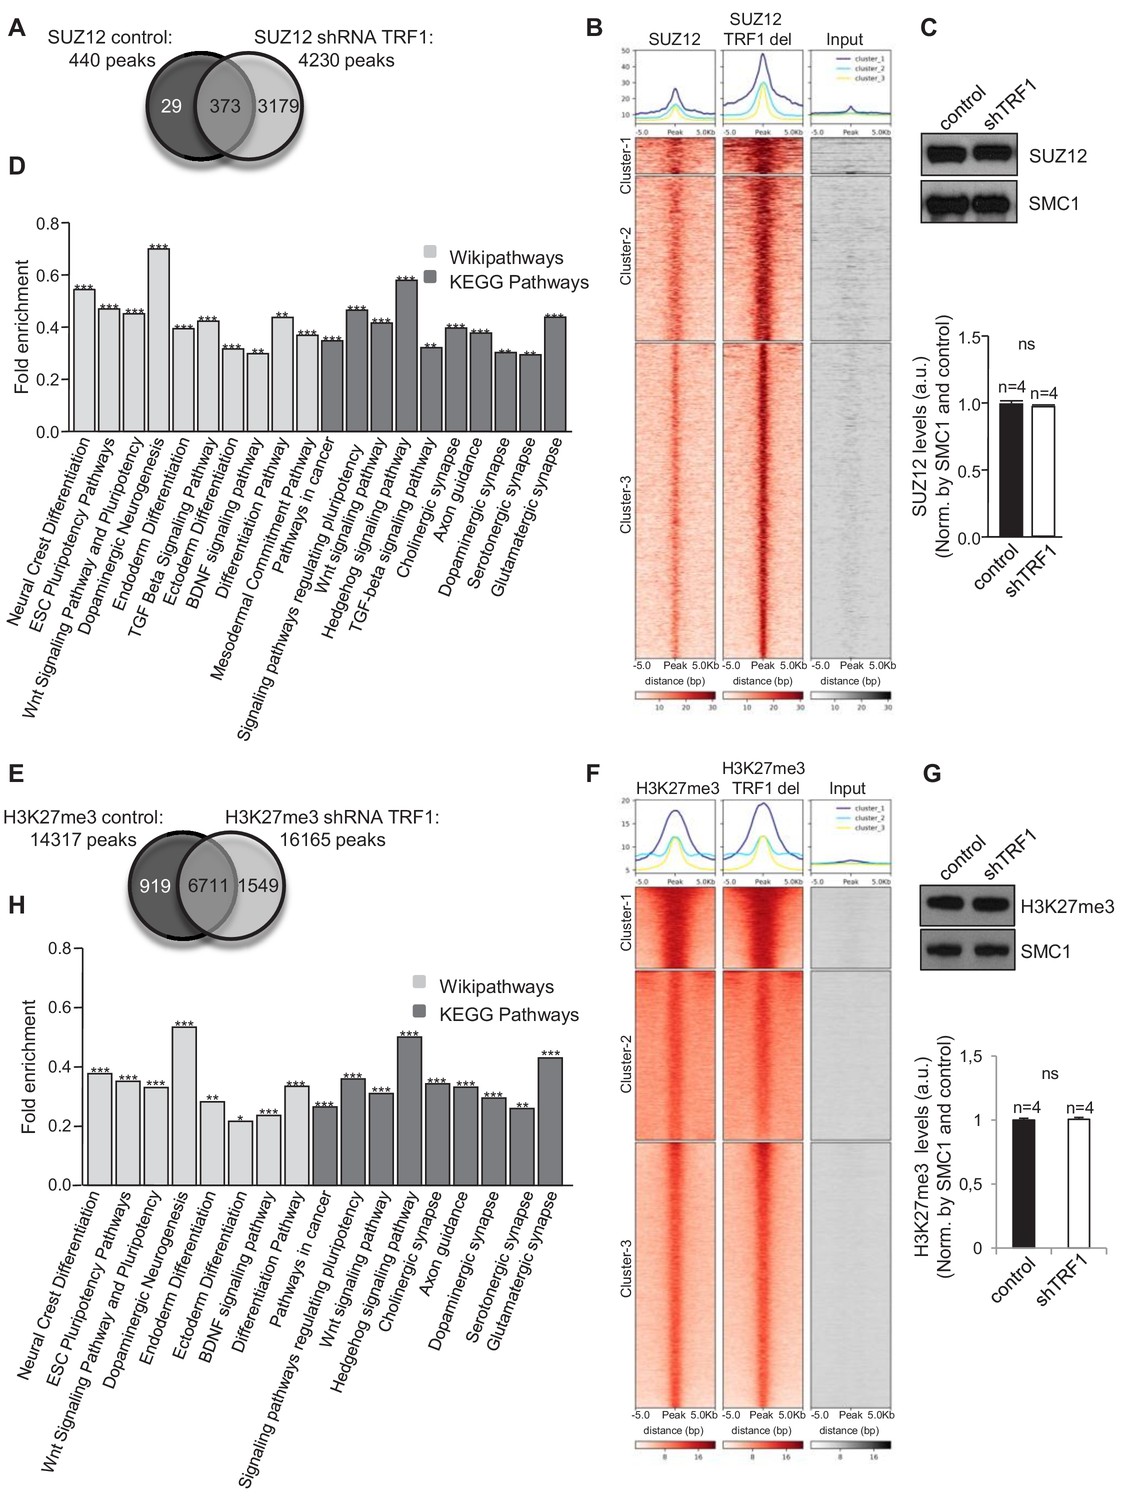
Abrogation of TRF1 alters SUZ12 and H3K27me3 genome localization.
Analysis of the genome-wide binding of SUZ12 and H3K27me3 by chromatin immunoprecipitation followed by deep sequencing (ChIP-seq) in control and TRF1-depleted 2i-grown iPS cells. (A) Number of SUZ12 binding peaks in control and TRF1-depleted cells. Note that TRF1 abrogation significantly increases the number of SUZ12 binding sites in the genome (4230 peaks) compared to that in control cells (440 peaks). The Venn diagram shows the number of genes that are annotated to SUZ12 peaks in both conditions. (B) Heat maps of the reads distribution around 5 Kb of SUZ12 peaks in control and TRF1-depleted cells. Note the visible increase in SUZ12 deposition in these sites upon TRF1 depletion. (C) (Top) Representative image of Western blots of SUZ12 and SMC1 (as loading control) from control and TRF1-depleted iPS cells. (Bottom) Quantification of SUZ12 levels in four independent experiments. Note that SUZ12 protein levels are not affected by the depletion of TRF1 protein. n = number of independent experiments. Error bars = SE. Statistical analysis, Student's t-test. (D) KEGG AND Wikipathways analysis of the genes associated with the sites of the genome were increased binding of SUZ12 protein was observed upon abrogation of TRF1. Genes annotated in Clusters 1, 2 and 3 of the SUZ12 heatmap (Figure 2B) were used. Note that these genes are mainly enriched in pathways related to pluripotency, differentiation and the development of the nervous system. ** = Adjusted p value <0.01, *** = Adjusted p value <0.001. (E) Number of H3K27me3 binding peaks in control and TRF1-deleted cells. Note that TRF1 abrogation increases the number of H3K27me3 binding sites within the genome (16,165 peaks) compared to that in control cells (14,317 peaks). The Venn diagram shows the number of genes annotated to H3K27me3 peaks in both conditions. (F) Heat maps of the reads distribution around 5 Kb of H3K27me3 peaks in control and TRF1-depleted cells. Note that Cluster 1 shows an increase in H3K27me3 deposition upon TRF1 downregulation. (G) (Top) Representative image of Western blots of H3K27me3 and SMC1 (as loading control) from control and TRF1-depleted iPS cells. (Bottom) Quantification of H3K27me3 levels in four independent experiments. n = number of independent experiments. Error bars = SE. Statistical analysis, Student's t-test. Note that H3K27me3 protein levels are not affected by the depletion of TRF1 protein. (H) KEGG and Wikipathways analysis of the genes associated with the genome sites were increased binding of H3K27me3 protein was observed upon depletion of TRF1. Genes annotated in Cluster 1 of the H3K27me3 heatmap (Figure 2F) were used. Note that the results are very similar to those obtained for SUZ12. ** = Adjusted p value <0.01, *** = Adjusted p value <0.001.
Figure 2—figure supplement 1
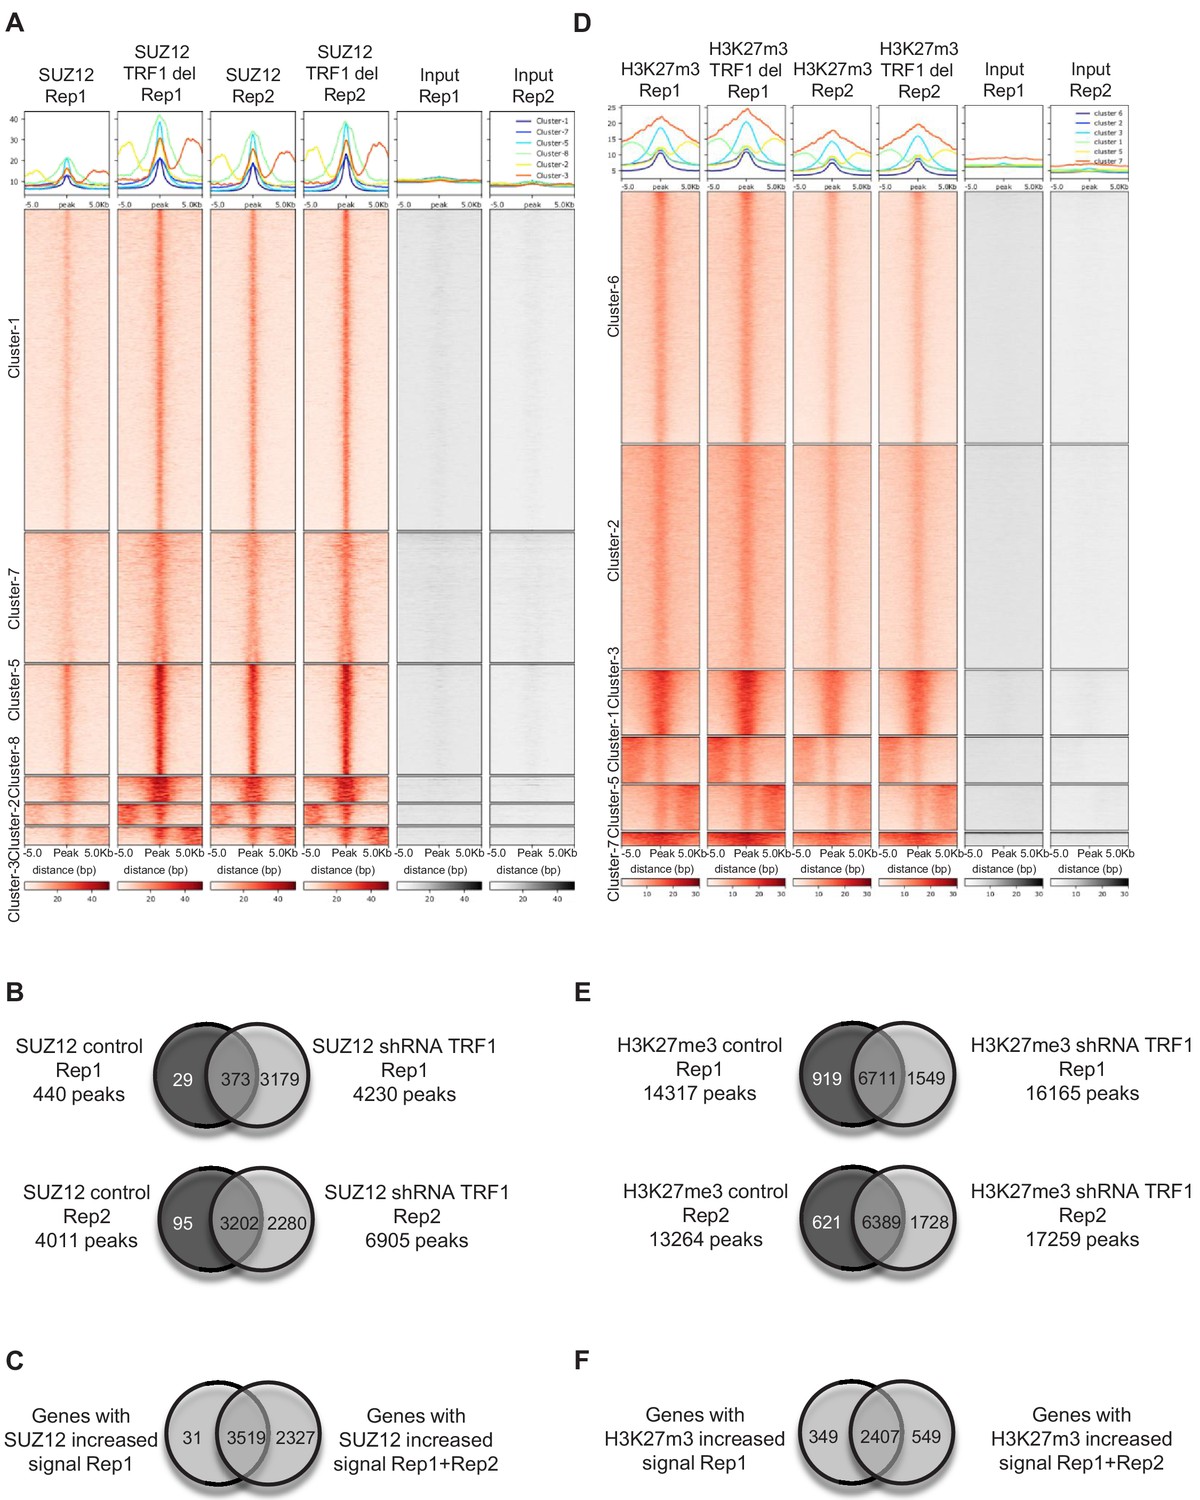
Validation of SUZ12 and H3K27me3 ChIP-seq.
(A) Heatmaps of the two biological replicates of SUZ12 ChIP-seq, with reads plotted around the peaks for both replicates. Note that the pattern of both replicates is the same. All of the clusters include regions where SUZ12 increases upon TRF1 depletion in both replicates. (B) Venn diagrams showing the overlapping of genes associated with peaks in control samples and samples in which TRF1 have been depleted for both SUZ12 ChIP-seq replicate 1 (top) and SUZ12 ChIP-seq replicate 2 (bottom). (C) Venn diagram showing the overlapping of genes that showed increased SUZ12 mark upon TRF1 depletion in replicate 1 of SUZ12 ChIP seq (Clusters 1, 2 and 3 of Figure 2B) with genes that showed increased SUZ12 mark upon TRF1 depletion in both SUZ12 ChIP seq replicates (all of the clusters of (A)). Note that that 99% of the genes that show increased levels of SUZ12 upon TRF1 depletion in the first experiment also show higher levels of SUZ12 in the second replicate, confirming the high similarity between the two ChIP-seq replicates. (D) Heatmaps of the two biological replicates of H3K27me3 ChIP-seq, with reads plotted around the peaks for both replicates. Note that the pattern is the same for both replicates. Clusters 3 and 7 include regions where H3K27me3 increases upon TRF1 depletion in both replicates. (E) Venn diagrams show the overlapping of genes associated with peaks in control samples and in samples in which TRF1 has been depleted for both H3K27me3 ChIP-seq replicate 1 (top) and H3K27me3 ChIP-seq replicate 2 (bottom). (F) Venn diagram showing the overlapping of genes that showed increased H3K27me3 mark upon TRF1 depletion in H3K27me3 ChIP seq replicate 1 (Cluster 1 of Figure 2F) with genes that showed increased H3K27me3 mark upon TRF1 depletion in both H3K27me3 ChIP seq experiments (Clusters 3 and 7 of (D)). Note that that 90% of the genes that show increased levels of H3K27me3 upon TRF1 depletion in the first experiment also show higher levels of H3K27me3 in the second replicate, confirming the close similarity between the two ChIP-seq experiments.
Figure 2—figure supplement 2
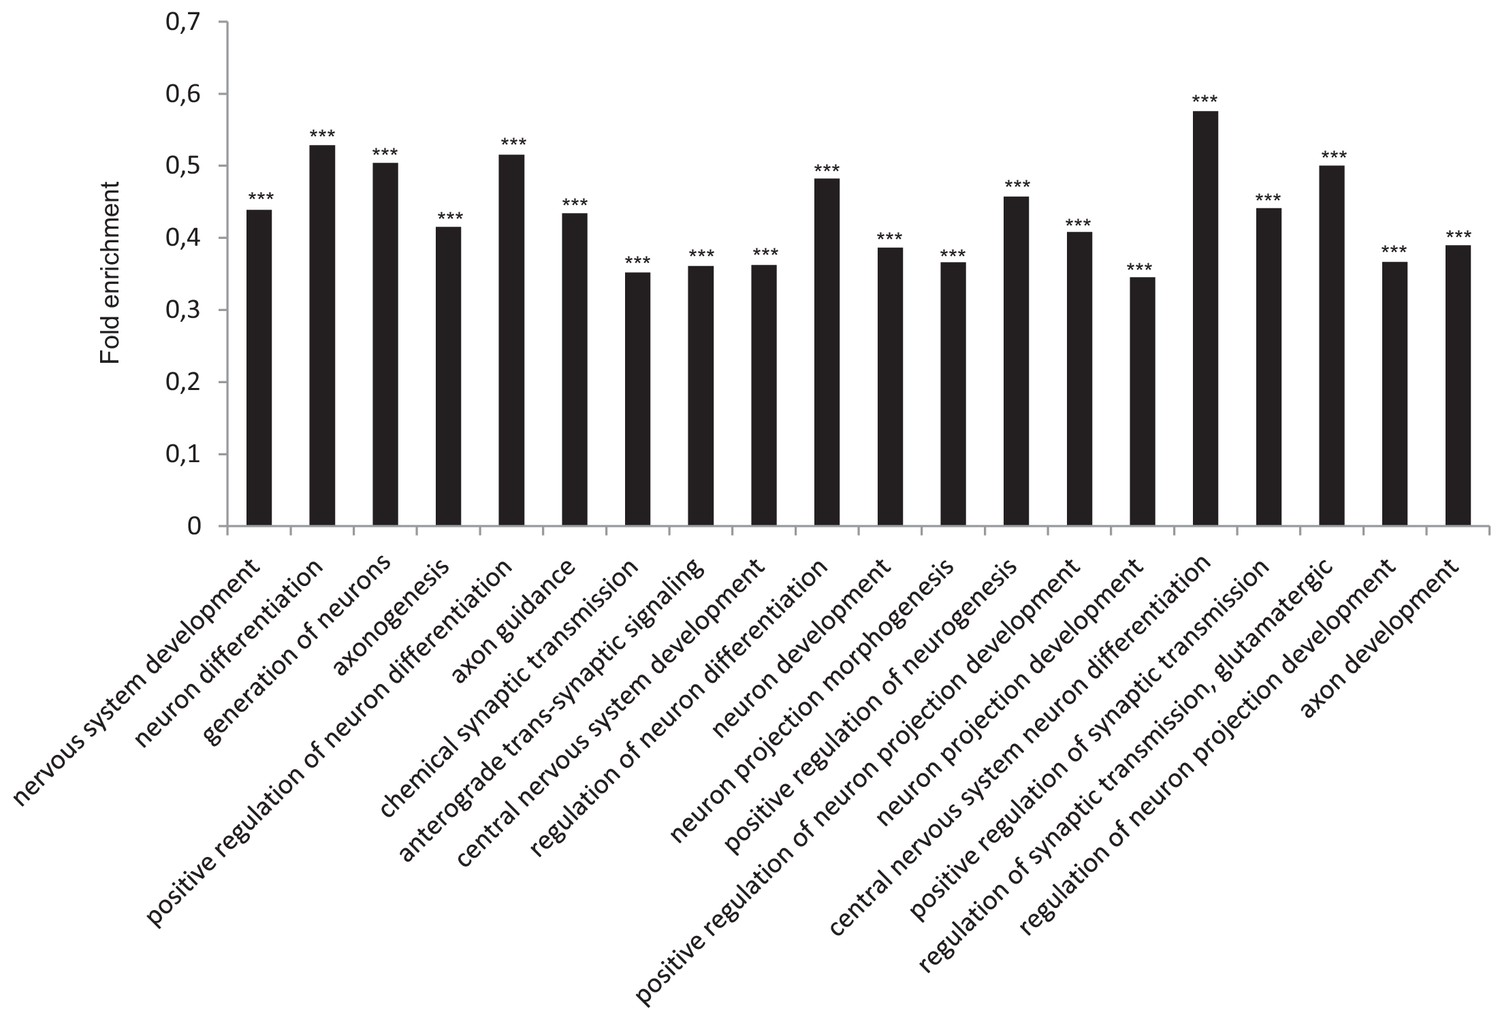
Functional annotation analysis of genes enriched in SUZ12 upon TRF1 depletion.
(A) GO Biological process analysis of the genes associated with the genome sites were increased binding of SUZ12 protein was observed upon depletion of TRF1. Genes annotated in Clusters 1, 2 and 3 of the SUZ12 heatmap (Figure 2B) were used. Note that these genes are highly involved in processes related to the nervous system. *** = Adjusted p-value <0.0001.
Figure 2—figure supplement 3

Abrogation of TRF1 in 2i-grown iPS cells induces the loss of the naïve state and a transition to a primed or differentiated state.
(A) Heatmaps of the reads of SUZ12 and H3K27me3 around 2.5 Kb of the transcriptional start sequence (TSS) of bivalent genes. Note the dramatic increase of SUZ12 deposition at the TSS of bivalent genes. Increase in H3K27me3 at these sites was also clear but moderate. (B) Gain of SUZ12 and H3K27me3 peaks in some Hox clusters.
Figure 2—figure supplement 4
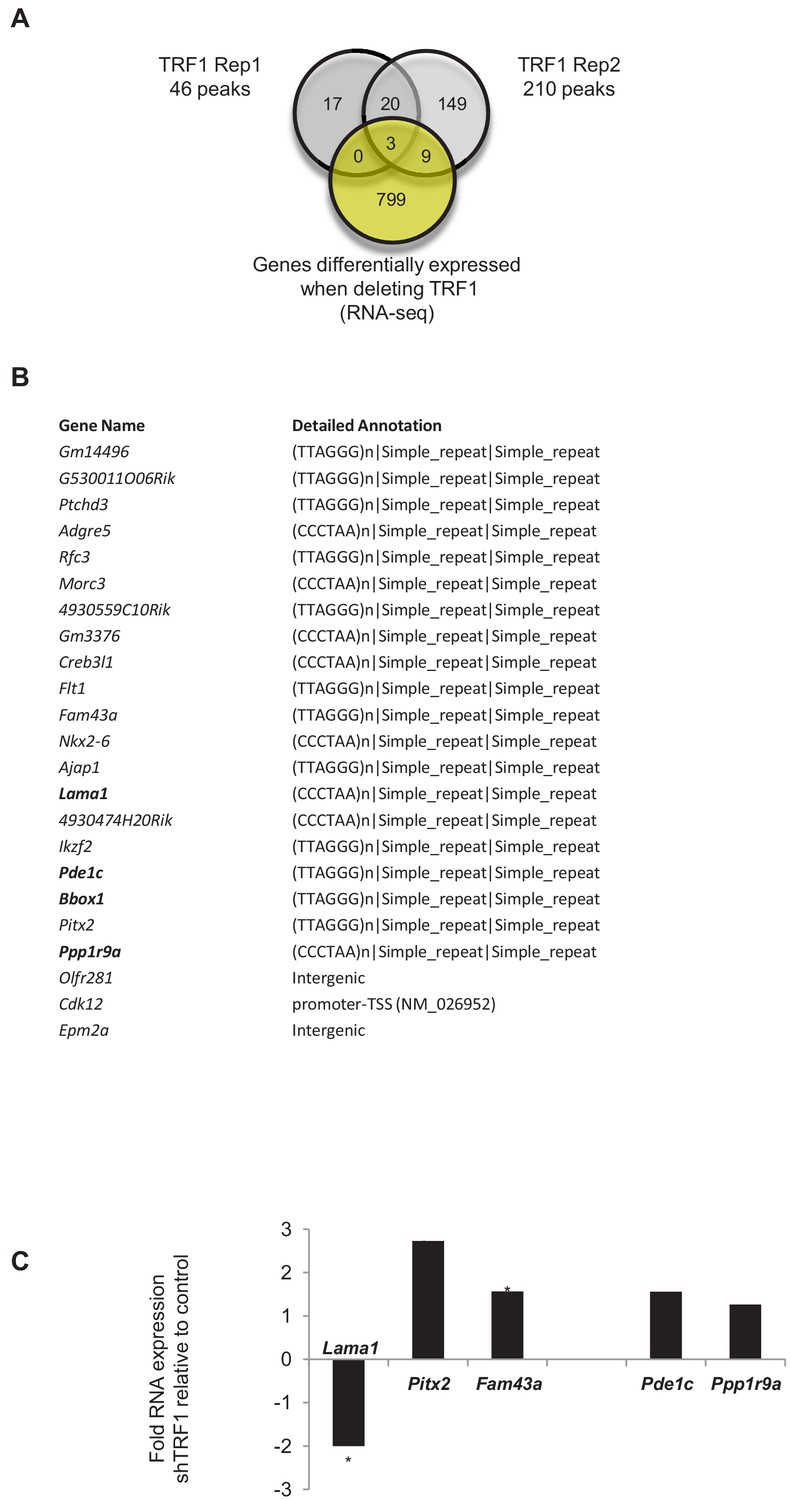
Extratelomeric binding of TRF1 in 2i-grown iPS cells.
(A) Venn diagram showing the overlap of genes annotated to TRF1 peaks in both replicates of TRF1 ChIP-seq with the whole set of genes differentially expressed when depleting TRF1, as obtained by RNA-seq. Note that only three genes that are bound by TRF1 show significantly altered expression upon TRF1 depletion. (B) List of genes annotated to TRF1 peaks in both replicates of TRF1 ChIP-seq. Detailed annotation shows the binding sequence corresponding to each peak. Note that most of the peaks' binding sites correspond to telomeric repetitions (TTAGGG or CCCTAA). Gene targets of ZFP322A are labeled in bold. (C) Changes in the expression of gene targets of TRF1 (Lama1, Pitx2 and Fam43a) and of targets of ZFP322A (Lama1, Pde1c and Ppp1r9a) that are significantly altered when depleting TRF1, as determined by RNA-seq. Note that two of the gene targets of ZFP322A were upregulated in the RNA-seq, whereas one of them, Lama1, was significantly downregulated.
Figure 3 with 1 supplement

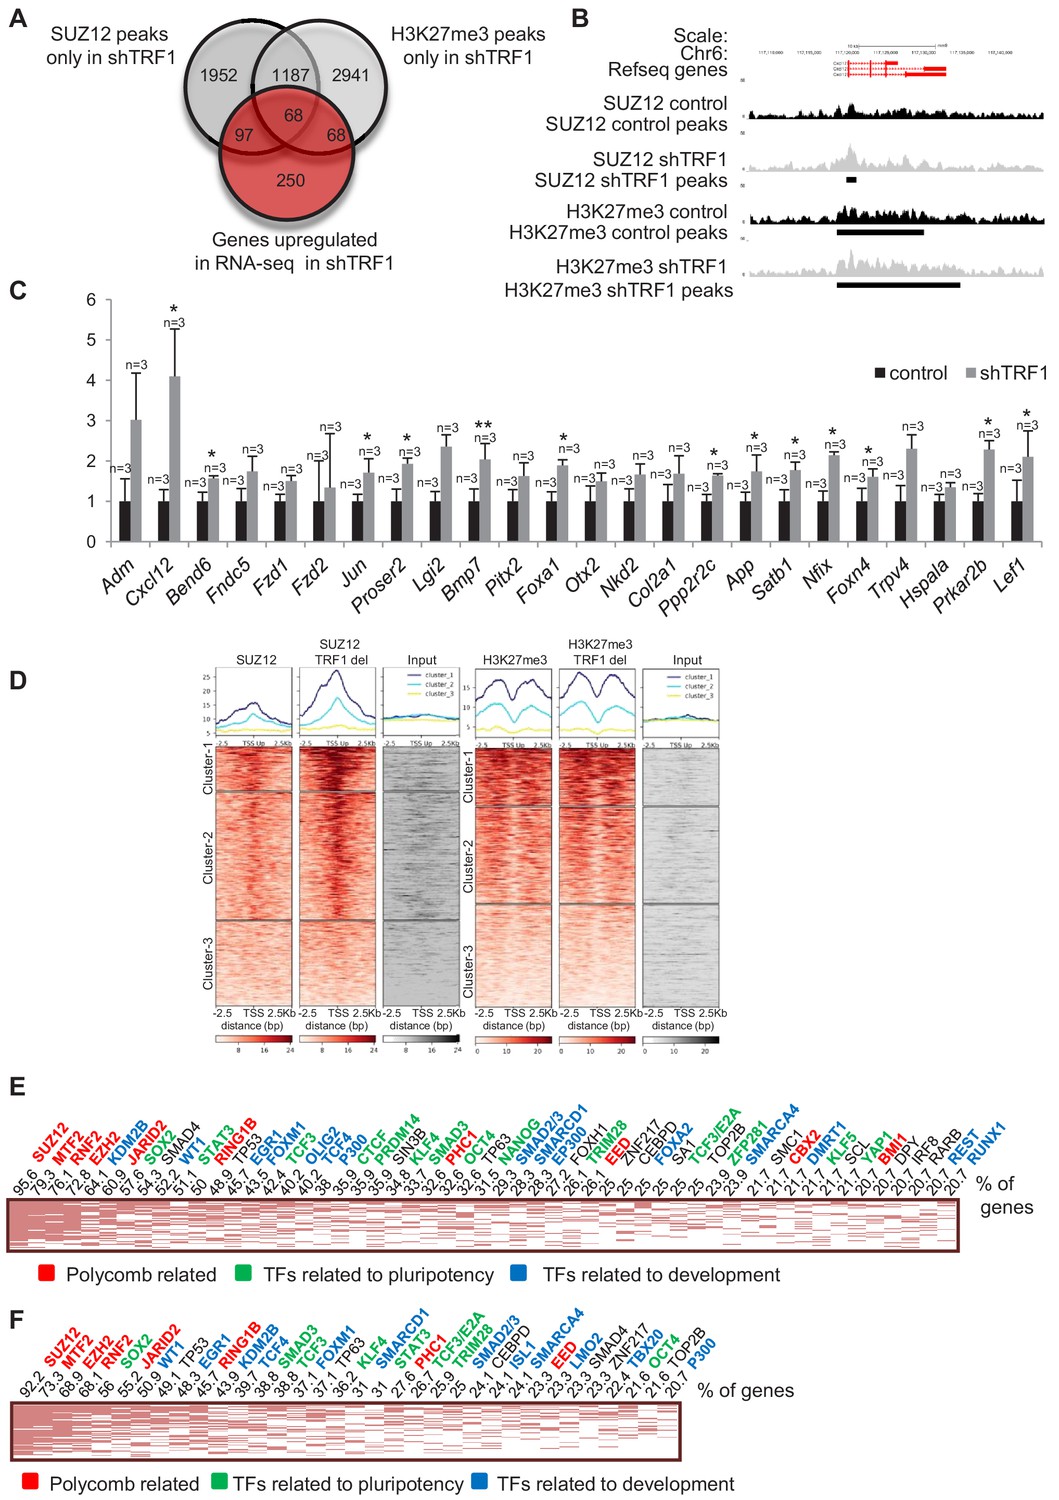
Depletion of TRF1 induces the recruitment of SUZ12 and H3K27me3 to genes that are downregulated in the absence of TRF1.
(A) Venn diagram showing overlap of genes bound by SUZ12 and H3K27me3 specifically in the absence of TRF1 with the set of genes that are downregulated in this same condition, as obtained by RNA-seq. Note that a number of downregulated genes gain SUZ12 and H3K27me3 peaks upon TRF1 abrogation. (B) Gain of SUZ12 and H3K27me3 peaks in the Myc gene. (C) Gene expression analysis by q-PCR of genes that are downregulated upon TRF1 depletion in which SUZ12 or H3K27me3 recruitment was detected. Note that abrogation of TRF1 induces a clear reduction in the expression of these genes, as observed before by RNA-seq. As a control, we confirmed that TRF1 expression was drastically decreased. n = number of independent experiments. Error bars = SE. Statistical analysis, one tail, paired Student's t-test. * = p value<0.05; ** = p value<0.01. (D) Heat maps of the distribution of reads of SUZ12 and H3K27me3 within 2.5 Kb of the transcription start sites (TSS) of all of the genes that are significantly downregulated in the RNA-seq upon TRF1 abrogation. Note that Clusters 1 of both the SUZ12 and the H3K27me3 heatmap show a clear recruitment of the corresponding protein. (E) Genes belonging to Cluster 1 of the Suz12 heatmap (Figure 3D), which present a dramatic enrichment of SUZ12 upon TRF1 depletion, were analyzed. The clustergram , representing the results of the CHEA analysis, shows that an important number of these genes are targets of numerous pluripotency factors (green). The numbers on the top of the clustergram indicate the percentage of all the downregulated genes that are targets of each factor. (F) Genes belonging to Cluster 1 of the H3K27me3 heatmap (Figure 3D), which present a clear enrichment of H3K27me3 upon TRF1 depletion, were analyzed. As in the case of SUZ12, the clustergram shows that an important number of these genes are targets of pluripotency factors (green).
Figure 3—figure supplement 1
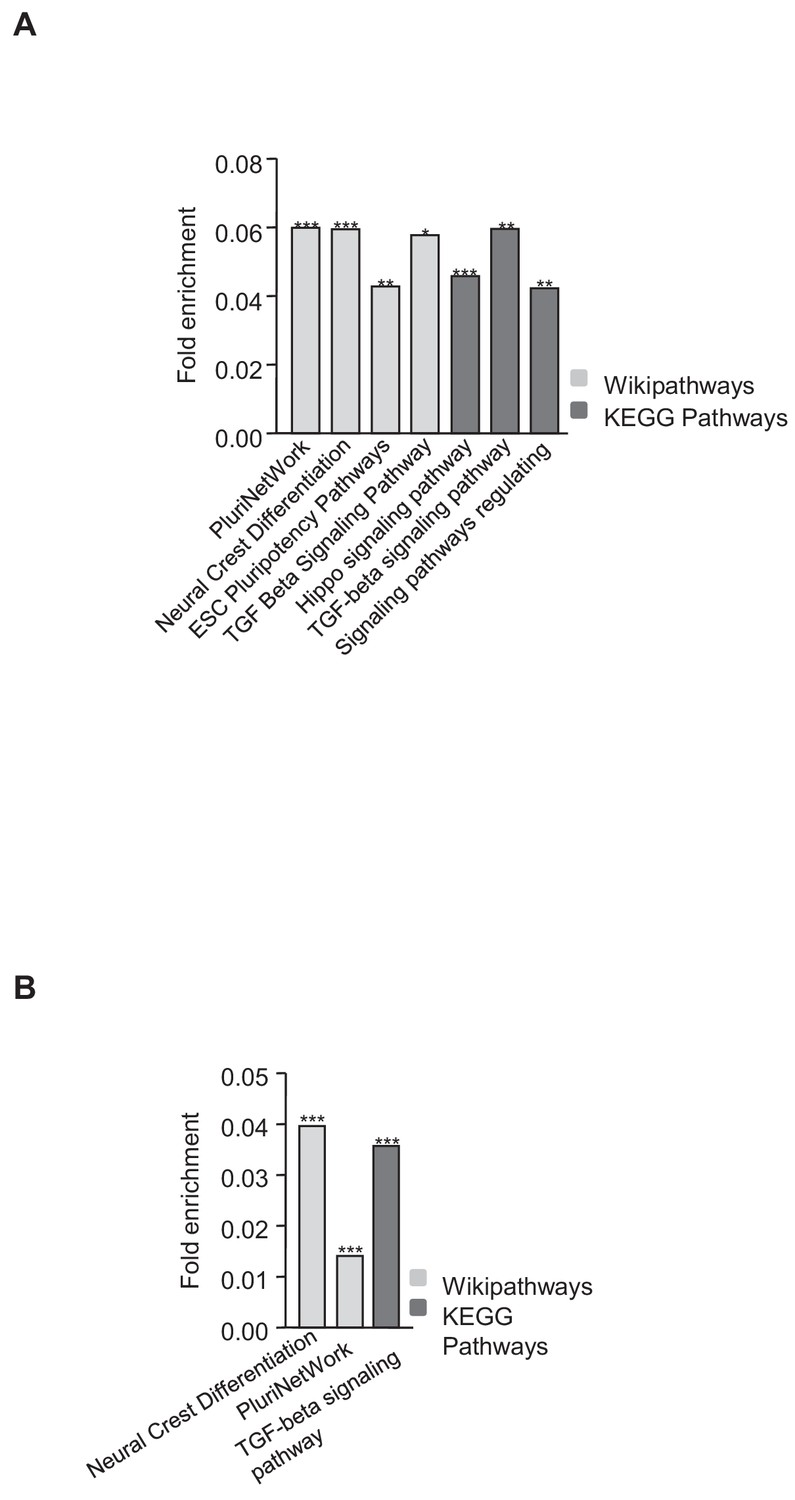
Functional analysis of genes downregulated in the absence of TRF1 that show recruitment of SUZ12 and H3K27me3.
(A) KEGG and Wikipathways analyses of genes downregulated in the absence of TRF1 that show recruitment of SUZ12 showed that these genes were significantly enriched in important pathways controlling pluripotency and differentiation. (B) KEGG and Wikipathways analysis of genes downregulated in the absence of TRF1 that show recruitment of H3K27me3 showed that these genes were significantly enriched in important pathways controlling pluripotency and differentiation. * = p value<0.05; ** = p value<0.01; *** = p value<0.001.
Figure 4 with 1 supplement
Depletion of TRF1 induces the recruitment of SUZ12 and H3K27me3 to genes that are upregulated in the absence of TRF1.
(A) Venn diagram showing the overlap of genes bound by SUZ12 and H3K27me3 specifically in the absence of TRF1 with the set of genes that are upregulated in this same condition, as obtained by RNA-seq. Note that a number of upregulated genes gain SUZ12 and H3K27me3 peaks upon TRF1 abrogation. (B) Gain of SUZ12 and H3K27me3 peaks at the Cxcl12 gene. (C) Gene expression analysis by q-PCR of genes that are upregulated upon TRF1 depletion in which SUZ12 or H3K27me3 recruitment was detected. Note that abrogation of TRF1 induces an increase in the expression of these genes, as observed previously by RNA-seq. n = number of independent experiments. Error bars = SE. Statistical analysis was carried out by one -tailed, paired Student's t-test. * = p value<0.05; ** = p value<0.01. (D) Heat maps of the reads distribution of SUZ12 and H3K27me3 within 2.5 Kb of the transcription start sites (TSS) of all of the genes that are significantly upregulated in the RNA-seq upon TRF1 abrogation. Note that a great number of upregulated genes (Clusters 1 and 2 of the SUZ12 heat map) show a clear increase in SUZ12 binding upon TRF1 abrogation, especially in Cluster 1 where the increase is dramatic. By contrast, only Cluster 1 of the H3K27me3 heatmap shows a moderate recruitment. Genes belonging to Cluster 1 of the SUZ12 heatmap (Figure 4D), which present a dramatic enrichment of SUZ12 upon TRF1 depletion, were analyzed. (E) The clustergram shows that these genes are targets of pluripotency factors (green), differentiation factors (blue) and encode components of the polycomb (red). Genes belonging to Cluster 1 of the H3K27me3 heatmap (Figure 4D), which present a moderate enrichment of H3K27me3 upon TRF1 depletion, were analyzed. (F) As in the case of SUZ12, the clustergram shows that an important number of these genes are targets of pluripotency factors (green), differentiation factors (blue) and components of the encode Polycomb (red).
Figure 4—figure supplement 1
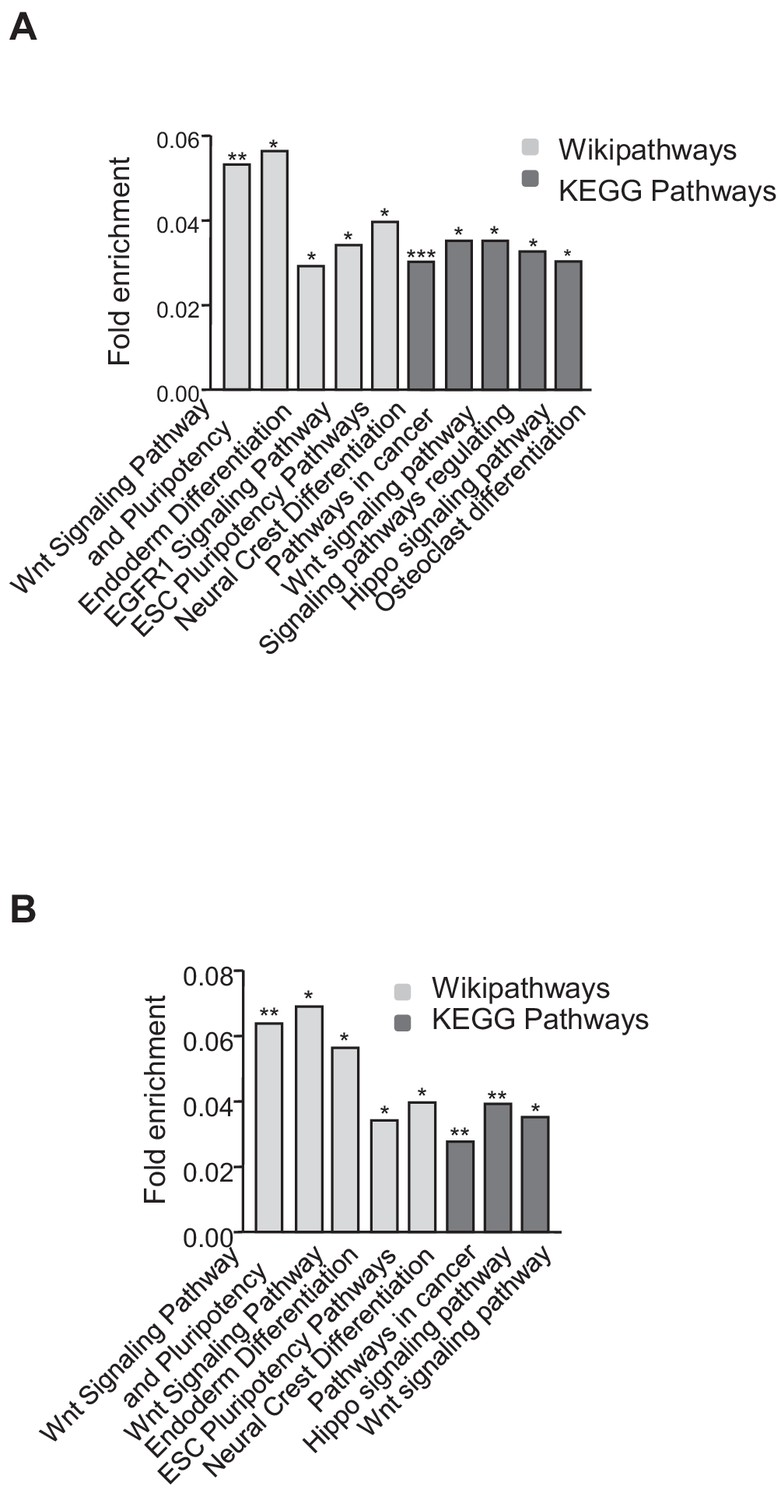
Functional analysis of genes that are upregulated in the absence of TRF1 and that show recruitment of SUZ12 and H3K27me3.
(A) KEGG and Wikipathways analysis of genes that are upregulated in the absence of TRF1 that show recruitment of SUZ12. The histogram shows that these genes are significantly enriched in important pathways controlling pluripotency and differentiation. (B) KEGG and Wikipathways analysis of genes that are upregulated in the absence of TRF1 and that show recruitment of H3K27me3 . The histogram shows that these genes are significantly enriched in important pathways controlling pluripotency and differentiation.
Figure 5 with 2 supplements
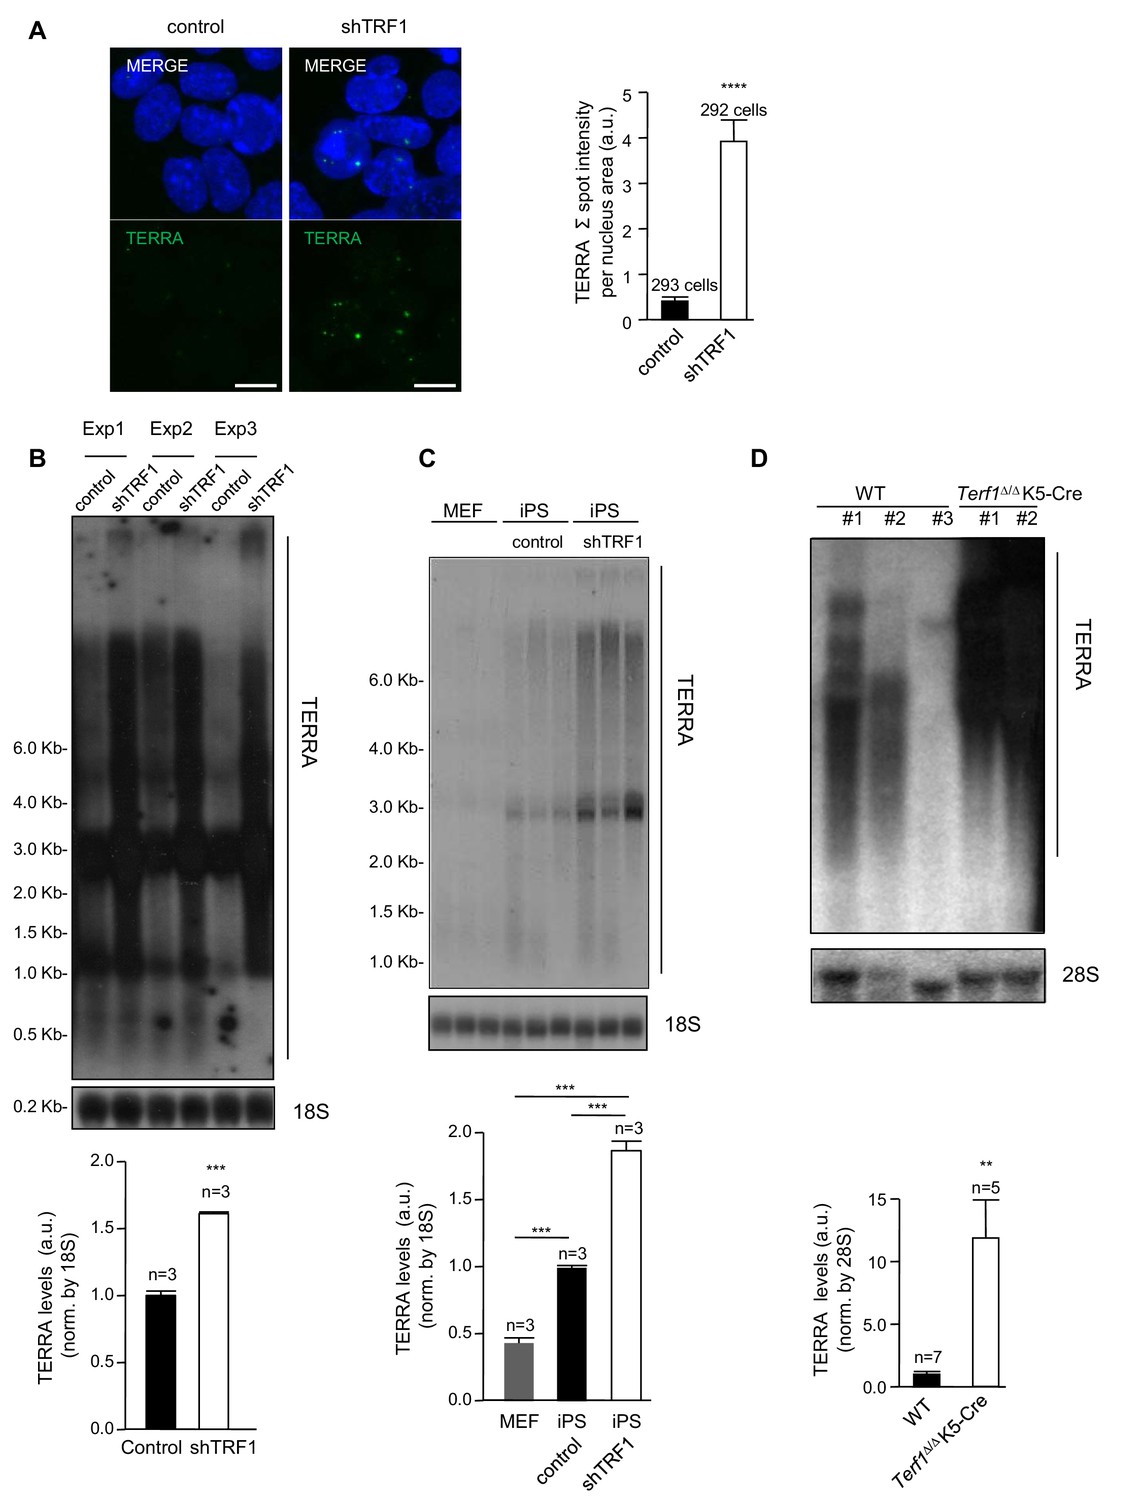
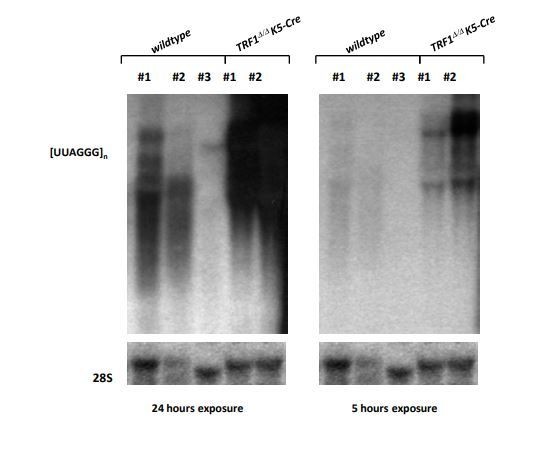
Abrogation of TRF1 induces the upregulation of TERRA RNAs expression.
(A) Left, representative image of RNA-FISH using a TERRA-specific probe in control 2i-grown iPS and in 2i-grown iPS cells in which TRF1 is depleted. Note the dramatic increase in TERRA signal in cells lacking TRF1. Right, quantification of the RNA-FISH images. Data were obtained from one experiment. n = number of cells analyzed from each sample. Error bars = SE. Statistical analysis was carried out by Student's t-test. **** = p-value <0.0001. (B) Top, representative image of a Northern-blot analysis of TERRA RNAs expression in control 2i-grown iPS and in 2i-grown iPS cells in which TRF1 is depleted in three independent experiments. Note the clear upregulation of TERRA levels in cells lacking TRF1, confirming the RNA-FISH data. Bottom, quantification of TERRA levels from the Northern blot, normalized to 18S levels. Error bars = SE. Statistical analysis was carried out by Student's t-test. *** = p-value <0.0001. (C) Top, image of a Northern-blot analysis of TERRA RNAs expression in MEF, 2i-grown iPS and 2i-grown iPS depleted for TRF1. Bottom, quantification of TERRA levels from the Northern blot, normalized to 18S levels. n = number of independent experiments. Error bars = SE. Statistical analysis was carried out by Student's t-test. (D) Top, representative image of a Northern-blot analysis of TERRA RNAs expression in keratinocytes of wild-type or Terf1Δ/Δ K5-Cre (lacking expression of TRF1) newborn mice. Again, note the clear upregulation of TERRA levels in cells lacking TRF1. Bottom, quantification of TERRA levels from the Northern blot, normalized to 28S levels. n = number of independent newborn mice analyzed. Error bars = SE. Statistical analysis was carried out by Student's t-test.
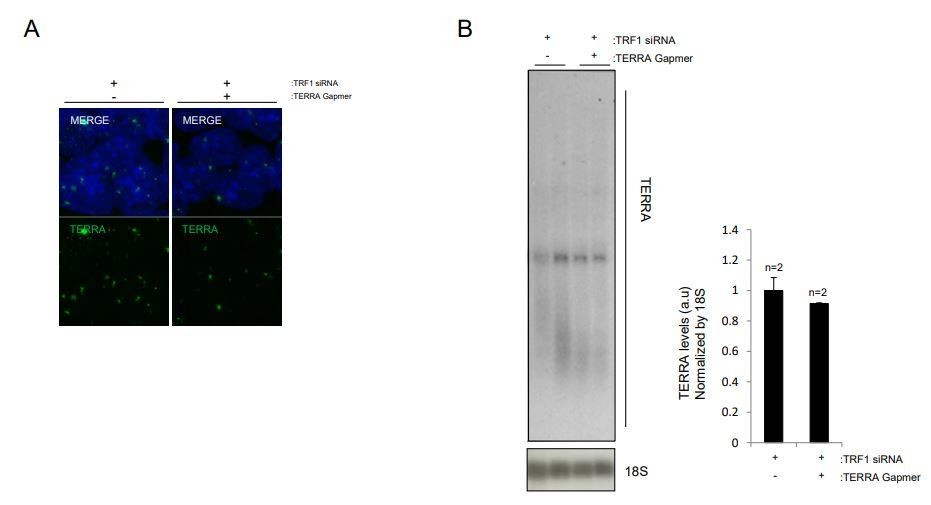
Figure 5—figure supplement 1
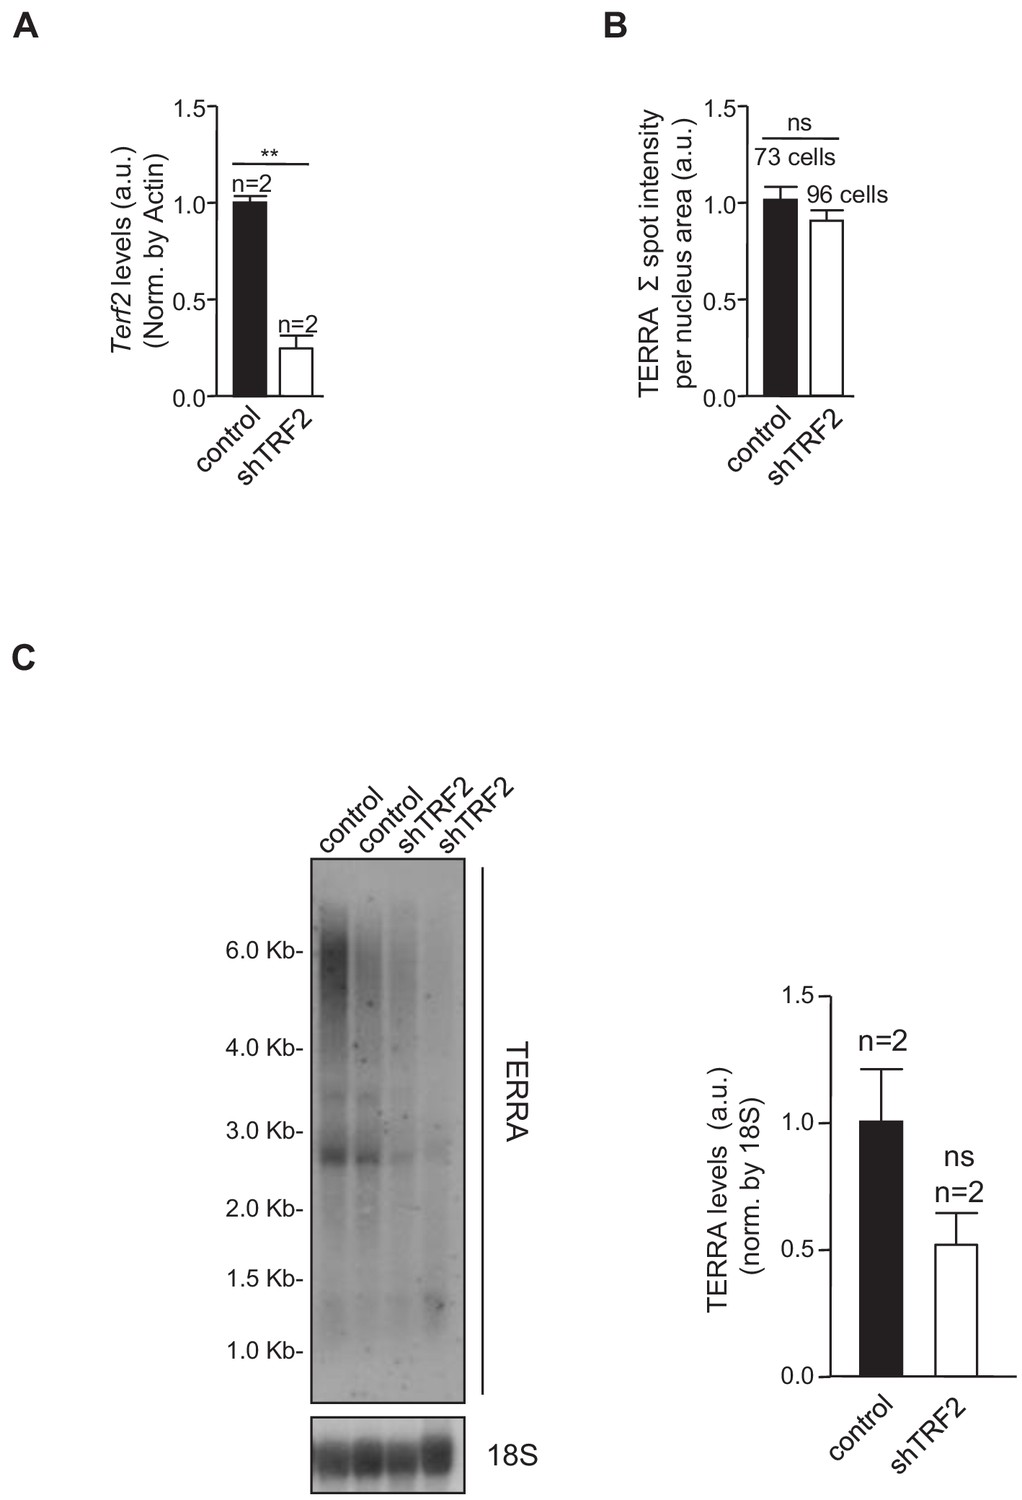
TRF2 abrogation in Trp53–/– 2i-grown iPS cells does not change TERRA levels.
(A) Trf2 expression levels, as measured by q-PCR, in iPS cells infected with a scrambled (control) shRNA or an shRNA against TRF2. Note the clear reduction in Trf2 levels. N = number of independent experiments.; Error bars = SE. Statistical analysis was carried out by Student's t-test. ** = Adjusted p-value <0.001. (B) TERRA levels in control cells or cells in which TRF2 is abrogated, as measured by RNA-FISH. Note that TERRA levels do not change when TRF2 expression is reduced. N = number of cells analyzed. Error bars = SE. Statistical analysis was carried out by Student's t-test. (C) TERRA levels in control cells or in cells in which TRF2 is abrogated, as measured by Northern Blot. Note again that the depletion of TRF2 does not increase levels of TERRA RNA. N = number of independent experiments. Error bars = SE. Statistical analysis was carried out by Student's t-test.
Figure 5—figure supplement 2
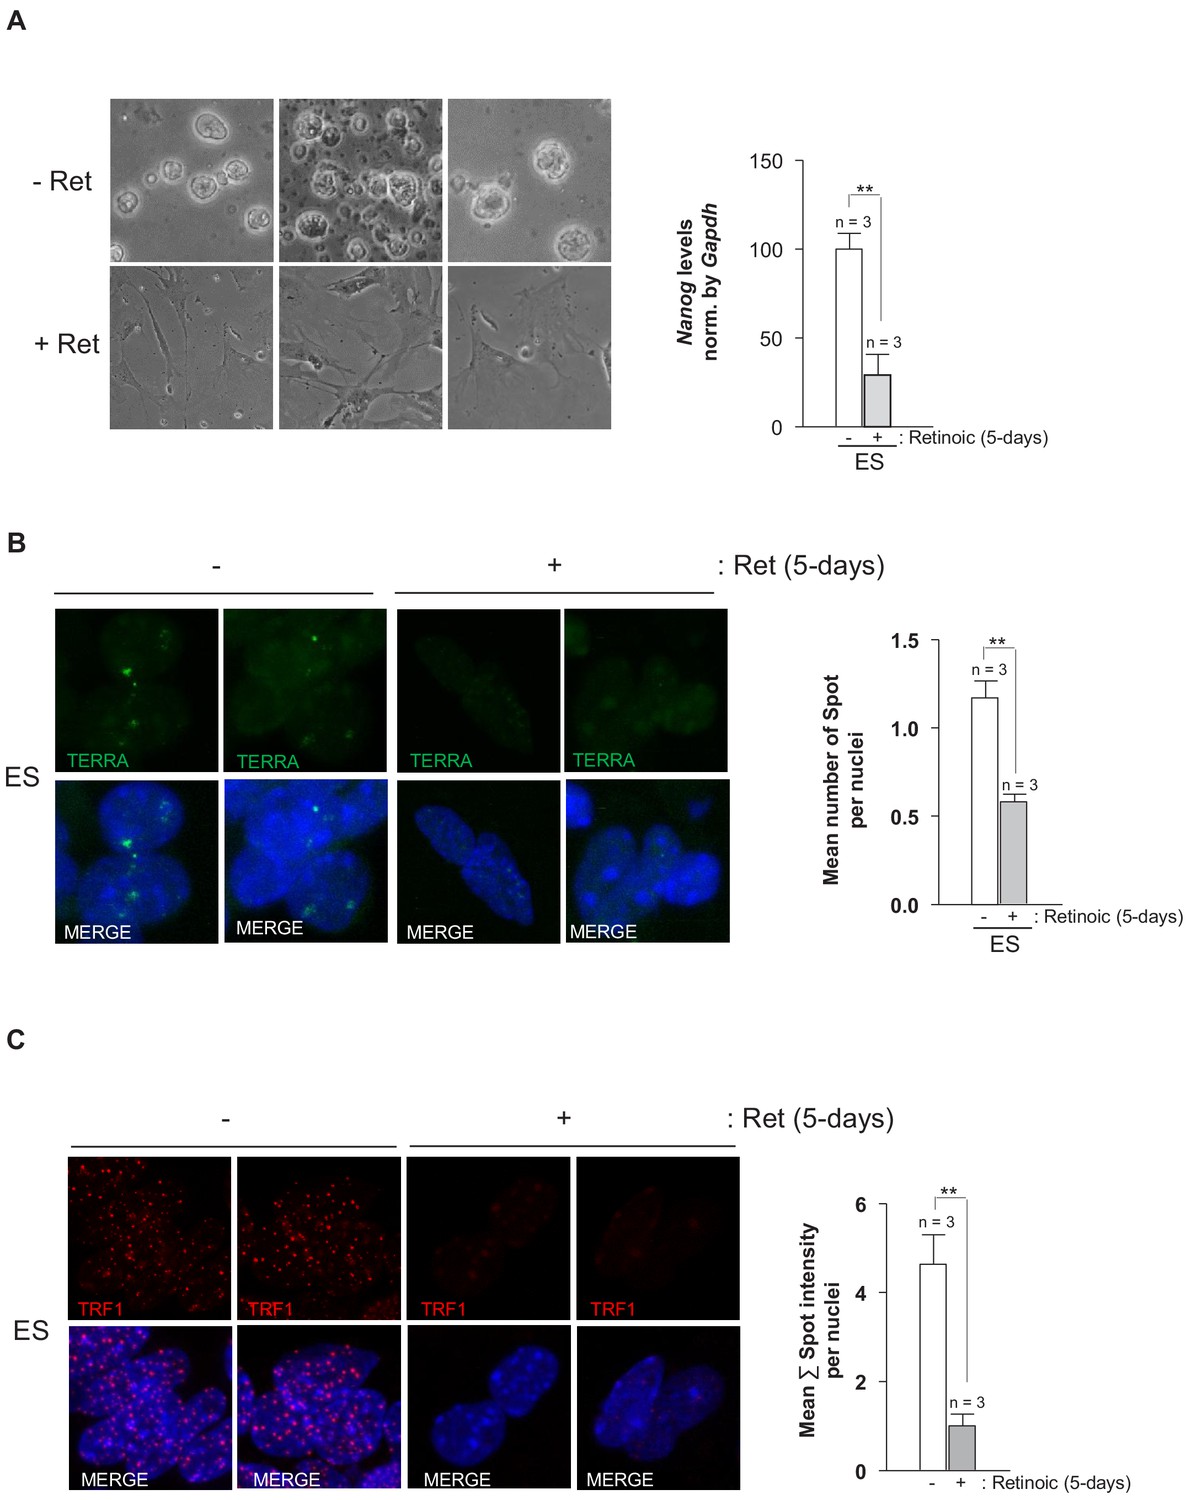
TRF1 protein and TERRA levels decrease upon differentiation of ES cells.
(A) Left, images of ES cells that are untreated (–Ret) or treated (+Ret) with retinoic acid to induce differentiation. Note that cells with retinoic acid show a clear differentiated morphology when compared to untreated cells. Right, quantification of Nanog levels as measured by q-PCR. Note the clear decrease of Nanog expression, confirming the differentiation of the cells. (B) Levels of TERRA in untreated cells and in cells treated with retinoic acid to induce differentiation, as measured by RNA-FISH. Left, representative images. Right, quantification of TERRA levels. Note the significant decrease of TERRA in differentiated cells. N = number of independent experiments. Error bars = SE. Statistical analysis was carried out by Student's t-test. ** = Adjusted p-value<0.001. (C) Left, representative images of immunofluorescence against TRF1 protein (red) of untreated ES cells (-) or ES cells that have been treated with retinoic acid (+) for 5 days. Right, quantification of TRF1 levels per nuclei. n = number of independent experiments. Error bars = SE. Statistical analysis was carried out by Student's t-test. ** = Adjusted p-value <0.001.
Figure 6

TERRA CHIRT-seq analysis.
(A) Genome-wide TERRA localization in different genome regions. (B) Comparison of the genes associated with TERRA peaks in this work and in previously described work (Chu et al., 2017). Note that the majority of the genes found in the previous study are present in our CHIRT-seq. (C) Representation of the peak with higher enrichment in TERRA CHIRT-seq. Note that this peak coincides with a TERRA locus previously described at chromosome 18 (López de Silanes et al., 2014). (D) CHEA analysis of genes annotated to TERRA peaks. (E) Encode histone modifications analysis of genes annotated to TERRA peaks. (F) Heatmaps of TERRA reads within 5 Kb of SUZ12 and H3K27me3 peaks. (G) Top, overlapping of genes annotated to TERRA peaks with the peaks of SUZ12 and H3K27me3 exclusive for the shTRF1 ChIP-seq sample. Bottom, overlapping of genes annotated to TERRA peaks in non intergenic regions, with peaks of SUZ12 and H3K27me3 exclusive for the shTRF1 ChIP-seq sample. The experiment was performed once.
Figure 7
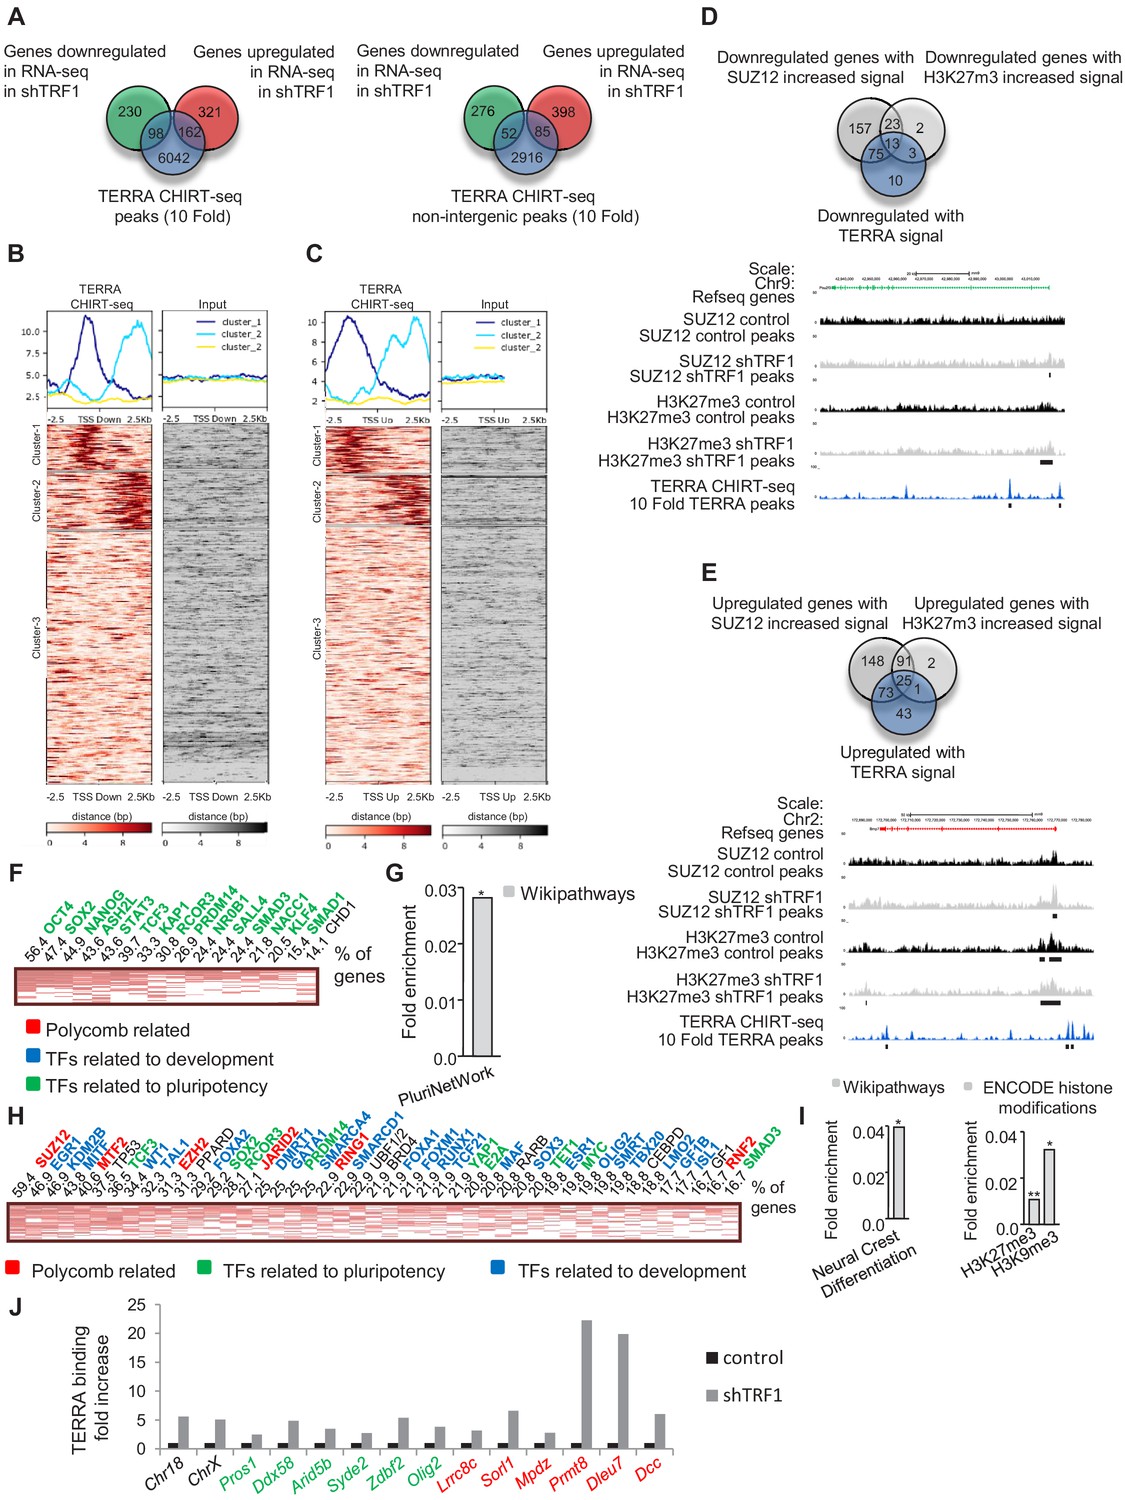
TERRA binding correlates with genes that are differentially expressed in the absence of TRF1 and with the presence of SUZ12 and H3K27me3 and is increased upon TRF1 depletion.
(A) Left, Venn diagram showing the overlap between the genes annotated to TERRA peaks and genes that are up- or downregulated in the RNA-seq after TRF1 depletion. Right, Venn diagram showing the overlap between the genes annotated to TERRA peaks in non-intergenic regions and genes that are up- or downregulated in the RNA-seq after TRF1 depletion. (B) Heatmaps showing TERRA CHIRT-seq reads within 2.5 Kb of TSS of genes downregulated after TRF1 depletion. (C) Heatmaps showing TERRA CHIRT-seq reads within 2.5 Kb of TSS of genes upregulated after TRF1 depletion. (D) (Top) Overlapping between downregulated genes with TERRA signal and downregulated genes in which the SUZ12 or H3K27me3 signal is increased. (Bottom) Representative image of SUZ12, H3K27me3 and TERRA reads and peaks in a downregulated gene. (E) (Top) Overlapping between upregulated genes with TERRA signal and upregulated genes in which the SUZ12 or H3K27me3 signal is increased. (Bottom) Representative image of SUZ12, H3K27me3 and TERRA reads and peaks in an upregulated gene. (F) CHEA analysis of genes downregulated in the RNA-seq after the deletion of TRF1 that are bound by TERRA and that show increased SUZ12 and/or H3K27me3 signal. (G) Wikipathways analysis of genes from panel (F). (H) CHEA analysis of genes upregulated in the RNA-seq after deletion of TRF1 that are bound by TERRA and that show increased SUZ12 and/or H3K27me3 signal. (I) Wikipathways analysis and Encode histone modification analysis of genes from panel (H). (J) CHIRT-qPCR in control and shTRF1 samples from one experiment in genomic regions previously identified as TERRA binding sites in the CHIRT-seq. Genomic regions labeled in black correspond to subtelomeric regions where TERRA is potentially transcribed. Genomic regions labeled in green or red correspond to regions close to the promoters of genes that are downregulated or upregulated, respectively, when downregulating TRF1. Note that, in all the cases, TERRA binding is clearly increased upon TRF1 abrogation. Values were normalized to inputs and to a genomic region where TERRA binding was not found in the CHIRT-seq.
Figure 8
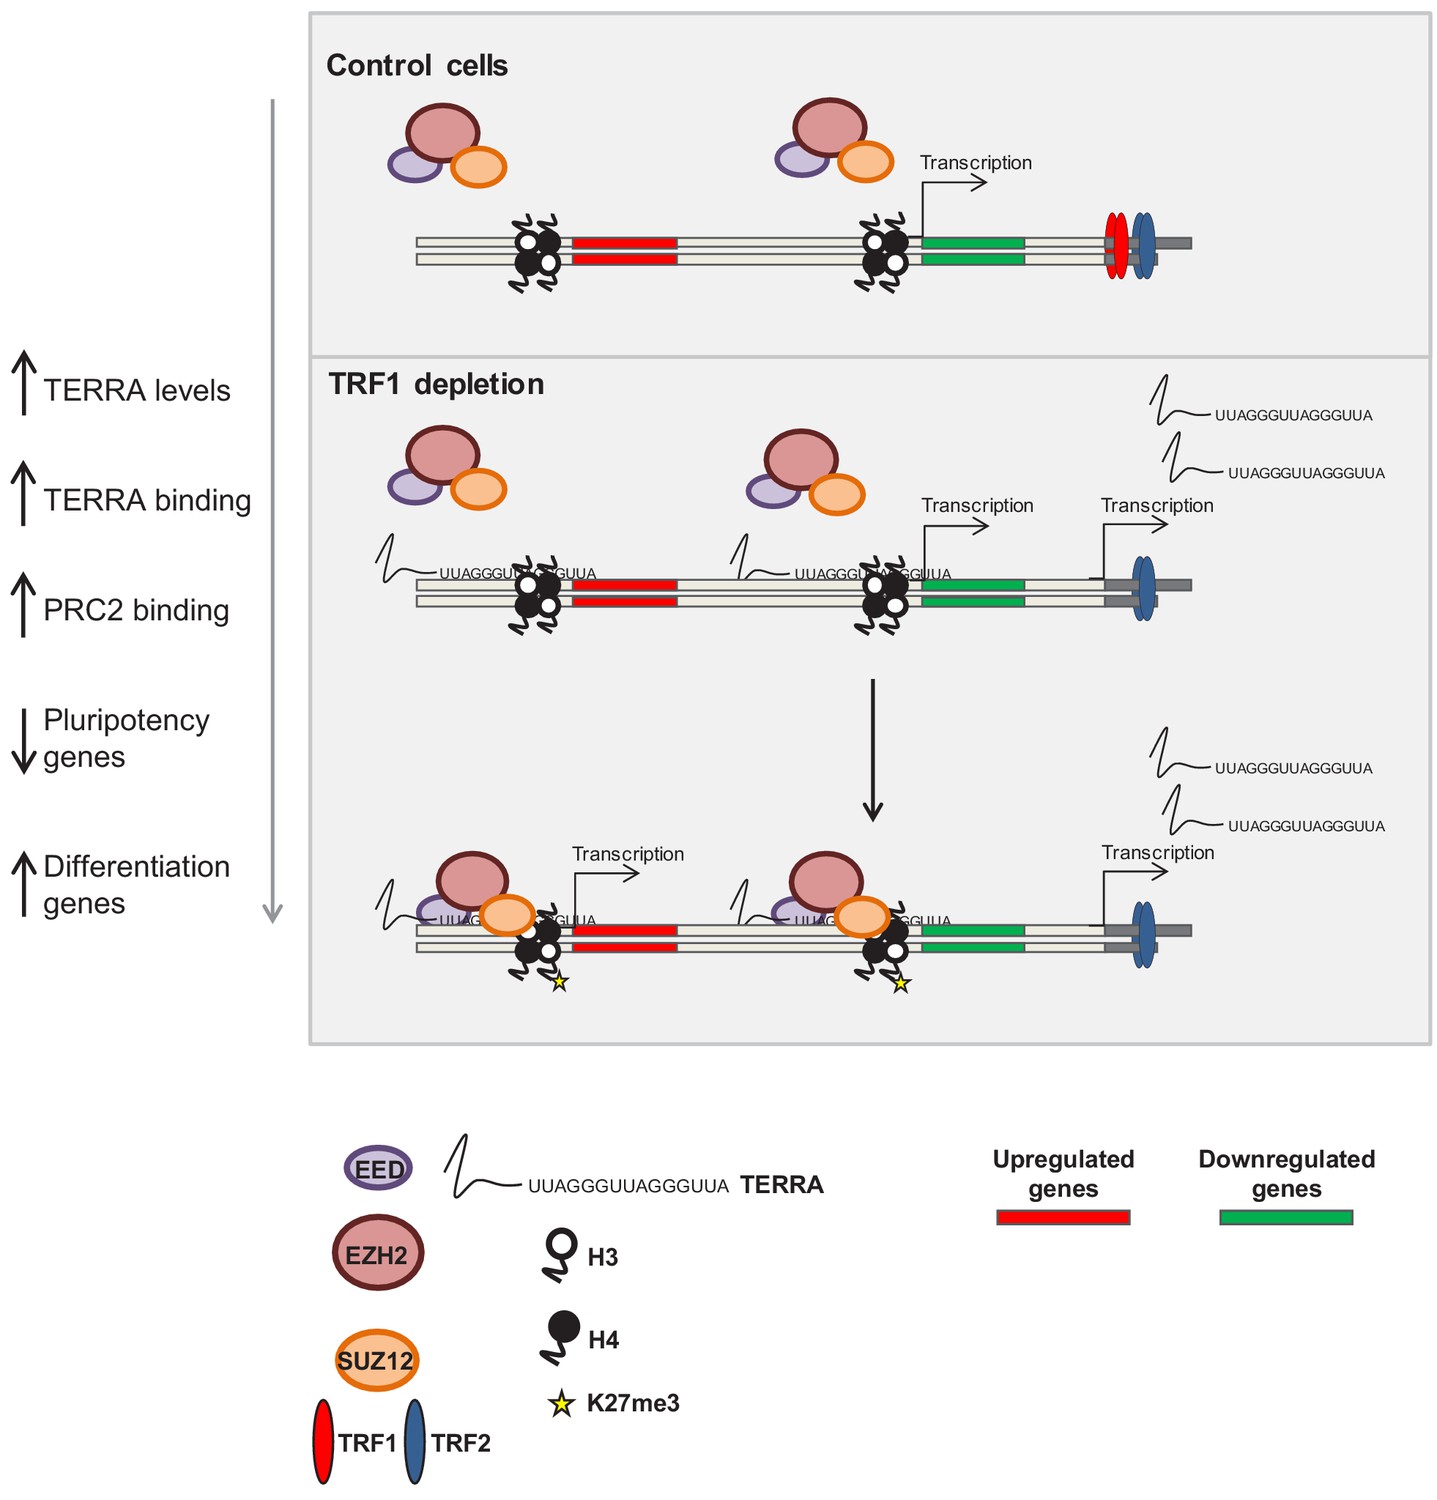
Model of the role of TRF1 in controlling pluripotency through TERRA expression and TERRA-dependent polycomb recruitment.
In control 2i-grown iPS cells (top) the levels of TRF1 are elevated, the PRC2 complex is barely bound to the genome and pluripotency genes are expressed. When TRF1 levels are downregulated (bottom), TERRA expression is greatly increased, resulting in higher levels of binding to the genome. In this way, TERRA could increase PRC2 recruitment to many locations within the genome that are involved in the control of pluripotency and differentiation.
Figure 9
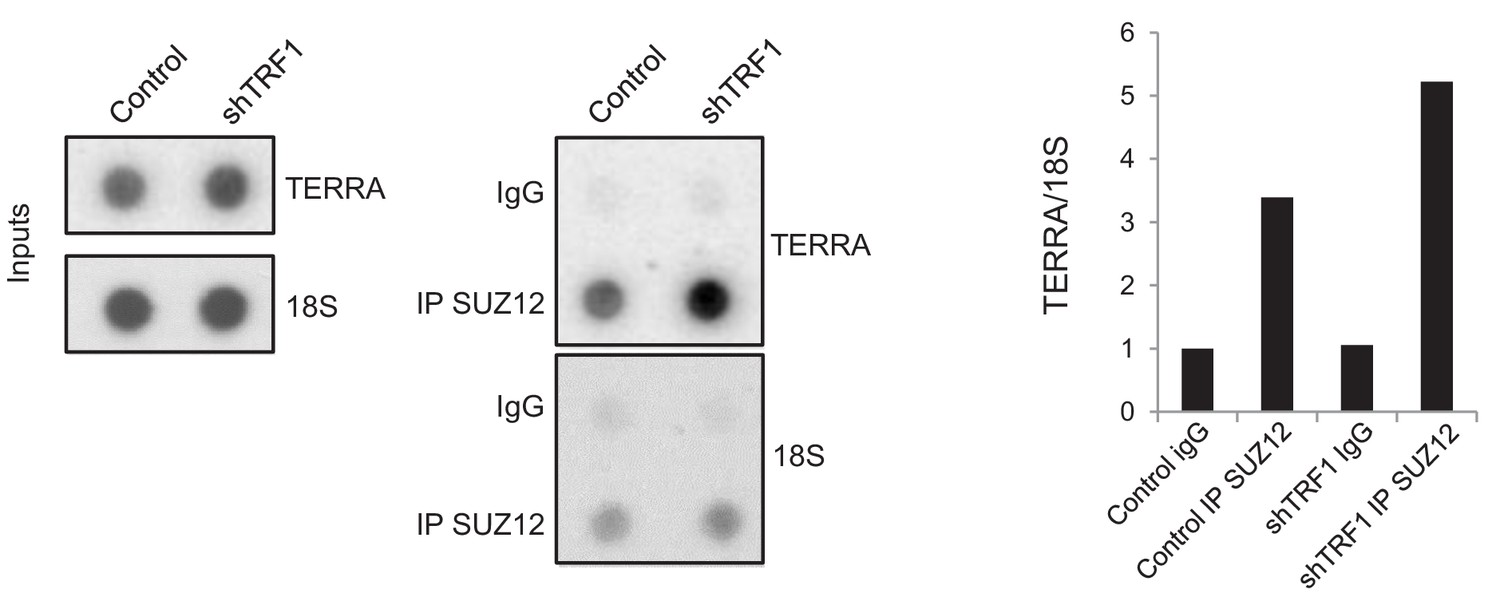
SUZ12 binding to TERRA increases upon TRF1 depletion.
Immunoprecipitation of SUZ12 and detection of bound TERRA by dot-blot hybridization. Left, representative images of the input and immunoprecipitated TERRA in control cells and in cells depleted for TRF1. Note that levels of TERRA are higher in the SUZ12 immunocomplex when TRF1 is abrogated. Right, quantification of the TERRA and 18S levels in the immunocomplex. Levels of TERRA were normalized by the levels of 18S. Note again that binding of SUZ12 increases upon TRF1 depletion. The experiment was performed once.
Author response image 1
Author response image 2
Tables
Table 1
List of oligos.
https://doi.org/10.7554/eLife.44656.022| Forward | Reverse | |
|---|---|---|
| Actin | 5′-GGCACCACACCTTCTACAATG-3′ | 5′-GTGGTGGTGAAGCTGTAG-3′ |
| Terf1 | 5′-TCTAAGGATAGGCCAGATGCCA-3′ | 5′-CTGAAATCTGATGGAGCACGT-3′ |
| Myc | 5′-GTGCTGCATGAGGAGACACC-3′ | 5′-AGGGGTTTGCCTCTTCTCC-3′ |
| Lama1 | 5′-CTGTCACCCTGGACTTACGG-3′ | 5′-GGTTTGAACTTGACGCCATC-3′ |
| Id1 | 5′-CTGAACGGCGAGATCAGTG-3′ | 5′-GCCTCAGCGACACAAGATG-3′ |
| Olig2 | 5′-CAGCGAGCACCTCAAATCTA-3′ | 5′-CCCCAGGGATGATCTAAGC-3′ |
| Foxd3 | 5′-CTTTCTTTCGGGGGACACTC-3′ | 5′-CCAGGAGCGAGCAGAGAG-3′ |
| Zfp423 | 5′-TGACGTTCGAGAACGAGAGAG-3′ | 5′-GGGAGTCGAACATCTGGTTG-3′ |
| Pou2f3 | 5′-ATCGACGCCAAAAGGAGAAG-3′ | 5′-TGGACAGGAGGGACTGAGAG-3′ |
| Sgk1 | 5′-AGAGGAGTCCTGTTCCTGGG-3′ | 5′-GGTCAGGATGTTGGCATGAT-3′ |
| Igf2 | 5′-GCTTGTTGACACGCTTCAGTT-3′ | 5′-AAGCAGCACTCTTCCACGAT-3′ |
| Bmp4 | 5′-CGCTTCTGCAGGAACCAA-3′ | 5′-ATCAAACTAGCATGGCTCGC-3′ |
| Hoxc12 | 5′-ACCCTGGCTCTCTGGTTTC-3′ | 5′-CAACTTCGAATACGGCTTGC-3′ |
| Jak3 | 5′-TTGGGGACTACTTGGCTGAG-3′ | 5′-AGAAGTCCTCAGTGGCCAGA-3′ |
| Gbx2 | 5′-CTCGCTGCTCGCTTTCTCT-3′ | 5′-GGGTCATCTTCCACCTTTGA-3′ |
| Myd88 | 5′-TATACTGAAGGAGCTGAAGTCGC-3′ | 5′-ACACTGCTTTCCACTCTGGC-3′ |
| Khdc3 | 5′-GAATGCCTGGAAGATCCAAA-3′ | 5′-ATGTGGGATGTGCTCTCCAT-3′ |
| Rbm47 | 5′-AAAGAACCAGGACCAATCGC-3′ | 5′-CACTGTTGGATCGCTGTTCA-3′ |
| Zfp345 | 5′-TGGTCTTCCCAAACATAGCC-3′ | 5′-ACTTCACGTGGGAAGAGTGG-3′ |
| Dnmt3b | 5′-TCTAATGCCAAAGCTCACCC-3′ | 5′-CTCTTTGCCTCTCCAAGCTG-3′ |
| Gata2 | 5′-CACCCCTAAGCAGAGAAGCA-3′ | 5′-CAGGCATTGCACAGGTAGTG-3′ |
| Fzd5 | 5′-AGCAGGATCCTCCGAGAGTT-3′ | 5′-CAGCACTCAGTTCCACACCA-3′ |
| Spry2 | 5′-GATTCAAGGGAGAGGGGTTG-3′ | 5′-CTCCATCAGGTCTTGGCAGT-3′ |
| Zscan10 | 5′-GACGGAGAGGAGGTGGTACA-3′ | 5′-GCCAAGCTCTCTTCTCTGAGG-3′ |
| Fgf17 | 5′-ATTGATTCTCTGCTGTCAAACACA-3′ | 5′-GCTGGTATTCACGGATTTGC-3′ |
| Sall4 | 5′-TGCCTCGGTGTTAGATGTCA-3′ | 5′-GACAAAGGTGGGCTGTGCT-3′ |
| Klf5 | 5′-GGATCTGGAGAAGCGACGTA-3′ | 5′-TCCTCAGGTGAGCTTTTAAGTGA-3′ |
| Nr5a2 | 5′-TGGGAAGGAAGGGACAATCT-3′ | 5′-AACGCGACTTCTGTGTGTGA-3′ |
| Tbx3 | 5′-CATCGCCGTTACTGCCTATC-3′ | 5′-GCCAGTGTCTCGAAAACCC-3′ |
| Spp1 | 5′-TGACCCATCTCAGAAGCAGA-3′ | 5′-CATTGGAATTGCTTGGAAGAG-3′ |
| Smad7 | 5′-CGAATTATCTGGCCCCTGG-3′ | 5′-GACACAGTAGAGCCTCCCCA-3′ |
| Zbtb43 | 5′-GGTAGGCTGGAGCTACGGG-3′ | 5′-TGGCCATCAAAGAGCAGTC-3′ |
| Adm | 5′-CATCCAGCAGCTACCCTACG-3′ | 5′-TTCGCTCTGATTGCTGGCTT-3′ |
| Cxcl12 | 5′-CACTCCAAACTGTGCCCTTC-3′ | 5′-AATTTCGGGTCAATGCACAC-3′ |
| Bend6 | 5′-AGAAGCATCCGGAAGGAAAA-3′ | 5′-TGCCATTCCAACCAGTTCTT-3′ |
| Fndc5 | 5′-GGTGCTGATCATTGTTGTGGT-3′ | 5′-CCTTGTTGTTATTGGGCTCG-3′ |
| Fzd1 | 5′-GCTTACTCCTCAGCAGCACA-3′ | 5′-TCTCTCACCCATCCGTCAGT-3′ |
| Fzd2 | 5′-CCTCAAGGTGCCGTCCTATC-3′ | 5′-GGATCCAGAGACGGGCAAAA-3′ |
| Jun | 5′-ACCGAGAATTCCGTGACGAC-3′ | 5′-TGAAAAGTCGCGGTCACTCA-3′ |
| Proser2 | 5′-ACTTGAGCAGAGGTGGCAGT-3′ | 5′-GTGCTTCAGGCTCTCGTCAT-3′ |
| Lgi2 | 5′-CCAAGGAGTCCATCATCTGC-3′ | 5′-CATTCGGTCCTTGATTTCCA-3′ |
| Bmp7 | 5′-CCTGGGCTTACAGCTCTCTG-3′ | 5′-CCATGAAGGGTTGCTTGTTC-3′ |
| Pitx2 | 5′-CAAAAAGGTCGAGTTCACGG-3′ | 5′-CTTTCCTTGCTGGCCCTTAT-3′ |
| Foxa1 | 5′-AACAGCTACTACGCGGACAC-3′ | 5′-GCTCGTGGTCATGGTGTTCA-3′ |
| Otx2 | 5′-CTCCTGGAGGAGAGAGCAGTC-3′ | 5′-GGGTCCTTGGTGGGTAGATT-3′ |
| Nkd2 | 5′-GGTGTGGAACATCGCTCAC-3′ | 5′-CTAGGGAACCCTTGTCGTCC-3′ |
| Col2a1 | 5′-GCGGTCCTACGGTGTCAG-3′ | 5′-TTTATACCTCTGCCCATTCTGC-3′ |
| Ppp2r2c | 5′-GCCATCACTGATCGGAGC-3′ | 5′-AGACGAAGAGGTTGCAGTGG-3′ |
| App | 5′-CTCTACAATGTCCCTGCGGT-3′ | 5′-AGCTGATTCTGGGCTCACTG-3′ |
| Satb1 | 5′-TATGAACCAGAGTTCGTTGGC-3′ | 5′-TTTGCTGCTGAGACATTTGC-3′ |
| Nfix | 5′-TCTGGCTTACTTTGTCCACACTC-3′ | 5′-GTTGGGCAGTGGTTTGATGT-3′ |
| Foxn4 | 5′-ACCACTGCTCTCCACAGGAA-3′ | 5′-CAGGACAGCGACTGAAGGTC-3′ |
| Trpv4 | 5′-ACCACCCCAGTGACAACAAG-3′ | 5′-ATGGGCCGATTGAAGACTTT-3′ |
| Hspa1a | 5′-TTTGTGTATTGCACGTGGGC-3′ | 5′-GGGGCAGTGCTGAATTGAAG-3′ |
| Prkar2b | 5′-AGGCTTGCAAAGACATCCTG-3′ | 5′-TGTTCCCCTTCTTTGACCAAT-3′ |
| Lef1 | 5′-ACCCGTACATGTCAAATGGG-3′ | 5′-GTCGCTGTAGGTGATGAGGG-3′ |
| CHIRT | Forward | Reverse |
| Chr18 | 5′-CAGCCTTTGTCCTTCACAGTT-3′ | 5′-GGTTCATAAGGCTTTTCTCCA-3′ |
| ChrX | 5′-TGTTCCCTCACAGCACAGAG-3′ | 5′-TAAGCCAGCCTCTCCAAAGA-3′ |
| Pros1 | 5′-GGCAGTCTCTGGAGTTGGAA-3′ | 5′-CTAGCATCCCTTCCCCATTC-3′ |
| Ddx58 | 5′-AAGTGGGGTTTCAGAGAGCA-3′ | 5′-CCCTAACCCTTCCCCATAAA-3′ |
| Arid5b | 5′-CTCTTCCCCTGGAGATCCTT-3′ | 5′-TTGGAAACAGATTTGAGCATTC-3′ |
| Syde2 | 5′-GCTGGGTTTACCCCAATACA-3′ | 5′-GACCCACTTCCTAAGGACAGAA-3′ |
| Zdbf2 | 5′-CATGGGGAAAGCATAATTGC-3′ | 5′-AGGCTTGGGACTCCTCTTGT-3′ |
| Olig2 | 5′-CCACACCCTGTGTGTCTGTC-3′ | 5′-TCAACCTTCCGAACTTGAGG-3′ |
| Lrrc8c | 5′-GCTAGGTTCTGGGGACTGG-3′ | 5′-CAACCGCGTTTTCTCCTAGT-3´ |
| Sorl1 | 5′-GCCTACCTCAGAATGGAGGTC-3′ | 5′-CACACACACACACTACCATATAATCC-3′ |
| Mpdz | 5′-GCGTCCCATCTTAAAACCAA-3′ | 5′-GATCCTCTCCATCCCTACCC-3′ |
| Prmt8 | 5′-GGTTTGGGACTTAGGGGAAC-3′ | 5′-AGTTCCTTTCCCCCTTGAAA-3′ |
| Dleu7 | 5′-TCAAGACTGGACCCCAAAAC-3′ | 5′-GGACCAGCCAGCTTGTATGT-3′ |
| Dcc | 5′-TTCAGTCCCTGGACAGACAG-3′ | 5′-ACACGCCTTTCCTTCACAGT-3′ |
| Control region | 5´-CAATGCCTAGATATACCGATCTCTT-3′ | 5′-CTCAGGACAAGACCCCACTG-3′ |
Additional files
-
Supplementary file 1
Table S1.
- https://doi.org/10.7554/eLife.44656.023
-
Supplementary file 2
Table S2.
- https://doi.org/10.7554/eLife.44656.024
-
Supplementary file 3
Table S3.
- https://doi.org/10.7554/eLife.44656.025
-
Supplementary file 4
TRF1 does not interact with SUZ12.
Mass spectroscopy of protein complexes immunoprecipitated with an anti-GFP antibody in Terf1GFP/GFP, Terf1+/GFP and Terf1+/+ iPS cells. The table shows the 64 proteins that showed co-immunoprecipitation in both Terf1 GFP/GFP and Terf1+/GFP cells but not in Terf1+/+ cells. Note the presence in this group of proteins of different components of shelterin, namely TPP1 (ACD), RAP1 (TERF2IP), TRF1 (TERF1), TIN2 (TINF2) and POT1, but not the presence of SUZ12. Related to Figure 2.
- https://doi.org/10.7554/eLife.44656.010
-
Transparent reporting form
- https://doi.org/10.7554/eLife.44656.026
Download links
A two-part list of links to download the article, or parts of the article, in various formats.
Downloads (link to download the article as PDF)
Open citations (links to open the citations from this article in various online reference manager services)
Cite this article (links to download the citations from this article in formats compatible with various reference manager tools)
TERRA regulate the transcriptional landscape of pluripotent cells through TRF1-dependent recruitment of PRC2
eLife 8:e44656.
https://doi.org/10.7554/eLife.44656


