Astrocyte morphogenesis is dependent on BDNF signaling via astrocytic TrkB.T1
- School of Medicine, University of Alabama at Birmingham, United States
- School of Neuroscience, Virginia Polytechnic and State University, United States
- Virginia Polytechnic Institute and State University, United States
Figures
Figure 1 with 1 supplement
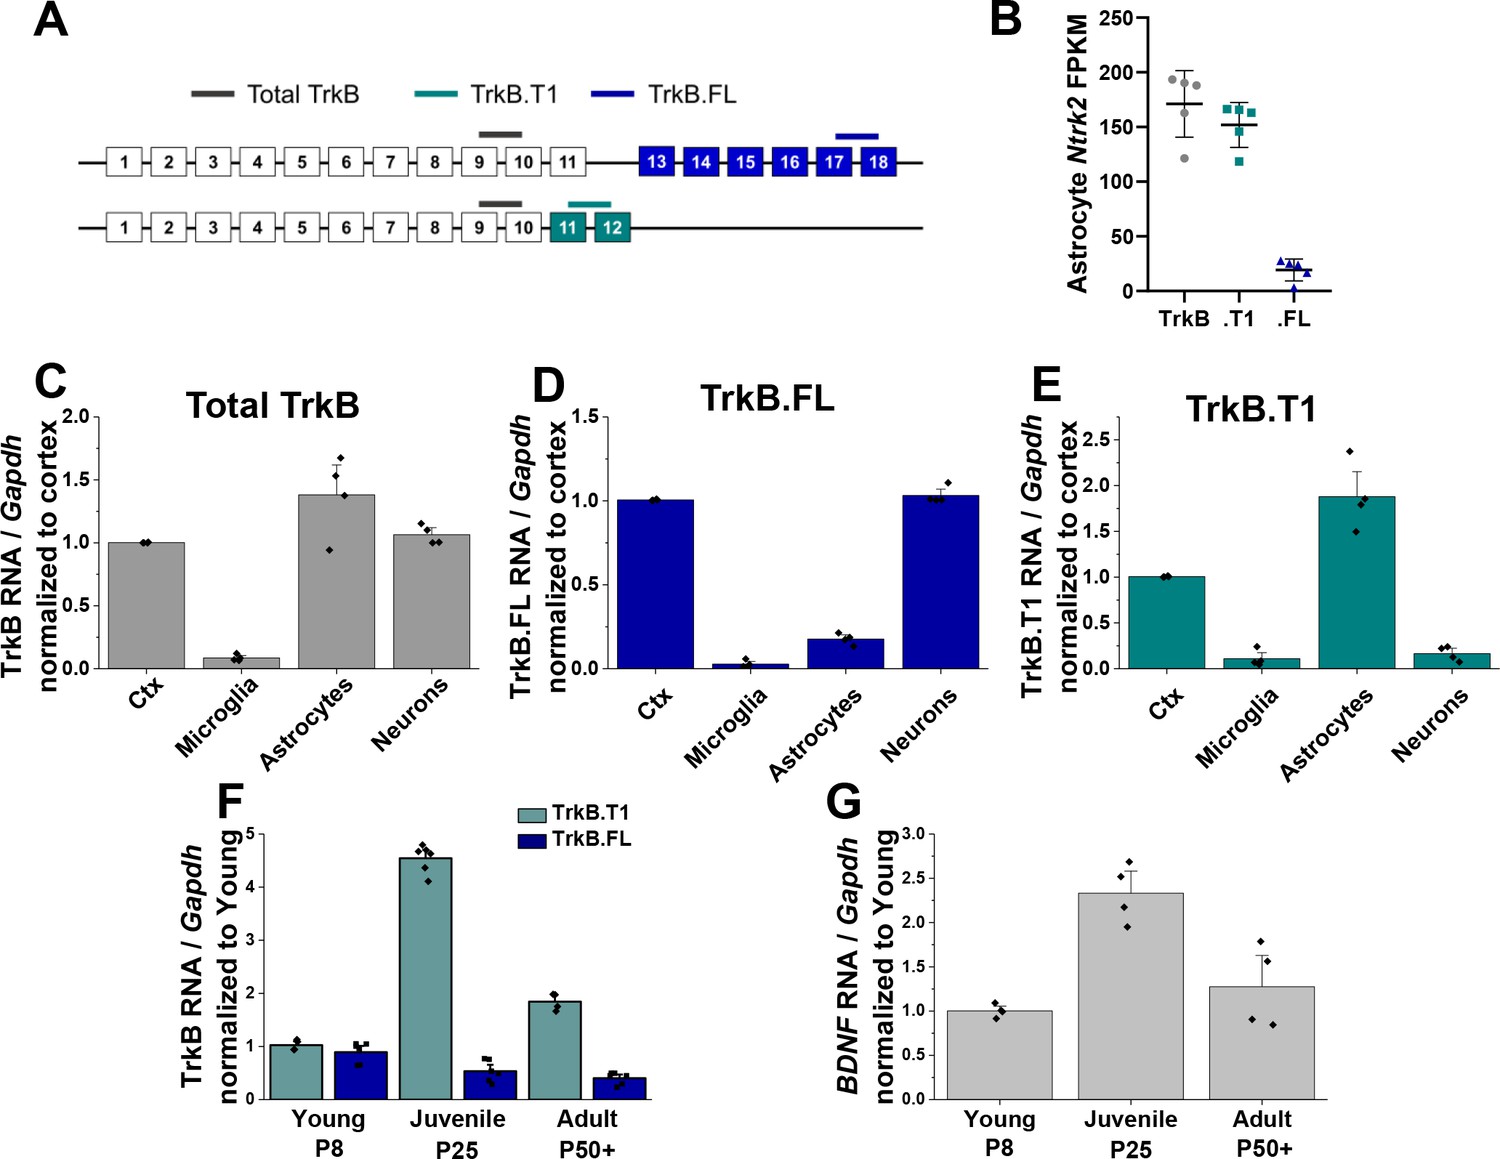
Astrocytes express high levels of truncated TrkB during astrocyte morphogenesis.
(A) Cartoon representation of Ntrk2 isoform exons and primers utilized. Total TrkB was probed with exons across both isoforms, with isoform-specific exons utilized to probe TrkB.FL (blue) and TrkB.T1 (teal) (B) Total and isoform-specific Ntrk2 RNA expression in juvenile (PND 28) wildtype astrocytes. The majority of Ntrk2 expression in astrocytes is attributed to the truncated TrkB.T1 receptor isoform. Quantitative PCR analysis of acutely isolated CNS cell populations from juvenile (PND 28) mice for (C) overall Ntrk2, (D) TrkB.FL, or (E) TrkB.T1 mRNA expression, normalized to matched whole cortex. (F) Ntrk2 receptor isoform mRNA expression in astrocytes across development (PND 7, PND 25, PND 50+). Expression of TrkB.T1 is highest in juvenile animals, when (G) Bdnf mRNA is highest in cortical tissues. Data represented as mean + /- SEM, n = 3–6 animals.
Figure 1—figure supplement 1
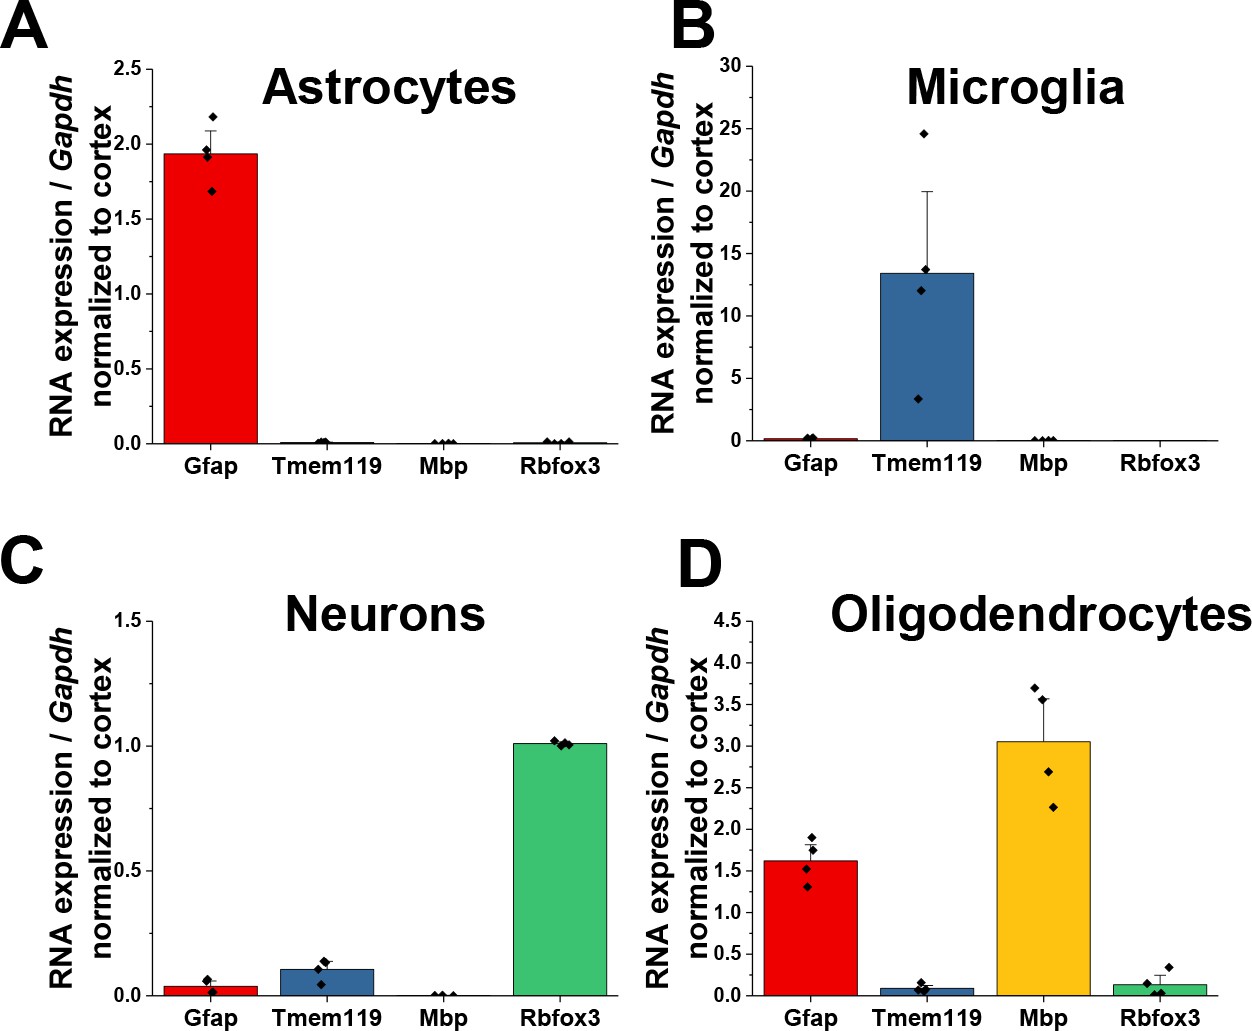
Validation of isolated CNS populations.
Quantitative PCR data of (A) astrocytes (B) microglia, (C) neurons, and (D) oligodendrocytes isolated from juvenile, PND25 animals. For microglia, astrocytes, and neurons, enrichment of cell-type specific genes with depletion of other cellular genes demonstrates isolation of pure cellular populations. Significant enrichment of Gfap was found in oligodendrocytes. Data represented as mean + /- SEM, n = 4 animals.
Figure 2
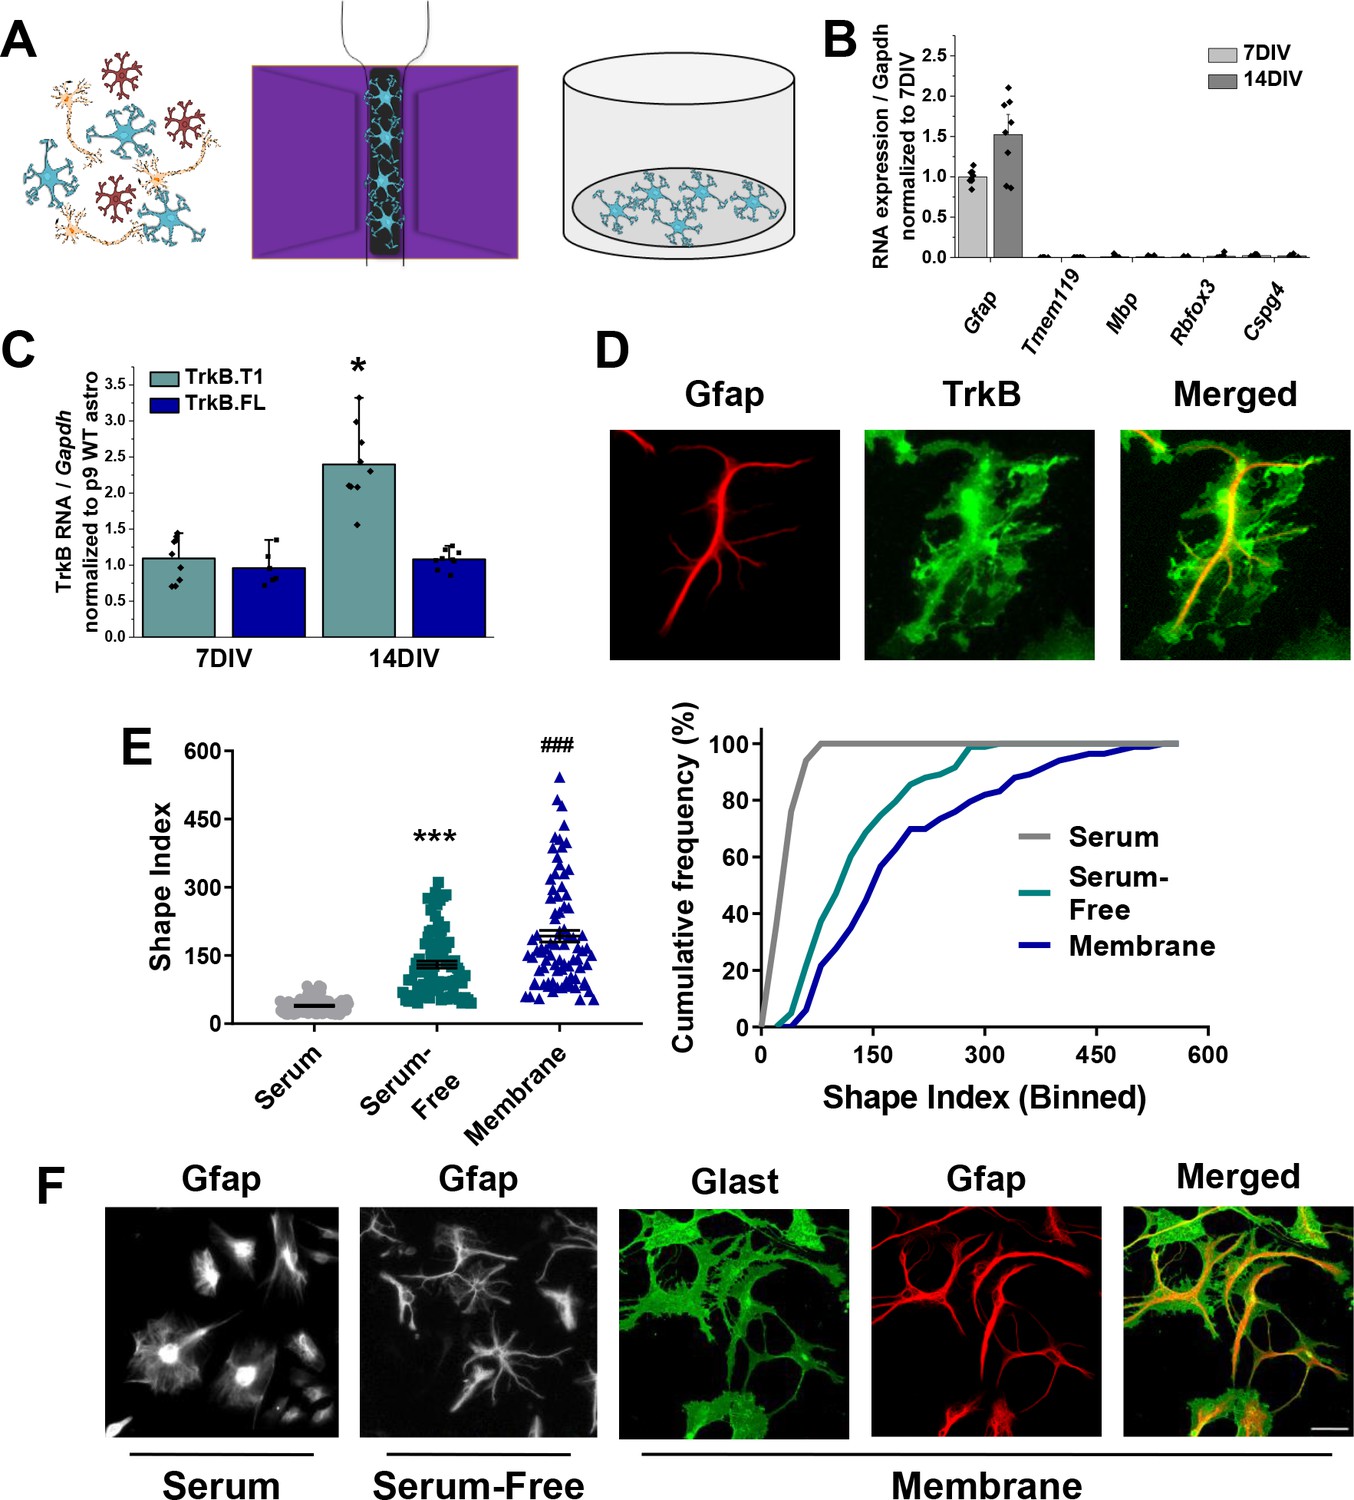
Novel serum-free primary astrocyte culture yields morphologically complex astrocytes.
(A) Cartoon representation of magnetic separation of astrocytes for culture in serum-free, defined media. (B) Quantitative PCR data from cultured astrocytes at 7 and 14 DIV demonstrates purity of cultured cells. (C) mRNA expression of Ntrk2 isoforms in cultured astrocytes compared to age-matched acutely isolated astrocytes demonstrates a developmental upregulation of TrkB.T1 expression. (D) Representative image of GFAP and TrkB immunofluorescence shows localization of TrkB to astrocytic membrane. (E) Shape index (SI) and cumulative frequency analysis of astrocytes cultured in serum-containing or serum-free media and membranous immunolabeling demonstrates increased cellular complexity in serum-free conditions. (F) Representative images of GFAP+ astrocytes cultured for 14DIV in the presence or absence of serum, and representatives images of membrane (Glast)/GFAP staining. Data represented as mean + /- SEM, n = 3–6 cultures, with two wells collected per culture. Each data point in E represents an individual cell.
Figure 3 with 2 supplements
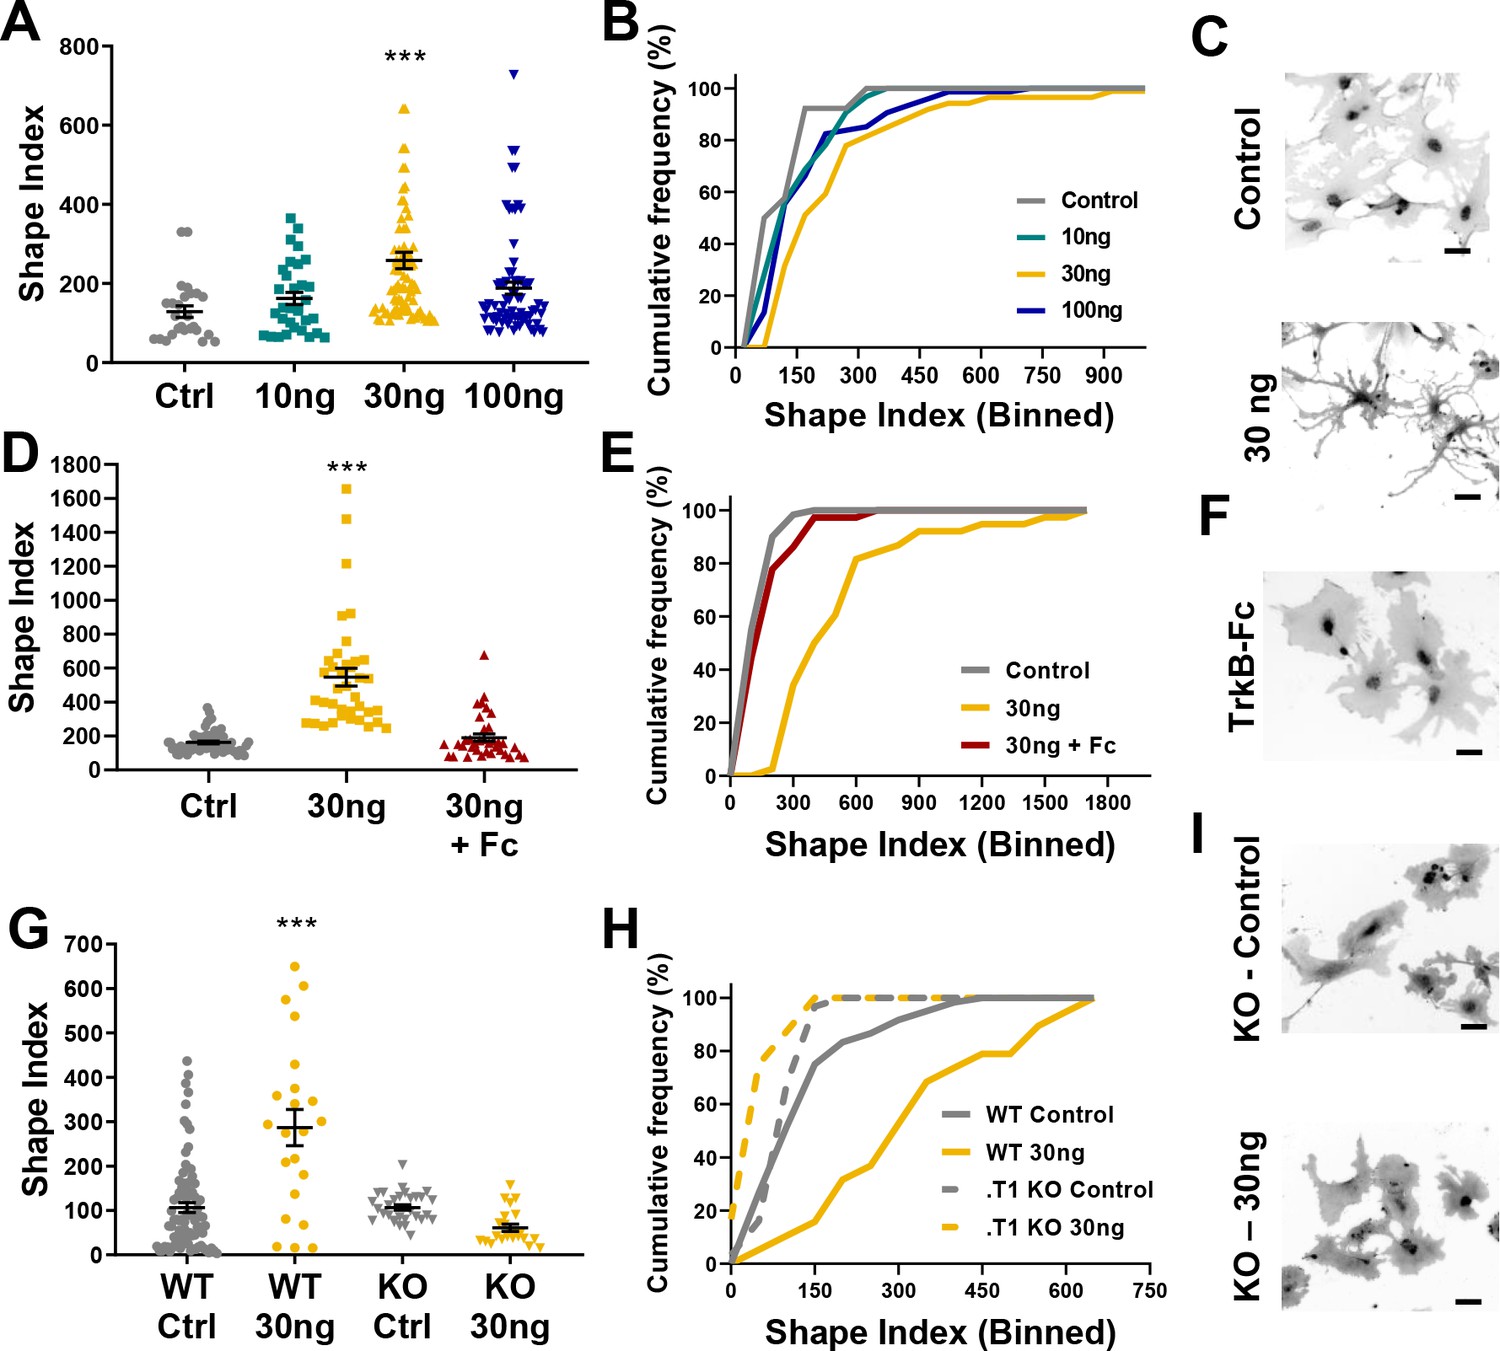
Astrocyte morphological complexity is sensitive to BDNF/TrkB.T1 signaling.
(A) SI analysis and (B) cumulative frequencies following exposure to varying concentrations of BDNF for 24 hr. (C) Representative images of control and 30ng-treated astrocytes. (D, E) Complexity analysis of astrocyte morphology following scavenge of BDNF with TrkB-Fc, (F) representative image of TrkB-Fc scavenged astrocytes. (G–I) Morphological complexity analysis of cultured astrocytes lacking the TrkB.T1 receptor in the presence of BDNF. Data represented as mean + /- SEM, n = 3–6 cultures, with two wells collected per culture. Each symbol represents an individual cell. Scale bars indicate 20 microns. *p<0.05, **p<0.01, ***p<0.0001. Each data point represents an individual cell.
Figure 3—figure supplement 1
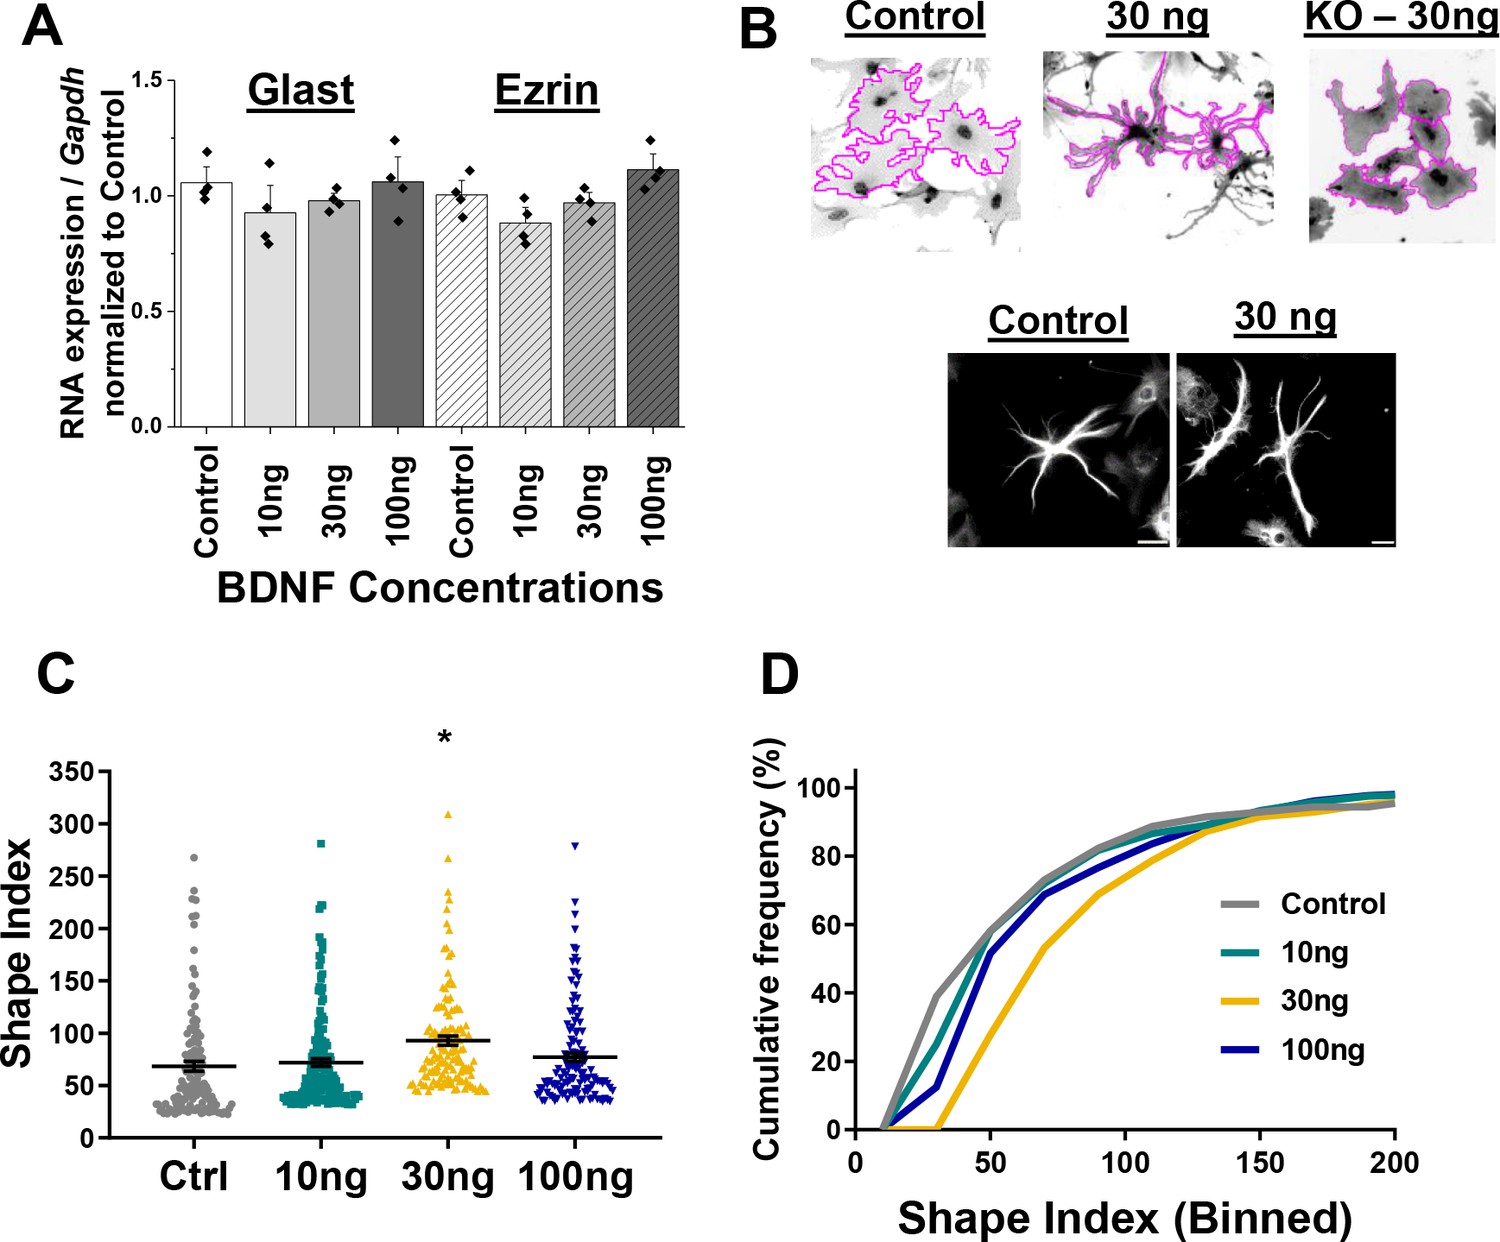
Wildtype astrocytes increase process branch complexity in response to BDNF.
(A) Quantification PCR validation that Glast and Ezrin expression does not change in response to varying concentrations of BDNF for 24 hr. (B) Example SI tracing of control, WT-30ng and .T1 KO-30ng astrocytes and images of GFAP+ processes in control- and 30ng-treated astrocytes. (C) Shape index quantification and (D) relative frequency curves demonstrate an increase in astrocyte process branch complexity in response to 30 ng BDNF. Data represented as mean +/- SEM, n = 3–6 cultures, with two wells collected per culture, and 3–5 random ROIs per well. Scale bars indicate 20 microns. *p<0.05. Each data point represents an individual cell in C.
Figure 3—figure supplement 2
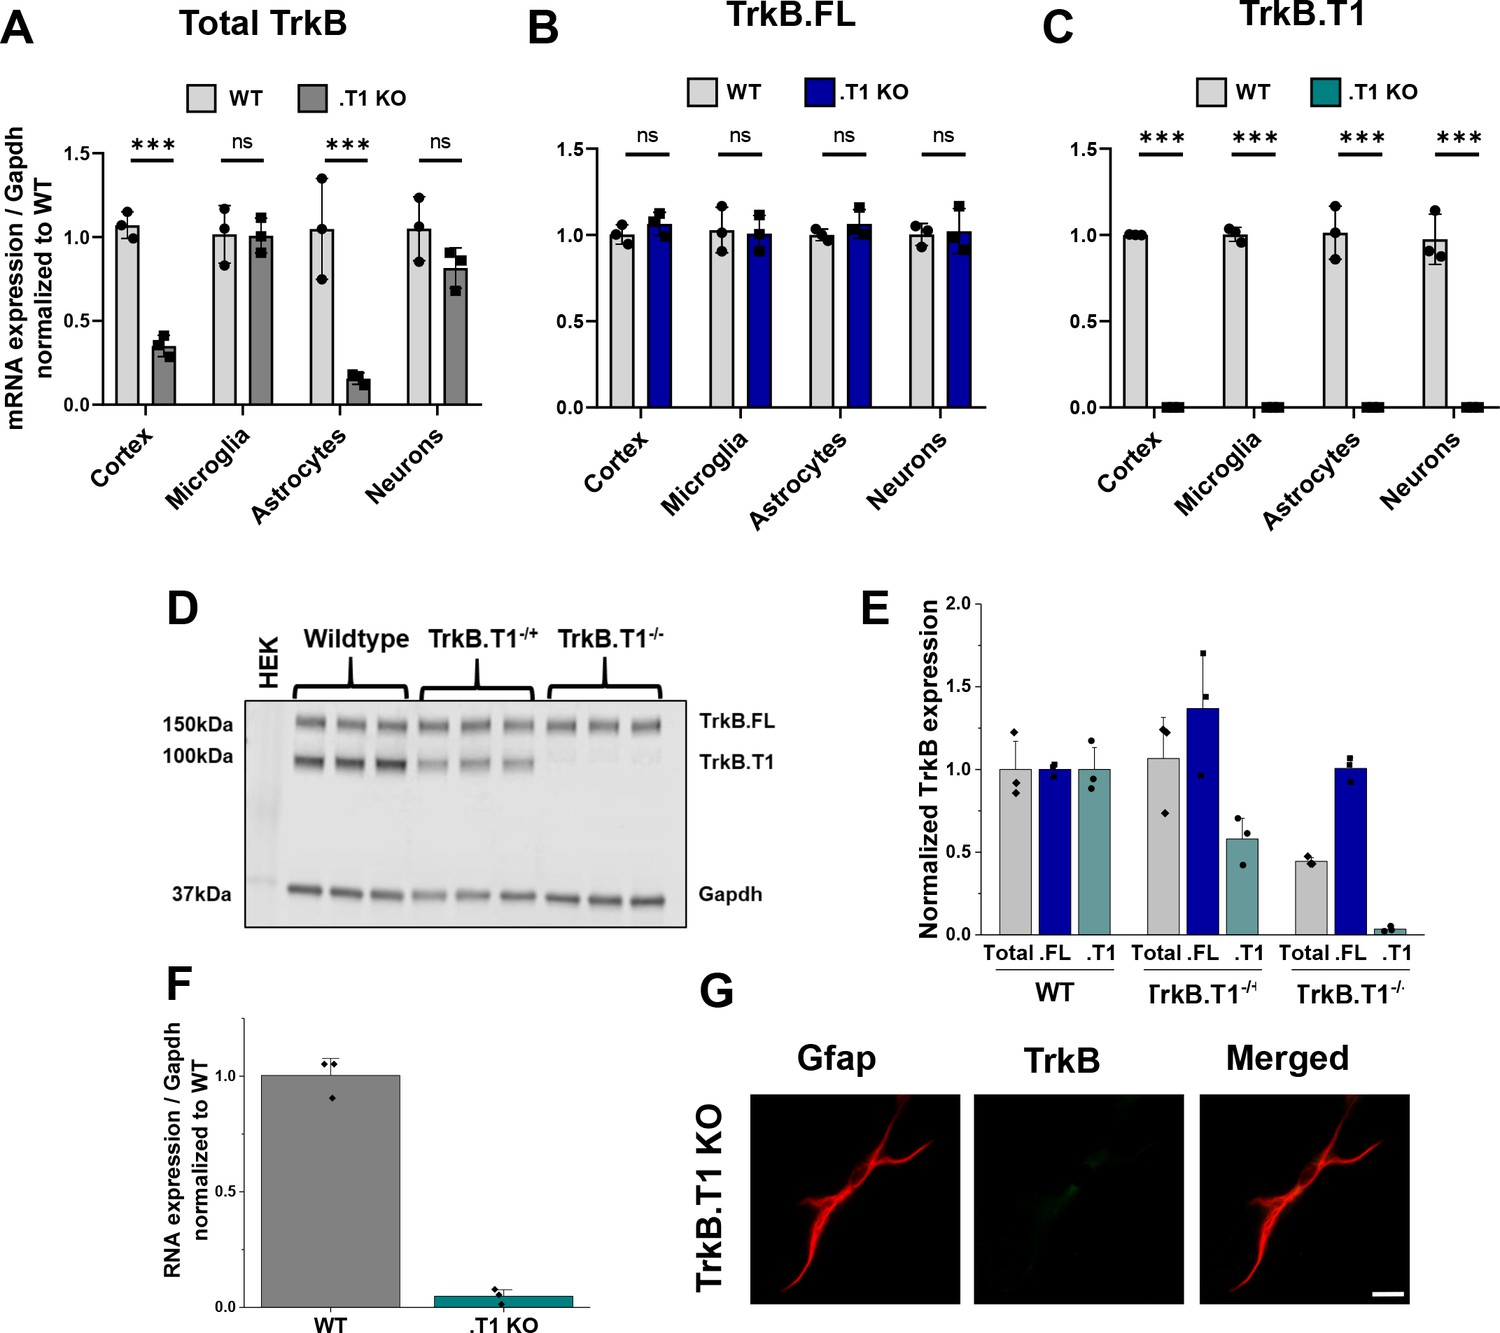
Validation of truncated TrkB isoform-specific deletion in TrkB.
T1 KO mice. Quantitative PCR data of whole cortex and isolated microglia, astrocytes, and neurons from wildtype and TrkB.T1 KO animals demonstrate (A) depletion of total TrkB in whole cortex and astrocytes, (B) no change in full-length TrkB.FL, and (C) depletion of TrkB.T1 mRNA in all fractions compared to wildtype levels. (D) Representative western blot and (E) quantification demonstrates no compensatory upregulation of the TrkB.FL isoform at the protein level. (F) Quantitative PCR data of TrkB.T1 KO cultured astrocytes at 14 DIV demonstrate loss of TrkB.T1 mRNA expression. (G) Representative images of Gfap and TrkB immunofluorescence in 14 DIV TrkB.T1 KO astrocytes. Data represented as averages + /- SEM, n = 3–6 cultures, with two wellsper culture.
Figure 4 with 1 supplement
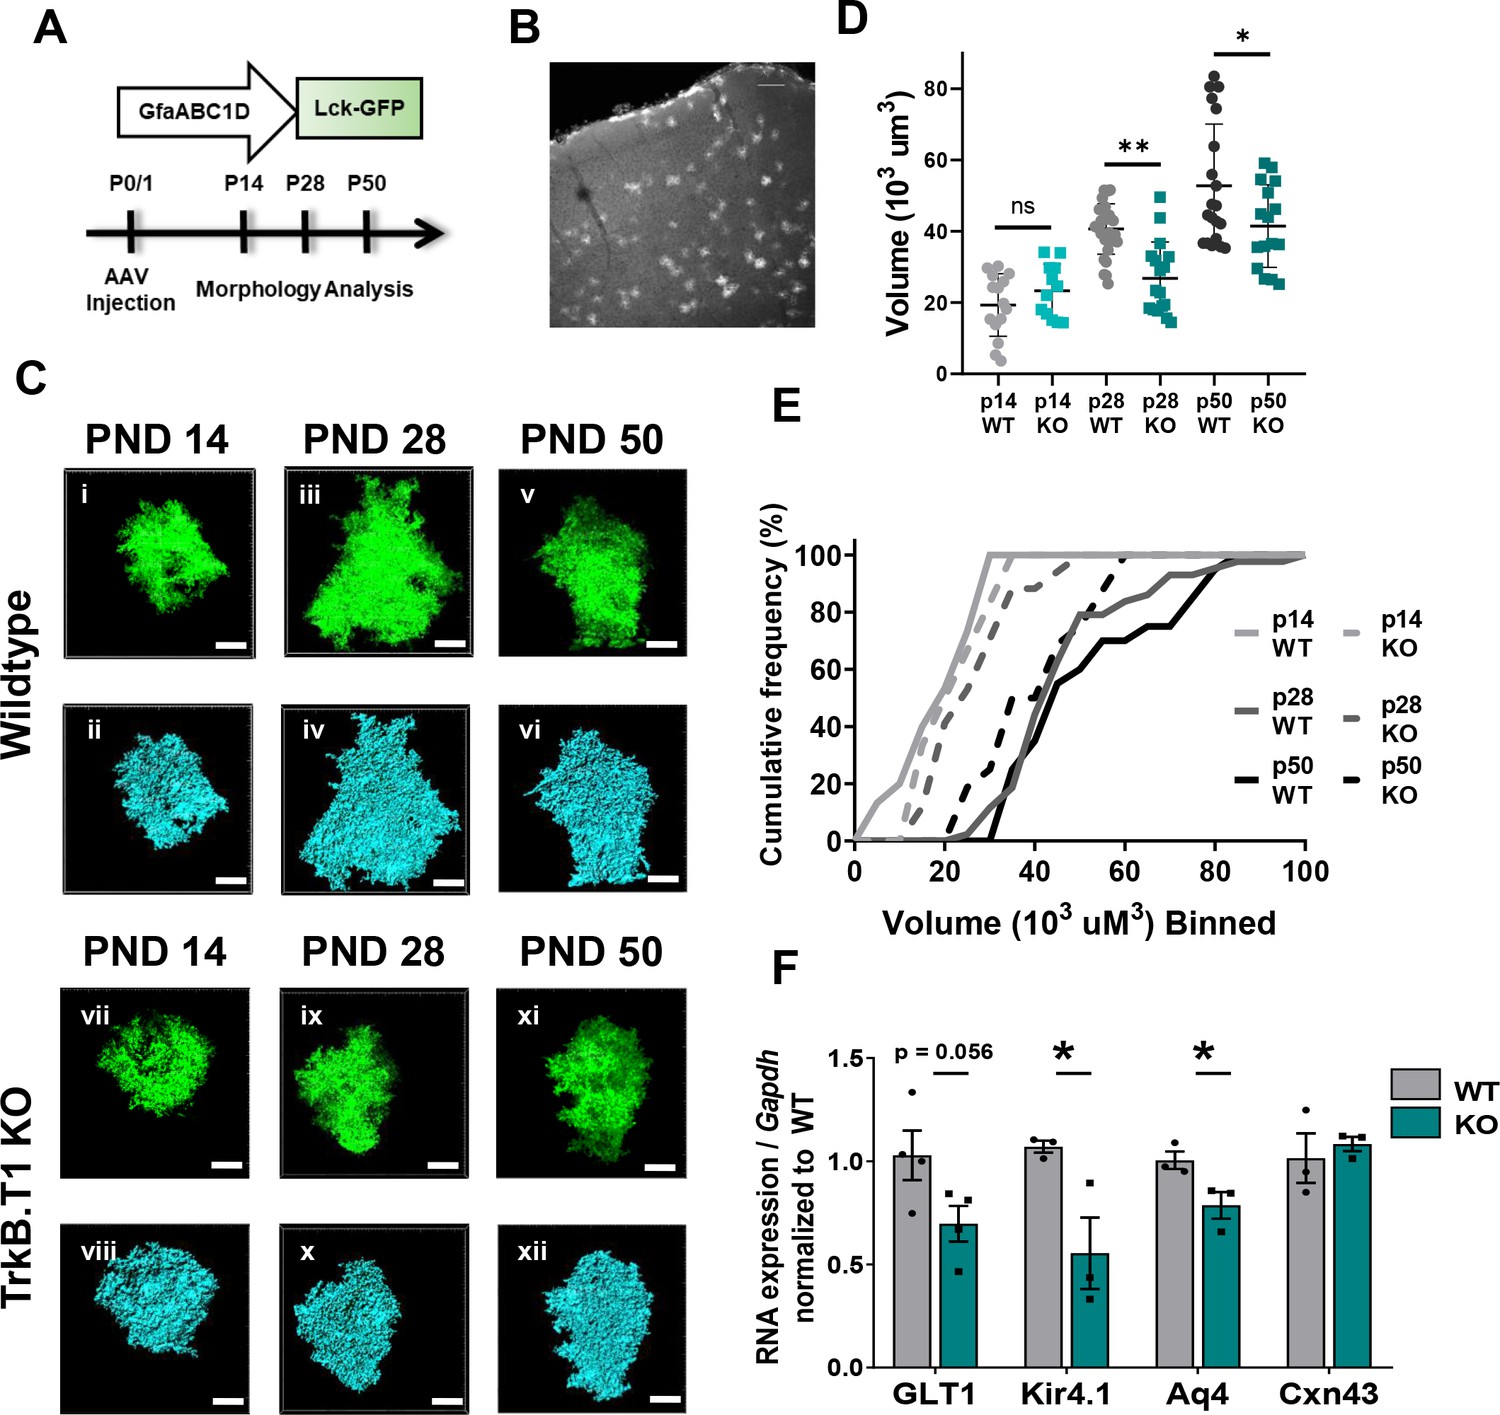
Loss of truncated TrkB.T1 in vivo leads to decreased astrocyte morphogenesis and an immature phenotype during maturation period.
(A) Schematic of AAV injection and timeline of morphological analysis. (B) Representative image demonstrates sporadic, single astrocyte labeling in PND 28 animals following AAV injections. (C) Representative images of confocal (left, green) and Imaris surface reconstructions (right, blue) of astrocytes in (i–iv) wildtype and (v–ix) TrkB.T1 KO mice. Quantification of (D) astrocyte volume reconstruction and (E) cumulative frequency analysis demonstrates that prior to entering the morphological refinement phase (PND 14), wildtype and TrkB.T1 KO astrocytes exhibit no difference in their morphological complexity. However, by the end of the maturation phase (PND 28), TrkB.T1 KO astrocytes fail to increase their volume. It is only at PND 50 do TrkB.T1 KO astrocytes exhibit an increased morphological complexity. At PND 28 and PND 50 TrkB.T1 KO astrocytes exhibit a roughly 30% decrease in complexity compared to WT littermates. (F) QPCR analysis of WT and. T1 KO PND25 astrocytes demonstrates decreased mRNA expression of mature astrocytic genes Glt1, Kir4.1, and Aqp4, with no change in Cx43 expression. Data represented as mean + /- SEM, n = 5–7 animals for image analysis, with at least n = 3 cells per animal; n = 3 animals for qPCR analysis; *p<0.05, **p<0.01, ***p<0.0001. Each data point represents an individual cell in D, and an individual animal in F.
Figure 4—figure supplement 1
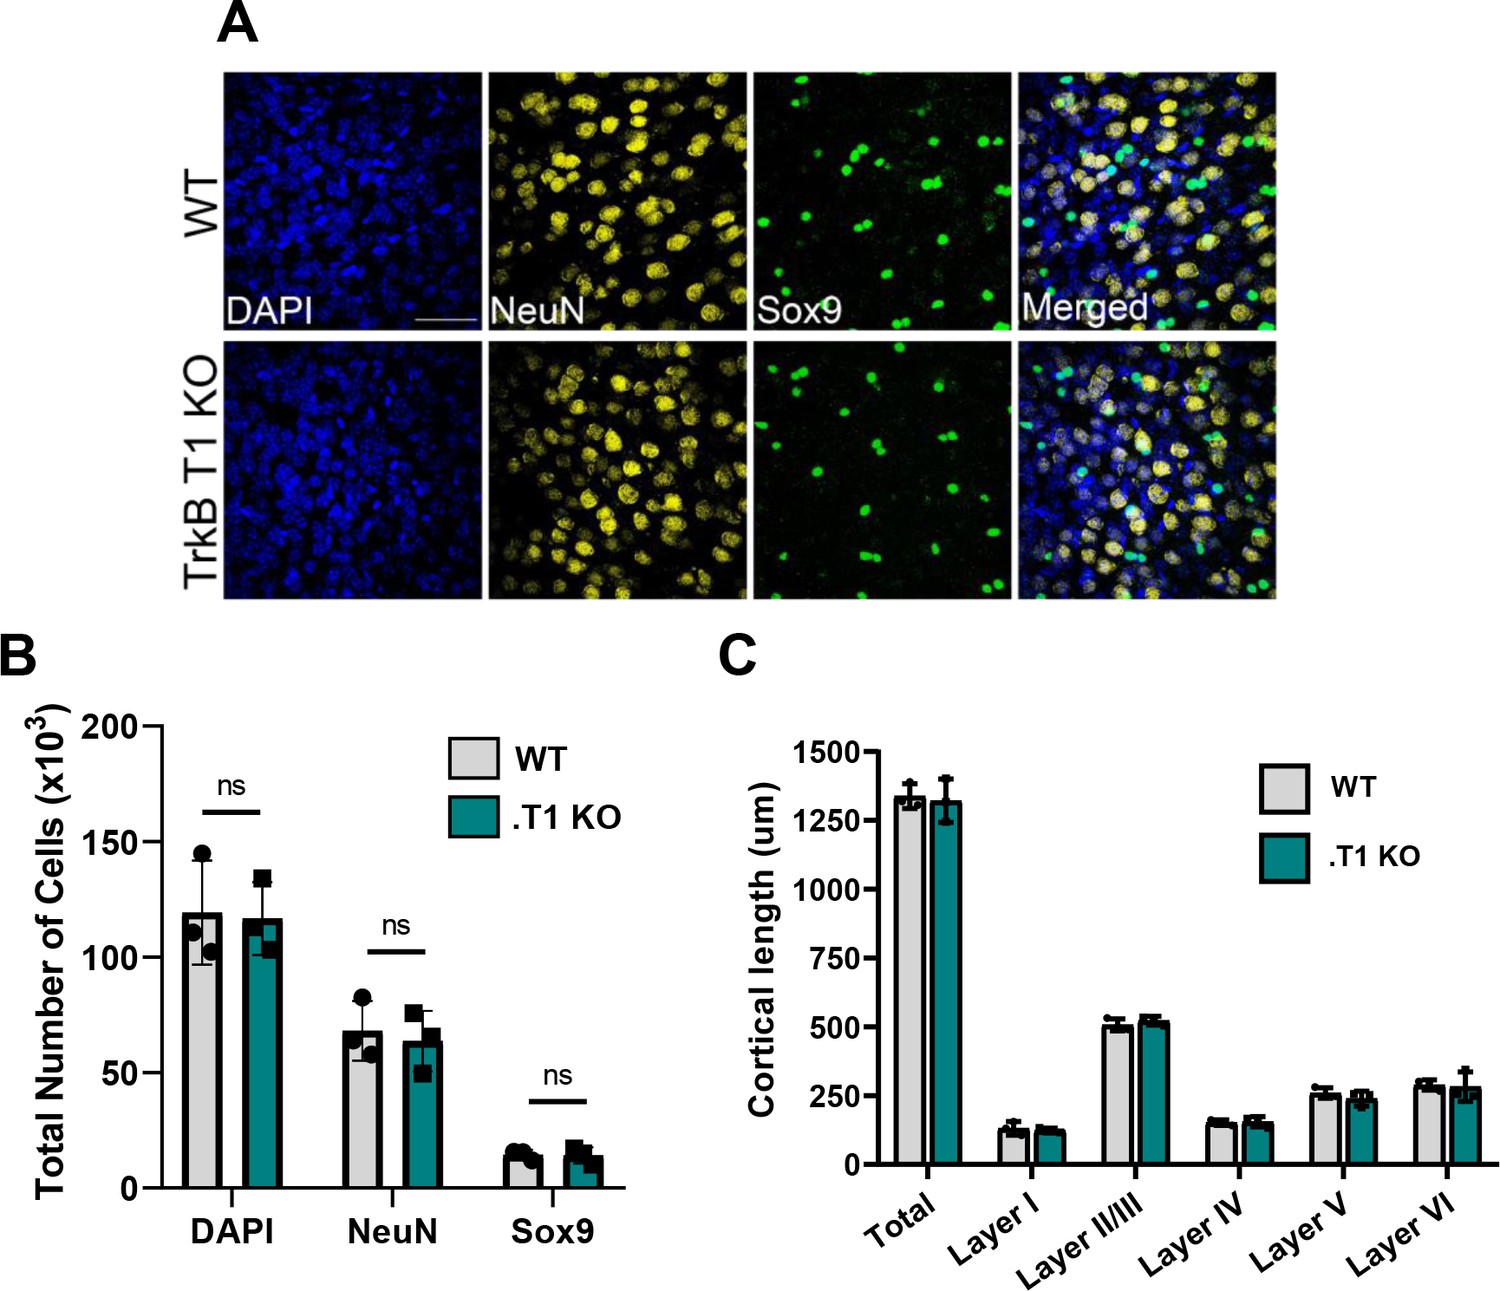
No change in astrocyte number in TrkB.T1 KO motor cortex.
(A) Representative images of total cells (DAPI), neurons (NeuN), and astrocytes (Sox9) in PND 28 WT and .T1 KO motor cortex. (B) Quantification via stereological microscopy revealed no difference in total, neuronal, or astrocyte numbers between WT and .T1 KO animals. (C) Quantification of cortical layer thickness revealed no difference in WT or .T1 KO cortical length. Data represented as averages + /- SD, n = 3 animals per genotype.
Figure 5 with 1 supplement
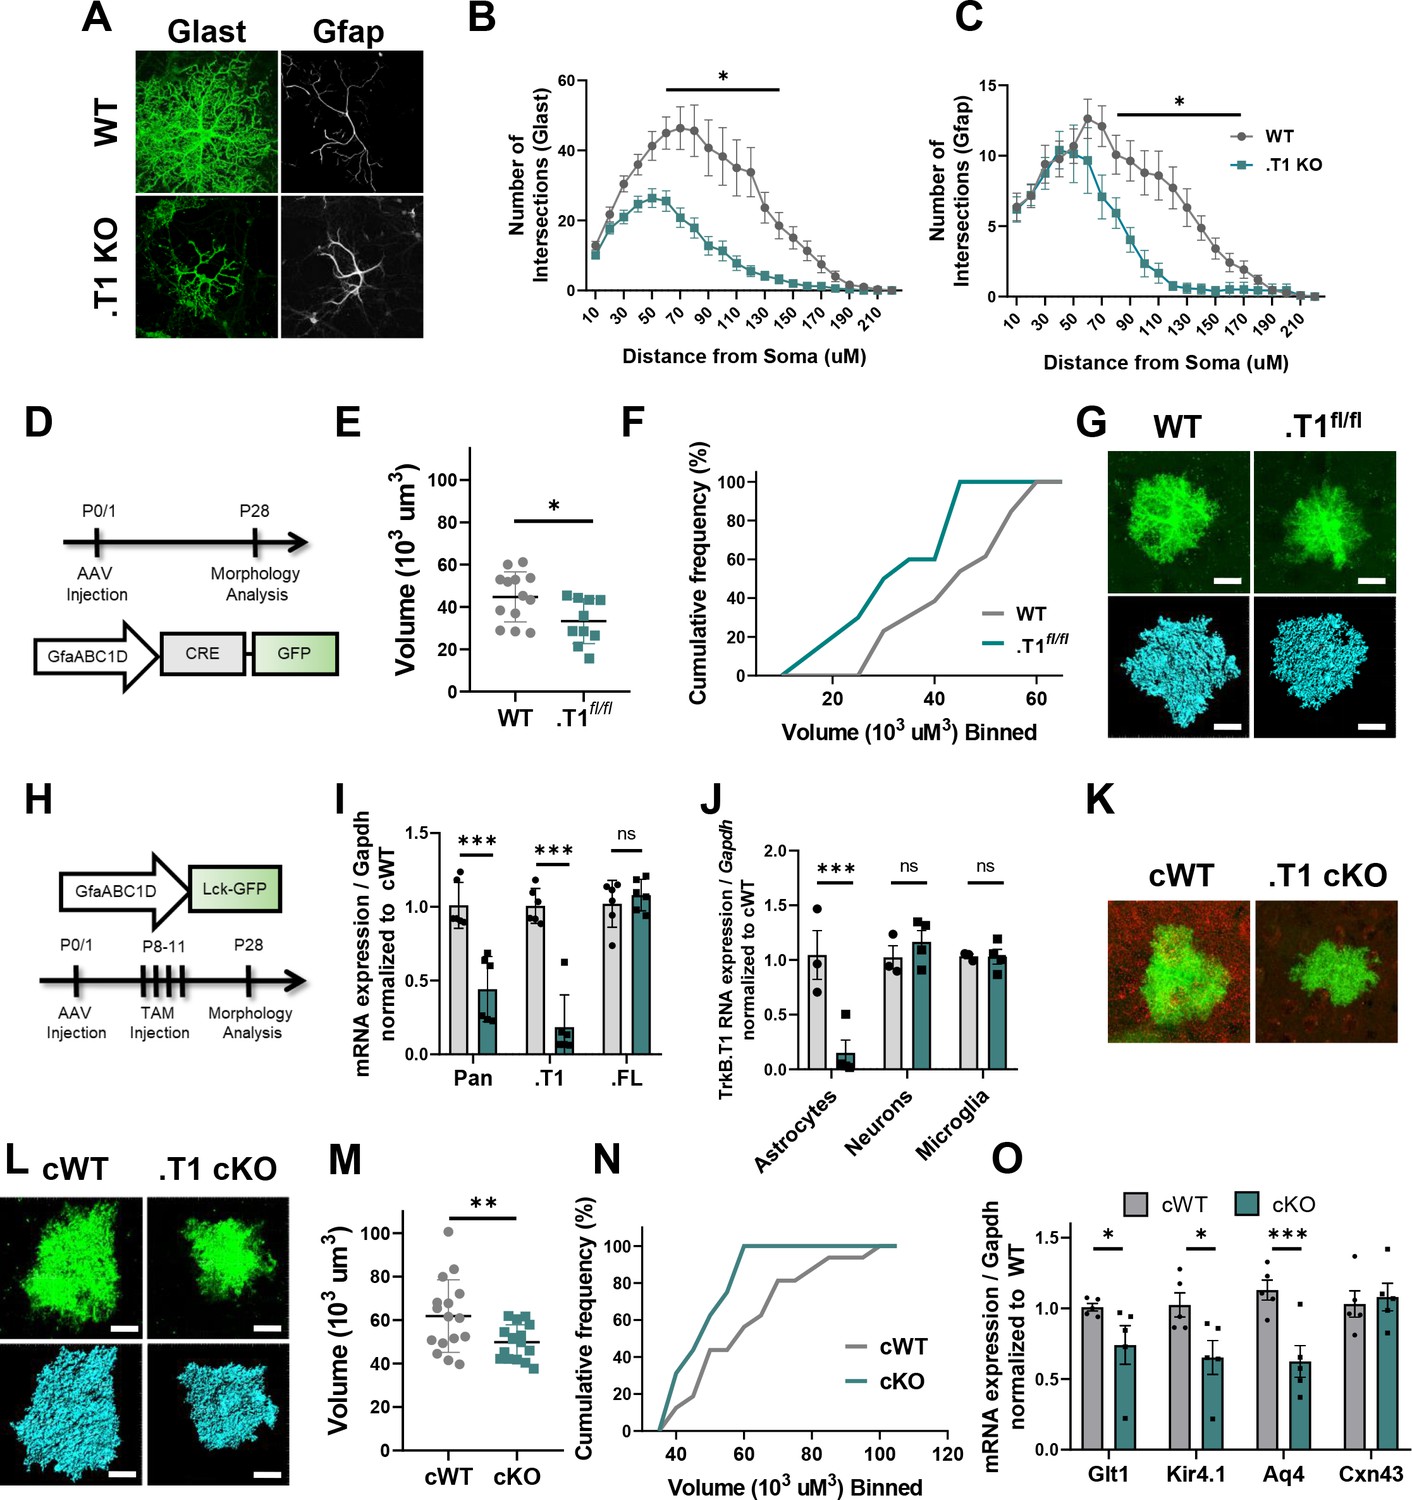
Specific loss of astrocytic TrkB.T1 results in decreased complexity.
(A) Representative images of Glast and Gfap immunostaining of WT and .T1 KO astrocytes co-cultured with WT neurons. Sholl analysis revealed decreased complexity of .T1 KO astrocytes at the (B) total (Glast) and C) branch (Gfap) levels. (D) Schematic of timeline of AAV-Cre injections and morphology analysis. (E,F) Egfp-Cre+ astrocytes exhibited decreased astrocyte volume and complexity in. T1fl/fl animals compared to WT Egfp-Cre+ astrocytes. (G) Representative images of confocal (green, top) and Imaris reconstruction (blue, bottom). (H) Schematic of timeline to generate astrocyte-specific cKO animals. (I) QPCR analysis of isolated astrocytes revealed specific loss of TrkB.T1 isoform and no change in TrkB.FL isoform expression. (J) QPCR analysis of sequentially isolated astrocytes, neurons, and microglia reveal astrocyte-specific loss of TrkB.T1. (K) Representative confocal images of TrkB.T1 immunoreactivity in cWT and cKOs reveals loss of TrkB.T1 protein expression. (L) Representative images of confocal (green, top) and Imaris reconstructions (blue, bottom) of cWT and .T1 cKO astrocytes. (M, N) .T1 cKO astrocytes exhibited decreased morphological complexity in comparison to cWT astrocytes. (O) QPCR analysis of WT and .T1 cKO PND25 cortex demonstrates decreased mRNA expression of mature astrocytic genes Slc1a2 (Glt1), Kcnj10 (Kir4.1), and Aq4 (Aqp4), with no change in Gja1 (Cx43) expression. Data represented as mean + /- SEM, n = 4–7 animals for image analysis, with at least n = 3 cells per animal; n = 6 animals for qPCR analysis in I; three animals for qPCR analysis in J; *p<0.05, **p<0.01, ***p<0.0001. Each data point represents an individual cell in E and M, and an individual animal in I, J, and O.
Figure 5—figure supplement 1
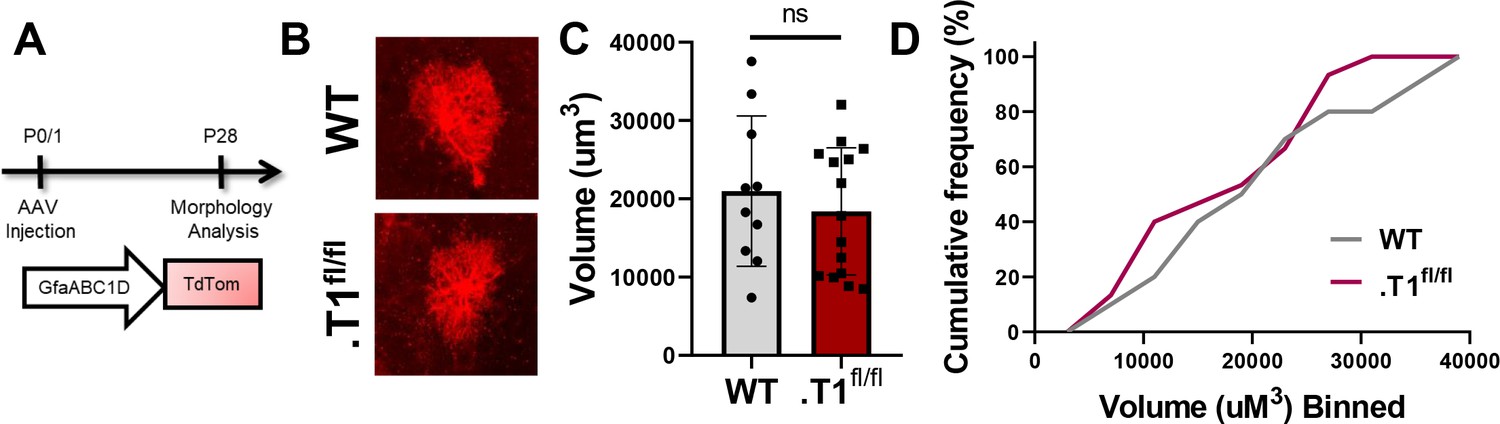
No change in control, tdtomato+ astrocyte volume.
(A) Schematic of AAV injection and timeline of morphological analysis. (B) Representative images of tdTom+ astrocytes in WT and homozygous floxed (.T1fl/fl) mice. No significant difference was found in (C) average volume or (D) cumulative frequency analysis. Data represented as mean + /- SEM, n = 4–6 animals. Each data point represents an individual cell in C.
Figure 6 with 1 supplement
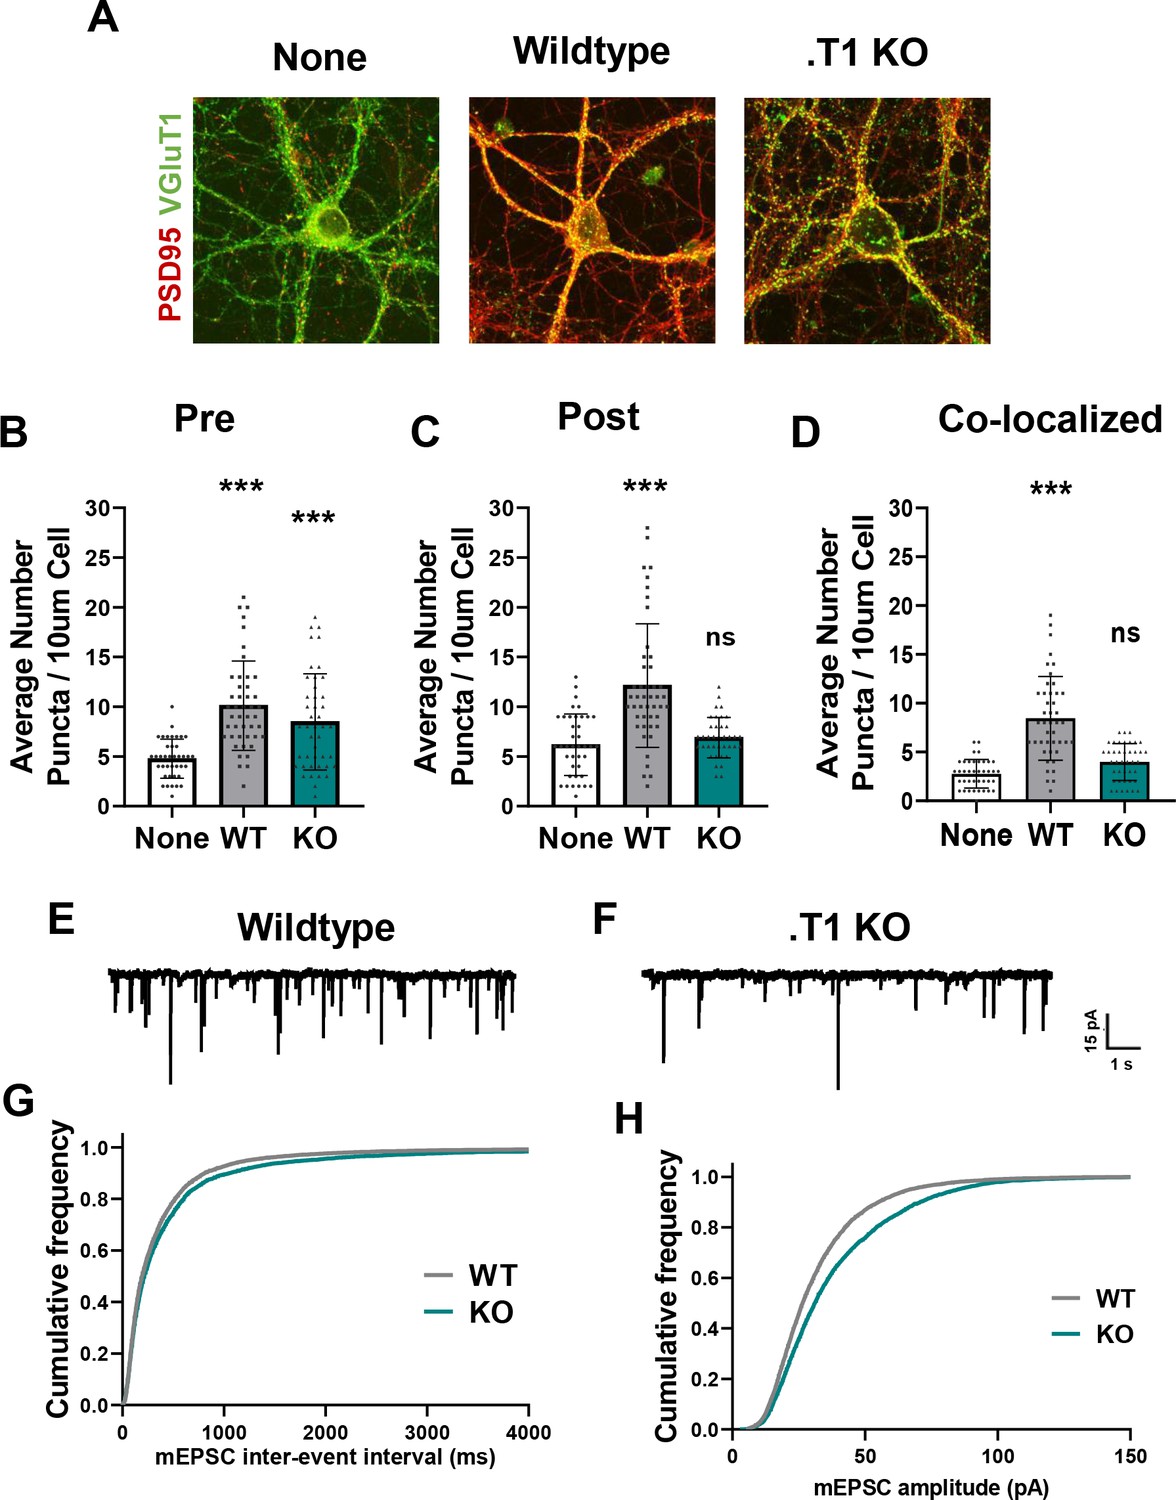
Astrocytes lacking TrkB.T1 receptor are unable to support neuronal synaptogenesis.
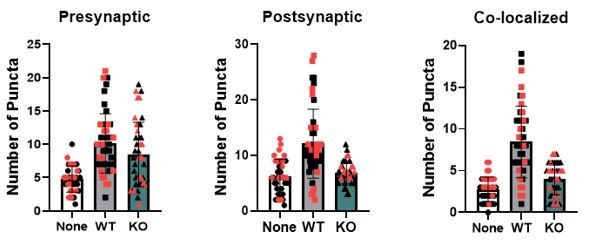
(A) Representative images of neurons cultured in the presence of none, wildtype, or TrkB.T1 KO astrocytes. Excitatory synapses were visualized with VGlut1+/PSD95+ colocalization. Quantification of (B) pre-synaptic, (C) post-synaptic, and (D) colocalized, functional synapses of cultured neurons. Representative traces of mEPSCs in neurons co-cultured with (E) wildtype or (F). T1 KO astrocytes. Whole-cell patch recording demonstrated (G) reduced frequency but (H) increased amplitude of mEPSCs in neurons co-cultured with .T1 KO astrocytes compared to co-culture with WT astrocytes. Data represented as averages + /- SEM, n = 3–4 animals for qPCR; N = 6 cultures, with at least n = 4 cells per culture. *p<0.05, **p<0.01; *=compared to no astrocyte control. Each data point represents an individual cell in B-D.
Figure 6—figure supplement 1
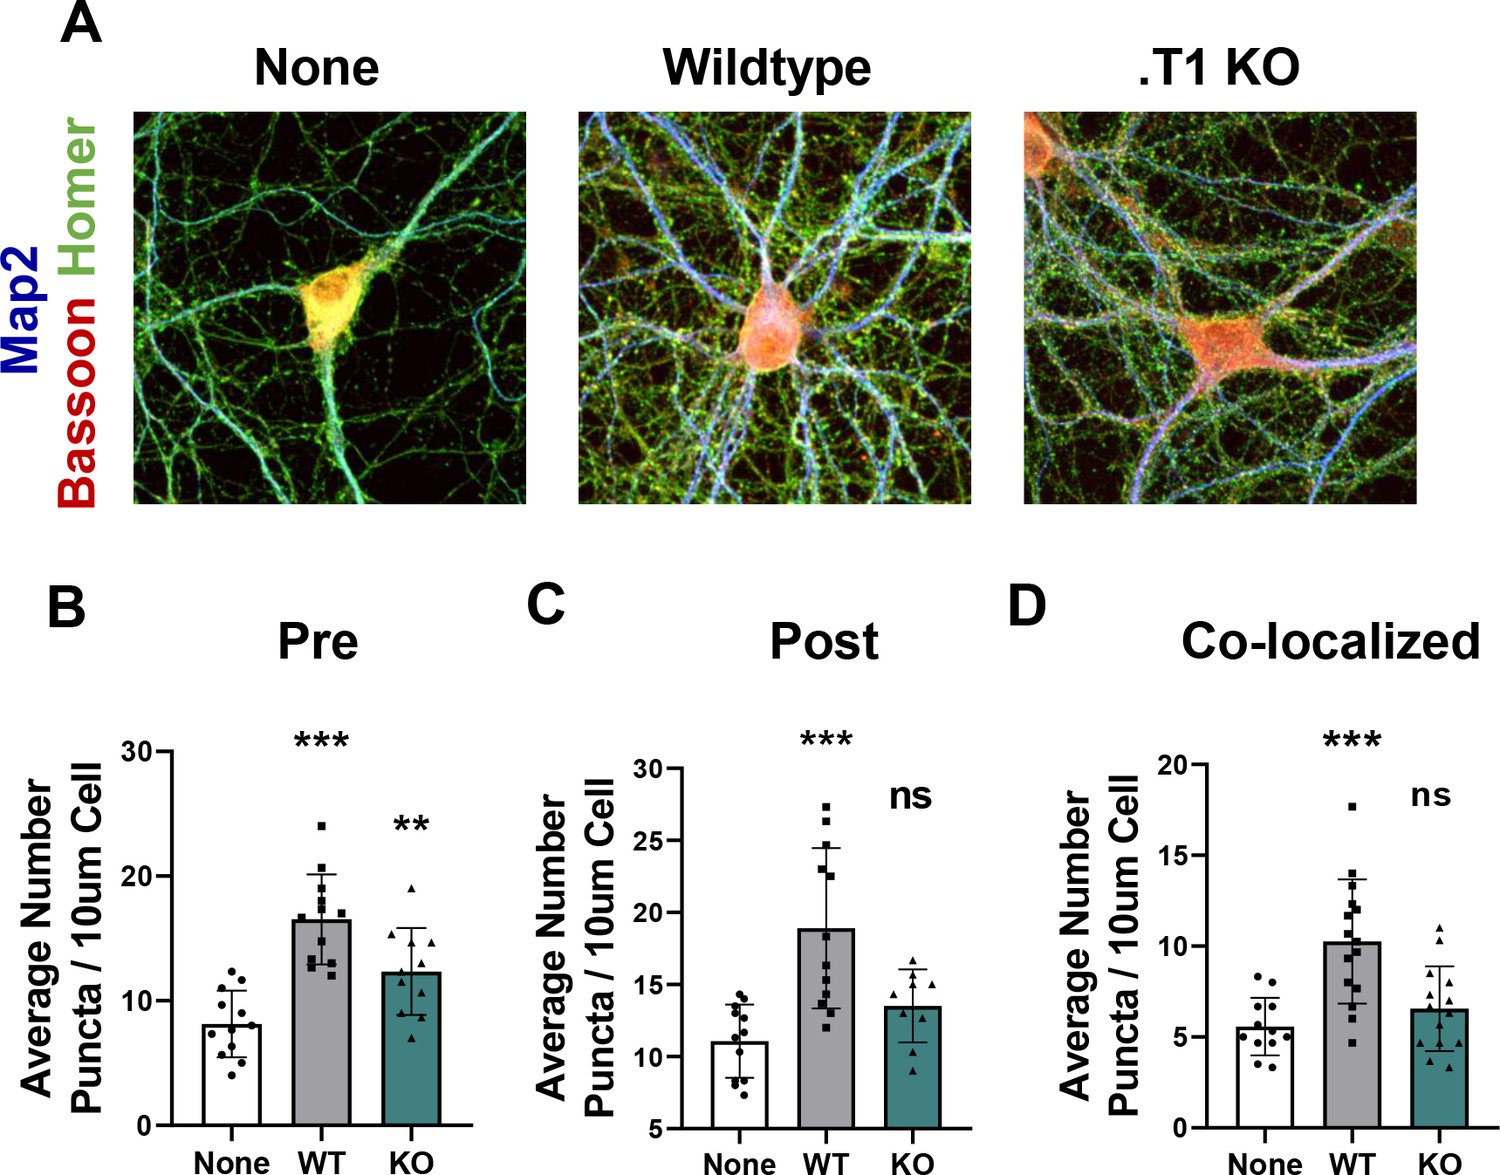
Astrocytes lacking TrkB.T1 receptor are unable to support neuronal synaptogenesis.
(A) Representative images of neurons cultured in the presence of none, wildtype, or TrkB.T1 KO astrocytes. Excitatory synapses were visualized with Bassoon+/Homer+ colocalization. Quantification of (B) pre-synaptic, (C) post-synaptic, and (D) colocalized, functional synapses of cultured neurons. Data represented as averages + /- SD, N = 3 cultures, with at least n = 4 cells per culture. *p<0.05, **p<0.01; *=compared to no astrocyte control. Each data point represents an individual cell in B-D.
Author response image 1
Tables
Key resources table
| Reagent type (species) or resource | Designation | Source or reference | Identifiers | Additional information |
|---|---|---|---|---|
| Strain, strain background(M. musculus, male) | Wildtype; WT | This paper | See Materials and methods, Animals section | |
| Strain, strain background(M. musculus, male) | TrkB.T1 KO;. T1 KO | Dr. Lino Tessarallo | Global TrkB.T1 knockout mice | |
| Strain, strain background(M. musculus, male) | Aldh1l1-cre/ERT2 | Jackson Laboratories | Stock #029655 | Astrocyte-specific TAM-inducible CRE mice line |
| Strain, strain background(M. musculus, male) | TrkB.T1fl/fl;. T1fl/fl | Dr. Lino Tessarallo | Floxed TrkB.T1 mice line | |
| Transfectedconstruct (M. musculus) | GfaABC1D.Lck.egfp | Addgene | Cat#105598-AAV5 | Membrane-tethered eGFP to visualize astrocyte morphology |
| Transfectedconstruct (M. musculus) | GfaABC1D.Egfp-Cre | UNC Gene Therapy Center Vector Core | Astrocyte-specific deletion of TrkB.T1 and visualization of astrocyte morphology | |
| Transfectedconstruct (M. musculus) | GfaABC1D.tdTomato | Addgene | Cat#44332-AAV5 | Control for viral-mediated deletion of TrkB.T1 in astrocytes; visualization of astrocyte morphology |
| Antibody | Rb-GFAP (polyclonal) | DAKO | Cat#Z0334 | 1:1000/Overnight |
| Antibody | Rb-Glast (polyclonal) | Abcam | Cat#ab416 | 1:500/Overnight |
| Antibody | Ms-Ezrin (monoclonal) | Sigma | Cat#E8897 | 1:500/Overnight |
| Antibody | Gp-VGLUT1 (polyclonal) | Millipore | Cat# AB5905 | 1:1000/Overnight |
| Antibody | Ms-PSD95 (monoclonal) | NeuroMab | Cat#75028 | 1:1500/Overnight |
| Antibody | Rb-TrkB (pan; polyclonal) | Millipore | Cat#07–225 | 1:1000/1 hr, WB; 1:1000/Overnight, IF |
| Antibody | Rb-Sox9 (monoclonal) | Abcam | Cat#ab185966 | 1:500/Overnight |
| Antibody | Ms-NeuN (monoclonal) | Millipore | Cat# MAB377 | 1:500/Overnight |
| Antibody | Rb-TrkB.t1 (polyclonal) | SantaCruz | Cat#sc119 | 1:750/Overnight |
| Sequence-based reagent | Gfap | ThermoFisher Scientific | Cat#Mm01253033_m1 | |
| Sequence-based reagent | Tmem119 | ThermoFisher Scientific | Cat#Mm01248771_m1 | |
| Sequence-based reagent | Mbp (myelin basic protein) | ThermoFisher Scientific | Cat# Mm01266402_m1 | |
| Sequence-based reagent | Rbfox3 (NeuN) | Thermo Fisher Scientific | Cat# Mm01248771_m1 | |
| Sequence-based reagent | Cspg4 (NG2) | ThermoFisher Scientific | Cat# Mm0057256_m1 | |
| Sequence-based reagent | Kcnj10 (Kir4.1) | Thermo Fisher Scientific | Cat# Mm00445028_m1 | |
| Sequence-based reagent | Slc1a2 (Glt1) | ThermoFisher Scientific | Cat# Mm00441457_m1 | |
| Sequence-based reagent | Aq4 (Aquaporin-4) | ThermoFisher Scientific | Cat# Mm00802131_m1 | |
| Sequence-based reagent | Cx43 (Connexin-43) | ThermoFisher Scientific | Cat# Mm01179639_s1 | |
| Sequence-based reagent | Ntrk2 (TrkB, total) | ThermoFisher Scientific | Cat# Mm00435422_m1 | Recognizes all isoforms; targets transmembrane spanning exons |
| Sequence-based reagent | Ntrk2 (TrkB.Fl) | ThermoFisher Scientific | Cat# Mm01341761_m1 | Recognizes full length isoform; targets tyrosine kinase domain spanning exons |
| Sequence-based reagent | Ntrk2 (TrkB.T1) | ThermoFisher Scientific | TCAAGTTGGCGA GACATTCCA | Recognizes truncated TrkB.T1 isoform; targets. T1 specific exon |
| Sequence-based reagent | Gapdh | ThermoFisher Scientific | Cat#4352339E | |
| Peptide, recombinant protein | TrkB-Fc | R and D Systems | Cat#688-TK-100 | 2 ug |
| Peptide, recombinant protein | BDNF | Promega | Cat# G1491 | |
| Chemical compound, drug | (z)−4-hydroxytamoxifen; TAM | Tocris | Cat#3412 | 20 mg/ml stock concentration; 20 uL 1X day between PND 8–11 |
Additional files
-
Transparent reporting form
- https://doi.org/10.7554/eLife.44667.014
Download links
A two-part list of links to download the article, or parts of the article, in various formats.
Downloads (link to download the article as PDF)
Open citations (links to open the citations from this article in various online reference manager services)
Cite this article (links to download the citations from this article in formats compatible with various reference manager tools)
Astrocyte morphogenesis is dependent on BDNF signaling via astrocytic TrkB.T1
eLife 8:e44667.
https://doi.org/10.7554/eLife.44667


