Monitoring site-specific conformational changes in real-time reveals a misfolding mechanism of the prion protein
- National Centre for Biological Sciences, Tata Institute of Fundamental Research, India
Figures
Figure 1 with 2 supplements

FRET in mutant variants of moPrP in their monomeric and oligomeric forms.
(A) Structure of moPrP (PDB ID 1AG2) showing the positions of the FRET pairs. The donor tryptophans, W144 and W197 are shown as blue sticks, and the acceptor cysteines with covalently bound TNB moieties are shown as orange spheres. The five single Trp, single Cys-containing mutant variants, corresponding to W144-C153, W144-C199, W144-C223, W197-C169 and W197-C223 are shown. The secondary structural elements, N and C-termini and disulphide bond are indicated. (B-F) Fluorescence emission spectra of unlabelled (blue) and TNB-labelled (orange) the single Trp, single Cys-containing mutant variants in their monomeric (solid lines) and oligomeric forms (dashed lines) are shown. The relevant FRET pairs are indicated in each panel.
Figure 1—figure supplement 1
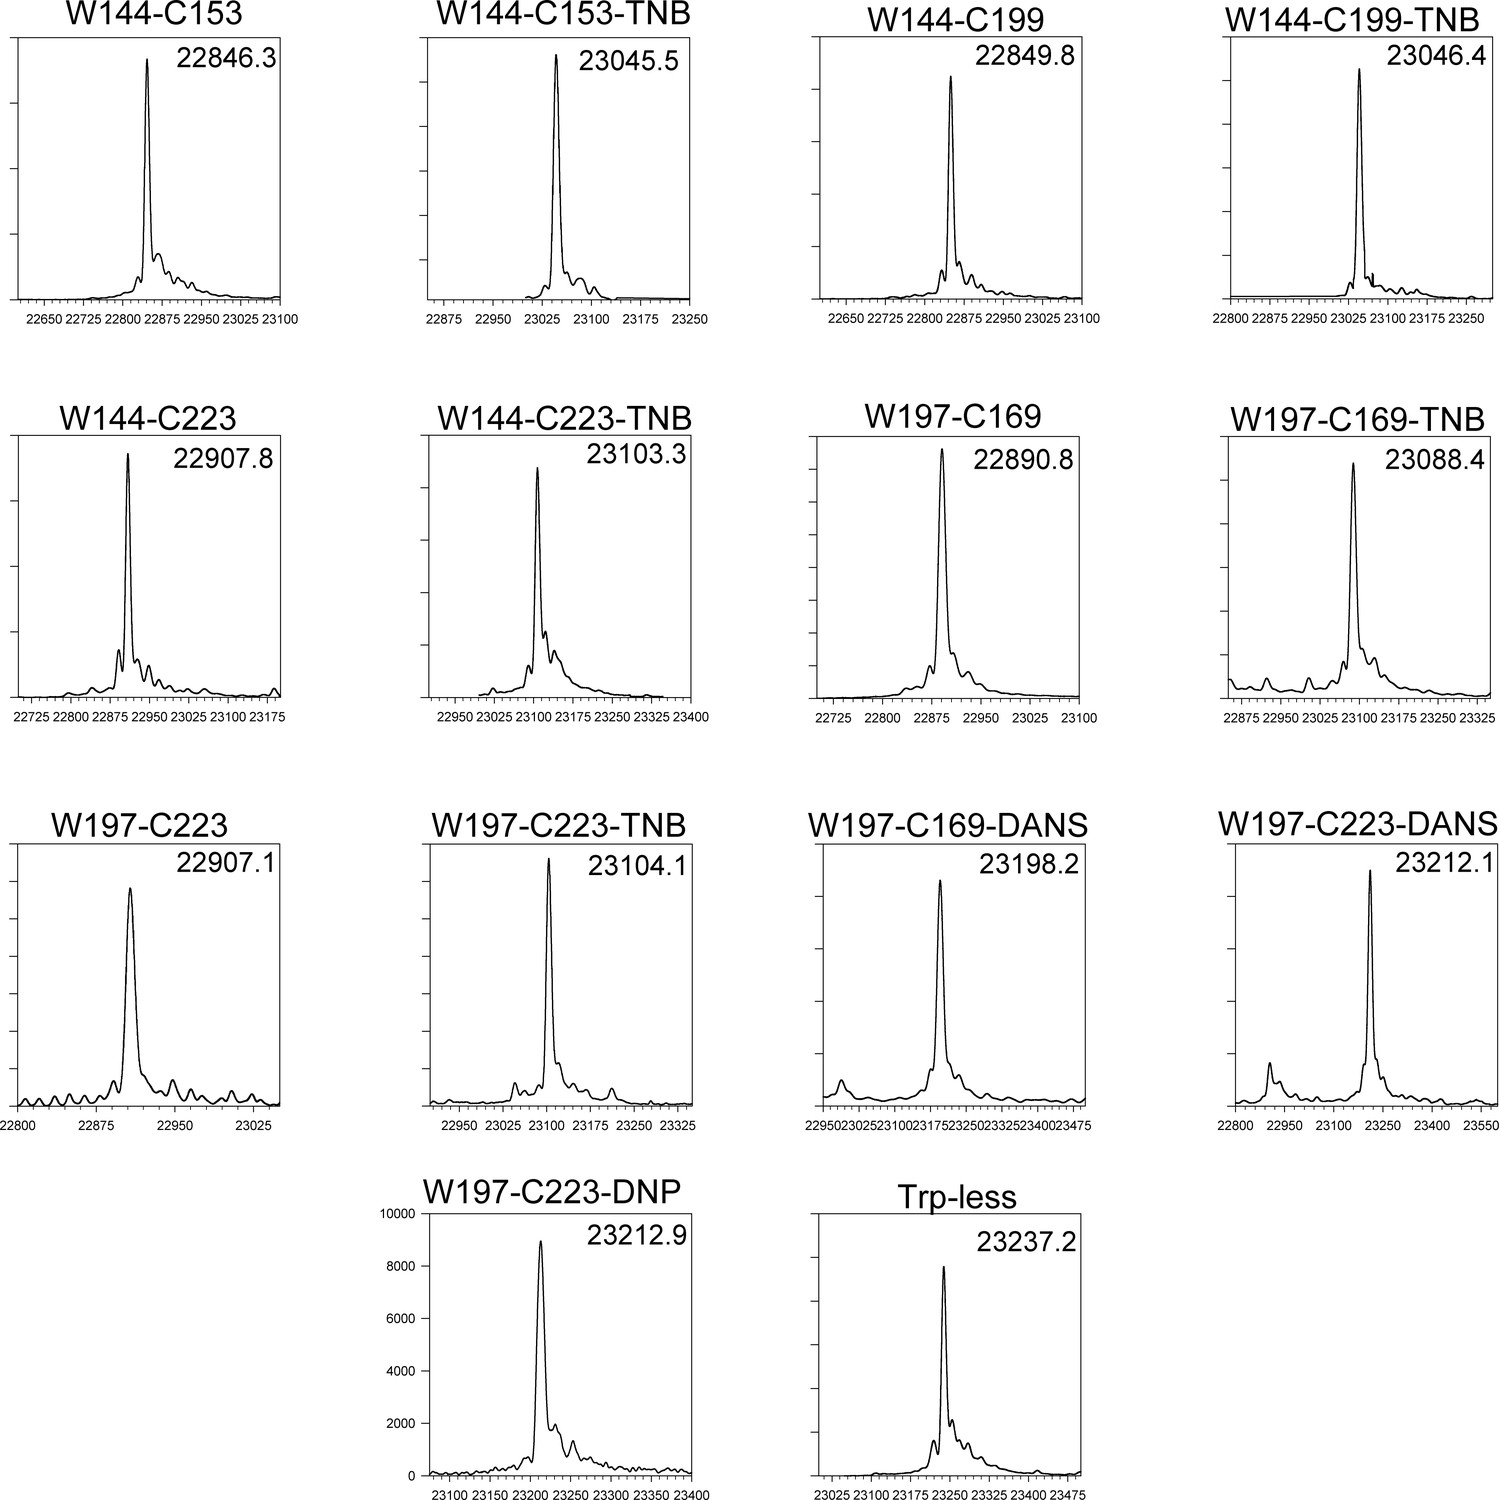
ESI-MS spectra of all unlabelled and labelled mutant variants.
All proteins have the native disulfide bond between residues C178 and C213 intact. All proteins (except W197-C223-DANS) are >95% labelled, with one adduct per molecule.
Figure 1—figure supplement 2

Thermodynamic stability and far-UV CD monitored misfolding kinetics of Trp-less and labelled and unlabelled single Trp, single Cys-containing mutant variants of moPrP.
(A) Far-UV CD spectra of monomeric (solid line) and oligomeric (dashed line) of WT, Trp-less, unlabelled, TNB and DANS-labelled single Trp, single Cys-containing mutant variants of moPrP. The secondary structure for all mutant variants in both the monomeric and oligomeric forms are comparable to that of WT moPrP. (B) Urea-induced equilibrium unfolding transitions of WT, Trp-less, unlabelled, TNB and DANS-labelled single Trp, single Cys-containing mutant variants of moPrP at pH 4, 25°C as monitored by far-UV CD at 222 nm. (C) DLS measurements of WT and Trp-less moPrP oligomers formed at pH 4 in the presence of 150 mM NaCl. The Rh of the oligomers were ~11 and~13 nm for Trp-less and WT moPrP, respectively. (D) Misfolding of 100 µM single Trp, single Cys-containing mutant variants of moPrP at pH 4 in the presence of 150 mM NaCl as monitored by measuring the far-UV CD signal at 228 nm. The Trp-less mutant variant misfolds slower than all other variants. All unlabelled single Trp, single Cys-containing mutant variants, with the exception of W197-C169 oligomerize with rate constants comparable to that of WT moPrP. All TNB-labelled proteins, other than W144-C153-TNB, misfolds 4–5 fold faster than their unlabelled counterparts. W197-C169-DANS and W197-C223-DANS misfold 2–3 fold faster than their TNB-labelled counterparts.
Figure 2
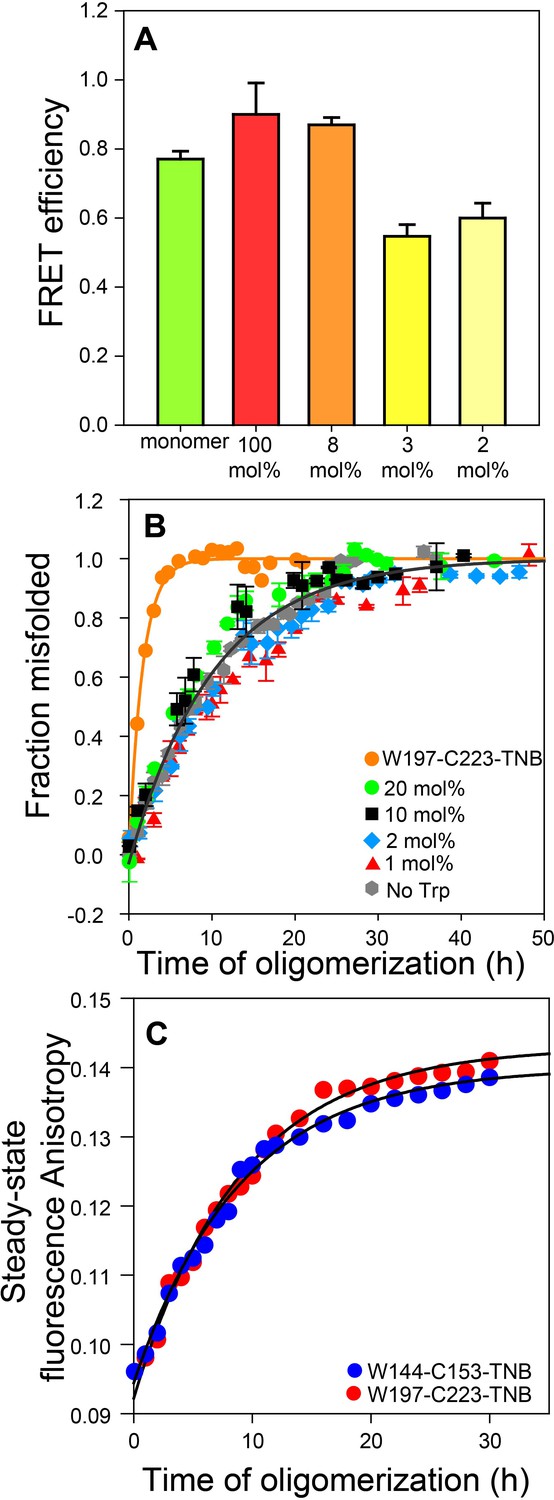
Co-oligomerization with Trp-less moPrP suppresses inter-molecular FRET but does not alter the global misfolding kinetics significantly.
(A) Co-oligomerization with Trp-less moPrP suppresses inter-molecular FRET between monomers. Oligomers prepared from solely (100%) unlabelled and TNB-labelled W144-C153 moPrP (dopant) exhibit the highest FRET efficiency (red). To effectively suppress inter-molecular FRET between monomers that is units in the oligomer, oligomers were prepared in the presence of increasing concentrations of Trp-less moPrP, resulting in decreasing dopant concentrations of 8 (orange), 3 (bright yellow) and 2 mol% (pale yellow), while keeping the total protein concentration fixed at 100 µM. The FRET efficiencies were comparable in the oligomers prepared from 3 and 2 mol% dopant concentrations, respectively, and significantly lower than that in the oligomers prepared from 100% dopant concentration. (B) Global misfolding kinetics of Trp-less moPrP, W197-C223-TNB and Trp-less moPrP doped with 1, 2, 10 and 20 mol% of W197-C223-TNB moPrP (dopant). Far-UV CD was the probe. The dopant by itself (orange) misfolds ~ 10 fold faster than Trp-less moPrP. The total protein concentration in each sample was 100 µM. Solid orange and gray lines represent the fit of the global misfolding data to single exponential kinetics for W197-C223-TNB and the Trp-less proteins, respectively. The misfolding rate constants are only marginally affected upon doping with increasing concentrations of the fast misfolding dopant. Error bars are standard deviation of the mean, determined from three independent measurements, from three separate samples. (C) Co-oligomerization of Trp-less moPrP with 2 mol% of W144-C153-TNB and W197-C223-TNB monitored by tryptophan steady-state fluorescence anisotropy.
-
Figure 2—source data 1
Raw data for Figure 2A–C.
- https://doi.org/10.7554/eLife.44698.006
Figure 3 with 1 supplement
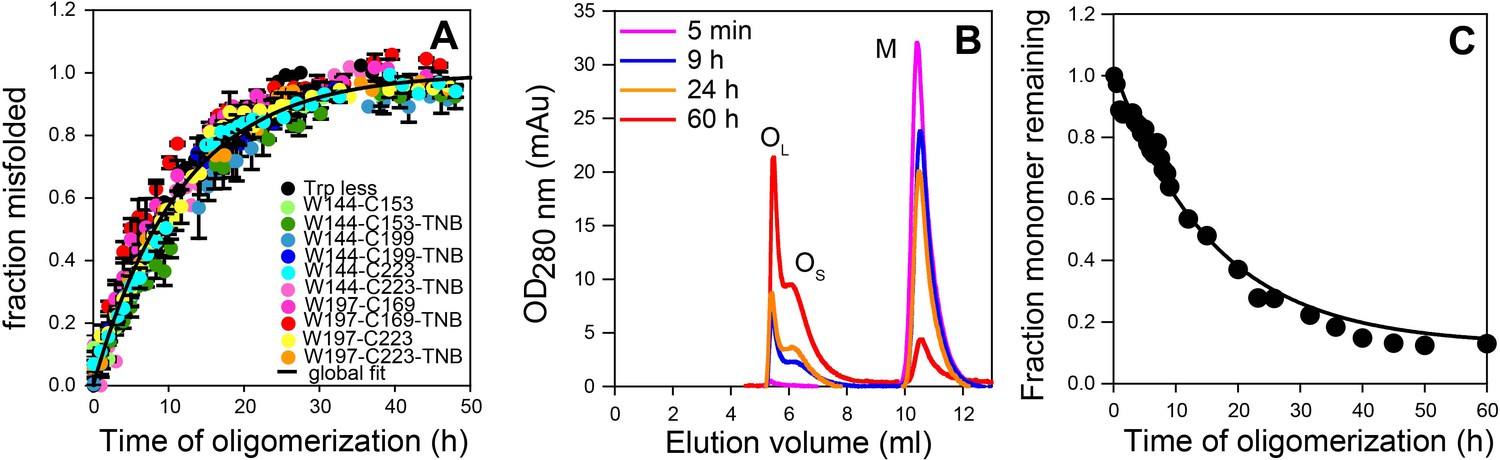
Global misfolding and oligomerization kinetics of Trp-less moPrP doped with 2 mol% of the unlabelled and TNB-labelled single Trp, single Cys-containing mutant variants of moPrP, monitored by CD and size-exclusion chromatography, respectively.
(A) None of the dopant proteins altered the global misfolding kinetics of Trp-less moPrP to a significant extent at the dopant concentrations used in these experiments. The total protein concentration was kept fixed at 100 µM in all experiments. Global misfolding was monitored using far-UV CD. Error bars are standard deviation of the mean, determined from three independent measurements, from three separate samples. The global misfolding rate, as determined from a single exponential fit of all the data was 0.09 ± 0.03 h−1. (B) Size-exclusion chromatograms at different time points of oligomerization of 100 µM Trp-less moPrP, showing the presence of oligomers OL, OS and monomer M. (C) Normalized monomer loss kinetics, estimated from (B). The black line through the data is shown as a guide to the eye.
-
Figure 3—source data 1
Raw data for Figure 3.
- https://doi.org/10.7554/eLife.44698.009
Figure 3—figure supplement 1
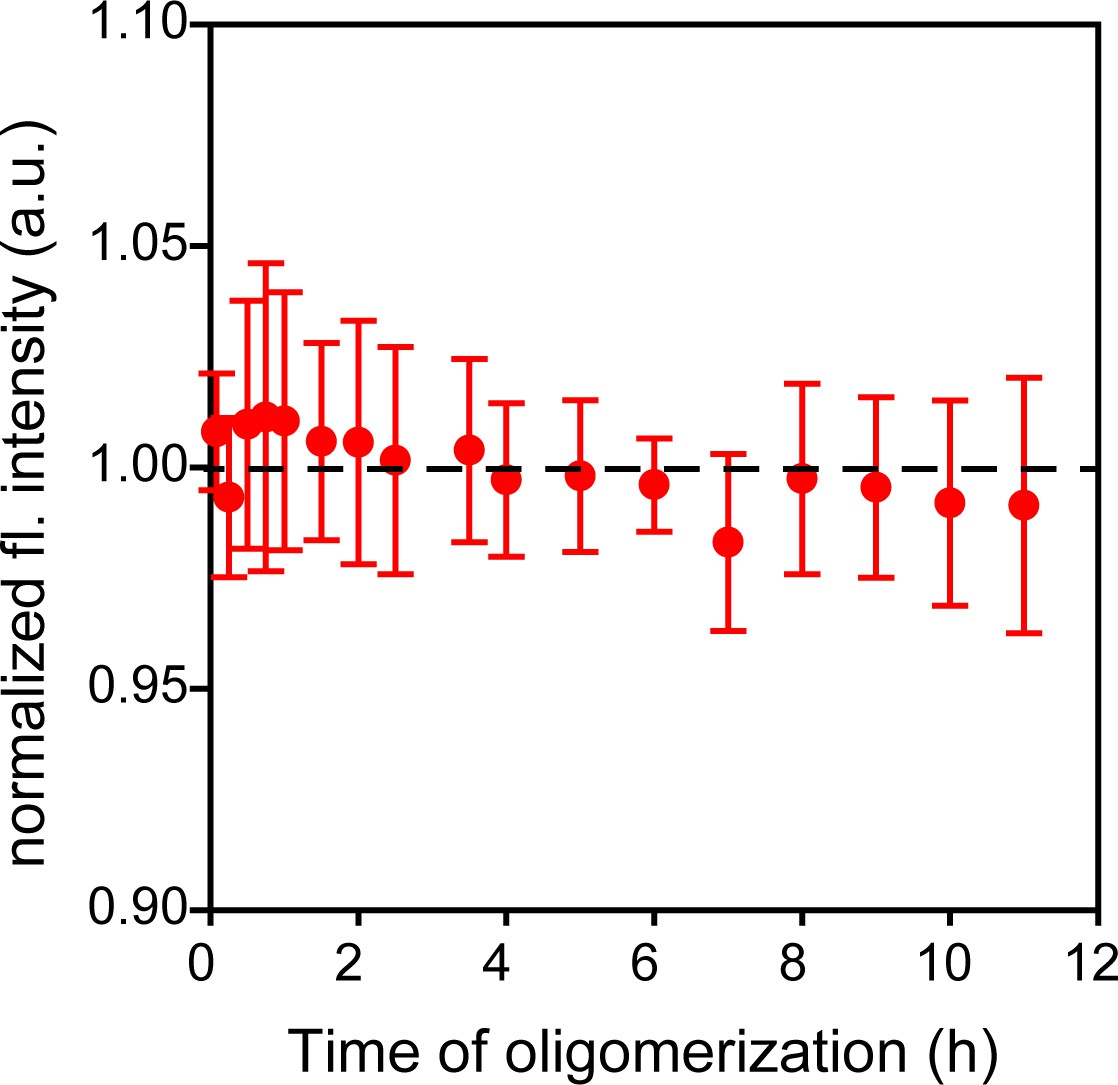
Trp-less moPrP shows a negligible change in fluorescence intensity upon oligomerization.
Oligomerization of 98 µM of Trp-less moPrP shows no change in fluorescence signal over a period of 12 hr. This indicated that the contribution of scatter to the fluorescence signal at this wavelength (340 nm) was negligible. The average fluorescence signal was subtracted from all experiments to account for the background signal of 98 µM Trp-less moPrP, present in all samples, for suppression of inter-molecular FRET. Similar background correction was also made for samples containing dopant at a 1:99 doping ratio. Error bars are standard deviation of the mean, determined from three independent measurements.
Figure 4 with 5 supplements
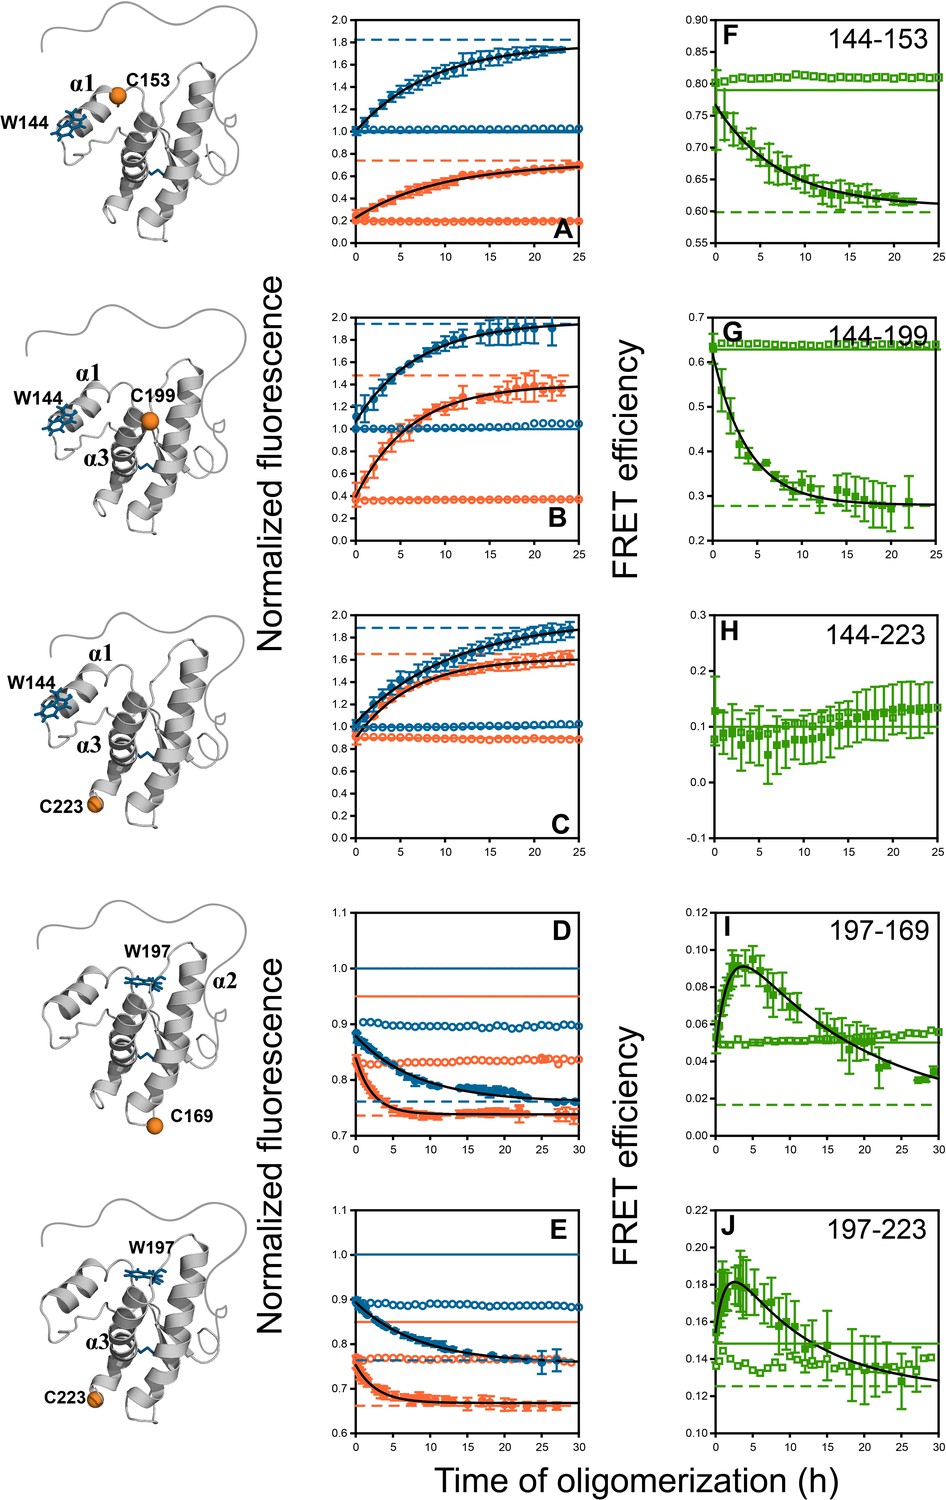
Monitoring misfolding by site-specific intra-molecular FRET.
Unlabelled (blue) and TNB-labelled (orange) single Trp, single Cys-containing mutant variants W144-C153, W144-C199, W144-C223, W197-C169 and W197-C223 (A–E) were either co-oligomerized separately with Trp-less moPrP at a dopant concentration of 2 mol% (filled symbols), or in its absence (empty symbols). The corresponding changes in tryptophan fluorescence emission were measured as a function of time. The tryptophan fluorescence signal for the monomeric unlabelled (blue) and TNB-labelled (orange) protein(s) are shown as solid lines, and the corresponding signals for the oligomeric protein(s) are shown as dashed lines. From both sets of data, the kinetics of FRET efficiency change for all five FRET pairs (F–J) was calculated (filled and empty green circles).The black lines through the data are a guide to the eye. The error bars in the fluorescence measurements are standard deviation of the mean, determined from four to five independent measurements, on separate samples. The error bars in the FRET efficiency were determined by propagating the errors in the fluorescence measurements.
-
Figure 4—source data 1
Raw data for Figure 4A–J.
- https://doi.org/10.7554/eLife.44698.016
Figure 4—figure supplement 1
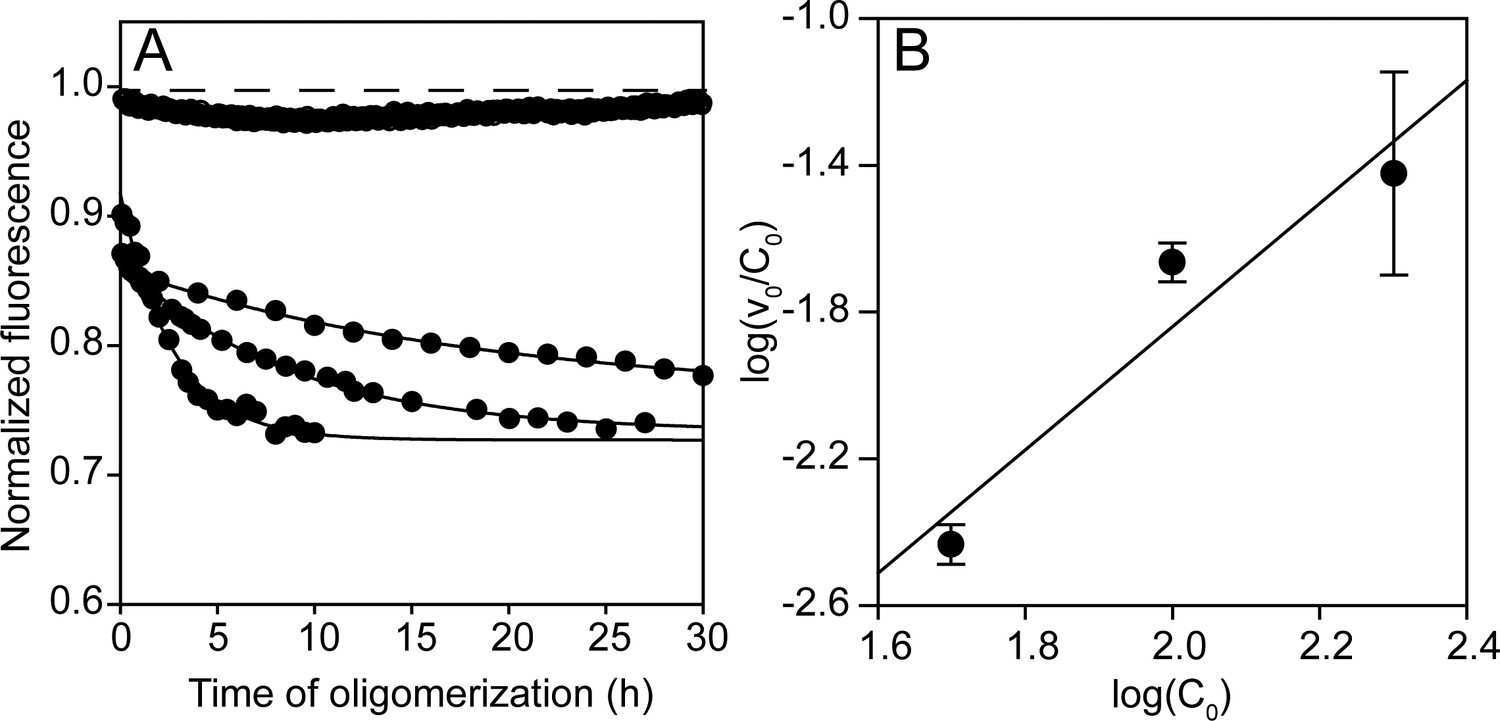
Concentration dependence of co-oligomerization monitored by fluorescence intensity.
(A) Co-oligomerization of 49, 98 and 196 µM Trp-less moPrP doped with 1, 2 and 4 µM of unlabelled W197-C223 moPrP, monitored by tryptophan fluorescence, such that the total protein concentration is 50, 100 and 200 µM, respectively, with a fixed dopant concentration of 2 mol%. In the absence of co-oligomerization, the signal remains fixed at 1, indicating the absence of photobleaching in these timescales. The characteristic times for the fluorescence changes for the three cases are ~33 hr, ~8 hr and ~3 hr, respectively. (B) The dependence of log (ν0/C0) (concentration normalized initial rate obtained from the linear regression of the initial 4–5 data points in (A) on log (C0). The slope, n-1 is 1.68, which matches very well with the value of 1.6, obtained previously from NMR measurements (Sengupta et al., 2017).
Figure 4—figure supplement 2
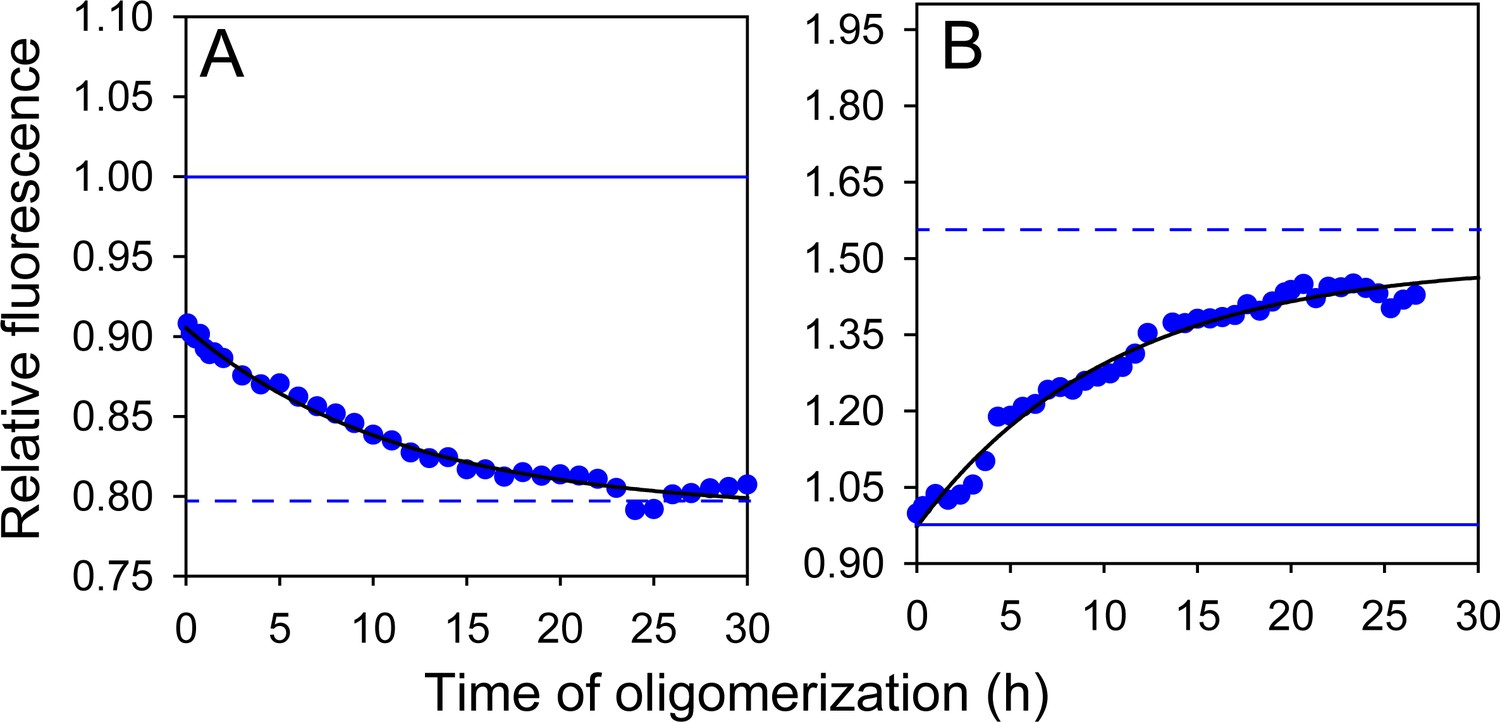
Effect of doping ratio on fluorescence-monitored kinetics of co-oligomerization.
Unlabelled (A) W197-C223 moPrP and (B) W144-C153 moPrP were co-oligomerized with Trp-less moPrP at a 1:99 doping ratio, while keeping total protein concentration fixed at 100 µM. Black solid lines are shown as a guide to the eye. The characteristic times for (A) and (B) were estimated to be ~10–11 hr.
Figure 4—figure supplement 3
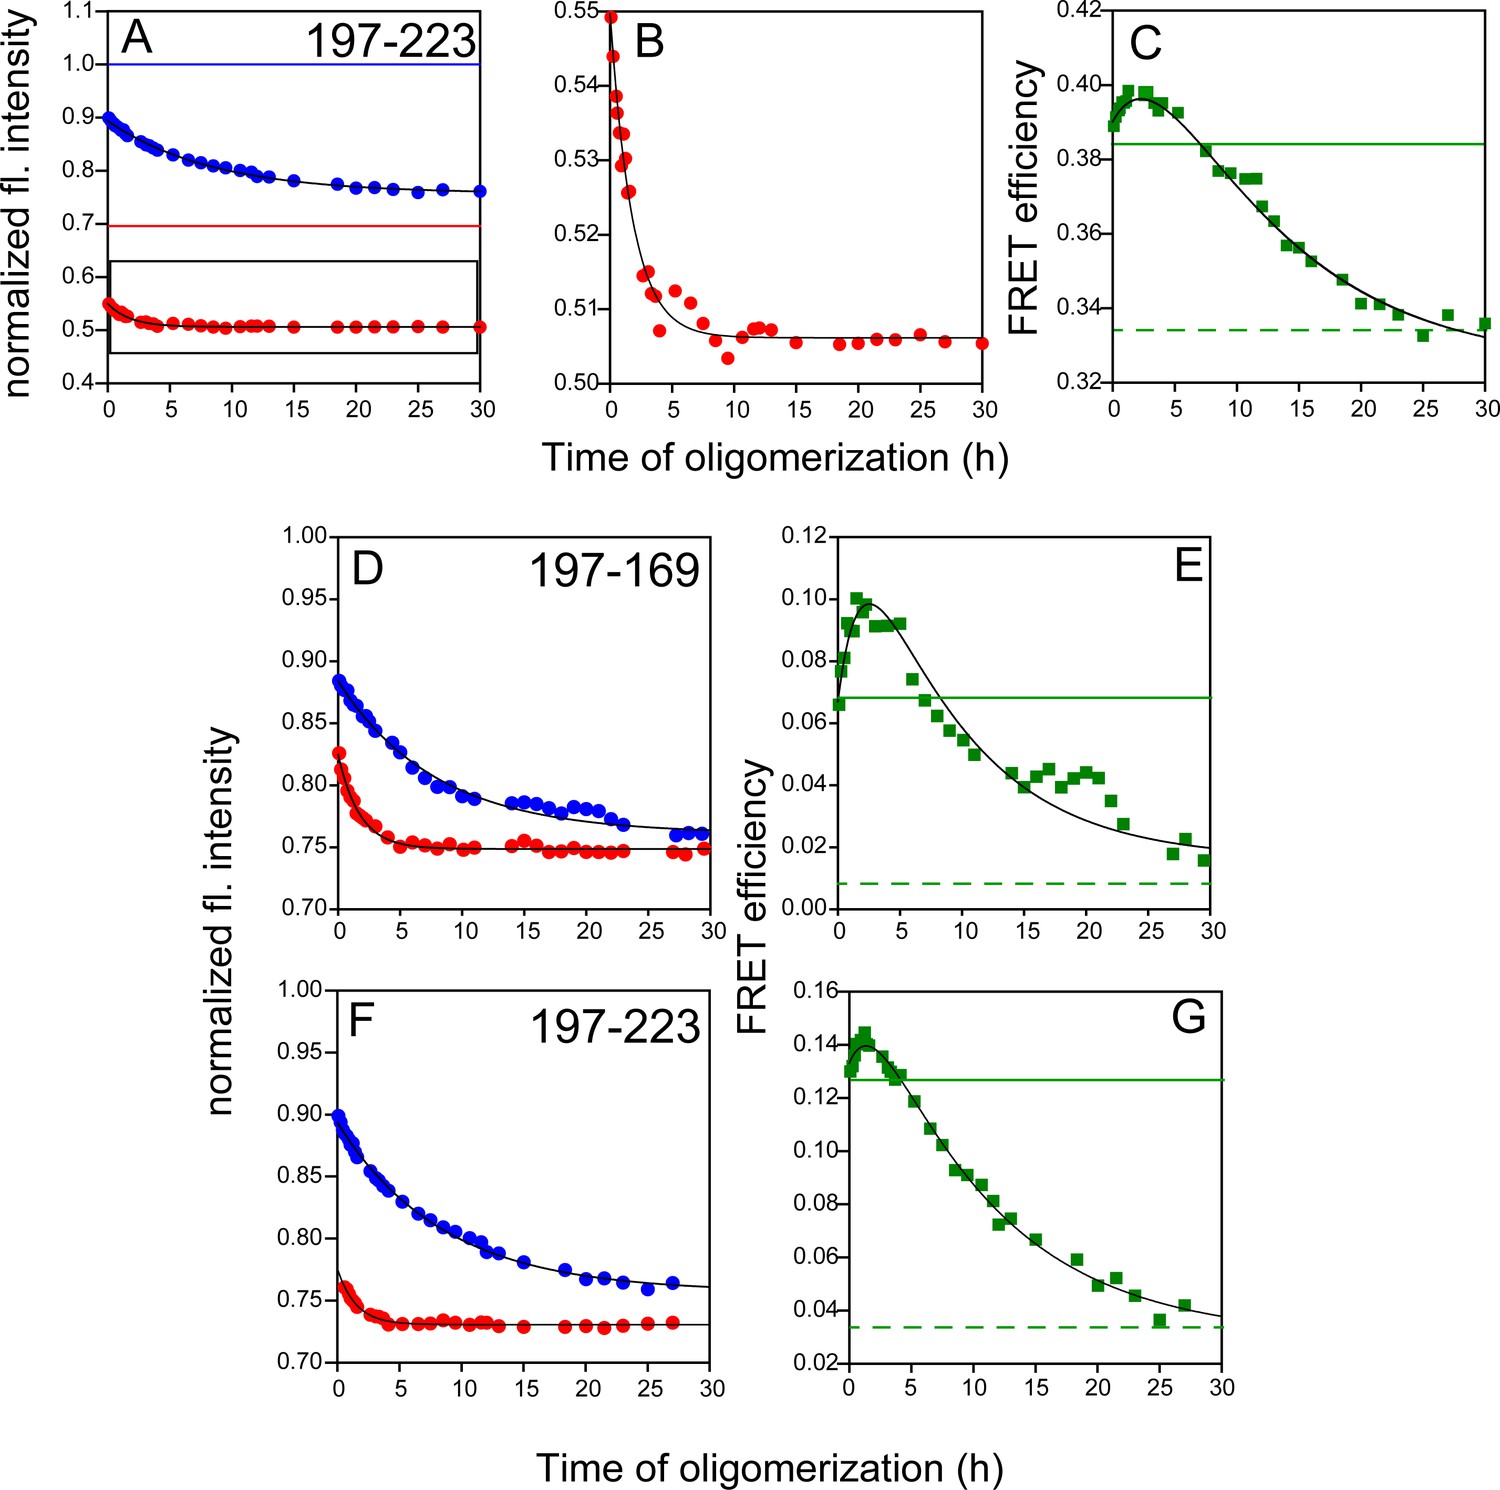
FRET monitored site-specific misfolding kinetics with W197-C223-DNP, W197-C169-DANS and W197-C223-DANS.
Unlabelled (blue) and labelled (red) DNP-C2 (A) or DANS-labelled (D and F) single Trp, single Cys-containing mutant variants of W197-C223 and W197-C169 (dopant) were co-oligomerized with Trp-less moPrP, at a dopant concentration of 2 mol%. The corresponding changes in tryptophan fluorescence emission were measured as a function of time. (B) DNP-C2-labelled W197-C223 moPrP (marked in black box in (A)), (D) W197-C169-DANS and (F) W197-C223-DANS also showed faster kinetics, similar to W197-C223-TNB (C) FRET-monitored misfolding kinetics for W197-C223 using the Trp-DNP FRET pair. (E) and (G) Same as (C) except the proteins were W197-C169-DANS and W197-C223-DANS, respectively. Black solid lines are shown as a guide to the eye. The characteristic times for (C), (E) and (G) were estimated to be 1.7 and 14.3 hr, 1.9 and 8.3 hr, 1.9 and 10.0 hr, respectively.
Figure 4—figure supplement 4

Time-resolved fluorescence anisotropy measurements to estimate κ2.
For W197-containing mutant variants in both monomeric and oligomeric forms, two rotational correlation times were observed for both donor tryptophan and acceptor 1,5-IAEDANS (Supplementary file 5). The black dashed lines correspond to the measured fundamental anisotropies of 0.4 and 0.36, respectively, for donor tryptophan and acceptor 1,5-IAEDANS determined from time-resolved anisotropy measurements of free dyes NATA (N-Acetyl-L-tryptophanamide) and 1,5-IAEDANS in 70% glycerol. The significant amplitudes of the fast components suggest that both donor and acceptor are freely rotating and a κ2 = 2/3 can be assumed (See Appendix 1 and Supplementary file 5).
Figure 4—figure supplement 5
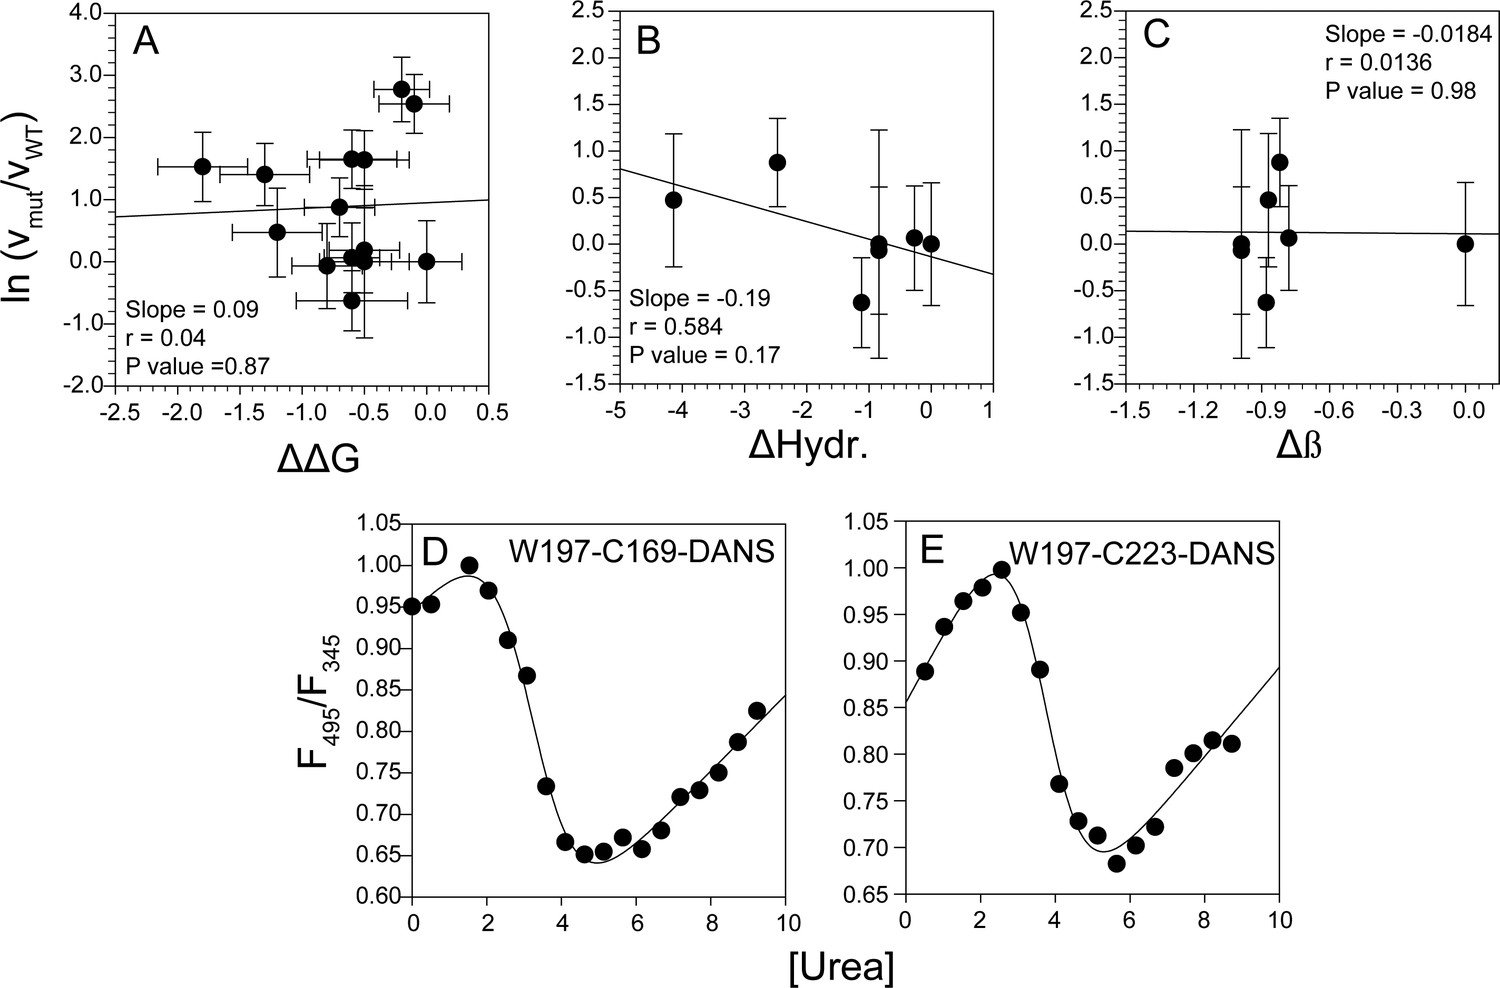
Correlation analysis of global misfolding rates with thermodynamic stability and intrinsic physico-chemical properties, and measurement of local stability by FRET ratio and co-oligomerization kinetics by steady-state anisotropy.
No significant correlation was found between the global misfolding rate constant of the mutant variants with change in thermodynamic stability (A), change in hydrophobicity (B) and change in β-sheet propensity (C). The local stabilities monitored by FRET ratio for W197-C169-DANS (D) and W197-C223-DANS (E) mutant variants were comparable to those obtained from HX-MS and HX-NMR measurements of WT moPrP (see Appendix 1).
Figure 5
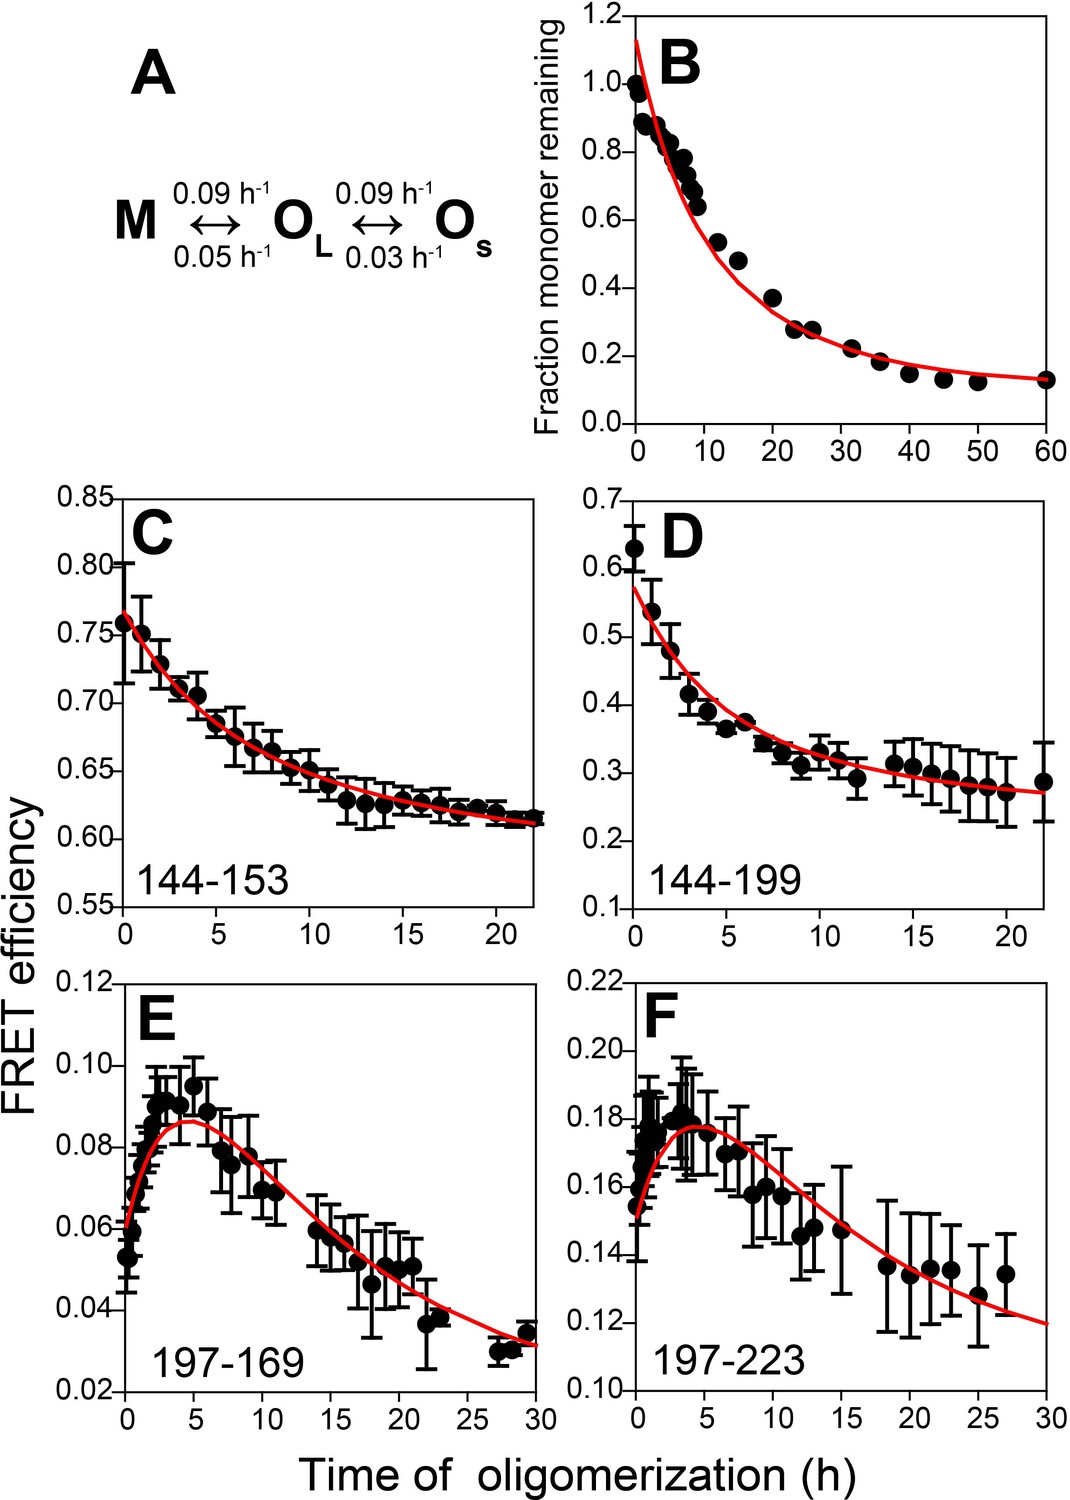
Kinetic model for misfolded oligomer formation of moPrP at pH 4 in the presence of 150 mM NaCl.
(A) OL forms reversibly from M with forward and backward rate constants of 0.09 ± 0.02 and 0.05 ± 0.01 h−1, respectively, and subsequently reversibly dissassembles to form OS with forward and backward rate constants of 0.09 ± 0.03 and 0.03 ± 0.01 h−1, respectively. (B) Normalized monomer loss kinetics accompanying oligomerization of 100 µM Trp-less moPrP. The red line through the data is the fit of the experimental data to the model in (A). (C-F) Site-specific misfolding kinetics monitored by FRET efficiency as described in Figure 4. The red line through the data is the fit of the experimental data to the model in (A). The FRET efficiencies of M, OL and OS for each sequence segment, as estimated from the global fitting routine are tabulated in Table 2.
Figure 6
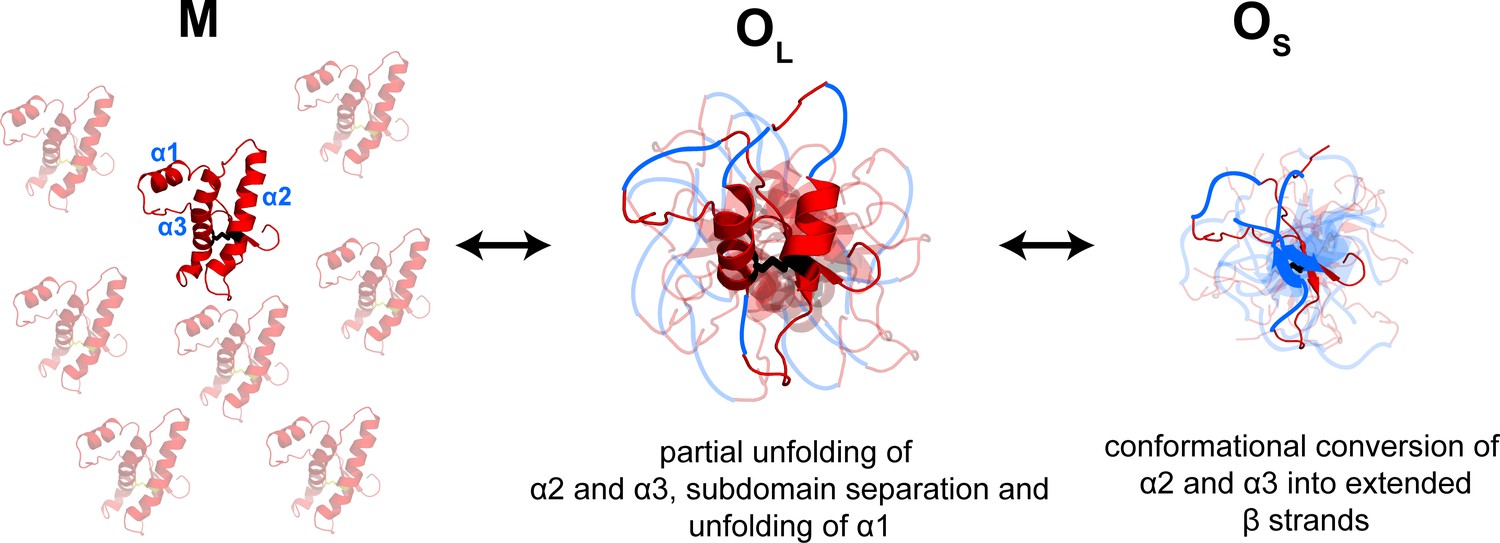
Model depicting the site-specific misfolding moPrP at during the course of oligomer formation at pH 4.
The sequence segments spanning the α2 and α3 helices undergo a compaction as monomers convert reversibly to large oligomers, OL. As oligomers OL disassemble reversibly to form small oligomers, OS, the compact sequence segments spanning the erstwhile α2 and α3 helices elongate into extended β-strands. The α1-β1-β2 and α2-α3 subdomains are separated, and α1 is unfolded in both OL and OS, but to variable extents. The NTR region is not shown for clarity. The disulphide bond is shown as black sticks. The transparent subunits in the growing oligomer represent the co-oligomerizing Trp-less moPrP which does not contribute to the FRET signal at any time during the oligomerization reaction. The figure is not drawn to scale.
Tables
Table 1
Summary of the characteristic times of misfolding/oligomerization monitored by far-UV CD, tryptophan fluorescence and site-specific intra-molecular FRET
https://doi.org/10.7554/eLife.44698.017| Dopant protein | Characteristic time of fluorescence change (h) | Characteristic time of FRET change (h) |
|---|---|---|
| W144-C153 | 8.3 ± 1.3 | 7.1 ± 0.1 |
| W144-C153-TNB | 10.0 ± 1.0 | |
| W144-C199 | 6.7 ± 2.7 | 3.3 ± 0.7 |
| W144-C199-TNB | 6.3 ± 0.8 | |
| W144-C223 | 10.0 ± 1.0 | Not determinable |
| W144-C223-TNB | 5.9 ± 1.7 | |
| W197-C169 | 8.3 ± 0.7 | 1.7 ± 0.2, 16.7 ± 2.8 |
| W197-C169-TNB | 2.3 ± 0.1 | |
| W197-C223 | 8.3 ± 2.1 | 1.4 ± 0.3, 11.1 ± 2.5 |
| W197-C223-TNB | 2.9 ± 0.1 | |
| CD monitored misfolding* | 11.1 ± 3.7 | - |
-
*The characteristic time of the CD monitored misfolding was obtained by global fitting all the data in Figure 3A. Characteristic times were determined for a mixture of 2 mol% dopant protein and 98 mol% Trp-less moPrP. Error bars are standard deviation of the mean, determined from three to five independent measurements, on separate samples.
Table 2
Summary of the FRET efficiencies of M, OL and OS obtained from global fitting of FRET data.
https://doi.org/10.7554/eLife.44698.019| Sequence segment | FRET efficiency (M) | FRET efficiency (OL) | FRET efficiency (OS) |
|---|---|---|---|
| 144–153 | 0.77 ± 0.01 | 0.50 ± 0.03 | 0.59 ± 0.02 |
| 144–199 | 0.57 ± 0.01 | 1e-7±1e-13 | 0.28 ± 0.03 |
| 197–169 | 0.07 ± 0.01 | 0.16 ± 0.01 | 1e-20 (constrained) |
| 197–223 | 0.17 ± 0.01 | 0.21 ± 0.02 | 0.06 ± 0.02 |
-
*The FRET efficiencies were obtained by global fitting the data from Figure 4. The FRET efficiencies of M, OL and OS was allowed to vary locally in each case, except in the case of sequence segment 197–169, where the FRET efficiency of OS had to be constrained to a low value of 1e-20 for an acceptable fit to the data. Errors in the FRET efficiency are standard errors from the fitting routine.
Key resources table
| Reagent type (species) or resource | Designation | Source or reference | Identifiers | Additional information |
|---|---|---|---|---|
| Recombinant DNA reagent | Trp-less-moPrP (pET22b vector) | https://doi.org/10.1016/j.pep.2017.07.014 | NA | Novagen-Sigma Aldrich |
| Recombinant DNA reagent | W144-C153-moPrP (pET 22b vector) | https://doi.org/10.1016/j.pep.2017.07.014 | NA | Novagen-Sigma Aldrich |
| Recombinant DNA reagent | W144-C199-moPrP (pET22b vector) | https://doi.org/10.1016/j.pep.2017.07.014 | NA | Novagen-Sigma Aldrich |
| Recombinant DNA reagent | W144-C223-moPrP (pET22b vector) | https://doi.org/10.1016/j.pep.2017.07.014 | NA | Novagen-Sigma Aldrich |
| Recombinant DNA reagent | W197-C169-moPrP (pET22b vector) | https://doi.org/10.1016/j.pep.2017.07.014 | NA | Novagen-Sigma Aldrich |
| Recombinant DNA reagent | W197-C223-moPrP (pET22b vector) | https://doi.org/10.1016/j.pep.2017.07.014 | NA | Novagen-Sigma Aldrich |
| Peptide, recombinant protein | Trp-less-moPrP | https://doi.org/10.1016/j.pep.2017.07.014 | NA | |
| Peptide, recombinant protein | W144-C153-moPrP | https://doi.org/10.1016/j.pep.2017.07.014 | NA | |
| Peptide, recombinant protein | W144-C199-moPrP | https://doi.org/10.1016/j.pep.2017.07.014 | NA | |
| Peptide, recombinant protein | W144-C223-moPrP | https://doi.org/10.1016/j.pep.2017.07.014 | NA | |
| Peptide, recombinant protein | W197-C169-moPrP | https://doi.org/10.1016/j.pep.2017.07.014 | NA | |
| Peptide, recombinant protein | W197-C223-moPrP | https://doi.org/10.1016/j.pep.2017.07.014 | NA | |
| Software, algorithm | DynaFit | https://doi.org/10.1006/abio.1996.0238 | NA |
Additional files
-
Supplementary file 1
Parameters used for the estimation of FRET efficiency in monomeric moPrP mutant variants.
- https://doi.org/10.7554/eLife.44698.021
-
Supplementary file 2
Thermodynamic parameters obtained from urea-induced equilibrium unfolding of different moPrP variants at pH 4 and their misfolding rate constants monitored by far-UV CD at 228 nm, for 100 µM protein.
- https://doi.org/10.7554/eLife.44698.022
-
Supplementary file 3
Misfolding rate constants for Trp-less moPrP alone, 197–223-TNB alone and Trp-less moPrP doped with 1 mol %, 2 mol %, 10 mol % and 20 mol % of 197–223-TNB, monitored by far-UV CD at 228 nm.
The total protein concentration in each case was 100 µM.
- https://doi.org/10.7554/eLife.44698.023
-
Supplementary file 4
Apparent rate constant of co-oligomerization monitored by steady-state tryptophan fluorescence anisotropy at different dopant concentrations.
- https://doi.org/10.7554/eLife.44698.024
-
Supplementary file 5
Rotational correlation times, amplitudes and fundamental anisotropy r(0) values derived from fitting the time-resolved anisotropy data of 1,5-IAEDANS-labelled W197-containing mutant variants in the monomeric and oligomeric forms.
- https://doi.org/10.7554/eLife.44698.025
-
Transparent reporting form
- https://doi.org/10.7554/eLife.44698.026
Download links
A two-part list of links to download the article, or parts of the article, in various formats.
Downloads (link to download the article as PDF)
Open citations (links to open the citations from this article in various online reference manager services)
Cite this article (links to download the citations from this article in formats compatible with various reference manager tools)
Monitoring site-specific conformational changes in real-time reveals a misfolding mechanism of the prion protein
eLife 8:e44698.
https://doi.org/10.7554/eLife.44698


