Mechanically activated piezo channels modulate outflow tract valve development through the Yap1 and Klf2-Notch signaling axis
- Institut de Génétique et de Biologie Moléculaire et Cellulaire, France
- Centre National de la Recherche Scientifique, France
- Institut National de la Santé et de la Recherche Médicale, France
- Université de Strasbourg, France
Figures
Figure 1
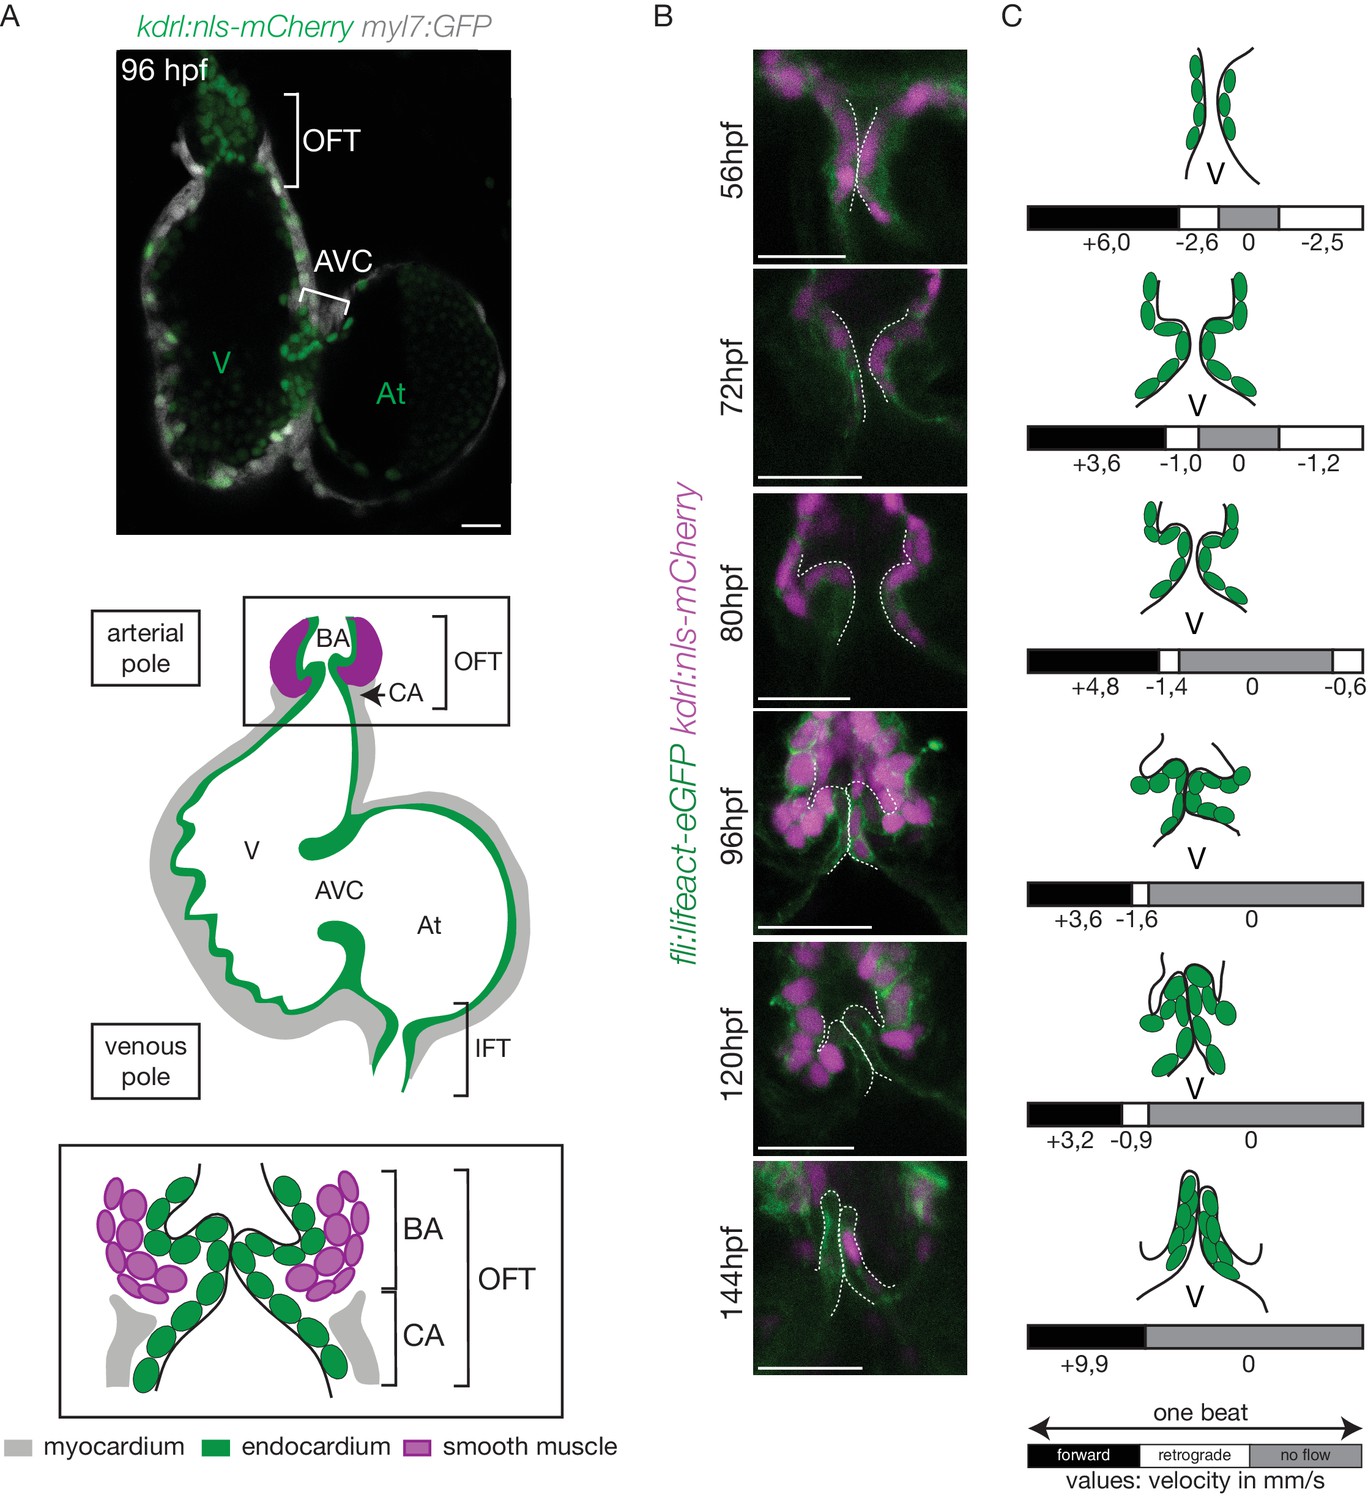
The OFT develops from 56 hpf to form functional valves at 144 hpf.
(A) Top: Z-section of the double transgenic line Tg(kdrl:nls-mCherry; myl7:GFP) showing the overall structure of the heart. Bottom: Scheme of the zebrafish heart with the endocardium, myocardium and smooth muscles and zoom on the OFT structure. The OFT includes the CA and the BA. The CA is the zone of the myocardial connection of the ventricle to the BA. The BA is after the ventricle and is surrounded by smooth muscles. Scheme adapted from Felker et al. (2018). OFT: outflow tract, IFT: inflow tract, AVC: atrioventricular canal, At: atrium, V: ventricle, BA: bulbus arteriosus, CA: conus arteriosus. Scale bar: 20 µm. (B) Z-sections of the double transgenic line Tg(fli:lifeact-EGFP; kdrl:nls-mCherry) at different time-points showing the endocardial OFT structure. Scale bar: 25 µm. (C) Schematic representation summarizing the formation of the valve leaflets over time and flow profile in the OFT during development (from 56 hpf to 144 hpf) showing the forward flow (black), retrograde flow (white) and no flow (grey) fractions with the velocity of the red blood cells (in mm/s) using the double transgenic line Tg(gata1:ds-red; kdrl:EGFP). V: ventricle.
Figure 2 with 1 supplement
The endothelium contribution to emerging OFT valve leaflets.
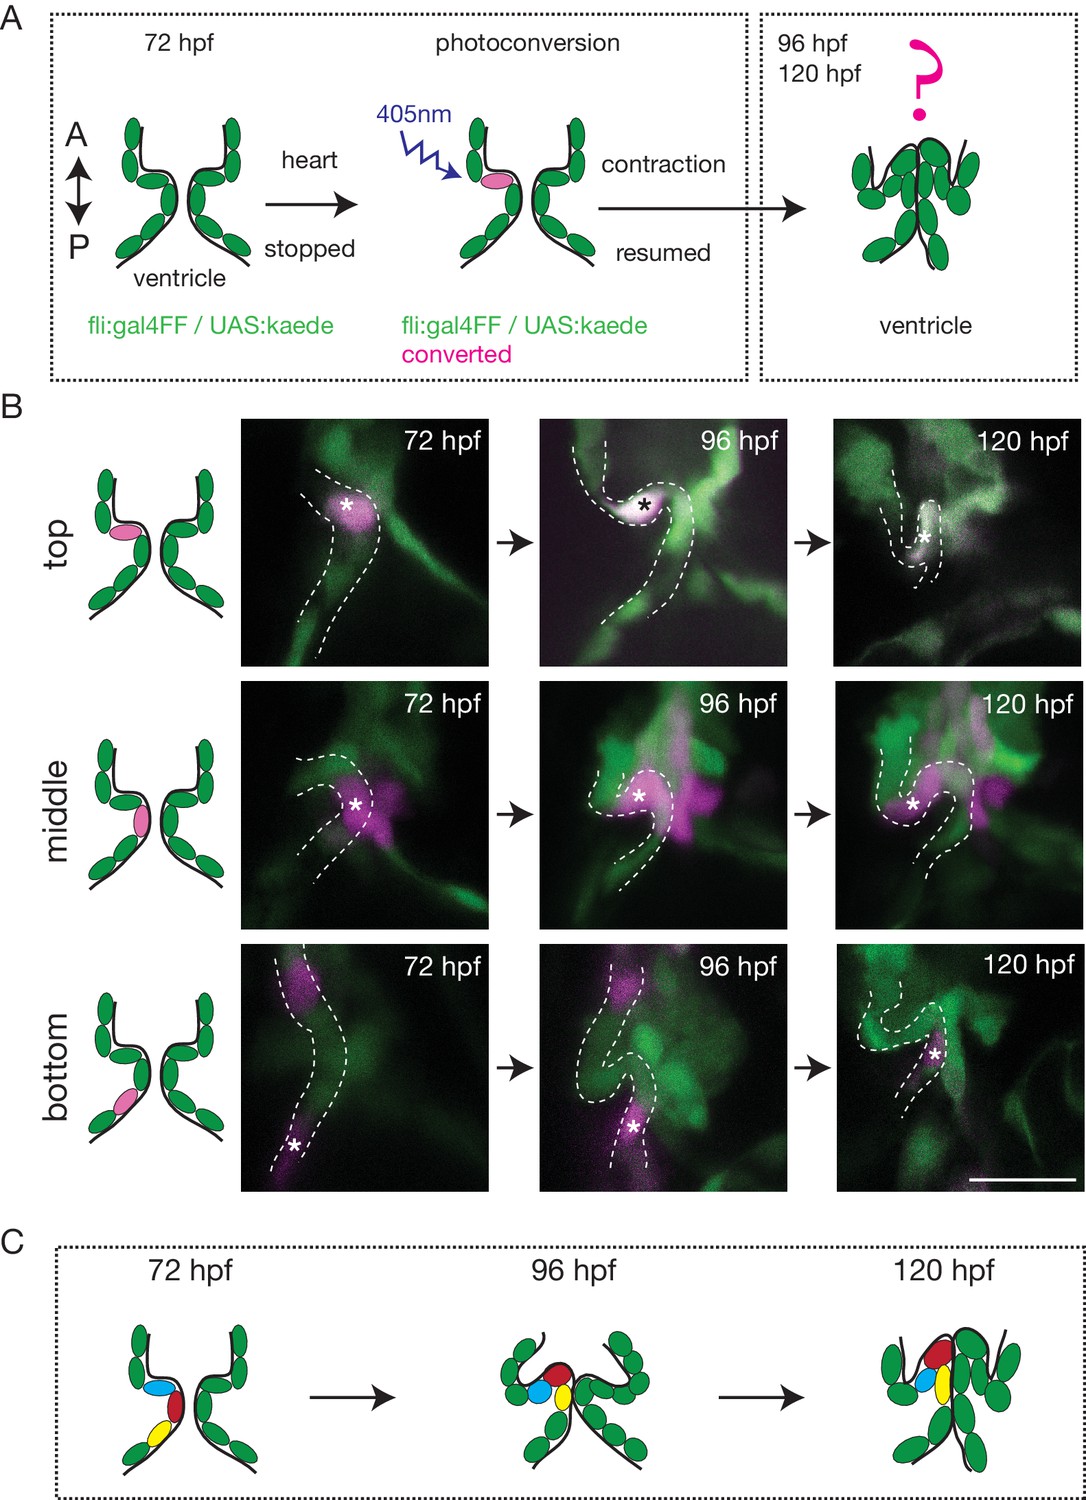
(A) Experimental set-up for the photoconversion studies. Heart was stopped at 72 hpf, the region of interest exposed to 405 nm light to convert kaede from green to red (shown in magenta) fluorescent form and heart contraction was resumed until 120 hpf. Beating hearts were imaged at 96 hpf and 120 hpf by spinning disk microscopy. A. Anterior, P. Posterior. (B) Z-sections of the Tg(fli:gal4FF; UAS:Kaede) line just after photoconversion (72 hpf), and at 96 hpf and 120 hpf. The star highlights the photoconverted cell in the top (n = 6), middle (n = 5) and bottom (n = 4) part of the OFT valve. The other photoconverted cell anteriorly goes out of the frame. Scale bar: 20 µm. Results obtained from three independent experiments. (C) Schematic representation of the results of the photoconversion studies showing the folding of the endothelium in the OFT.
Figure 2—figure supplement 1
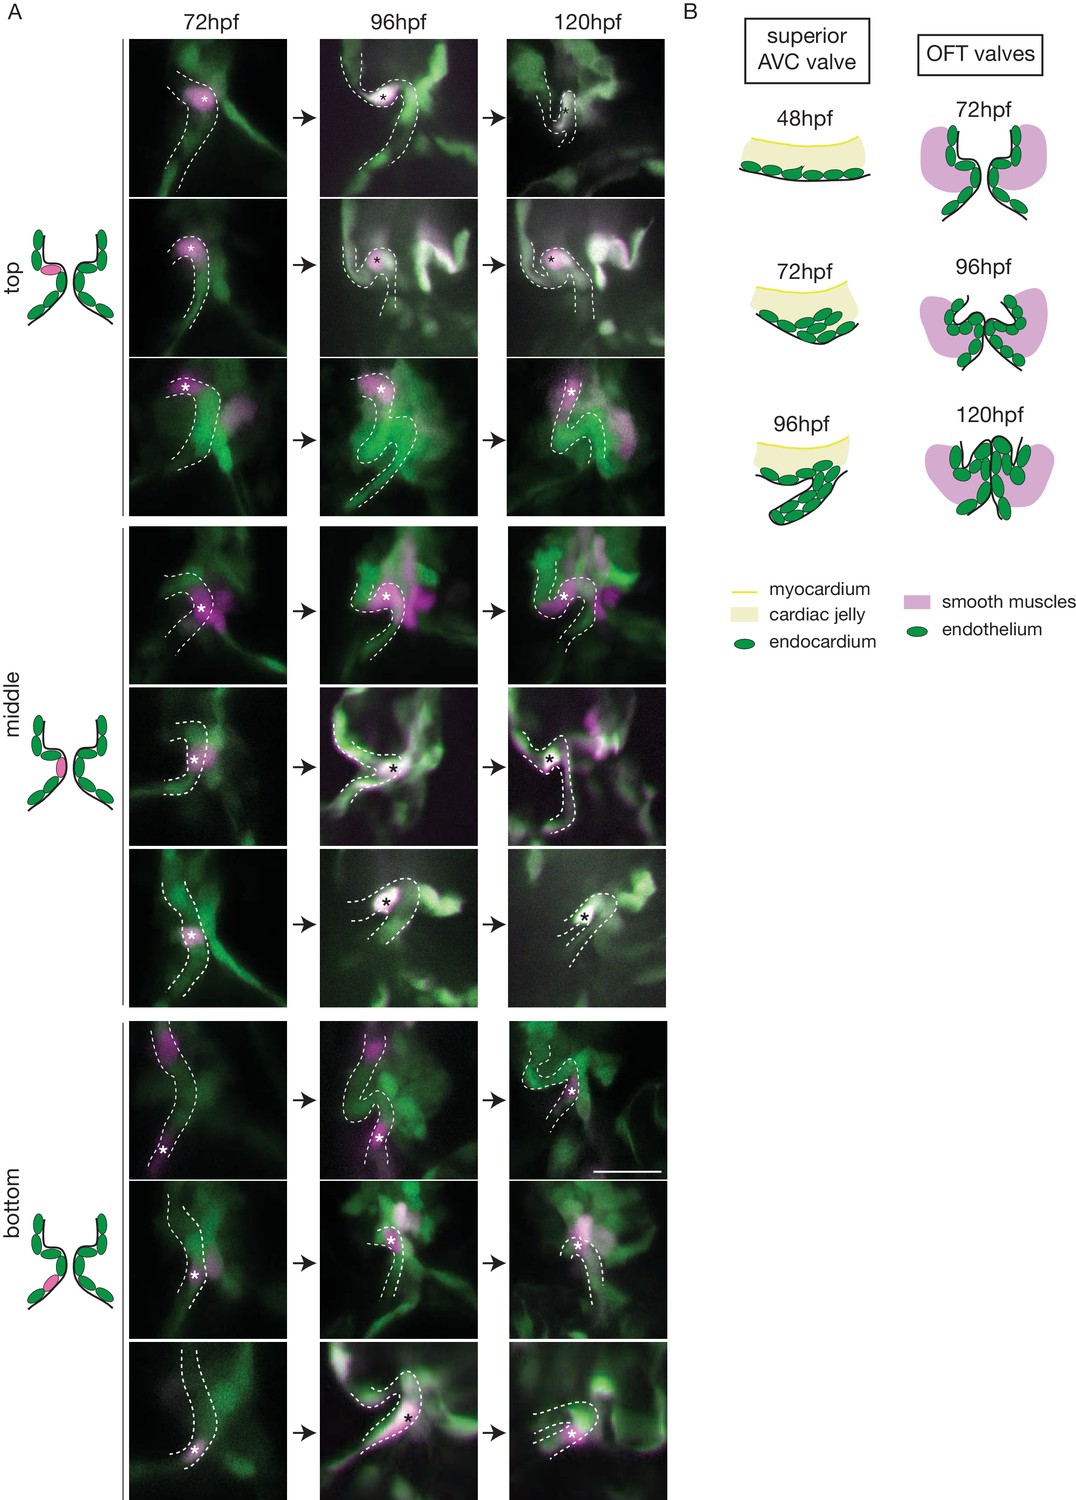
The endothelium contribution to emerging OFT versus AVC valves.
(A) Z-sections of the Tg(fli:gal4FF/UAS:Kaede) line just after photoconversion (72 hpf), and at 96 hpf and 120 hpf. The star highlights the photoconverted cell in the top, middle and bottom part of the OFT valve. (B) Comparison of the valve leaflet formation in the AVC and OFT. Delamination occurs in the AVC from 48hpf whereas only folding is observed in the OFT. Results obtained from three independent experiments.
Figure 3 with 1 supplement
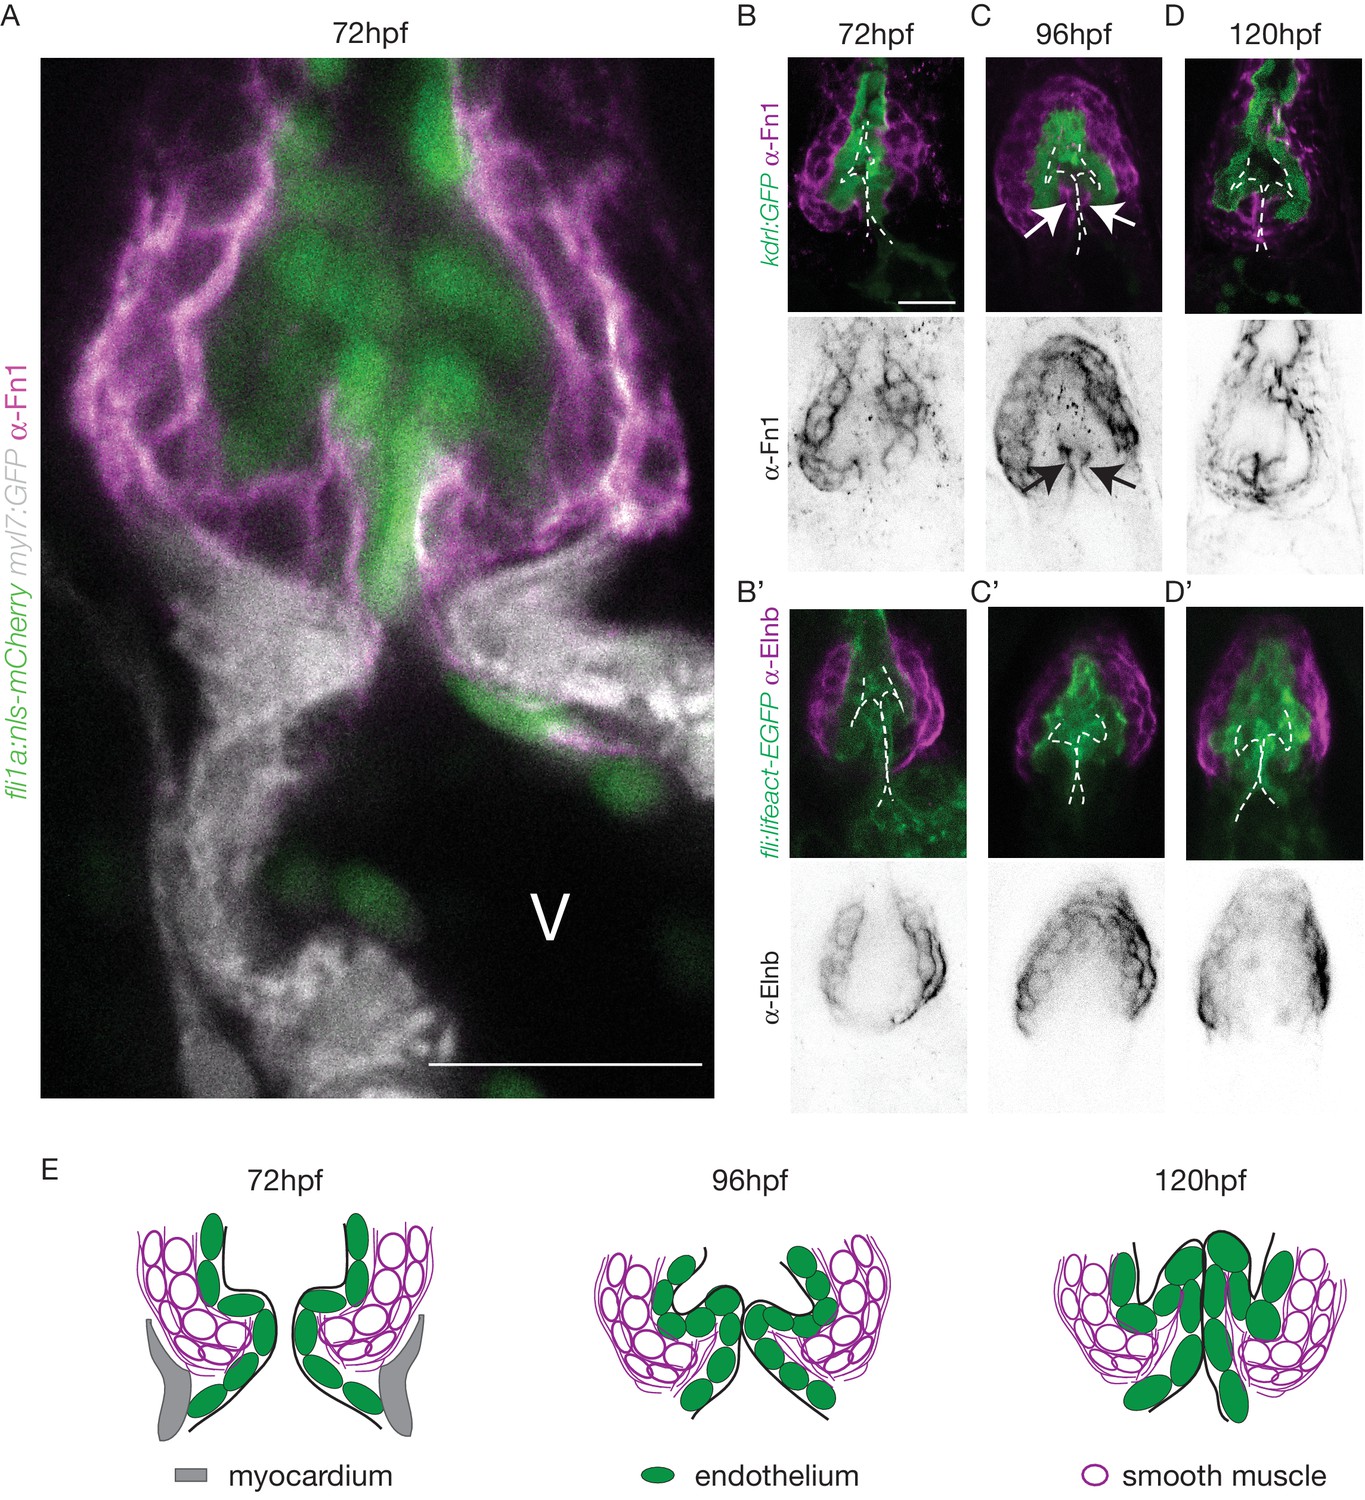
The OFT endothelium is surrounded by smooth muscle cell progenitors expressing fibronectin and elastin.
(A) Staining of Fibronectin1 (magenta) on Tg(myl7:GFP; fli1a:nls-mCherry), highlighting the myocardium (white) and the endothelium (green) at 72 hpf. Scale bar: 20 μm. V: ventricle. Fibronectin1 (anti-Fn1, magenta) counterstaining on Tg(kdrl:GFP) and Elastinb (anti-Elnb, magenta) counterstaining on Tg(fli:lifeact-EGFP) showing their expressions in the OFT at 72 hpf (B), (B’) respectively) at 96 hpf (C), (C’) respectively) and at 120 hpf (D, D’ respectively). Scale bar: 20 µm. Arrows show the Fn1 localisation within the valve leaflets. Results obtained from three independent experiments. (E) Scheme of the three layers shown in A’, B, C and D (magenta, smooth muscles; green, endothelium; grey, myocardium; Fibronectin1, magenta lines) at 72hpf, 96hpf and 120hpf.
Figure 3—figure supplement 1
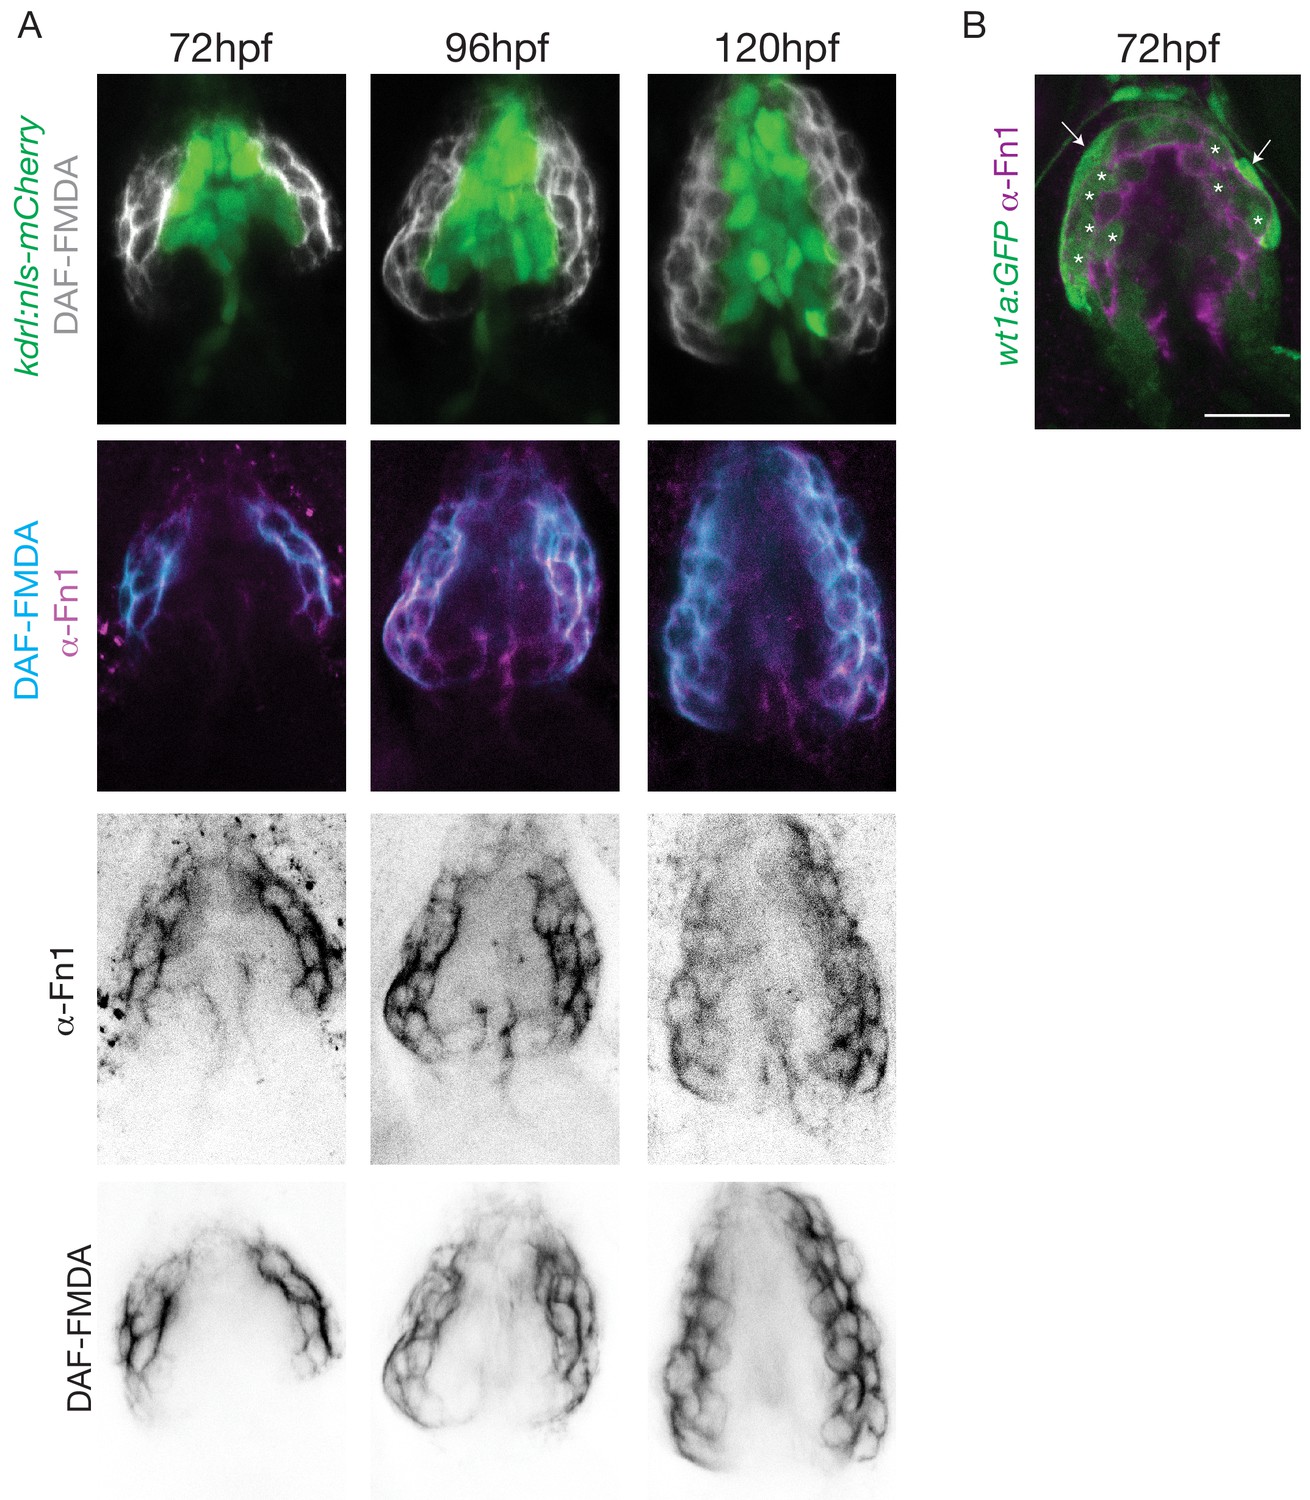
Smooth muscle identity is revealed by NO.
(A) Z-sections of the Tg(kdrl:nls-mCherry) line counterstained by DAF-FMDA (cyan) and Fn1 (magenta) at 72 hpf, 96 hpf and 120 hpf. Scale bar: 20 µm. (B) Co-localization of Fibronectin1 (magenta) with the Tg(wt1a:GFP) line (green) at and 72 hpf. Scale bar: 20 µm. Arrows show the epicardium and asterisks show the epicardium/Fn1 double positive cells.
Figure 4 with 1 supplement
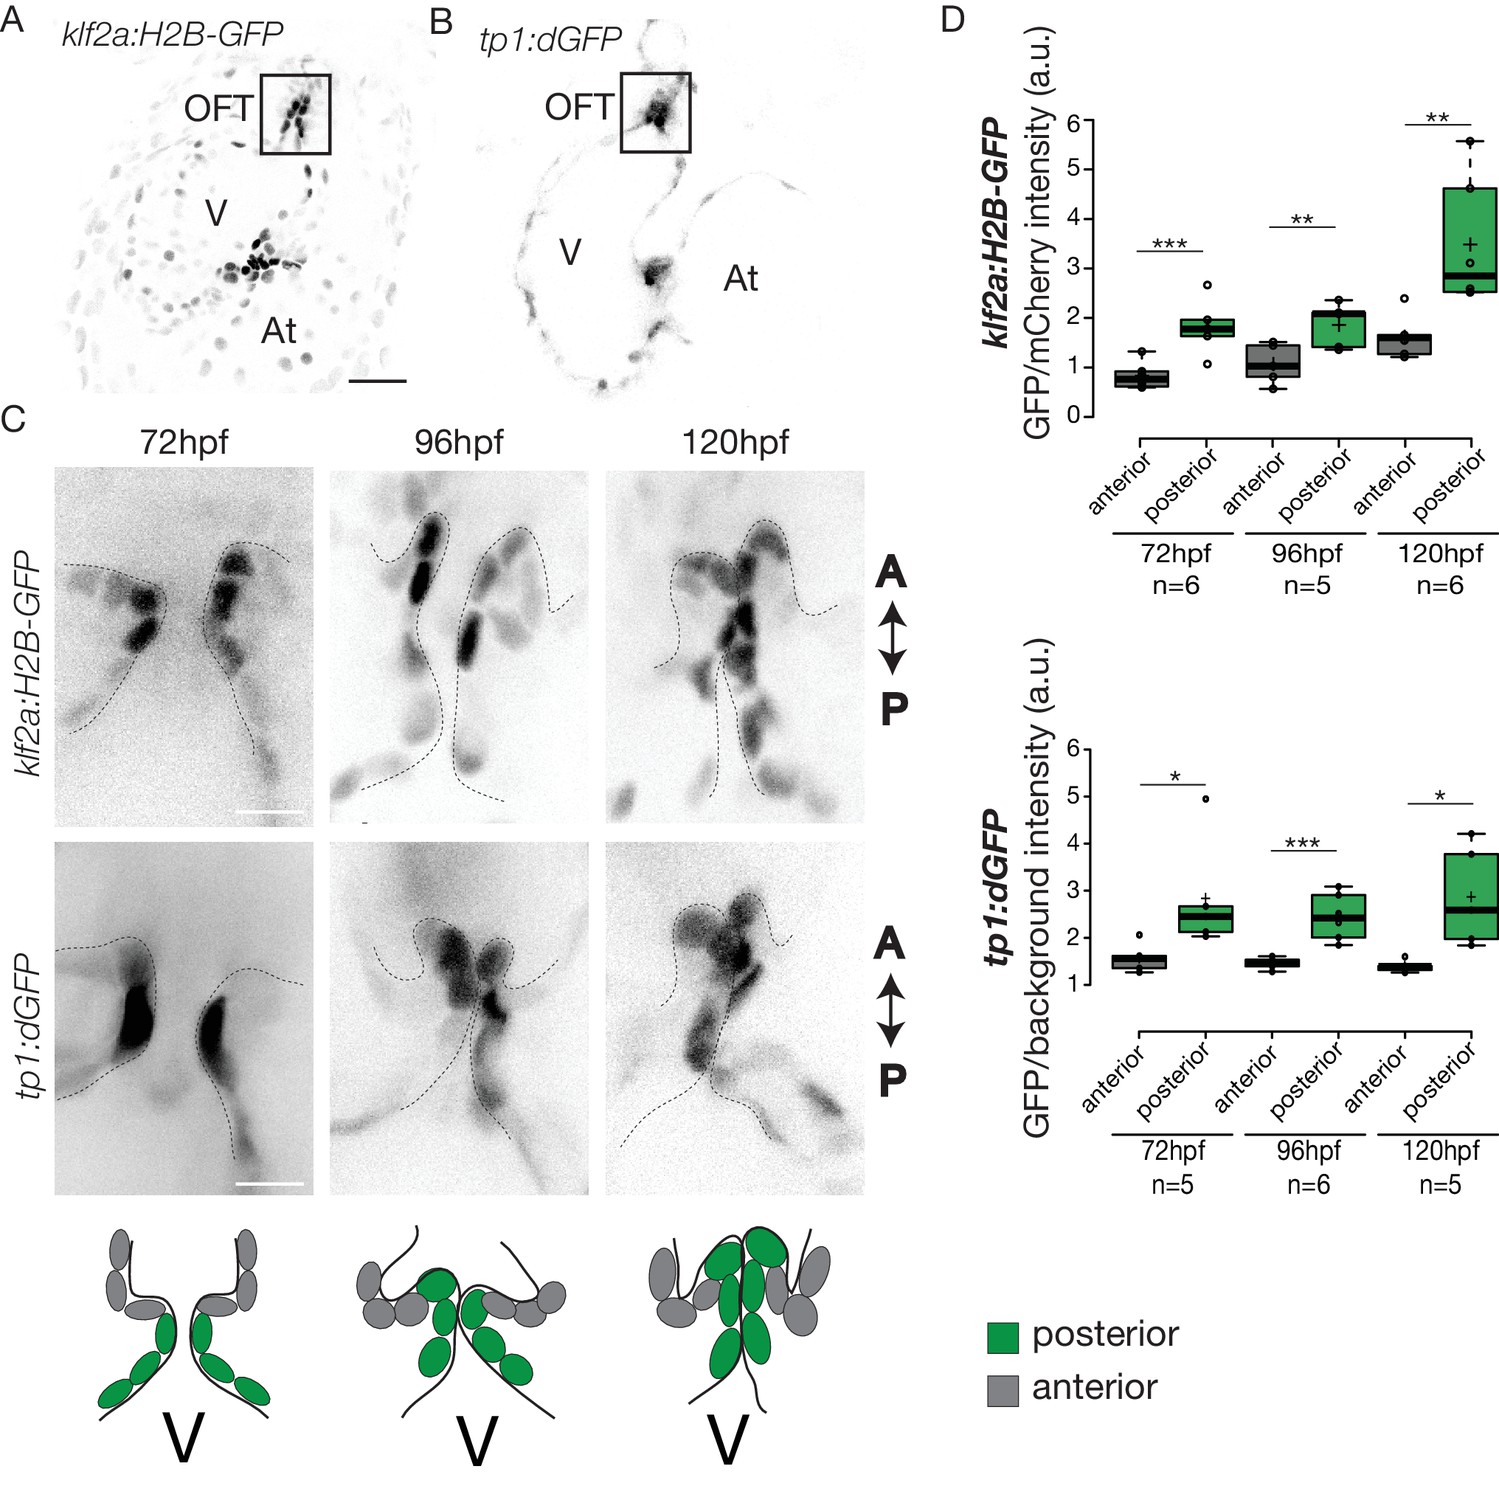
Klf2a and Notch reporters are activated in the OFT endothelium Confocal z-section of the Tg(klf2a:H2B-GFP; fli:nls-mCherry).
(A) and Tg(tp1:dGFP) (B) at 72hpf. OFT: outflow tract, At: atrium, V: ventricle. Scale bar: 20 µm. (C) Confocal z-section of OFT valves expressing the Klf2a reporter and Notch reporter at 72 hpf, 96 hpf, and 120 hpf. Schemes explaining the considered anterior (grey) and posterior (green) parts of the valve at 72 hpf, 96 hpf, and 120 hpf. A: anterior, P: posterior. V: ventricle. Scale bar: 10 µm. (D) Quantification of the fluorescent intensity of the Klf2a (GFP over mCherry) and Notch (GFP over background) reporters in the anterior versus posterior part of the valves at 72 hpf (n = 6 embryos, p=0001 and n = 5 embryos, p=0,02 respectively), 96 hpf (n = 5 embryos, p=0005 and n = 6 embryos, p=0,0007 respectively) and 120 hpf (n = 6 embryos, p=0,01 and n = 5 embryos, p=0,01) in wild-type embryos using the student’s t-test. Boxplots: Center lines show the medians; box limits indicate the 25th and 75th percentiles as determined by R software; whiskers extend 1.5 times the interquartile range from the 25th and 75th percentiles, outliers are represented by dots. Results obtained from three independent experiments.
-
Figure 4—source data 1
Fluorescence intensity measurements.
- https://doi.org/10.7554/eLife.44706.009
Figure 4—figure supplement 1

Expression of the klf2a reporter Z-section of the Tg(klf2a:H2B-EGFP; kdrl:nls-mCherry) at 72 hpf, 96 hpf and 120 hpf used to quantify the reporter expression.
Scale bar: 20 µm. Results obtained from three independent experiments.
Figure 5 with 1 supplement
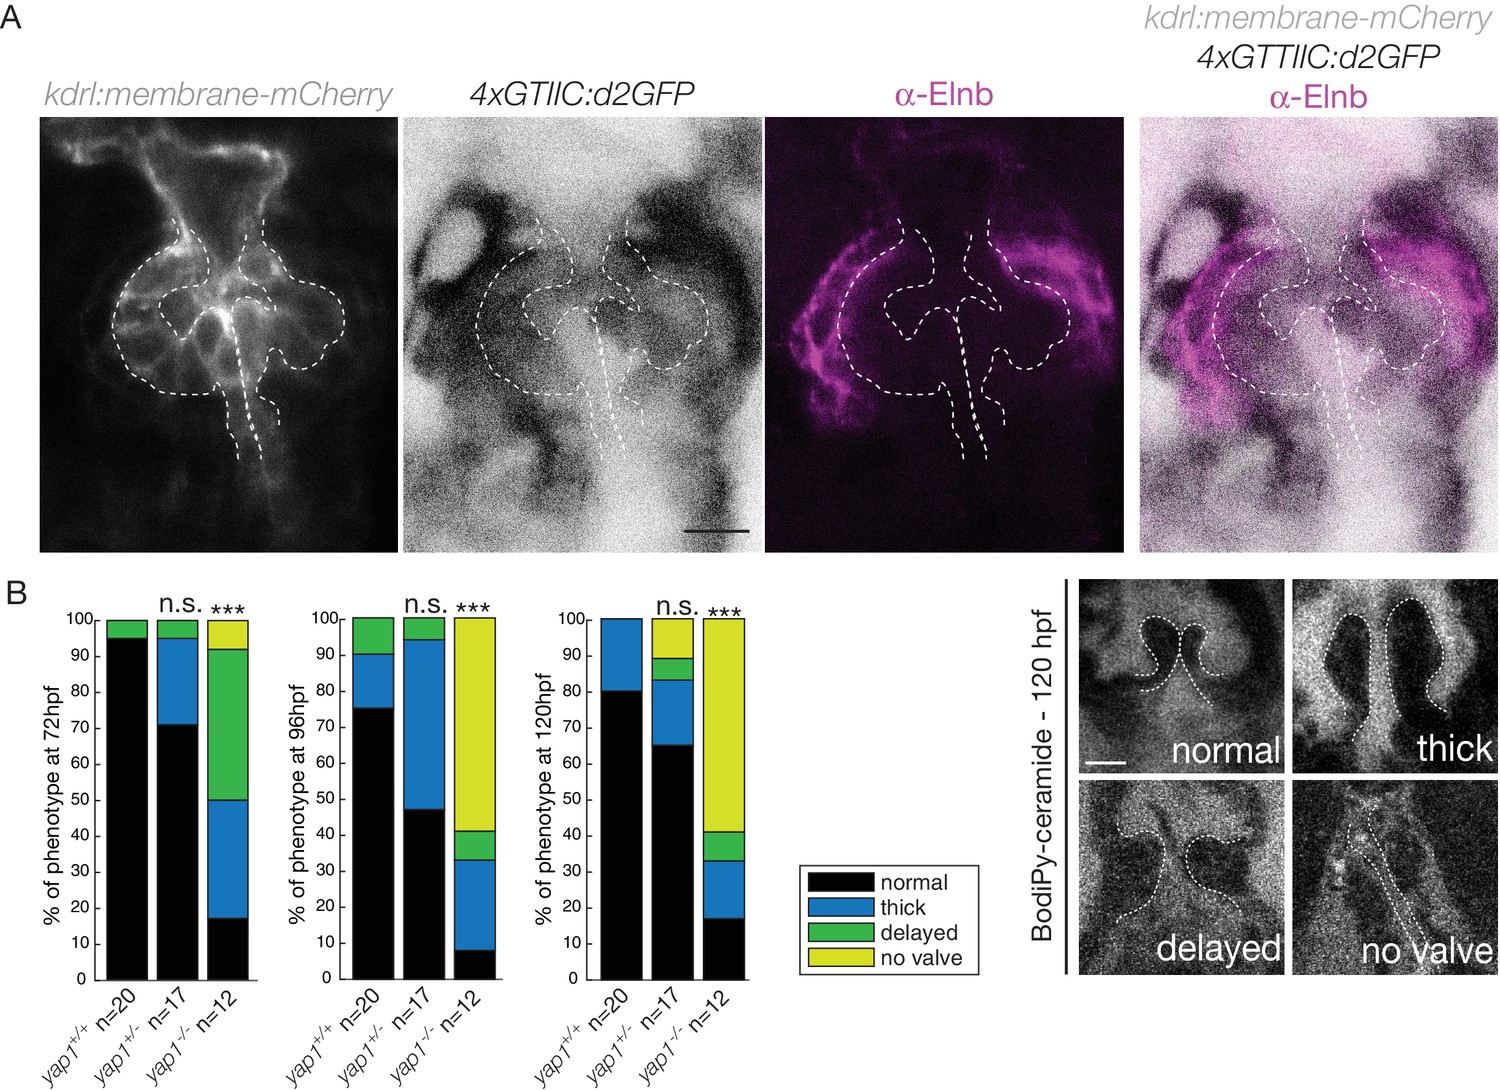
Hippo pathway effector Yap1 is active and Yap1 is essential for valve formation in the OFT.
(A) Confocal z-sections of the double transgenic line 4xGTIIC:d2GFP; kdrl:membrane-mCherry counterstained with the Elnb antibody and focused on the OFT. Scale bar: 20 µm. (B) Example of the valve phenotypes (normal, thick, delayed and no valve) and quantification of the phenotypes in the yap1+/+ controls embryos, yap1+/- and in yap1-/- mutant embryos. Chi-square test. n.s.: non significant, ***: p<10−3. Scale bar: 10 µm. Results obtained from two independent experiments.
-
Figure 5—source data 1
Phenotypic quantifications.
- https://doi.org/10.7554/eLife.44706.012
Figure 5—figure supplement 1
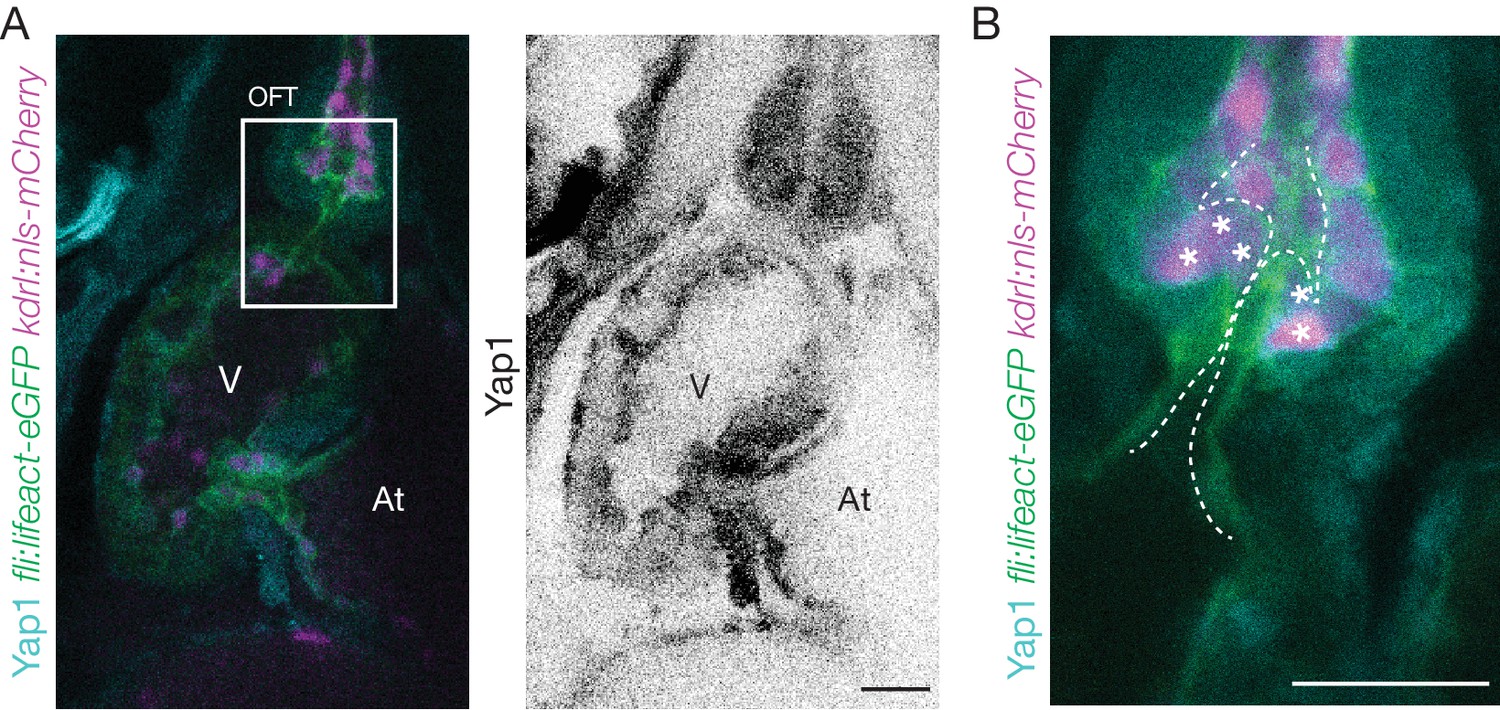
Yap1 is expressed in the OFT Yap1 antibody staining on Tg(fli:lifeact-EGFP; kdrl:nls-mCherry) (A) and zoom on the OFT (B) at 72 hpf.
Asterisks show endothelial cells expressing Yap1. At: atrium, V: ventricle. Scale bar: 20 µm. V: ventricle, At: atrium. Resultsobtained from three independent experiments.
Figure 6
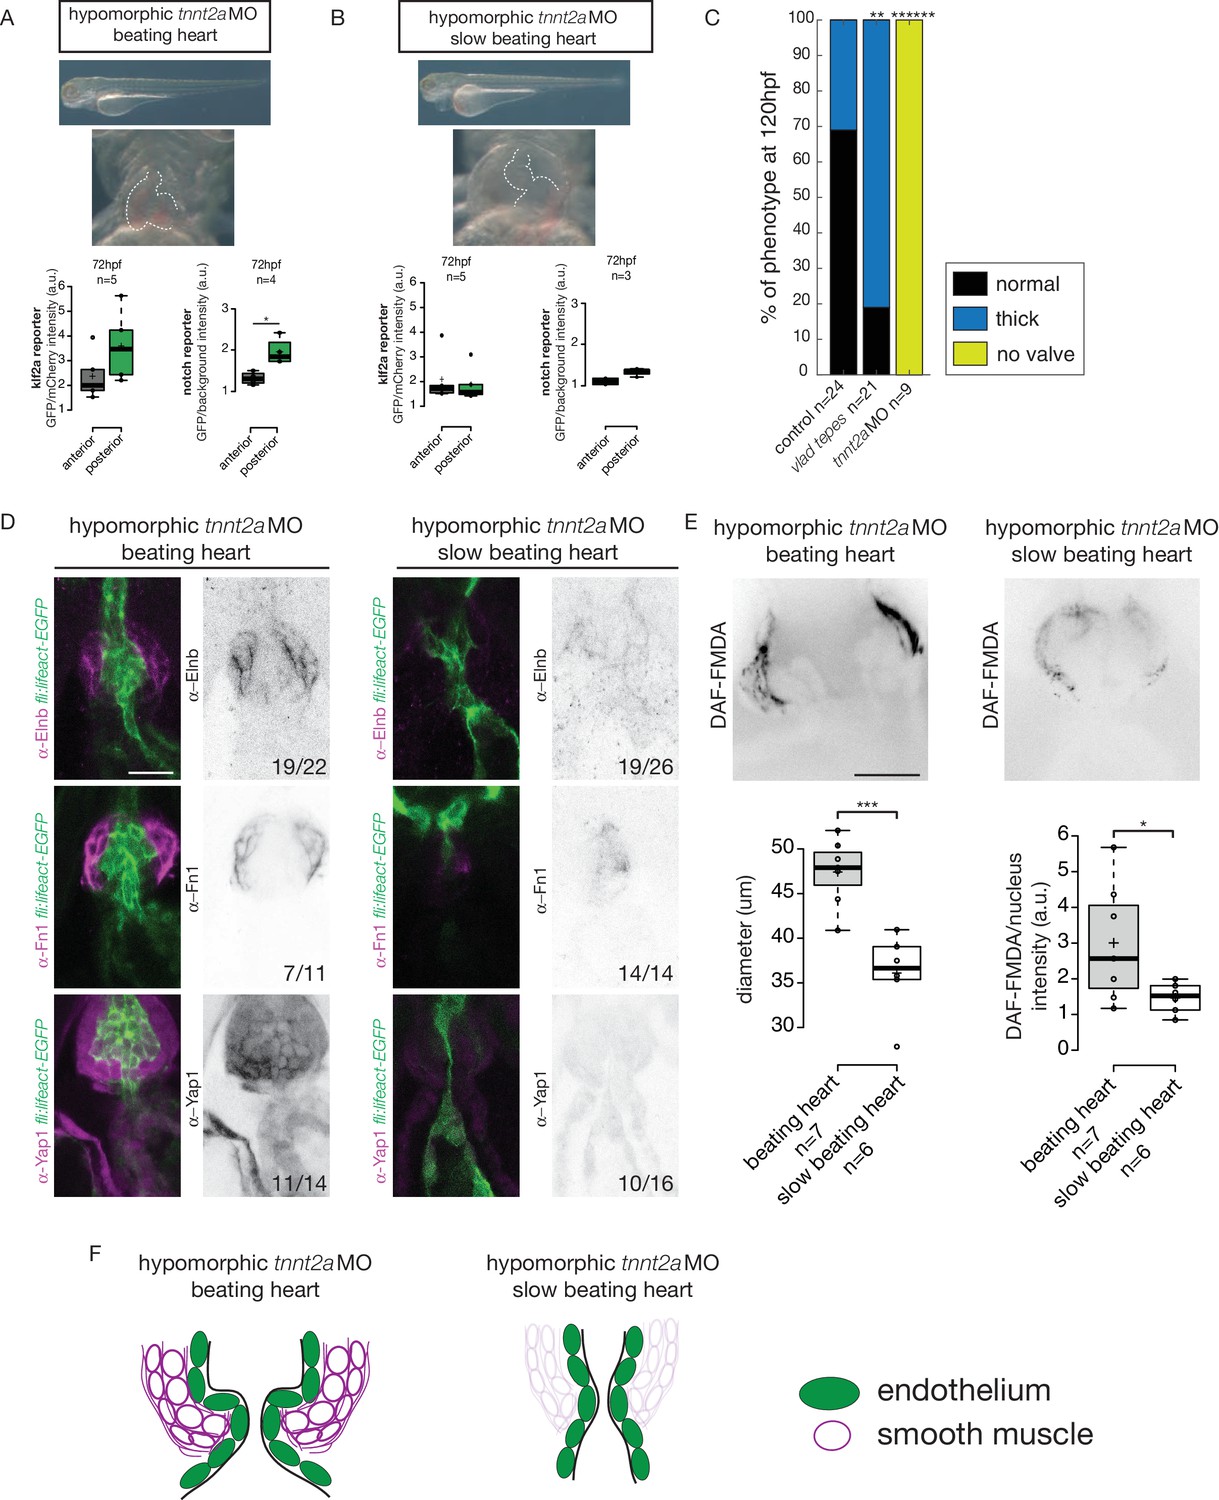
Klf2a and notch response, as well as the smooth muscle cell identity, are flow-dependent.
Quantification of the Klf2a and Notch reporter expressions in tnnt2a-morpholino injected embryos showing a ‘beating heart’ (p=0,27 and p=0,01 respectively). (A) and a ‘slow beating heart’ (p=0,7 and p=0,1 respectively) (B) at 72 hpf. N = 2 independent experiments. (C) Quantification of the phenotypes in the control (n = 24), vlad tepes mutant (n = 21 embryos from two independent experiments), tnnt2aMO-injected embryos (n = 9 embryos from two independent experiments). Chi-square test. **: p<10−2, ******: p<10−6. (D) Z-sections of the Tg(fli:lifeact-eGFP) counterstained with either Fibronectin1 (Fn1), elastin (Elnb) or Yap1 in tnnt2a-morpholino injected embryos (slow beating and beating heart). Scale bar: 20 µm. N = 2 independent experiments. (E) Z-section and quantification of the BA diameter and DAF-FMDA intensity in tnnt2a-morpholino injected embryos (p=0,0005 and p=0,05 respectively). Student’s t-test. Boxplots: Center lines show the medians; box limits indicate the 25th and 75th percentiles as determined by R software; whiskers extend 1.5 times the interquartile range from the 25th and 75th percentiles, outliers are represented by dots. (F) Scheme summarizing the down-regulation of the smooth muscle markers in ‘slow beating heart’ embryos compared to ‘beating heart”embryos.
-
Figure 6—source data 1
Phenotypic and fluorescence reporters quantifications.
- https://doi.org/10.7554/eLife.44706.014
Figure 7 with 1 supplement
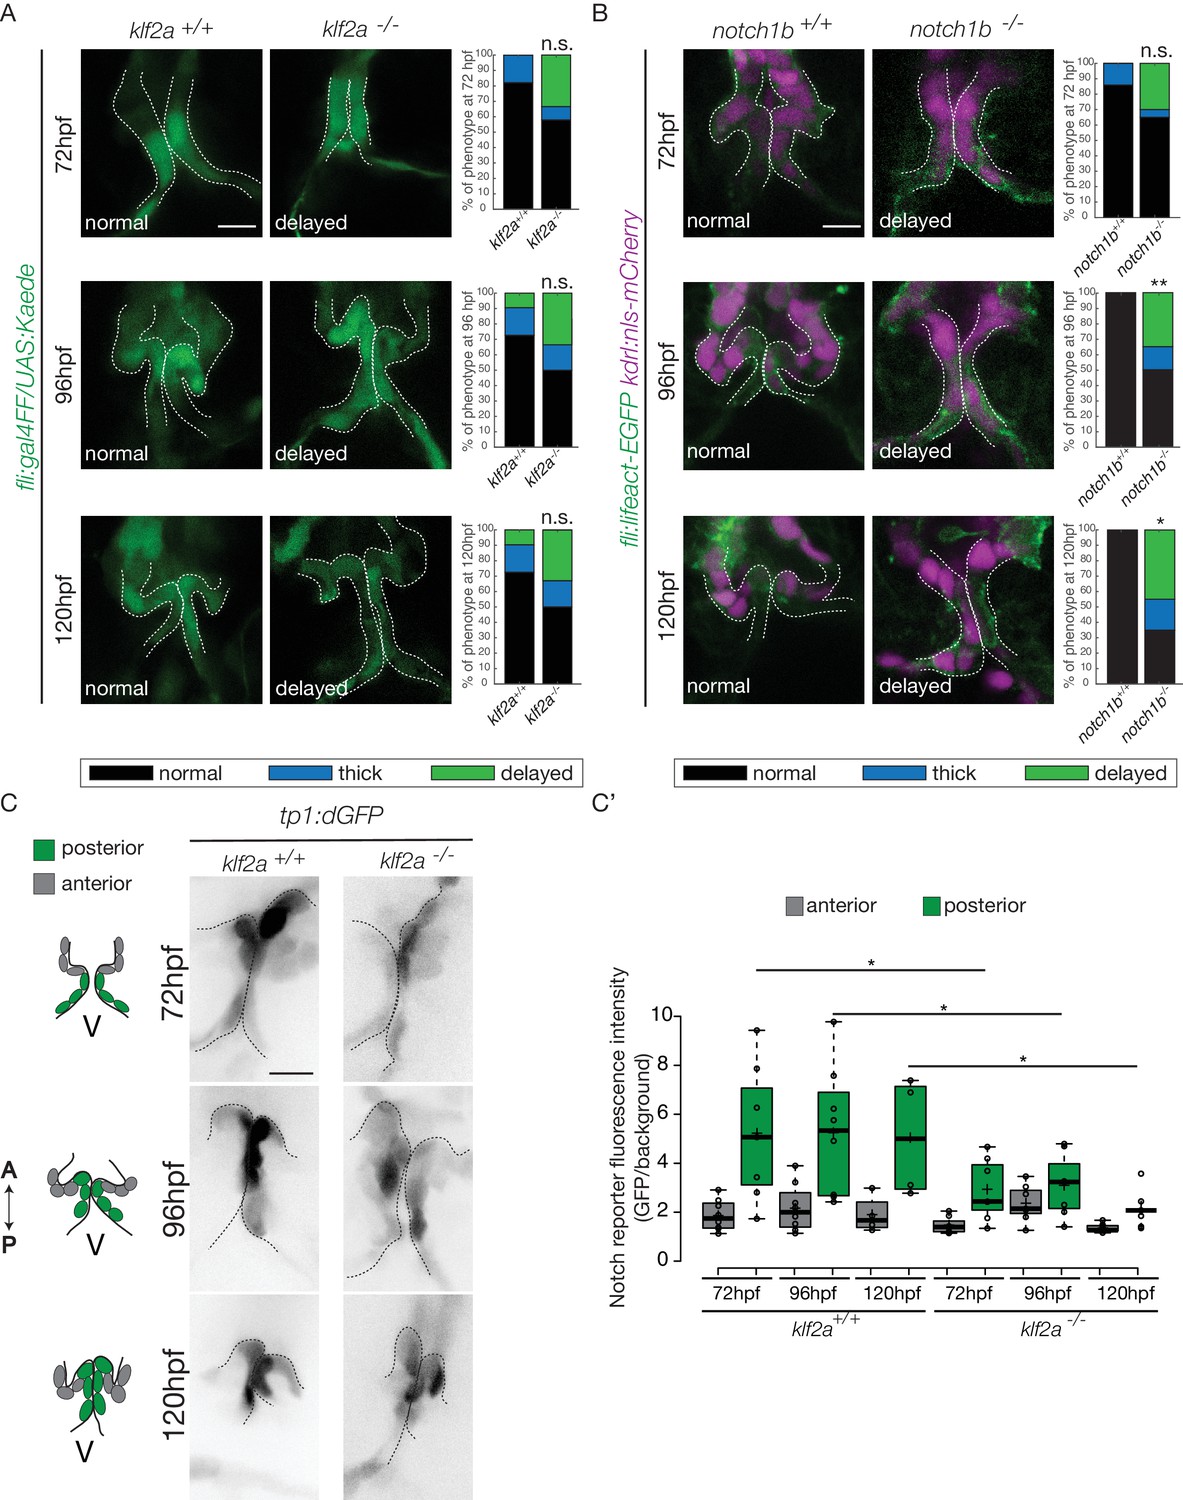
Klf2a and notch are necessary for valve formation.
Quantification of the valve phenotypes at 72 hpf, 96 hpf and 120 hpf (normal, thick, delayed) in klf2a+/+(n = 11), and klf2a-/- (n = 12) using the Tg(fli:gal4FF/UAS:Kaede). (A) and notch1b+/+ (n = 7) and notch1b-/- (n = 20) using Tg(fli:lifeact-EGFP; kdrl:nls-mCherry) embryos. (B) Scale bar: 10 µm. N = 3 independent experiments. (C) Confocal z-sections of the Tg(tp1:dGFP) in klf2a+/+ and klf2a-/- embryos at 72 hpf, 96 hpf and 120 hpf. V: ventricle. Scale bar: 10 µm. (C’) Quantification of the fluorescent intensity of the Notch reporter (GFP over background) in the anterior versus posterior parts of the valves in in klf2a+/+ (n = 5) and klf2a-/- (n = 4) embryos. Statistical test were performed to compare the posterior intensities in klf2a+/+versus klf2a-/- at 72 hpf (p=0,05), 96 hpf (p=0,03) and 120 hpf (p=0,04). Student’s t-test. Boxplot: Center lines show the medians; box limits indicate the 25th and 75th percentiles as determined by R software; whiskers extend 1.5 times the interquartile range from the 25th and 75th percentiles, outliers are represented by dots. Results obtained from three independent experiments.
-
Figure 7—source data 1
Fluorescent intensity quantifications.
- https://doi.org/10.7554/eLife.44706.019
Figure 7—figure supplement 1
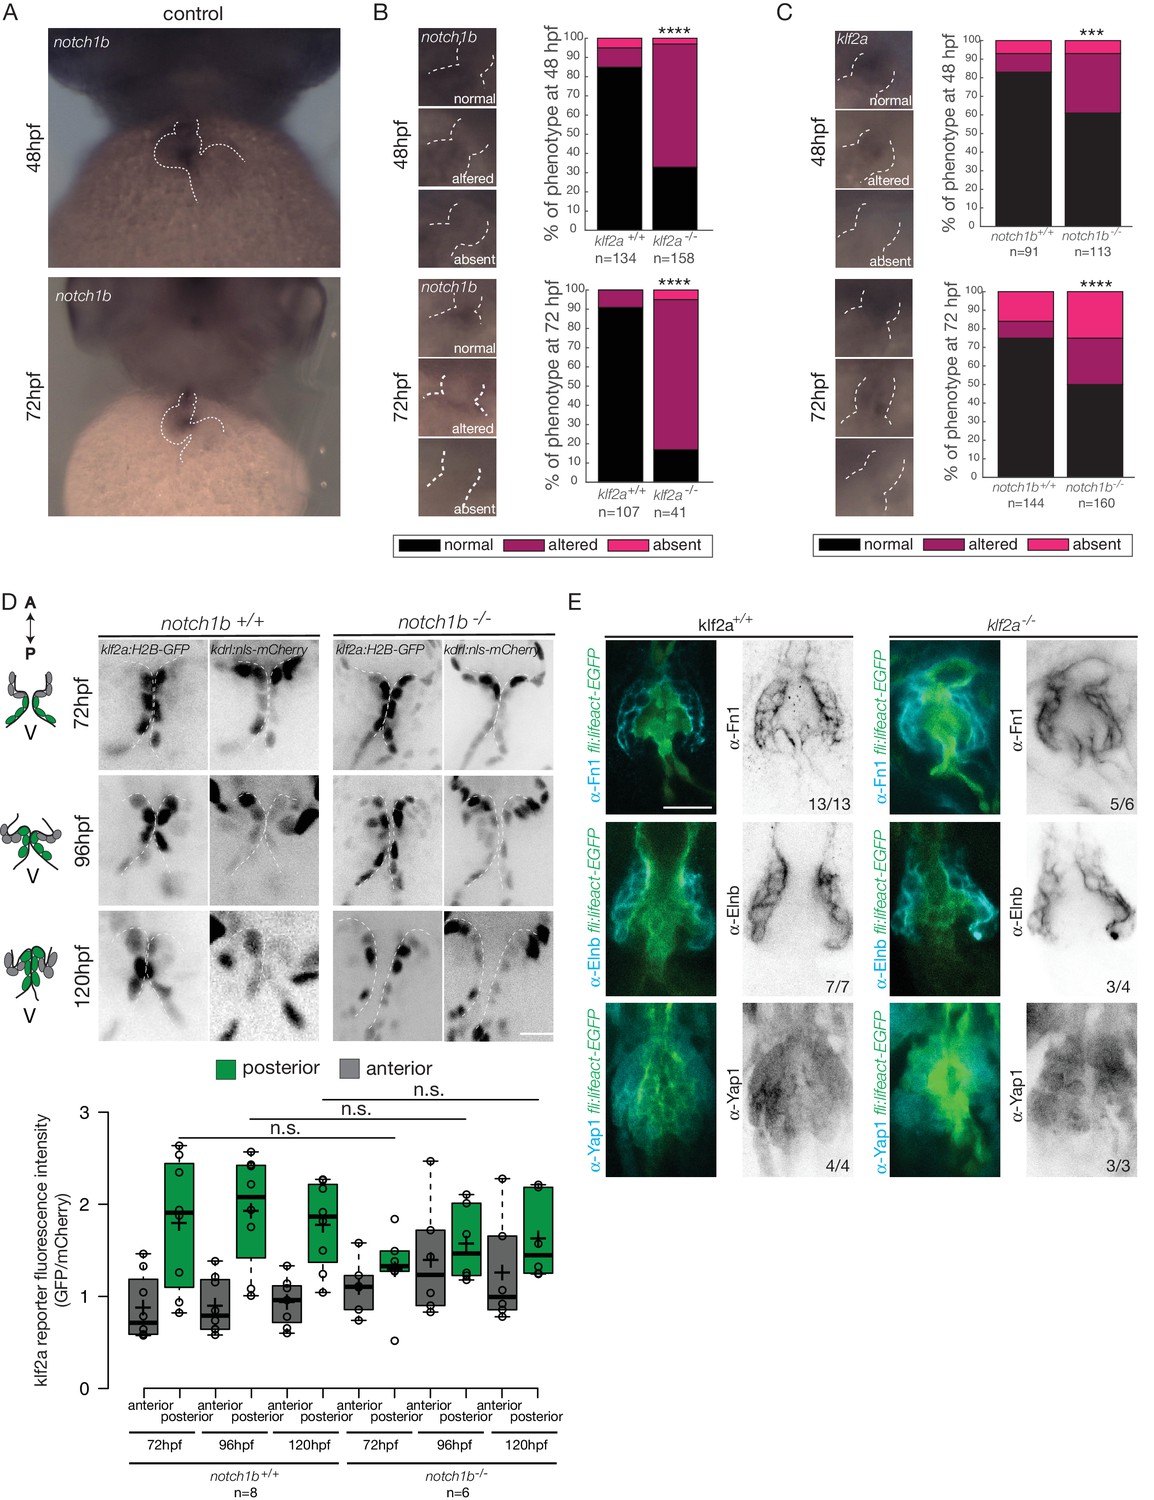
Klf2a regulates notch1b expression but Notch1b does not regulate klf2a expression.
(A) In situ hybridization of notch1b in wild-type embryos at 48 hpf and 72 hpf. In situ hybridization of notch1b in klf2a+/+ (n = 134 and n = 107 at 48 hpf and 72 hpf respectively) and klf2a-/- (n = 158 and n = 41 at 48 hpf and 72 hpf respectively) embryos (B) and of klf2a in notch1b+/+ (n = 91 and n = 144 at 48 hpf and 72 hpf respectively) and notch1b-/- (n = 113 and n = 160 at 48 hpf and 72 hpf respectively) embryos. (C) and quantification of their expression pattern in the OFT at 48 hpf. N = 3 independent experiments. (D) Z-sections of the Tg(klf2a:H2B-EGFP; kdrl:nls-mCherry) and quantification of the fluorescent intensity of the Klf2a reporter (EGFP over mCherry) in the anterior versus posterior part of the valves at 72 hpf, 96 hpf and 120 hpf in notch1b+/+ (n = 6) and notch1b-/- (n = 6). Boxplot: Center lines show the medians; box limits indicate the 25th and 75th percentiles as determined by R software; whiskers extend 1.5 times the interquartile range from the 25th and 75th percentiles, outliers are represented by dots. Results obtained from three independent experiments. (E) Fibronectin1 (Fn1), elastin (Elnb) and Yap1 immunostaining on Tg(fli:lifeact-EGFP) in control (n = 13, n = 7, n = 4 respectively), klf2a-/- (n = 6, n = 4, n = 3 respectively). Scale bar: 20 µm. Results obtained from two independent experiments.
Figure 8 with 3 supplements
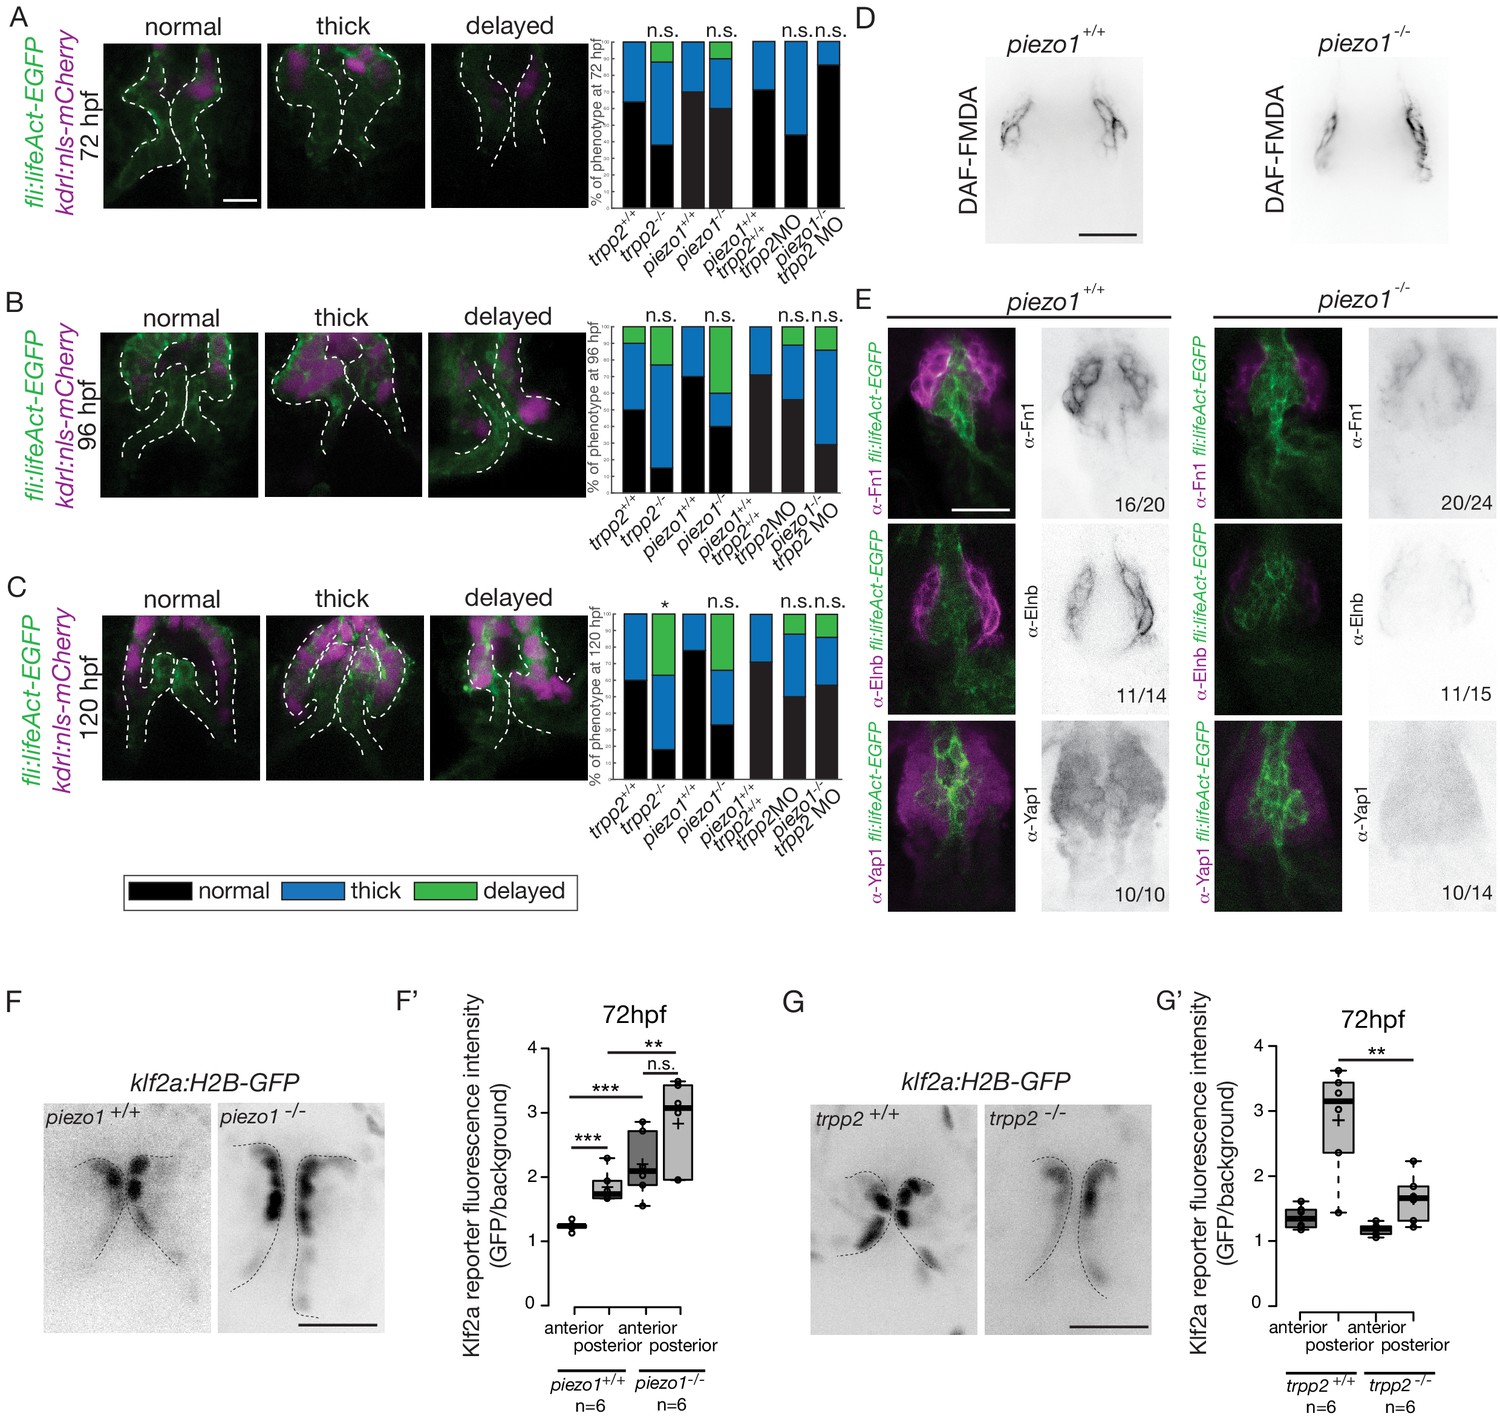
Flow and mechanosensitive channels are necessary for proper OFT valve formation.
(A) Z-sections and quantifications of the valves phenotypes (normal, thick, delayed) of the Tg(fli:lifeaAct-EGFP; kdrl:nls-mCherry) at 72 hpf (B), 96 hpf (C) and 120 hpf (D) in trpp2+/+(n = 11, n = 10, n = 10), trpp2-/- (n = 8, n = 13, n = 13 from three independent experiments), piezo1+/+ (n = 10, n = 10, n = 9), piezo1-/-(n = 10, n = 10, n = 9 from two independent experiments), piezo1+/+; trpp2+/+ (n = 7), trpp2-morpholino injected embryos (n = 9) and piezo1-/-; trpp2-morpholino injected embryos (n = 7). Scale bar: 10 µm. (D) Z-section of the OFT stained with DAF-FMDA in piezo1+/+ and piezo1-/-. Scale bar: 20 µm. (E) Fibronectin1 (Fn1), elastin (Elnb) and Yap1 staining on Tg(fli:lifeact-eGFP) in piezo1+/+ (n = 12, n = 4 and n = 10 respectively) and piezo1-/- (n = 12, n = 4 and n = 10 respectively from three independent experiments). Scale bar: 20 µm. Z-sections (F) and quantification (F’) of the klf2a reporter (GFP over background) in the anterior and posterior parts of the valves in piezo1+/+ (n = 6) and piezo1-/- (n = 6) obtained from two independent experiments). Scale bar: 20 µm. Z-sections (G) and quantification (G’) of the klf2a reporter (GFP over background) in the anterior and posterior parts of the valves in trpp2+/+ (n = 6) and trpp2-/- (n = 6) (obtained from two independent experiments). Scale bar: 20 µm. Student’s t-test. Boxplot: Center lines show the medians; box limits indicate the 25th and 75th percentiles as determined by R software; whiskers extend 1.5 times the interquartile range from the 25th and 75th percentiles, outliers are represented by dots.
-
Figure 8—source data 1
Phenotypic and fluorescence reporters quantifications.
- https://doi.org/10.7554/eLife.44706.024
Figure 8—figure supplement 1
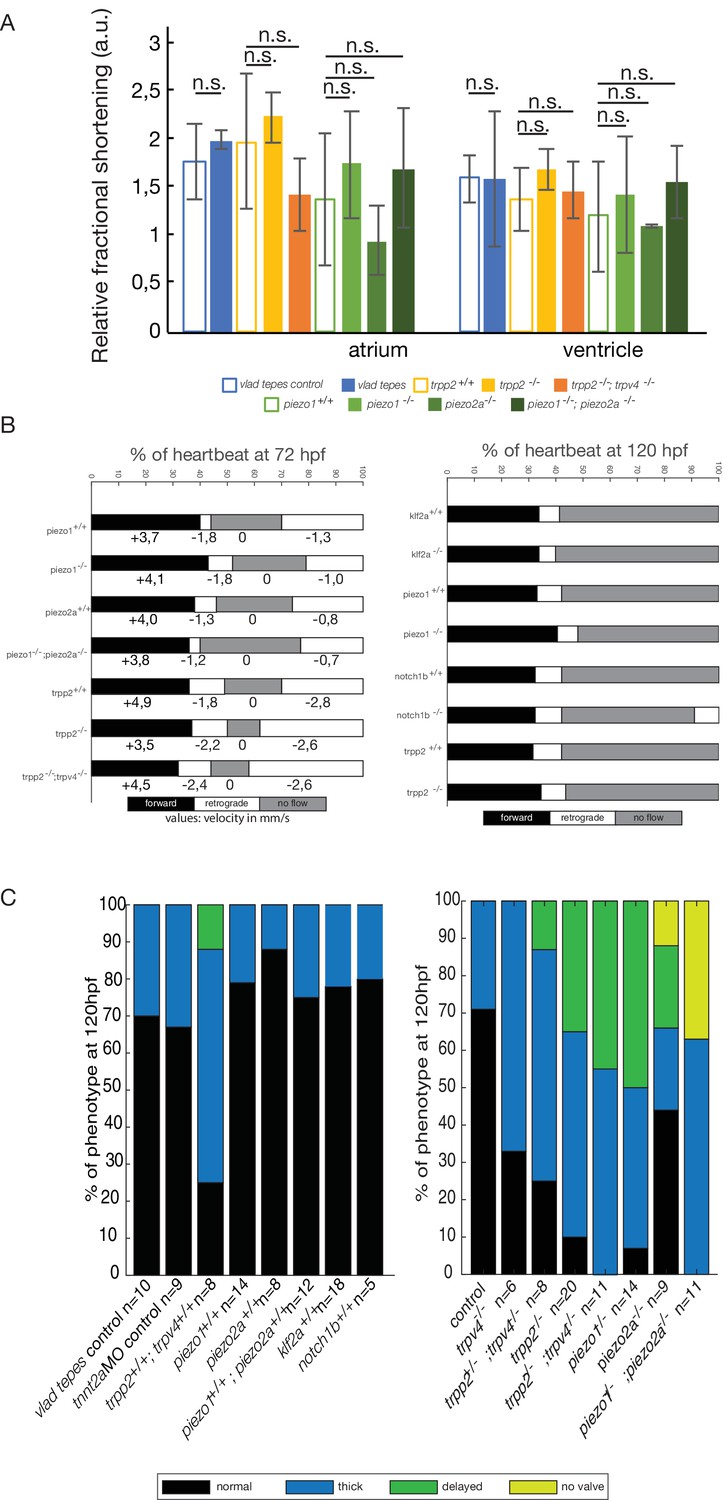
Embryo phenotypes in controls and mutants.
(A) Relative fractional shortening in the atrium and ventricle in control, vlad tepes mutant, trpp2-/-, trpp2-/-; trpv4-/-, piezo1-/-, piezo1-/-; piezo2a-/-. (B) Flow profile in the OFT at 72 hpf and 120 hpf in the same mutants showing the forward flow (black), retrograde flow (white) and no flow (grey) fractions. (C) Quantification of the valve phenotypes in the respective mutant controls and trpv4-/- (n = 6), trpp2+/-; trpv4-/- (n = 8), trpp2-/- (n = 20), trpp2-/-; trpv4-/- (n = 11), piezo1-/- (n = 14), piezo2a-/- (n = 9), piezo1-/-; piezo2a-/- (n = 11) at 120 hpf (normal, thick, delayed and no valve). Chi square test. Results obtained from three independent experiments.
Figure 8—figure supplement 2
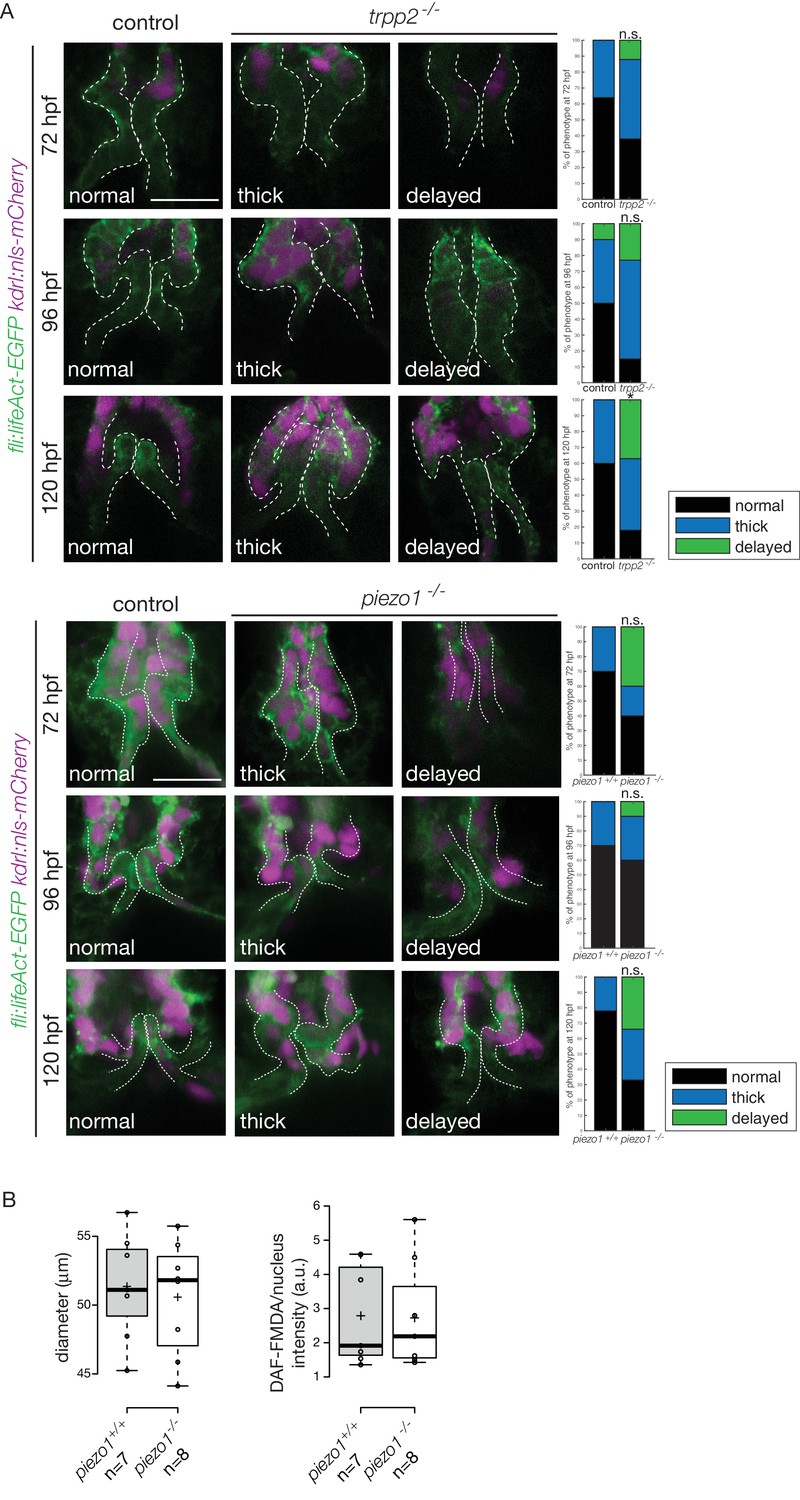
Valve phenotypes in trpp2-/- and in piezo1-/-.
(A) Z-sections of the Tg(fli:lifeAct-EGFP: kdrl:nls-mCherry) in control (trpp2+/+ and trpp2+/-) and trpp2-/- obtained from three independent experiments and in control (piezo1+/+) and piezo1-/- obtained from two independent experiments) and quantifications of the phenotypes. Chi-square test. (B) Quantification of the OFT diameter and DAF-FMDA intensity in piezo1+/+ (n = 7) and piezo1-/- (n = 8). Boxplots: Center lines show the medians; box limits indicate the 25th and 75th percentiles as determined by R software; whiskers extend 1.5 times the interquartile range from the 25th and 75th percentiles, outliers are represented by dots.
Figure 8—figure supplement 3

Trpp2 and Piezo1 expression in the OFT.
(A) Z-projection of the RNAscope of kdrl and single Z-sections of the RNAscope of trpp2 and piezo1 on 72 hpf wild-type embryos in the head and the OFT. (B) Z-section of the Tg(piezo1:nls-Venus) reporter line counterstained with Trpp2 antibody.
Figure 9

Working model summarizing OFT valve morphogenesis in response to mechanical forces.
Two cell layers forming the OFT respond to piezo1 activity: the endothelium (green) and smooth muscle cells (magenta). Endothelial klf2a expression is repressed by Piezo1. In the smooth muscle cells, the expression of elastin (Elnb), fibronectin (Fn1) and Yap1 is modulated by Piezo1. Fibronectin is localized in the smooth muscle cell layer and within the forming valve (magenta lines). Future work will help to decipher how the two cell layers interact with each other to modulate OFT valve formation. V, ventricle.
Author response image 1

(A) Z-section of the kdrl:nls-mCherry and fli1a:lifeact-eGFP in the OFT (B) Z-projection of the RNAscope of kdrl in the head and in the OFT (n=6 embryos).
Author response image 2
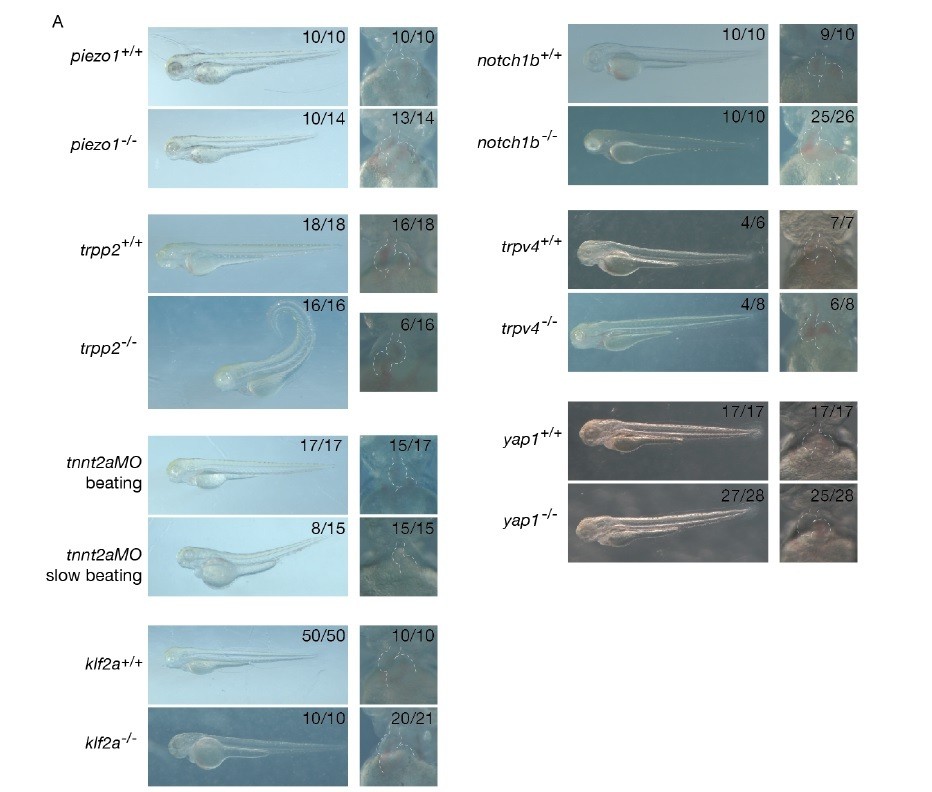
(A) Pictures of the different mutants and their controls showing overall shape and heart shape.
Videos
Video 1
Bright field videomicroscopy of the typical heart function of a tnnt2a MO group1 embryo where the heart is still beating normally.
https://doi.org/10.7554/eLife.44706.015
Video 2
Bright field videomicroscopy of the typical heart function of a tnnt2a MO group2 embryo where the heart is still beating but at an abnormal slow rate (less than 2 Hz).
https://doi.org/10.7554/eLife.44706.016Additional files
-
Transparent reporting form
- https://doi.org/10.7554/eLife.44706.026
Download links
A two-part list of links to download the article, or parts of the article, in various formats.
Downloads (link to download the article as PDF)
Open citations (links to open the citations from this article in various online reference manager services)
Cite this article (links to download the citations from this article in formats compatible with various reference manager tools)
Mechanically activated piezo channels modulate outflow tract valve development through the Yap1 and Klf2-Notch signaling axis
eLife 8:e44706.
https://doi.org/10.7554/eLife.44706


