Brain-specific Drp1 regulates postsynaptic endocytosis and dendrite formation independently of mitochondrial division
- Johns Hopkins University School of Medicine, United States
Figures
Figure 1
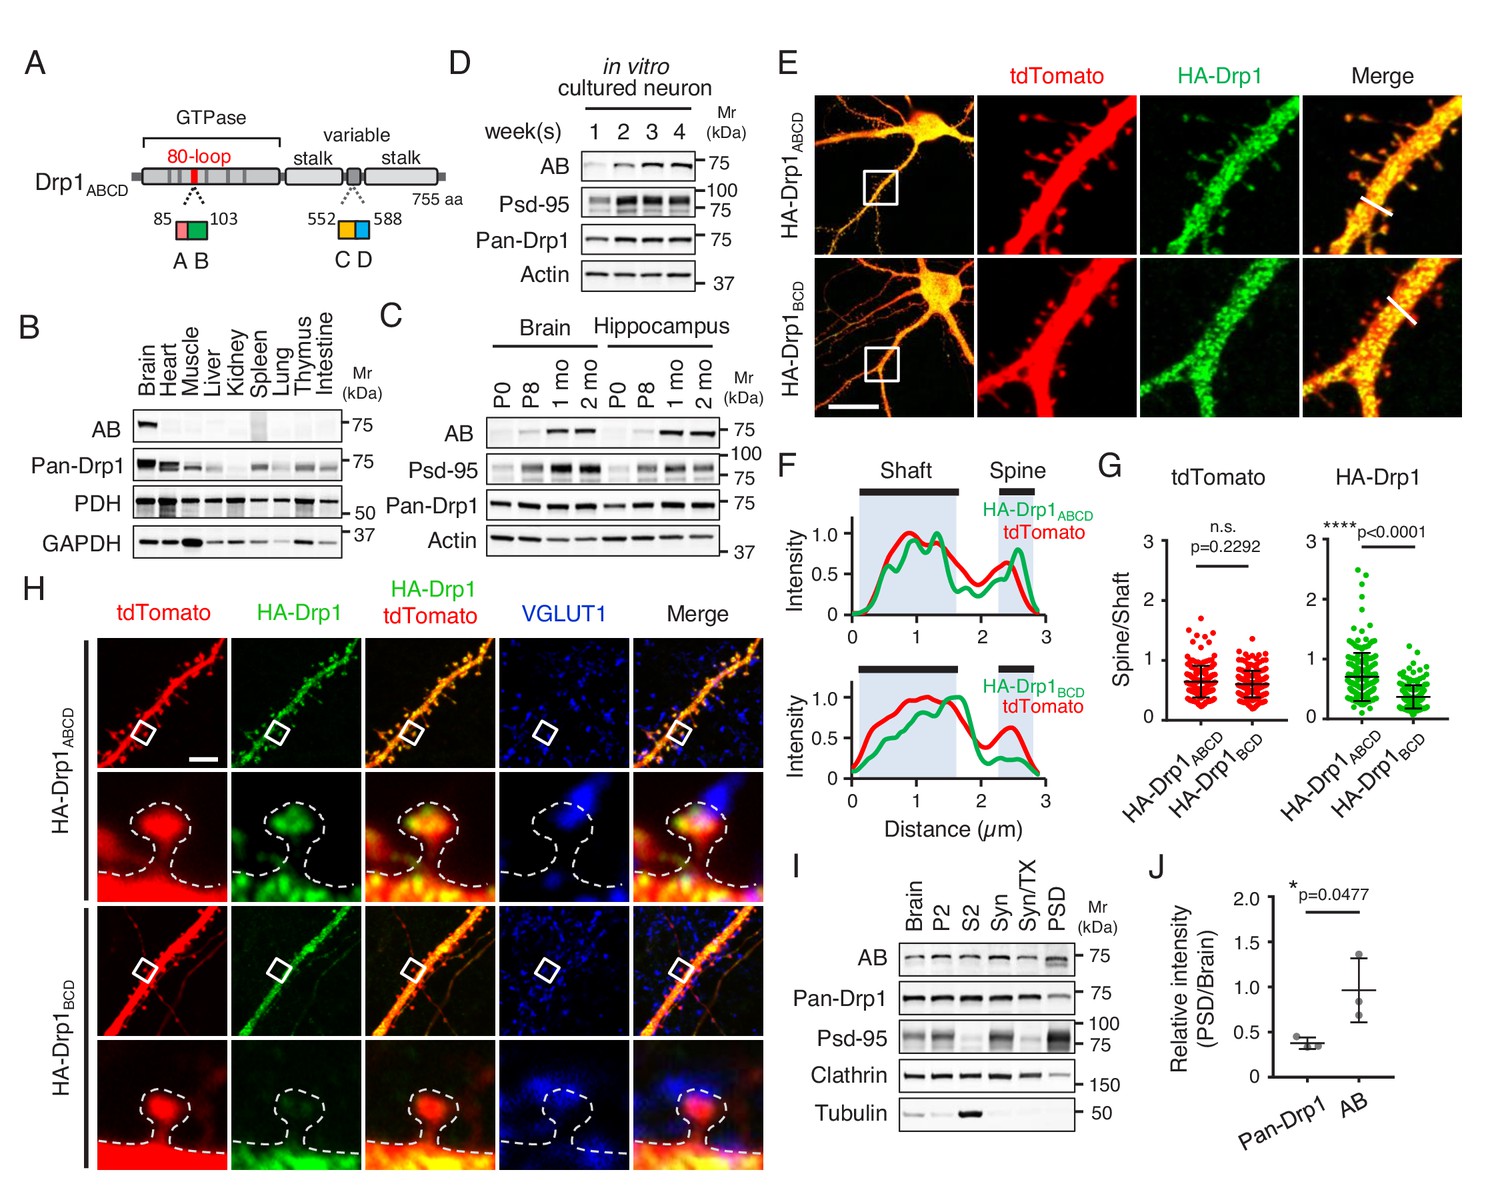
Drp1ABCD is induced during a postnatal period and enriched in postsynaptic terminals.
(A) Domain architecture of Drp1ABCD. Alternative exons A and B are present in the 80-loop inside the GTPase domain while alternative exons C and D are located in the variable domain. (B) Different mouse organs were analyzed by Immunoblotting using antibodies to Drp1ABCD (AB), pan-Drp1, the mitochondrial protein PDH, and GAPDH. 60 µg (AB and pan-Drp1) and 12.5 µg (PDH and GAPDH) of proteins were loaded per lane. (C) Whole brains and hippocampi were analyzed at the indicated ages by Immunoblotting with antibodies to Drp1ABCD, postsynaptic density protein 95 (Psd-95), pan-Drp1, and actin. (D) Hippocampal neurons were cultured in vitro for 1, 2, 3 and 4 weeks and analyzed by immunoblotting. (E) Cultured hippocampal neurons were co-transfected at 3 weeks with plasmids carrying HA-Drp1ABCD or HA-Drp1BCD, along with plasmids carrying a cytosolic marker, tdTomato. Three days after transfection, neurons were analyzed by immunofluorescence microscopy with antibodies to RFP (which recognizes tdTomato) and HA. Boxed regions are enlarged. Bar, 20 µm. (F) Intensity of tdTomato (red) and HA (green) signals in dendritic shafts and spines were quantified along the lines shown in Figure 1E. Intensity was normalized to the highest value. (G) Ratios of signal intensity in spines relative to those in dendritic shafts were analyzed for HA-Drp1ABCD and HA-Drp1BCD. As a control, the tdTomato signal was used. Bars are mean ± SD (n = 176 spines in 10 neurons expressing HA-Drp1ABCD and 163 spines in 10 neurons expressing HA-Drp1BCD). (H) Cultured hippocampal neurons were co-transfected at 3 weeks with plasmids carrying tdTomato and HA-Drp1ABCD or HA-Drp1BCD and subjected to immunofluorescence microscopy with antibodies to HA and vesicular glutamate transporter 1 (VGLUT1). Boxed regions are enlarged. Bar, 5 µm. (I) Postsynaptic density fractions were isolated from the whole brains of wild-type mice and analyzed by Immunoblotting. Brain, whole brain; P2, membrane fraction; S2, cytosolic fraction; Syn, total synaptosomal fraction; Syn/Tx, Triton-soluble synaptosomal fraction; PSD, postsynaptic density fraction. (J) Band intensity of total Drp1 (pan-Drp1) and Drp1ABCD (AB) in the postsynaptic density fraction was quantified relative to the whole brain. Bars are mean ± SD (n = 3). Statistical analysis was performed using Mann–Whitney U test (G) and Student’s t-test (J). n.s., not significant.
-
Figure 1—source data 1
Drp1ABCD is enriched in postsynaptic terminals.
- https://doi.org/10.7554/eLife.44739.003
Figure 2 with 1 supplement
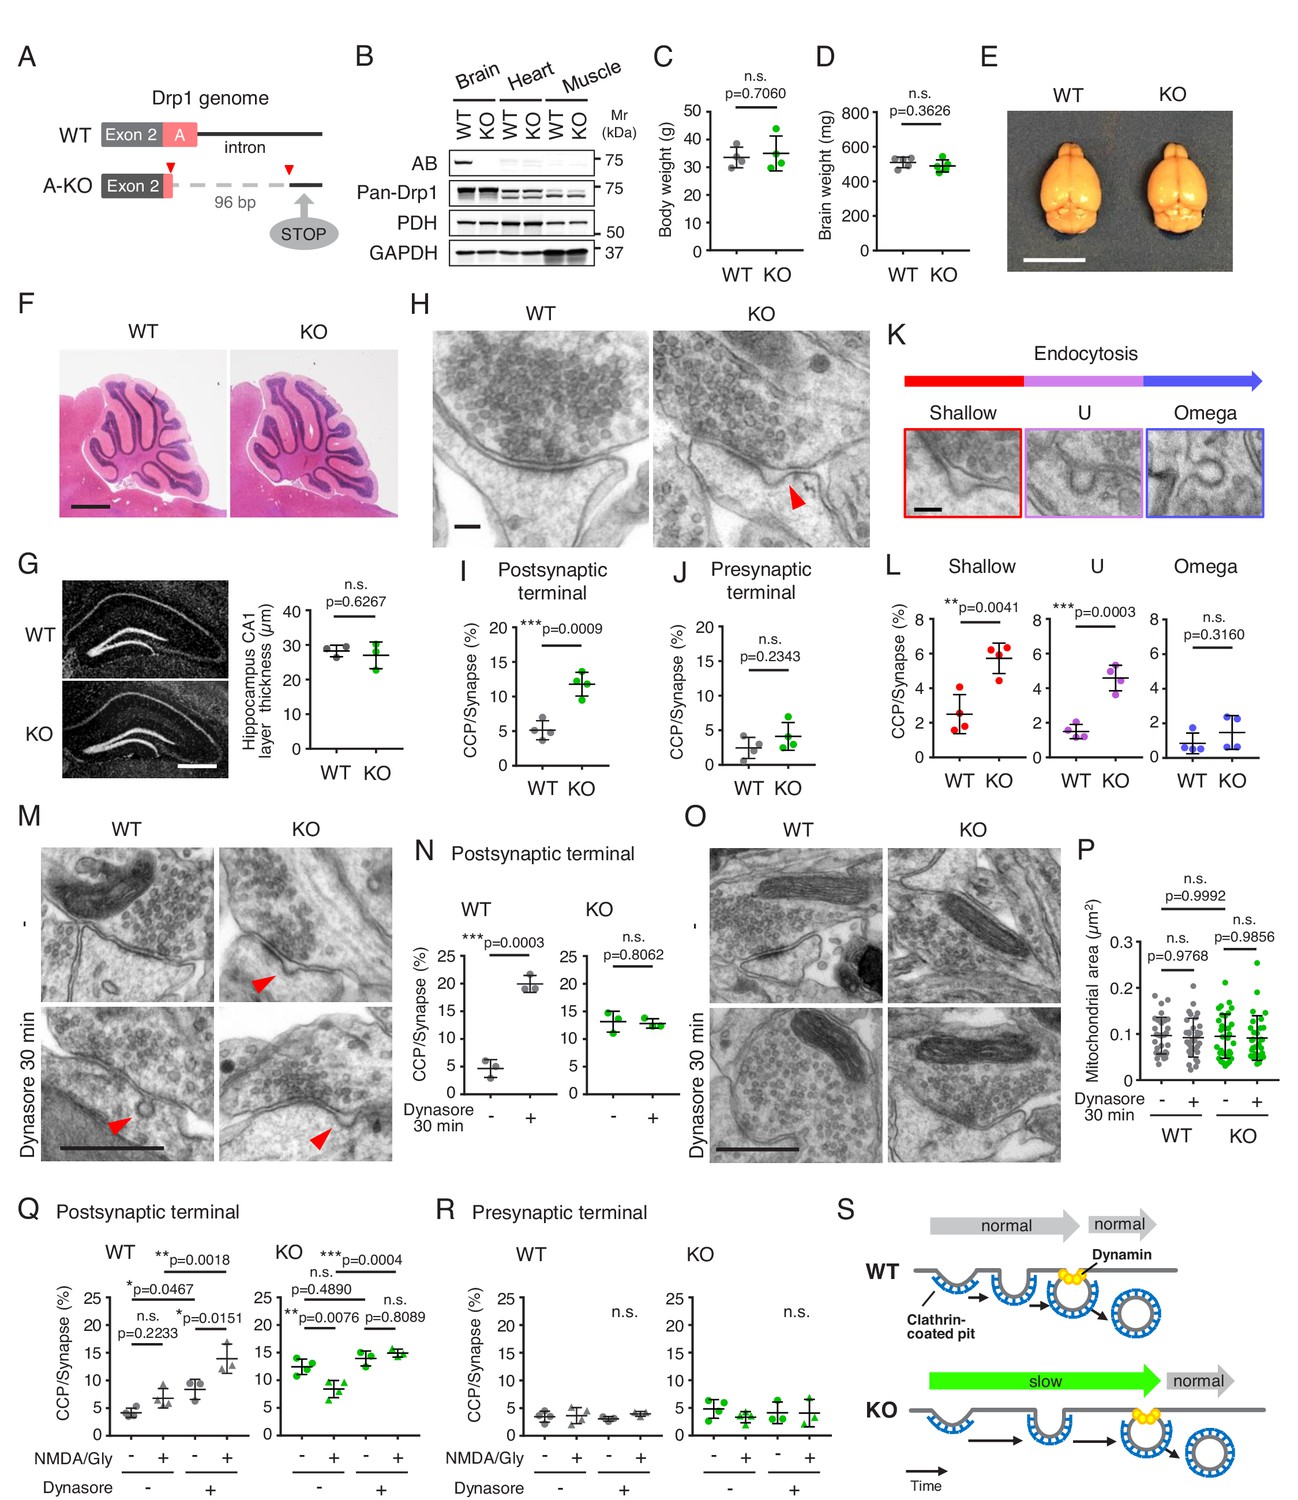
The loss of Drp1ABCD blocks postsynaptic endocytosis.
(A) Two guide RNAs were used to cut the genome at two positions (red arrowheads) to remove the majority of exon A and part of the following intron using CRISPR/Cas9. This deletion introduced a stop codon 20 residues downstream from the deletion site (STOP). (B) The indicated tissues were harvested from control and Drp1exonA-KO mice and analyzed by immunoblotting using antibodies to Drp1ABCD (AB), pan-Drp1, the mitochondrial protein PDH, and GAPDH. (C and D) Weights of the whole body (C) and brain (D) were measured. Bars are mean ± SD (n = 4 in C and 5 in D). (E) Images of the whole brain. Bar, 1 cm. (F) H and E staining of cerebella of control and Drp1exonA-KO mice. Sagittal sections were cut in the midline. Bar, 1 mm. (G) Frozen sections of the hippocampus in control and Drp1exonA-KO mice were stained with DAPI. Bar, 0.5 mm. The thickness of the CA1 layer was measured. Bars are mean ± SD (n = 3). (H) Control and Drp1exonA-KO hippocampal neurons were cultured for 3 weeks and subjected to transmission electron microscopy. An arrowhead indicates a clathrin-coated pit (CCP) at a postsynaptic terminal. Bar, 100 nm. (I and J) Quantification of the number of CCPs at postsynaptic and presynaptic terminals. Bars are mean ± SD (n = 4 experiments, in which 167, 196, 172, 191 control and 158, 161, 169, 221 Drp1exonA-KO synapses were analyzed). (K and L) The numbers of CCPs with three different morphologies (shallow, U-shaped, and Omega-shaped) were measured. Bar, 100 nm. (M–P) Control and Drp1exonA-KO hippocampal neurons were treated with 80 µM of dynasore for 30 min and analyzed by electron microscopy (M and O). Bar, 500 nm. The number of CCPs (N) and the size of mitochondria (P) were determined. Bars are mean ± SD (n = 159, 182, 172 -/control, 152, 163, 143 +/control, 176, 163, 129 -/KO, and 162, 146, 145 +/KO synapses) (N) and (n = 30–32 mitochondria analyzed in each group) (P). (Q and R) Chemical long-term depression (NMDA/Gly) was induced by NMDA for 3 min in the presence or absence dynasore (80 µM). Neurons were then fixed, and CCPs at postsynaptic and presynaptic terminals were analyzed by electron microscopy. Bars are mean ± SD (n = 3–4 experiments. In each experiment, more than 100 synapses were analyzed). Statistical analysis was performed using Student’s t-test (C, D, G, I, J, L and N) and One-way ANOVA with post-hoc Tukey (P, Q and R). (S) Summary of the data.
-
Figure 2—source data 1
The loss of Drp1ABCD blocks postsynaptic endocytosis.
- https://doi.org/10.7554/eLife.44739.007
Figure 2—figure supplement 1
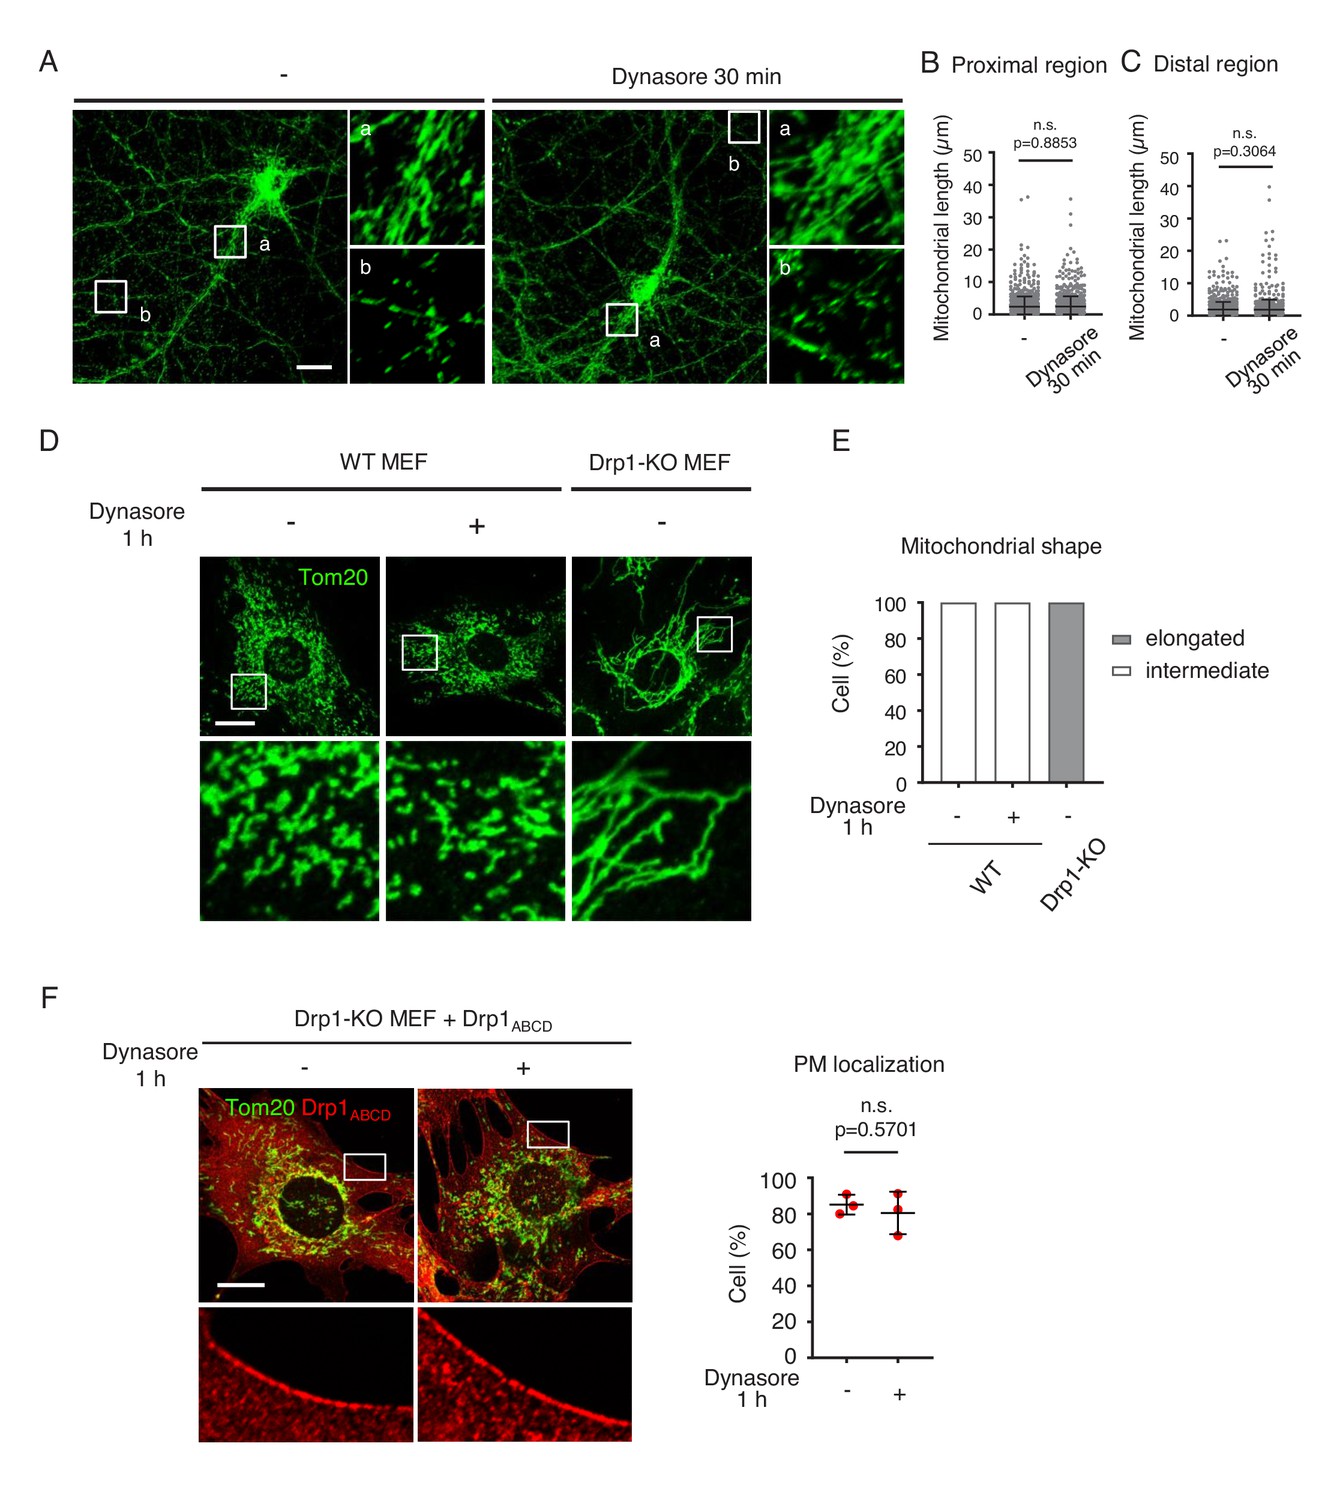
Dynasore does not affect mitochondrial morphology in cells.
(A–C) Cultured control and Drp1exonA-KO neurons were incubated with 80 µM of dynasore for 30 min and analyzed using immunofluorescence microscopy with anti-PDH antibodies. Boxed regions are enlarged: a, proximal dendritic regions and b, distal dendritic regions. Bar, 20 µm. Mitochondrial length was determined in the proximal (B) and distal dendritic regions (C). Bars are mean ± SD (n = 10 neurons analyzed in each group; 99–121 mitochondria were measured in each neuron). The statistical analysis was performed using the Student’s t-test. (D) WT MEFs were treated with 80 µM of dynasore for 1 hr and analyzed by immunofluorescence microscopy with anti-Tom20 antibodies (BD Biosciences, 61278). As a control for the loss of Drp1 function, Drp1-KO MEFs were also examined. Bar, 20 µm. (E) Mitochondrial shape is quantified (n = 30 cells).
-
Figure 2—figure supplement 1—source data 1
Data of mitochondrial length for B and C.
- https://doi.org/10.7554/eLife.44739.006
Figure 3 with 1 supplement
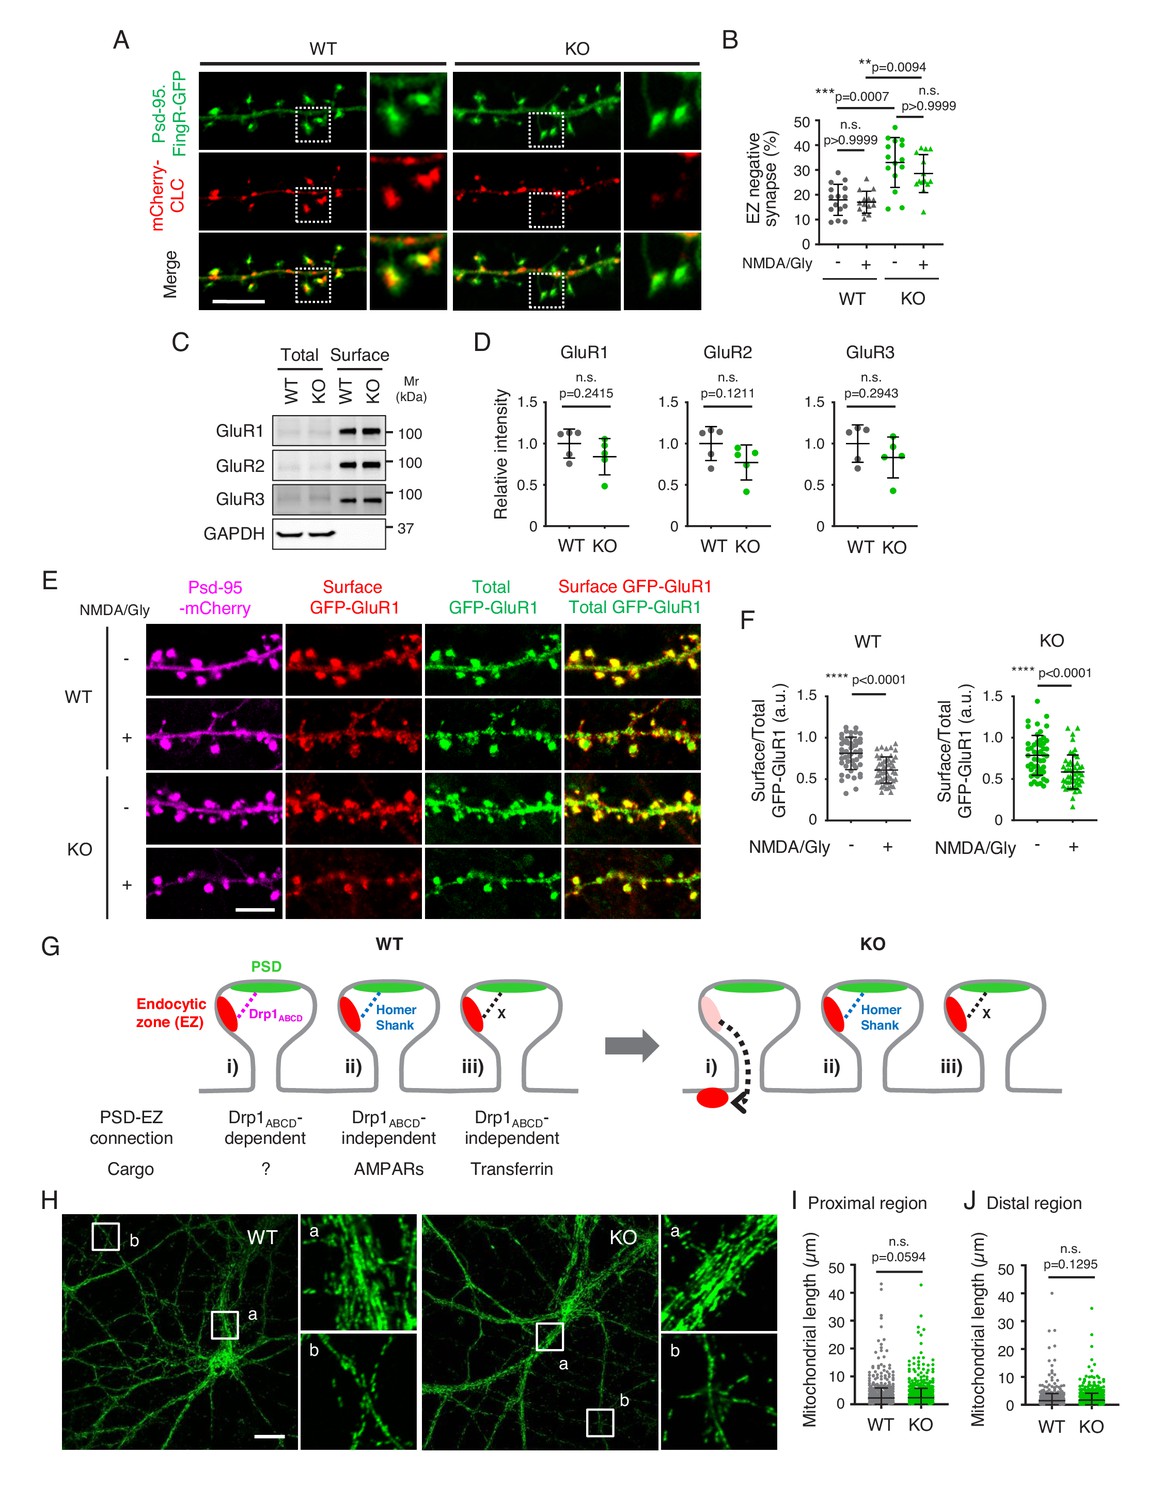
The endocytic zone is mislocalized in Drp1exonA-KO neurons.
(A and B) Hippocampal neurons were cultured and transfected with plasmids expressing Psd-95.FingR-GFP and mCherry-CLC. Two days after transfection, neurons were subjected to chemical LTD stimulation (NMDA/Gly), fixed and analyzed by laser scanning confocal microscopy. Bar, 5 µm. The number of Psd-95.FingR-GFP signals that are not associated with mCherry-CLC was scored. Bars are mean ± SD (n = 14–15 neurons were analyzed in each group). (C) Cell surface proteins were biotinylated with sulfo-NHS-SS-biotin in cultured control and Drp1exonA-KO hippocampal neurons. The neurons were lysed and incubated with NeutrAvidin agarose. Total cell lysates and precipitated proteins (Surface) were separated by immunoblotting to antibodies to GluR1, GluR2, GluR3 and GAPDH. (D) Band intensity was determined. Bars are mean ± SD (n = 5). (E) Cultured neurons were co-transfected with plasmids carrying Psd-95-mCherry and GFP-GluR1. Two days after transfection, the neurons were treated with chemical LTD (NMDA/Gly) and subjected to immunofluorescence microscopy with anti-GFP antibodies without permeabilization of the plasma membrane. Images were acquired using identical settings. (F) The relative intensity of the signal from the anti-GFP antibodies (surface GFP-GluR1) compared with the GFP signal (total GFP-GluR1) was determined. Bars are mean ± SD (n = 50). (G) Model for the function of Drp1ABCD in the postsynaptic terminal. (H–J) Control and Drp1exonA-KO hippocampal neurons were subjected to immunofluorescence microscopy with antibodies against the mitochondrial protein PDH. Boxed regions are enlarged: a, proximal dendritic regions and b, distal dendritic regions. Bar, 20 µm. The length of mitochondria was determined in proximal (I) and distal dendritic regions (J). Bars are mean ± SD (n = 10 neurons analyzed in each group. 70–120 mitochondria measured in each neuron). Statistical analysis was performed using Kruskal-Wallis test with Dunn’s multiple comparisons test (B), Mann–Whitney U test (I) and Student’s t-test (D, F and J).
-
Figure 3—source data 1
The endocytic zone is mislocalized in Drp1exonA-KO neurons.
- https://doi.org/10.7554/eLife.44739.011
Figure 3—figure supplement 1
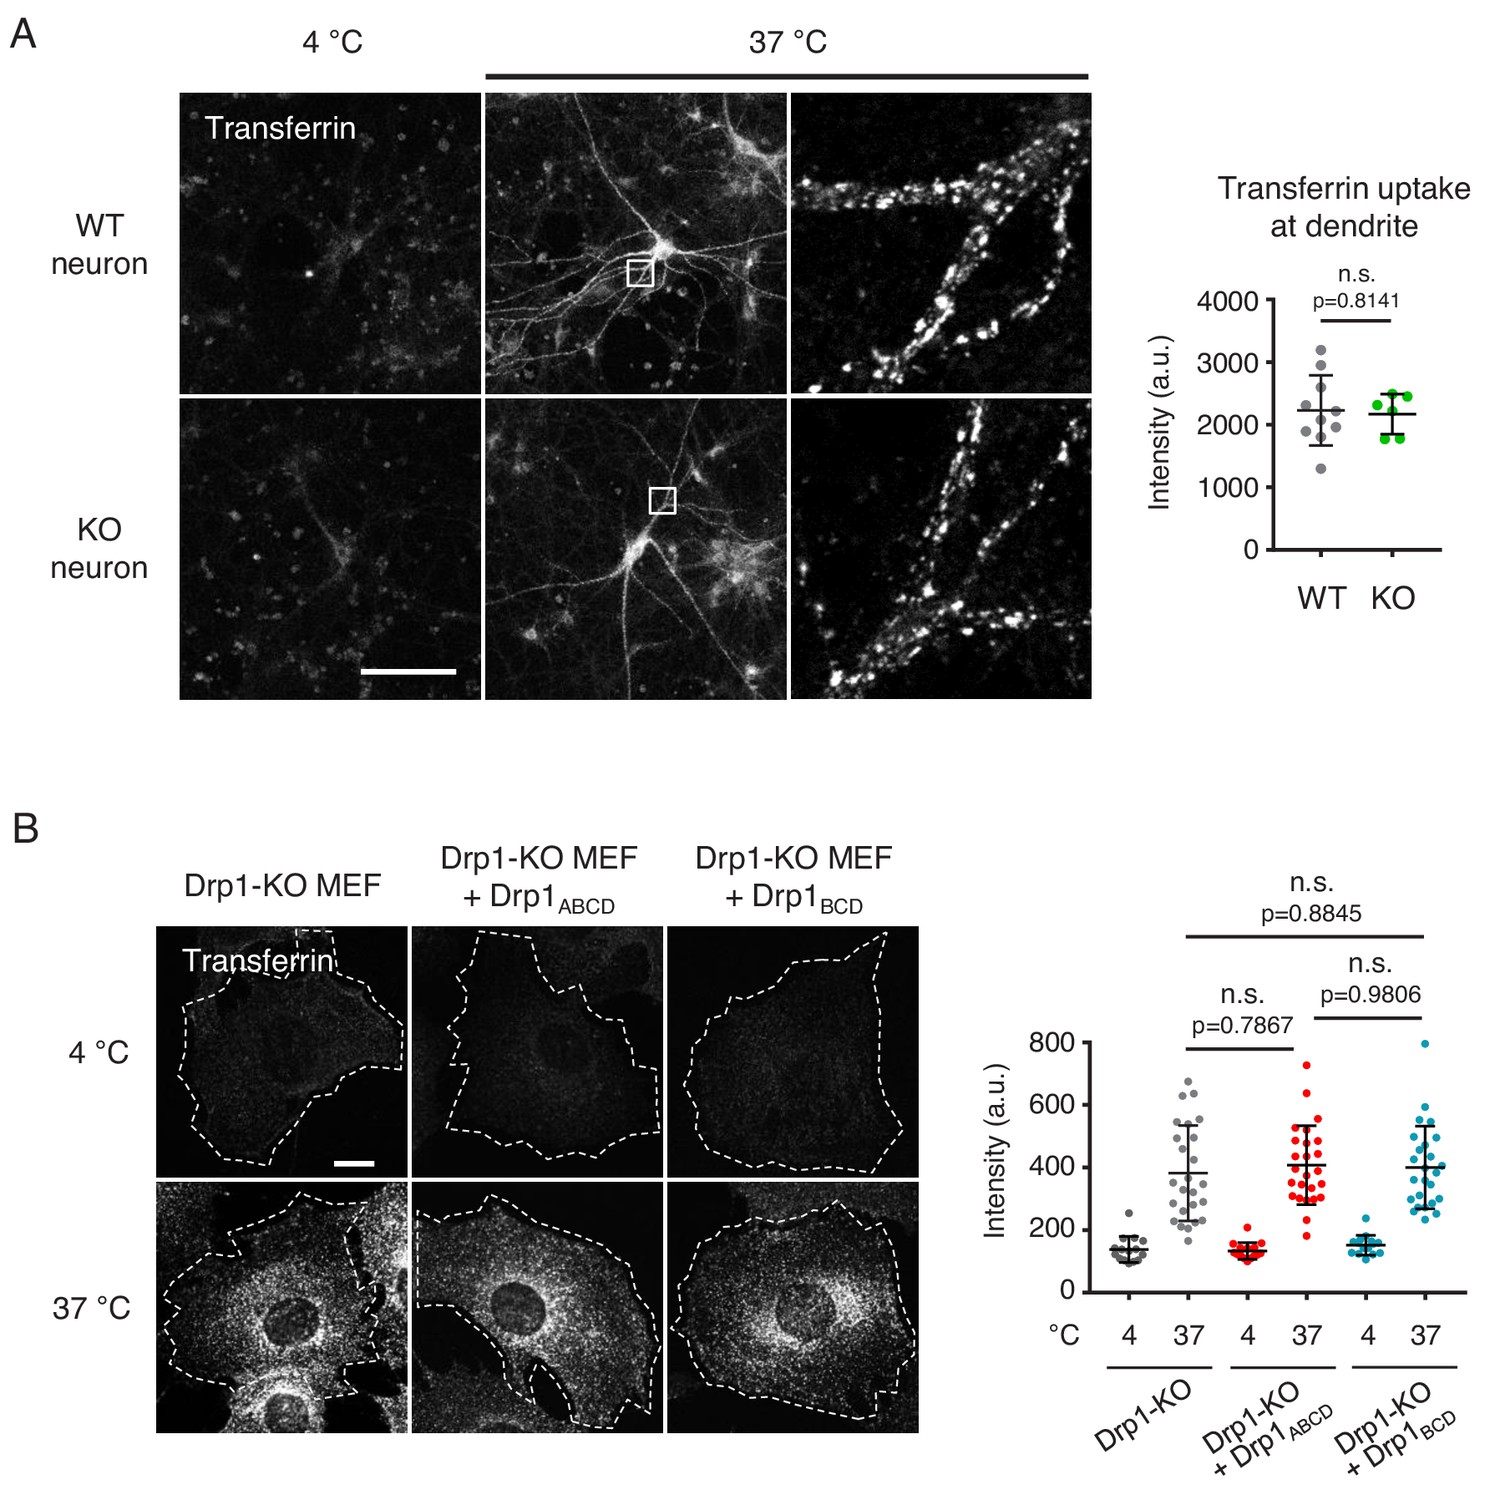
Analysis of transferrin uptake.
(A) Cultured control and Drp1exonA-KO neurons were incubated with 50 µg/ml FITC-transferrin for 15 min at 4°C or 37°C. Cells were washed with cold PBS, fixed with paraformaldehyde and viewed by confocal microscopy. Intensity of FITC signals was quantified (n = 10 control neurons and 6 KO neurons). Statistical analysis was performed using Student’s t-test. (B) Drp1-KO MEFs expressing no Drp1, Drp1ABCD or Drp1BCD were incubated with 5 µg/ml of Alexa-Fluor-647-transferrin for 30 min at 4°C or 37°C. After fixation, cells were visualized by confocal microscopy. Intensity of Alexa-Fluor-647 signals was quantified. Bars are mean ± SD (n = 15–25 cells analyzed in each group). Statistical analysis was performed using one-way ANOVA with post-hoc Tukey. (F) The localization of Drp1ABCD at the plasma membrane is insensitive to dynasore treatment. Drp1-KO MEFs were transduced with lentiviruses expressing Drp1ABCD, treated with 80 µM dynasore for 1 hr and analyzed by immunofluorescence microscopy with antibodies to Drp1 and Tom20. Bar, 20 µm. The number of cells that show the localization of Drp1ABCD at the plasma membrane was quantified (n = 3 experiments. 30–60 cells were analyzed in each experiment). Statistical analysis was performed using Student’s t-test.
-
Figure 3—figure supplement 1—source data 1
Data of transferrin uptake for A and B.
- https://doi.org/10.7554/eLife.44739.010
Figure 4 with 3 supplements
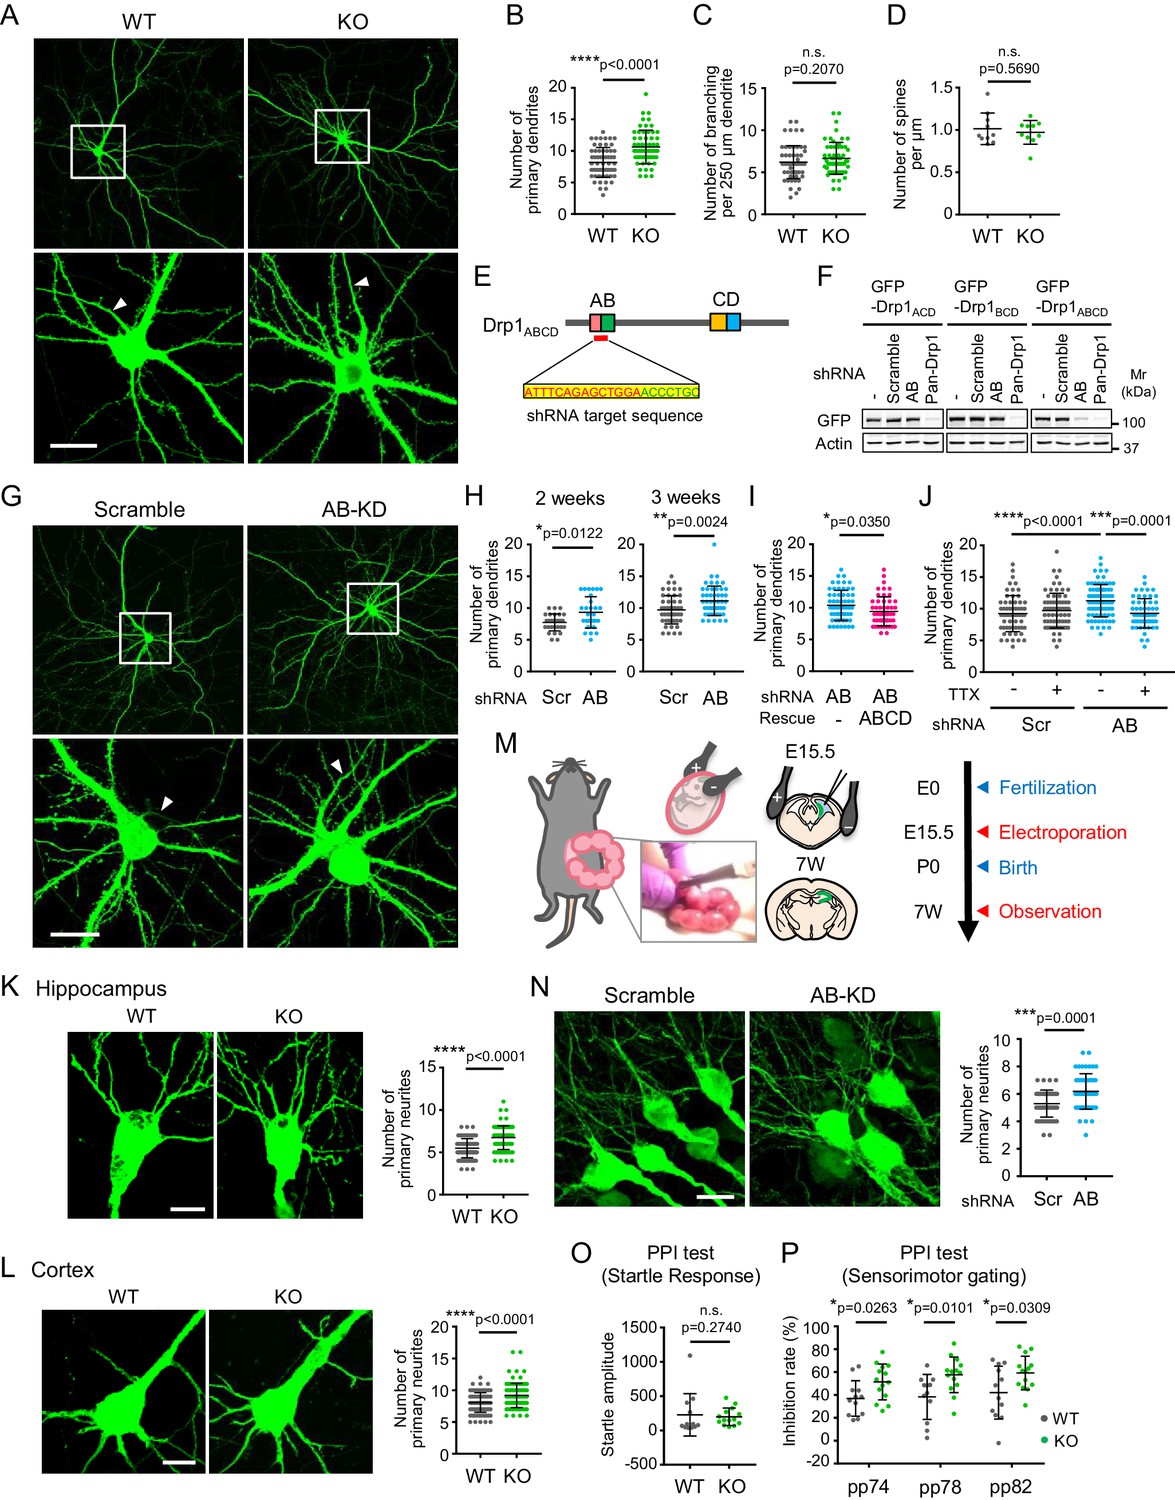
The loss of Drp1ABCD increases dendrite growth and sensorimotor gating.
(A) Control and Drp1exonA-KO hippocampal neurons were cultured and transfected with plasmids expressing GFP at 3 weeks. Boxed regions are enlarged. Arrowheads indicate axons that lack dendritic spines. Bar, 20 µm. (B and C) The numbers of primary dendrites (B) and dendritic branches (C) were quantified. Bars are mean ± SD (n = 60 control and 59 KO neurons). (D) The number of spines was quantified (n = 10 control and 10 KO neurons). (E) The DNA sequence that is targeted to knock down Drp1ABCD is shown. (F) HEK293 cells were co-transfected with plasmids carrying the indicated GFP-Drp1 and shRNAs. Whole-cell extracts were analyzed by Immunoblotting using the indicated antibodies. (G) Mouse hippocampal neurons were cultured for 2 or 3 weeks and transfected with plasmids expressing the indicated shRNAs and GFP as a cytosolic marker. Images of 3 week cultured neurons are presented. Boxed regions are enlarged. Arrowheads indicate axons that lack dendritic spines. Bar, 20 µm. (H) The number of primary dendrites were quantified. Bars are mean ± SD (n = 29–30 neurons at 2 weeks and 50 neurons at 3 weeks). (I) Cultured neurons were transfected at 3 weeks with the plasmid expressing AB-targeted shRNA and GFP along with another plasmid carrying shRNA-resistant Drp1ABCD. The number of primary dendrites was quantified. Bars are mean ± SD (n = 60 neurons for empty plasmid and 52 for Drp1ABCD). (J) Cultured hippocampal neurons were transfected with the indicated shRNA plasmids that co-express GFP in the presence or absence of 2 µM tetrodotoxin (TTX). The number of primary dendrites was quantified (n = 60 for -TTX/scramble, 75 for +TTX/scramble, 79 for -TTX/AB and 57 for +TTX/AB). (K and L) Control and Drp1exonA-KO mice were crossed with a mouse line expressing cytosolic GFP from the neuron-specific Thy1 promoter. We analyzed the number of neurites in the hippocampus (K) and cortex (L) at the age of 3–4 months. Bars are mean ± SD (n = 90 neurons in three mice for each genotype). Bar, 10 µm. (M) Plasmids carrying the indicated shRNAs were introduced into the hippocampi of E15.5 mouse embryos, along with plasmids carrying GFP, by electroporation in utero. (N) Hippocampi were analyzed at an age of 7 weeks using laser confocal microscopy of frozen brain sections. Bar, 20 µm. The number of neurites that directly emerge from the soma was quantified. Bars are mean ± SD (n = 51 neurons for scramble and 56 for AB-targeted). (O and P) Startle response (O) and PPI tests (P). Bars are mean ± SD (n = 12 control and 14 KO mice). Statistical analysis was performed using Student’s t-test (B, C, D. H-3 weeks, I, K, N and P), Mann–Whitney U test (H-2 weeks, L and O) and One-way ANOVA with post-hoc Tukey (J).
-
Figure 4—source data 1
The loss of Drp1ABCD increases dendrite growth and sensorimotor gating.
- https://doi.org/10.7554/eLife.44739.018
Figure 4—figure supplement 1
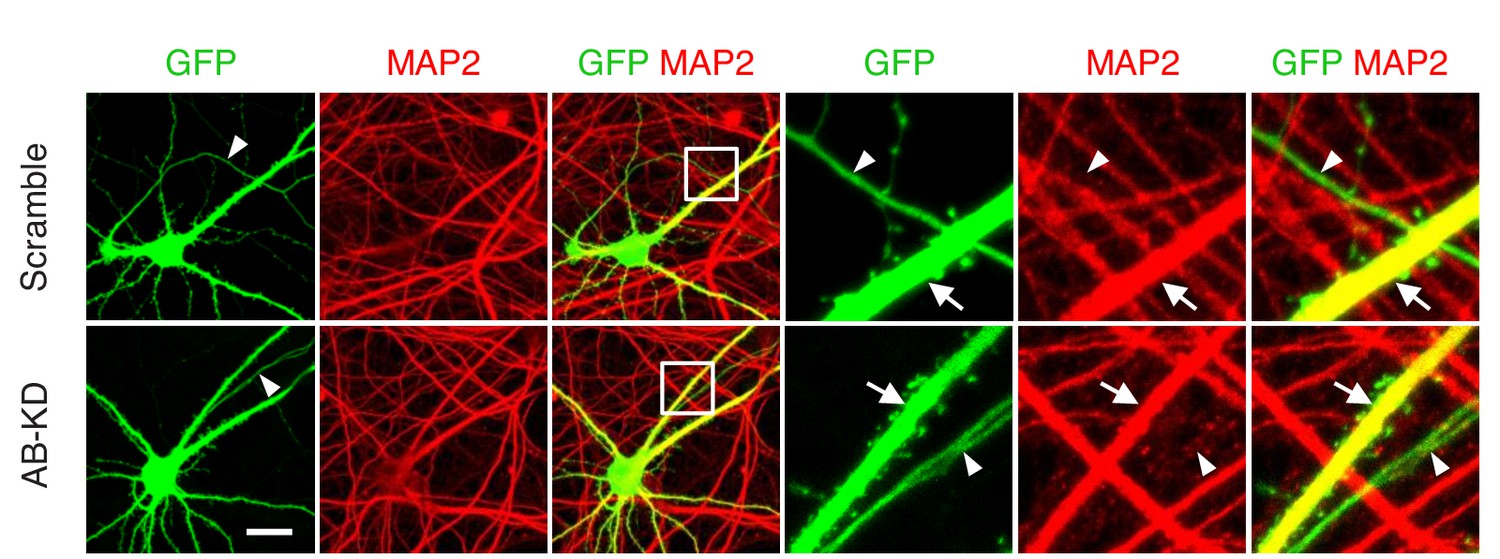
The number of axons is not affected by Drp1ABCD knockdown.
Cultured hippocampal neurons were transfected at 3 weeks with the indicated shRNA plasmids carrying GFP as a cytosolic marker. Cells were subjected to immunofluorescence microscopy with anti-MAP2 antibodies. Arrowheads indicate axons, and arrows indicate dendrites. Bar, 20 µm.
Figure 4—figure supplement 2
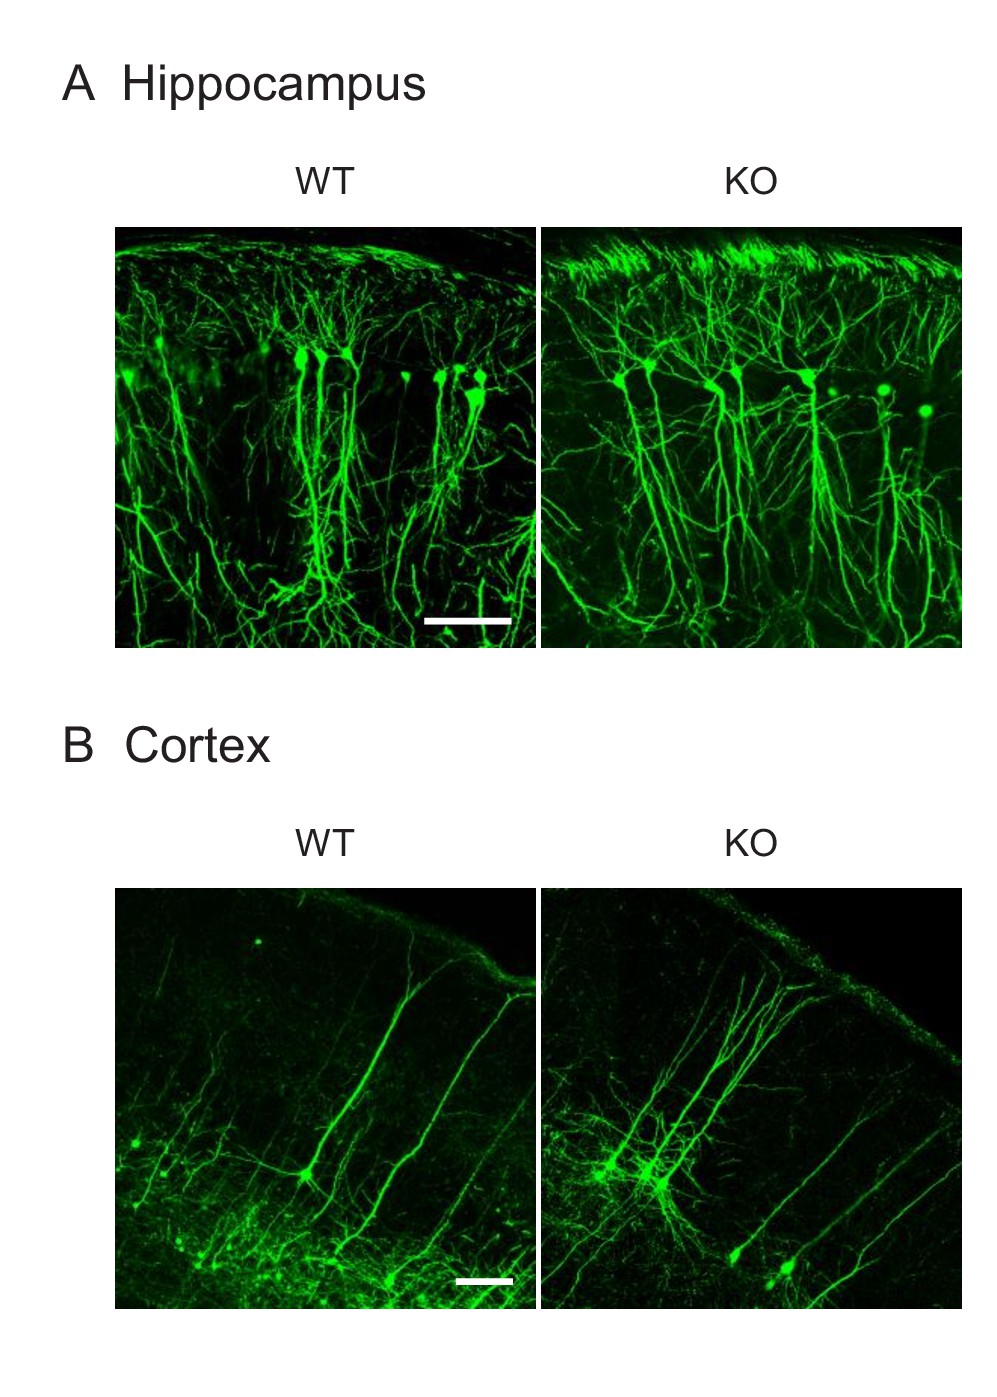
The expression of GFP from the Thy1 promoter.
Frozen section of the hippocampus (A) and cortex (B) in control and Drp1exonA-KO mice expressing cytosolic GFP from the neuron-specific Thy1 promoter are shown. Bar, 100 µm.
Figure 4—figure supplement 3
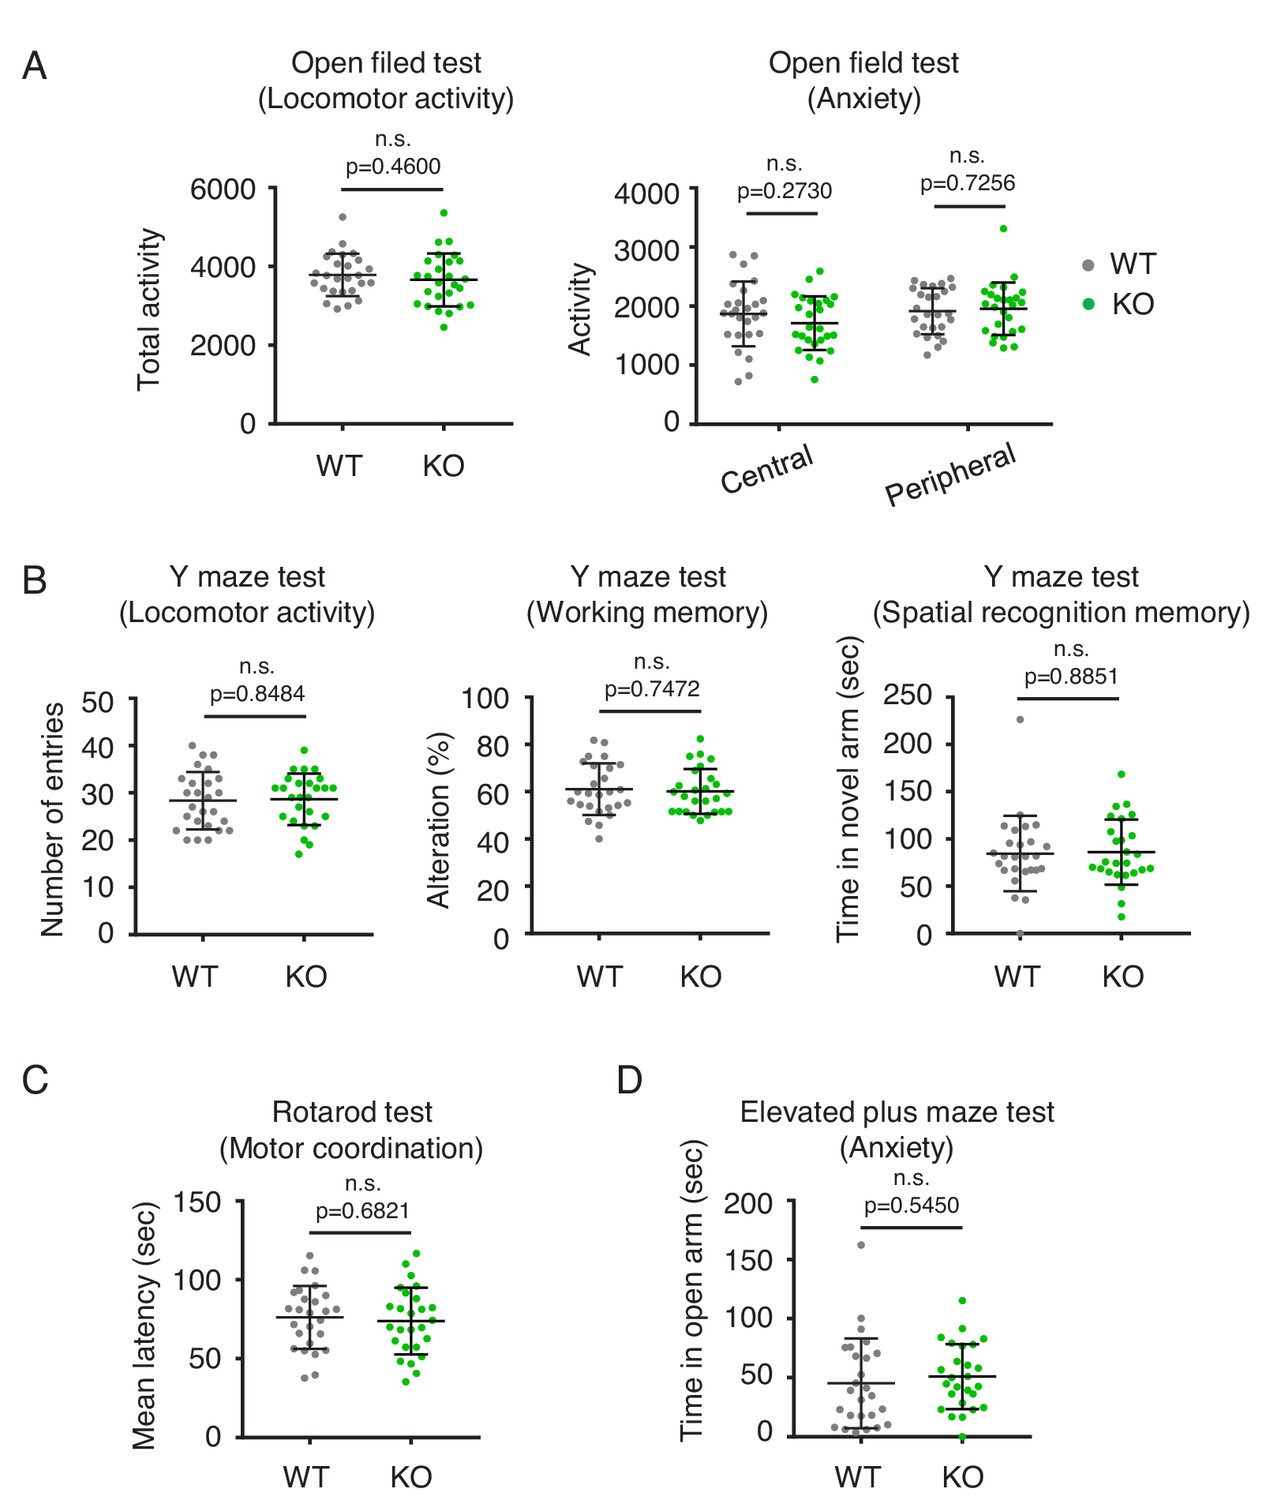
Behavior analysis of Drp1exonA-KO mice.
(A) Open field test. Total activity (Locomotor activity) and percentage time spent in the central and peripheral regions (Anxiety). (B) Y-maze tests. Number of arm entries (Locomotor activity), spontaneous alternation (Working memory), and time in novel arm (Spatial recognition memory) were determined. (C) Rotarod test. (D) Elevated plus maze tests. Bars are mean ± SD (n = 26 control and 26 Drp1exonA-KO mice). Statistical analysis was performed using Student’s t-test. Source Data File List for Figures (file name).
-
Figure 4—figure supplement 3—source data 1
Data of behavior tests.
- https://doi.org/10.7554/eLife.44739.017
Tables
Key resources table
| Reagent type (species) or resource | Designation | Source or reference | Identifiers | Additional information |
|---|---|---|---|---|
| Genetic reagent (M. musculus) | Wild-type mice | This paper | Materials and methods: Generation of Drp1exonA-KO mice using CRISPR/Cas9 | |
| Genetic reagent(M. musculus) | Drp1exonA-KO mice | This paper | Materials and methods: Generation of Drp1exonA-KO mice using CRISPR/Cas9 | |
| Genetic reagent(M. musculus) | Thy1-GFP-M transgenic mice | Jackson Laboratory | Stock #: 007788 | |
| Genetic reagent(M. musculus) | C57BL/6J mice | JacksonLaboratory | Stock #: 000664 | |
| Cell line (M. musculus) | WT and Drp1-KO MEFs | Kageyama et al. (2014) | ||
| Antibody | Rabbit polyclonal anti-exon AB | Itoh et al. (2018) | WB (1:2000) | |
| Antibody | Mouse monoclonal anti-Psd-95 | EMD Millipore | Cat #: MABN68 | WB (1:2000) |
| Antibody | Mouse monoclonal anti-pan-Drp1 | BD Biosciences | Cat #: 611113 | WB (1:2000) |
| Antibody | Mouse monoclonal anti-PDH subunit E2/E3bp | Abcam | Cat #: ab110333 | IF (1:300) |
| Recombinant DNA reagent | HA-Drp1ABCD | Itoh et al. (2018) | ||
| Recombinant DNA reagent | HA-Drp1BCD | Itoh et al. (2018) | ||
| Recombinant DNA reagent | Psd95.FingR-GFP | Addgene | Cat #: 46295 | Gross et al. (2013) |
| Recombinant DNA reagent | mCherry-Clathrin (CLC) | Addgene | Cat #: 27680 | |
| Recombinant DNA reagent | Psd-95-mCherry | Blanpied et al. (2008) | ||
| Recombinant DNA reagent | GFP-GluR1 | Hussain et al. (2014) | ||
| Recombinant DNA reagent | pSUPER-Scramble | This paper | Materials and methods: Plasmids | |
| Recombinant DNA reagent | pSUPER-AB | This paper | Materials and methods: Plasmids | |
| Recombinant DNA reagent | pSUPER-GFP-Scramble | This paper | Materials and methods: Plasmids | |
| Recombinant DNA reagent | pSUPER-GFP-AB | This paper | Materials and methods: Plasmids | |
| Recombinant DNA reagent | pCAGGS1-Drp1ABCD(resistant form) | This paper | Materials andmethods: Plasmids | |
| Chemical compound, drug | Dynasore hydrate | Sigma-Aldrich | Cat #: D7693 | |
| Chemical compound, drug | NMDA | Tocris | Cat #: 0114 | |
| Chemical compound, drug | Glycine | Tocris | Cat #: 0219 | |
| Chemical compound, drug | Tetrodotoxin (TTX) | Tocris | Cat #: 1078 |
Additional files
-
Transparent reporting form
- https://doi.org/10.7554/eLife.44739.019
Download links
A two-part list of links to download the article, or parts of the article, in various formats.
Downloads (link to download the article as PDF)
Open citations (links to open the citations from this article in various online reference manager services)
Cite this article (links to download the citations from this article in formats compatible with various reference manager tools)
Brain-specific Drp1 regulates postsynaptic endocytosis and dendrite formation independently of mitochondrial division
eLife 8:e44739.
https://doi.org/10.7554/eLife.44739


