Translational regulation of protrusion-localized RNAs involves silencing and clustering after transport
- National Cancer Institute, National Institutes of Health, United States
- Hiroshima University, Japan
- RIKEN Center for Biosystems Dynamics Research, Japan
Figures
Figure 1
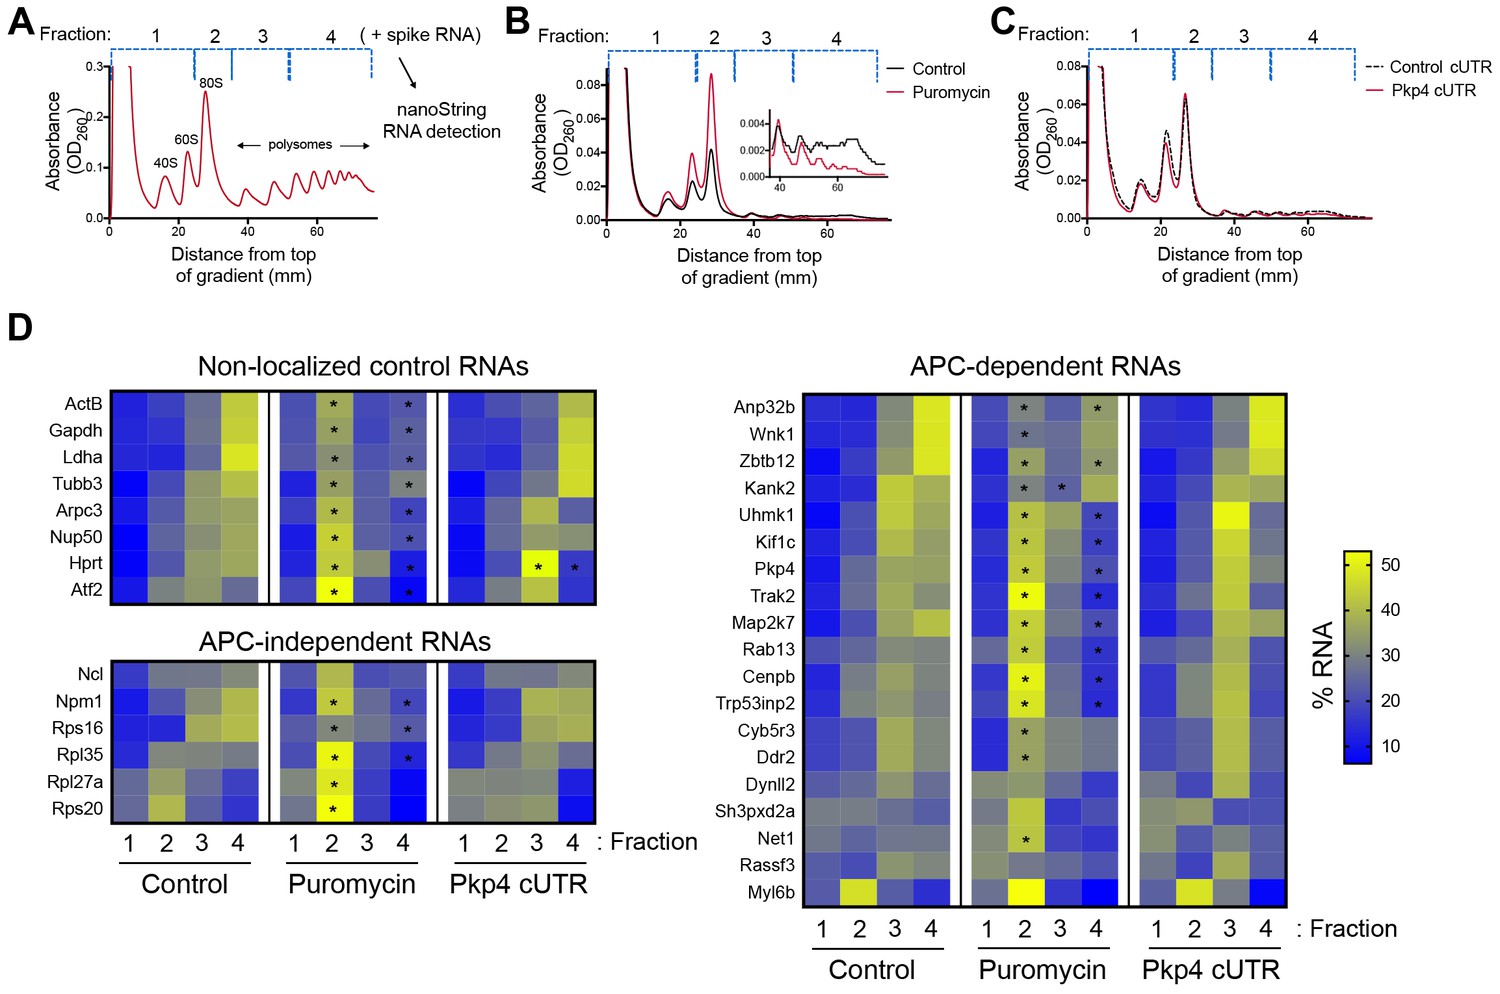
Disrupting localization of APC-dependent RNAs, through competition, does not alter their translation.
(A) Outline of experimental procedure. Sucrose gradients are divided into four fractions based on UV absorbance, an equal amount of spike RNA is added to each, and RNA presence is quantitatively assessed with nanoString analysis. (B, C) Representative absorbance profiles of polysome gradients of control, puromycin treated (B) or Pkp4-cUTR-expressing cells (C). Inset in (B) shows an enlargement of the polysome region. (D) Heat maps showing RNA presence in polysome gradient fractions, based on nanoString analysis, under the indicated conditions. Gene names are shown on the left. Values indicate averages of 3 independent experiments. Statistically significant differences compared to the corresponding control fractions are indicated by asterisks (2-way ANOVA with Dunnett’s multiple comparisons test).
-
Figure 1—source data 1
File containing values used for generation of the heatmaps and statistics of Figure 1D.
- https://doi.org/10.7554/eLife.44752.003
Figure 2
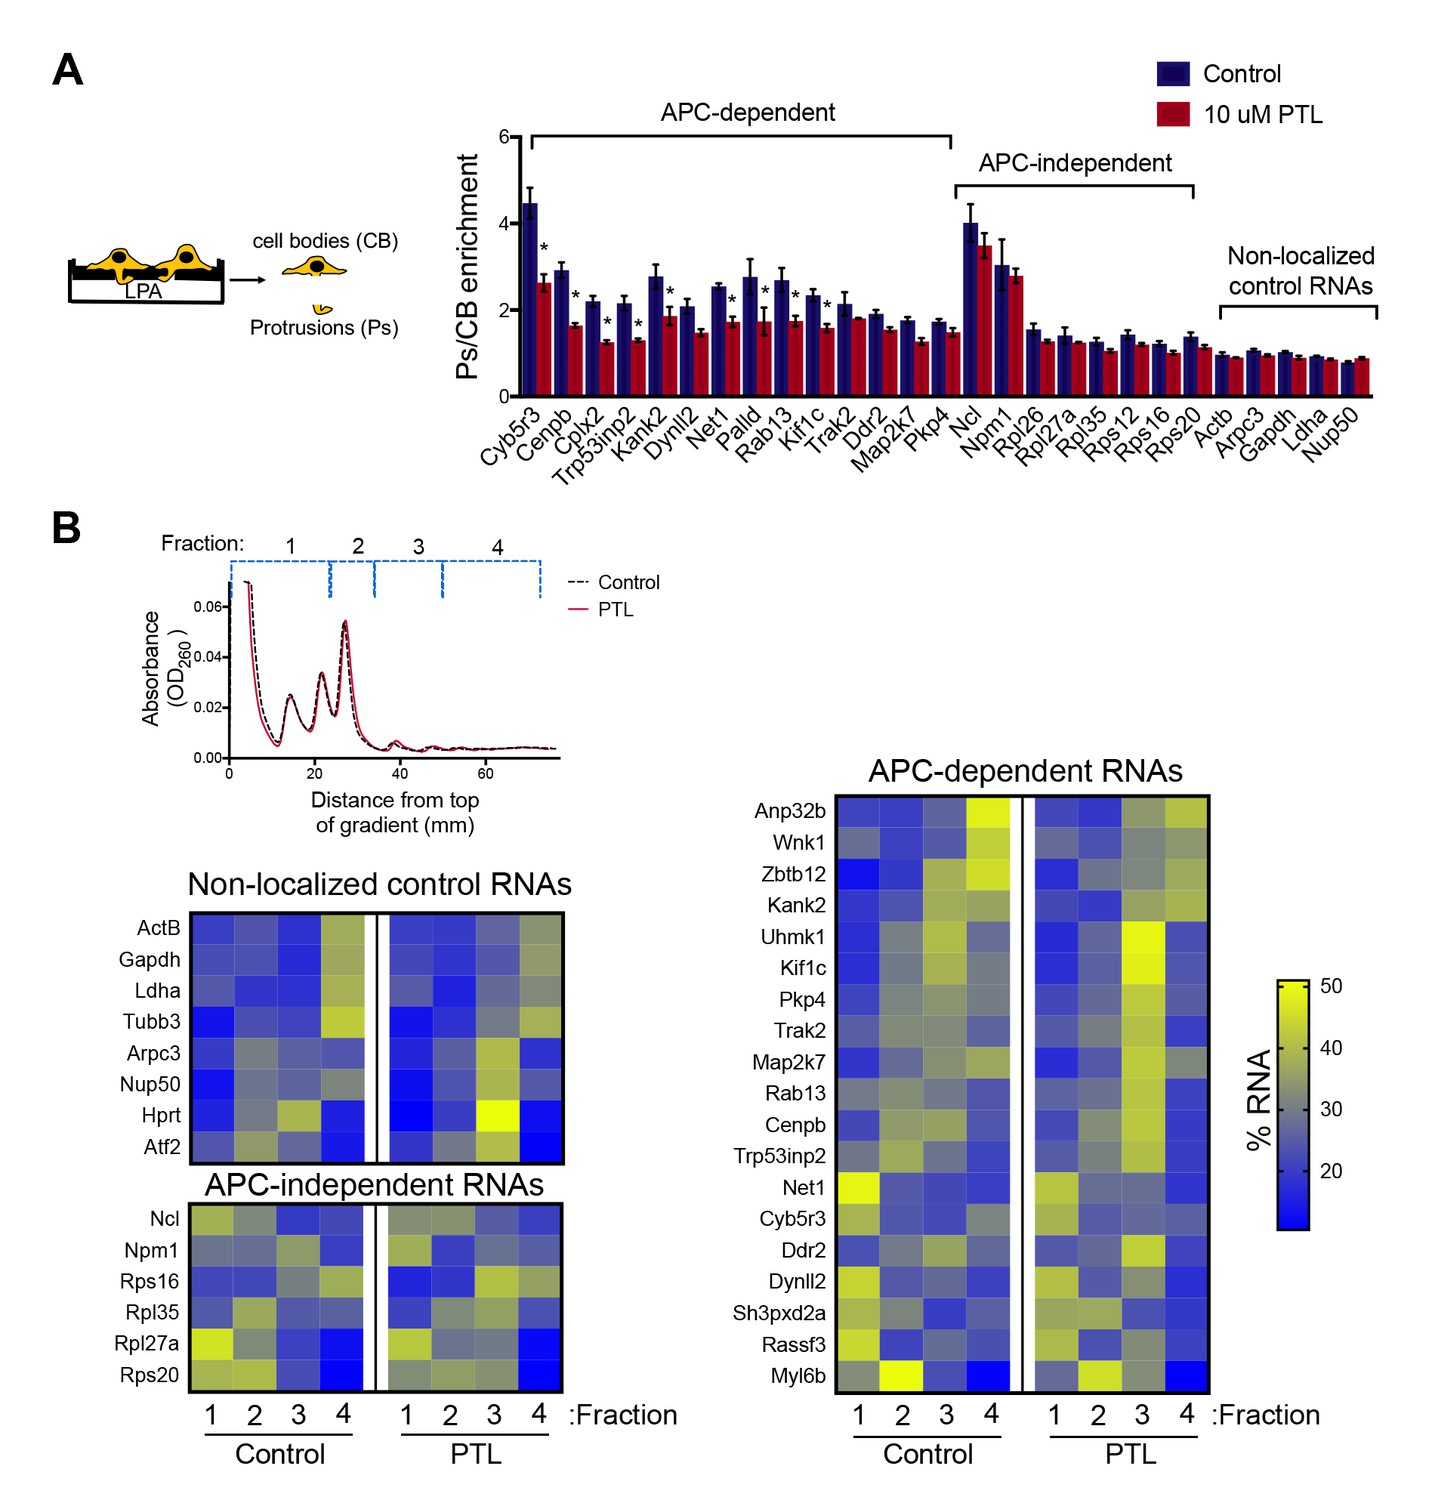
Disrupting localization of APC-dependent RNAs, through perturbation of detyrosinated microtubules, does not alter their translation.
(A) Schematic on the left indicates experimental procedure used for isolation of protrusions. Migration of cells through microporous filters was induced by addition of LPA and protrusion (Ps) and cell body (CB) samples were isolated from control or parthenolide (PTL) treated cells. The indicated RNAs were detected through nanoString analysis to calculate Ps/CB enrichment ratios (n = 3; error bars: standard error). *: p-value<0.04 by two way ANOVA with Bonferroni’s multiple comparisons test against the corresponding control. Parthenolide treatment specifically reduces the enrichment of APC-dependent RNAs at protrusions. (B) Representative absorbance profiles of polysome gradients of control and PTL-treated cells, and heat maps showing RNA presence in polysome gradient fractions, based on nanoString analysis. Gene names are shown on the left. Values indicate averages of 3 independent experiments. No statistically significant differences were detected by 2-way ANOVA with Dunnett’s multiple comparisons test against the corresponding control fractions.
-
Figure 2—source data 1
File containing values used for generation of the heatmaps and statistics of Figure 2B.
- https://doi.org/10.7554/eLife.44752.005
Figure 3 with 1 supplement
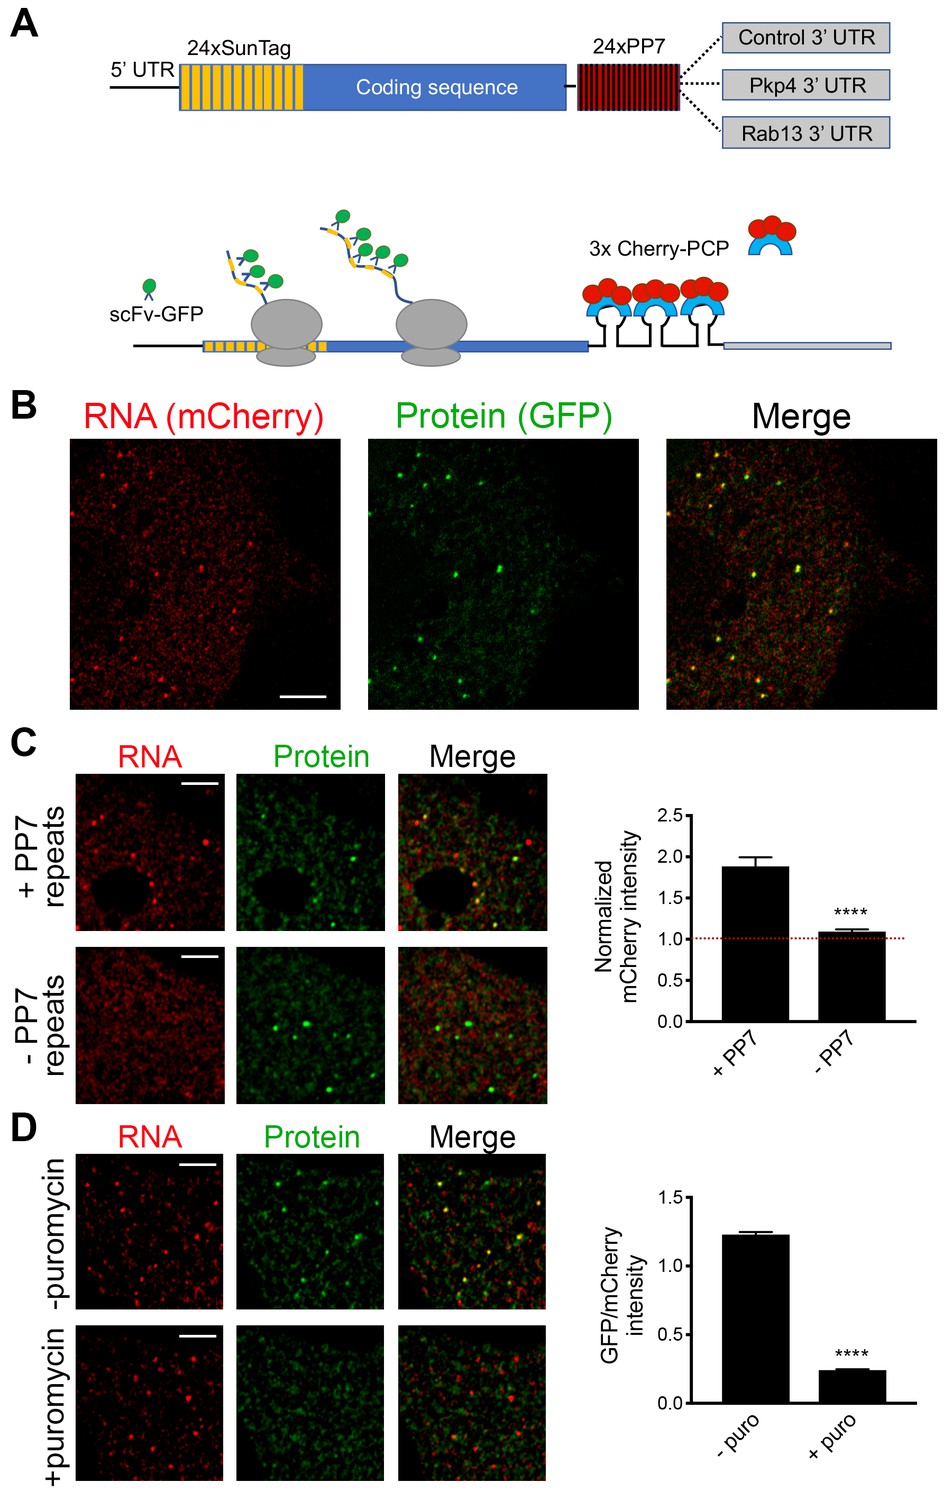
Validation of single-molecule translation reporter assay.
(A) Schematic of translation reporter constructs for labeling of RNA and nascent protein chains. (B) Live cell imaging snapshot of a cell expressing the control translation reporter. The mCherry channel detects the 3x-mCherry-PCP protein. Bright spots correspond to RNA molecules. Diffuse signal results from free 3x-mCherry-PCP. The GFP channel detects the scFv-GFP antibody. Bright spots overlap with RNA spots (merge image) and correspond to nascent protein at translation sites. Diffuse signal results from free scFv-GFP or scFv-GFP bound to the reporter protein released after translation. (C) Cells expressing the control translation reporter, containing PP7 repeats (+PP7), or a reporter without PP7 repeats (-PP7), were imaged live. mCherry intensity overlapping with translation sites (GFP spots) was measured and normalized to the intensity observed in nearby cytoplasmic regions with diffuse signal. Value of 1 indicates that there is no mCherry concentration at translation sites. (D) The same cytoplasmic areas, of cells expressing the control translation reporter, were imaged before and after puromycin addition. GFP/mCherry intensity of individual spots was calculated as a measure of translational efficiency. n > 100 (C) and n > 500 (D) spots from multiple cells observed in three independent experiments; error bars: standard error; ****: p-value<0.0001 by Student’s t-test. Scale bars: 5 μm.
Figure 3—figure supplement 1
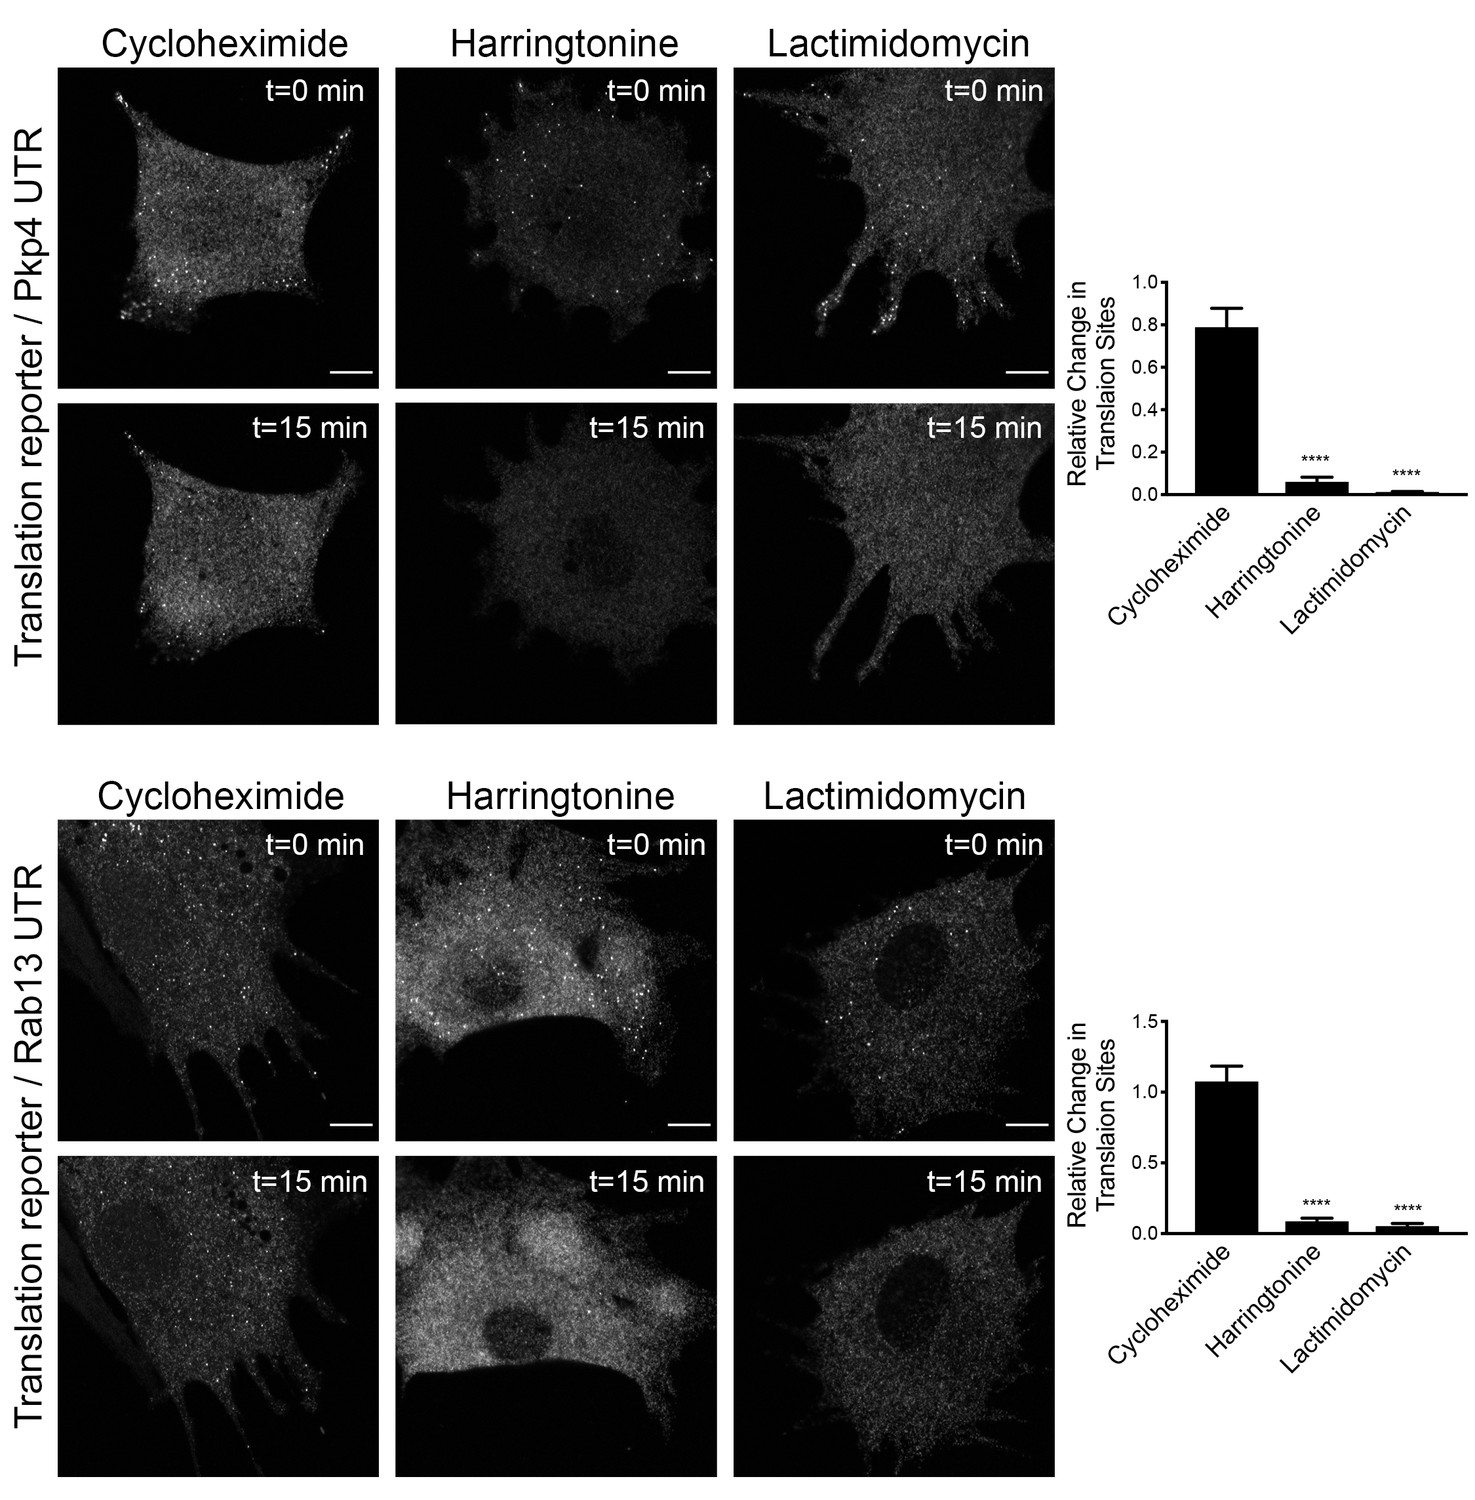
Translation signal of localized reporters reflects active translation.
Cells expressing the indicated translation reporters were imaged just prior to (t = 0 min), or 15 min (t = 15 min) after, addition of the translation inhibitors cycloheximide, harringtonine or lactimidomycin. Graphs indicate the relative change in number of detectable translation sites (one indicating no change). n = 13–17 cells per condition. error bars: standard error; ****: p-value<0.0001 by one way ANOVA with Tukey’s multiple comparisons test. Scale bars: 10 μm.
Figure 4 with 3 supplements
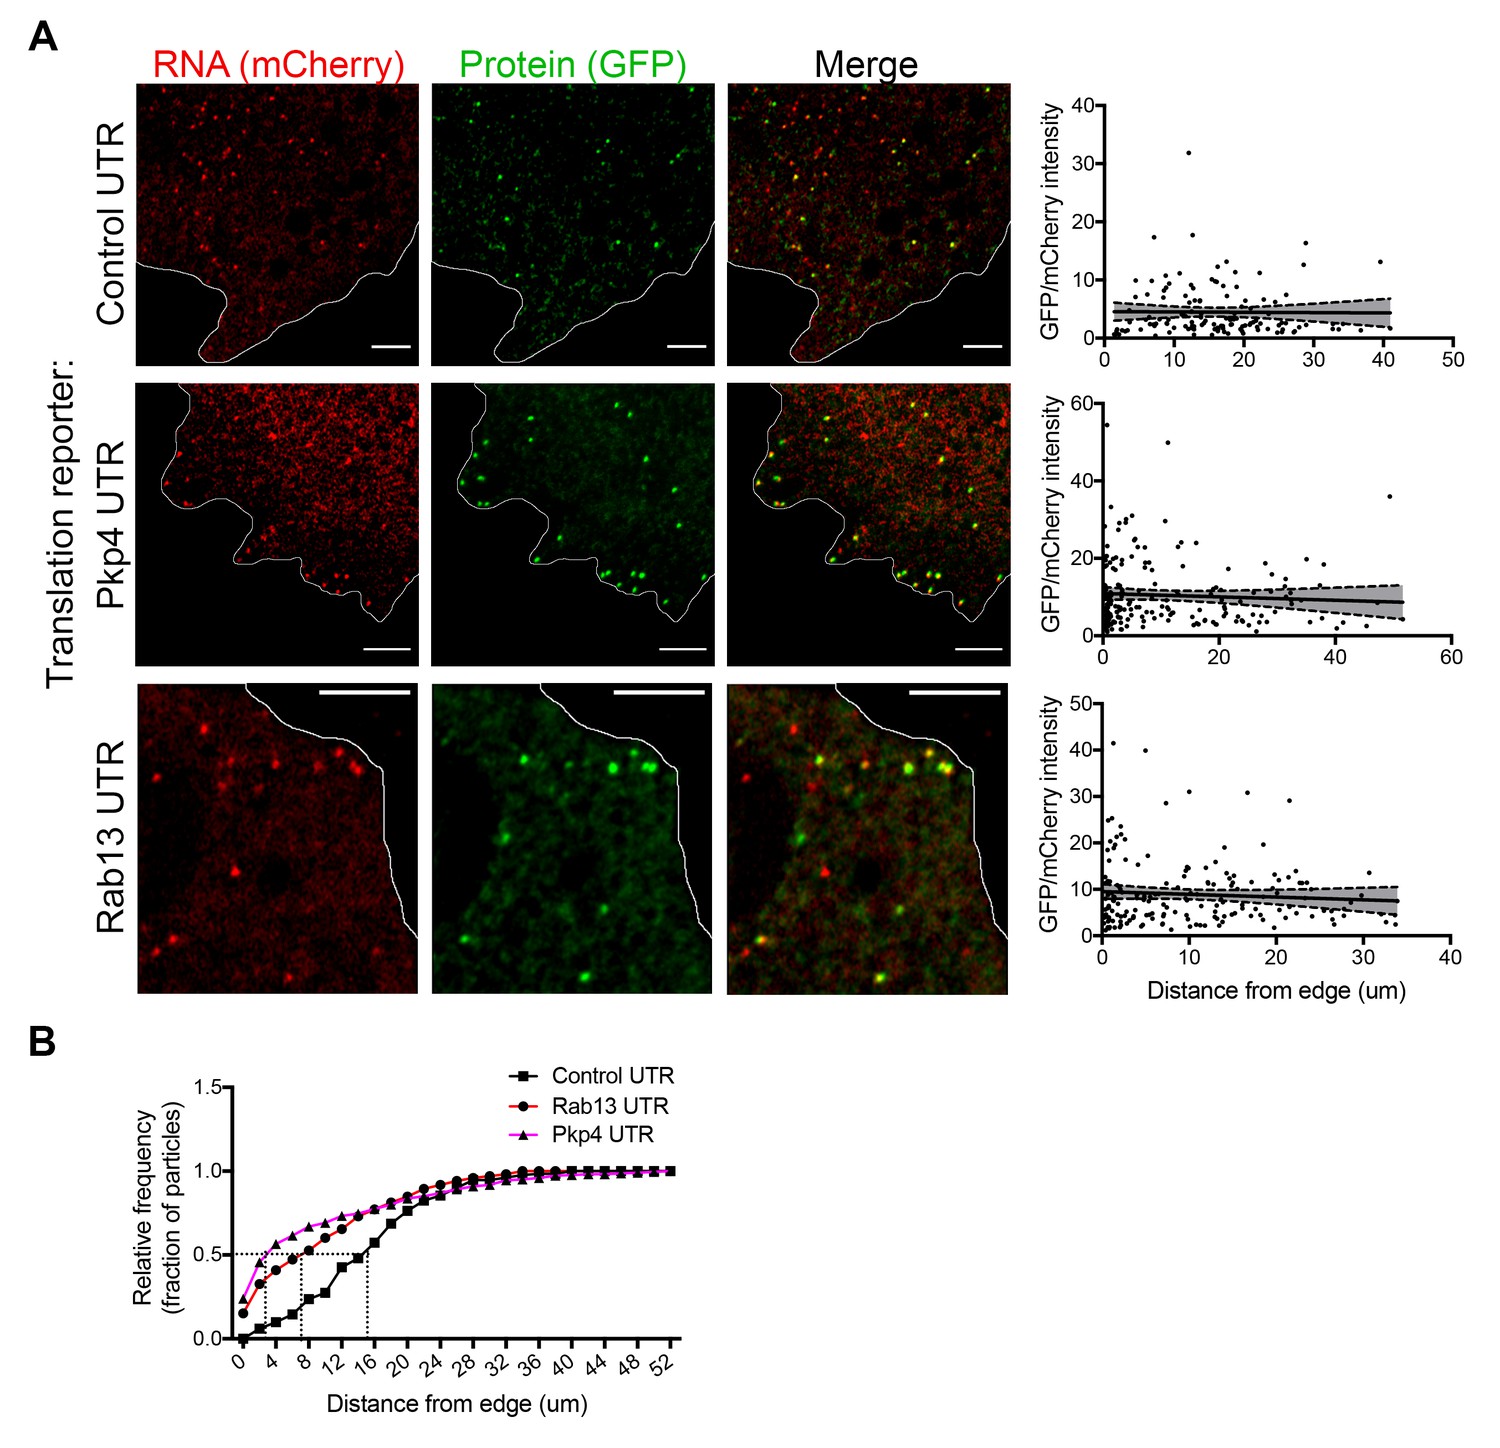
RNAs targeted to protrusions are similarly translated in both internal and peripheral locations.
(A) Live imaging snapshots of cells expressing the indicated translation reporters. GFP/mCherry intensity of individual spots (indicating translation efficiency) was plotted as a function of distance from the cell edge. More than 200 particles were analyzed from approximately 20 cells. Best fit curves with 95% confidence intervals are overlaid on the graphs. Scale bars: 5 μm. (B) Cumulative frequency distribution plot of translation reporter particles (from panel A) with increasing distance from the cell edge.
Figure 4—figure supplement 1

Expression levels of translation reporters and comparison with live-cell imaging.
(A) In situ hybridization of cells expressing the indicated translation reporters in the absence or presence of doxycycline. Scale bars: 5 μm. Red line:cell outline. (B) Comparison of the number of translation reporter particles detected per cell, after doxycycline addition, by in situ hybridization or live-cell imaging. Expression levels, assessed by FISH, are not significantly higher than endogenous APC-dependent RNAs (compare to values presented in Figure 5—figure supplement 2). Fewer particles are detected by live-cell imaging likely indicating that fast-moving particles cannot be resolved with our current acquisition methods.
Figure 4—figure supplement 2
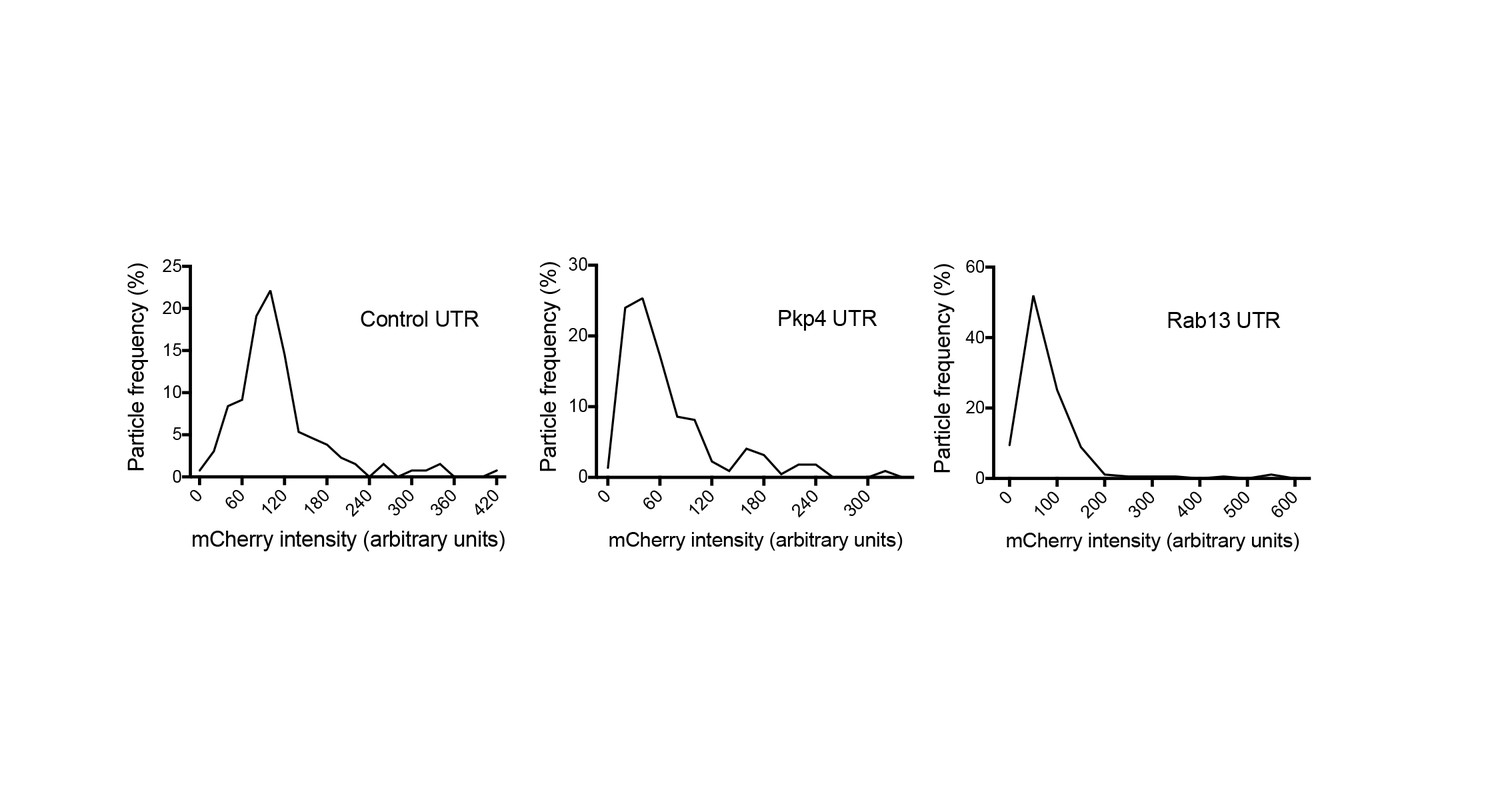
Intensity histograms of translation reporter particles.
Frequency distribution plots of mCherry intensities exhibited by particles of the indicated translation reporters. The existence of a single major peak suggests that the majority of observed particles are single molecules.
Figure 4—figure supplement 3
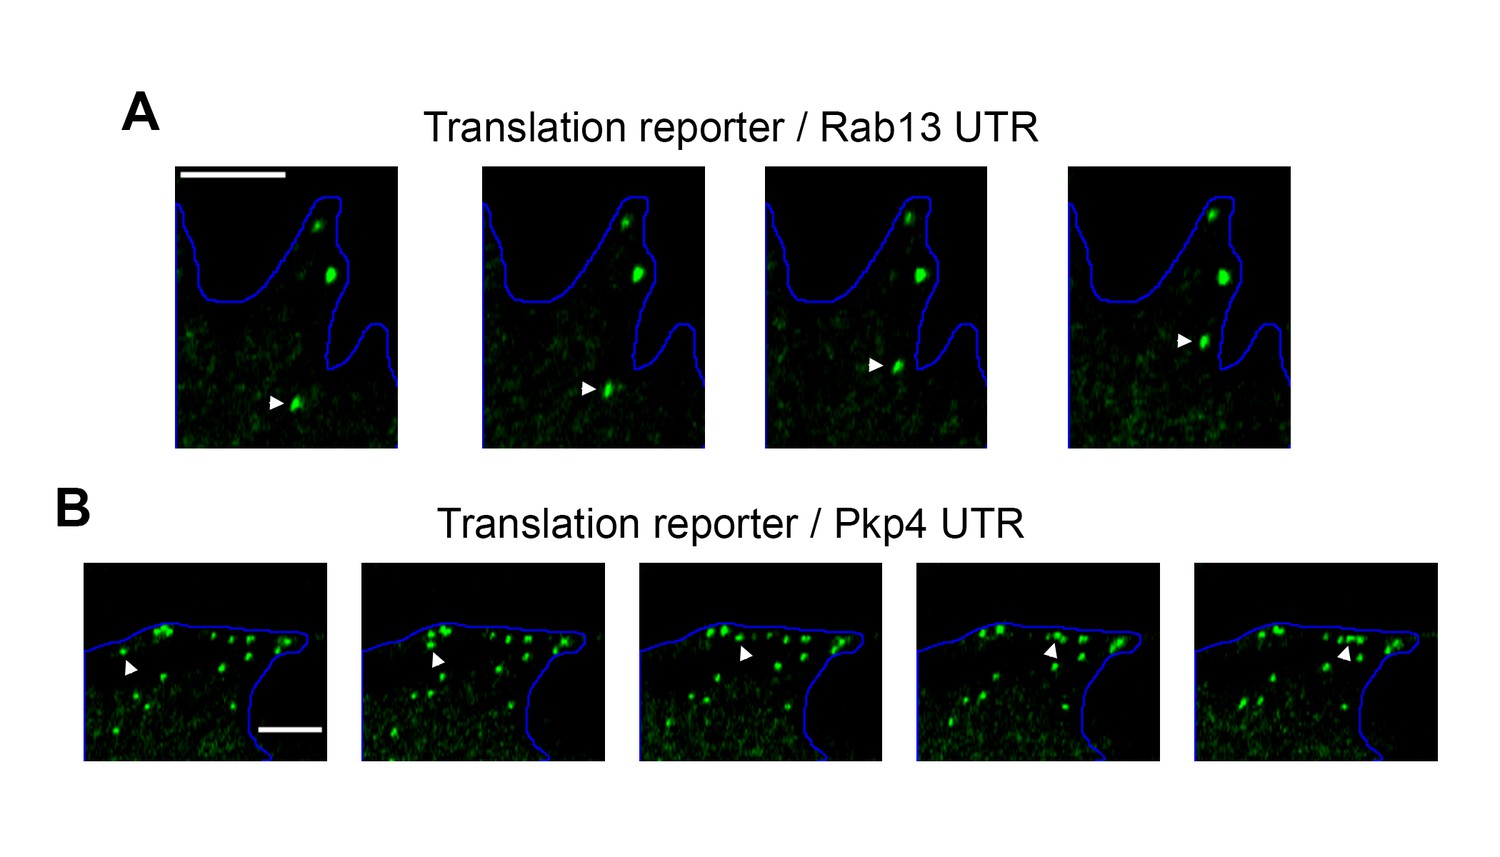
Examples of directionally persistent particles.
(A, B) Snapshots of time lapse imaging of cells expressing the indicated localized translation reporters. The GFP channel was recorded showing translated RNAs. Arrowheads point to particles that move in a directionally persistent manner during the time of observation. Scale bars: 3 μm. Full length movies of these samples are presented in Video 5 (A) and Video 6 (B).
Figure 5 with 3 supplements
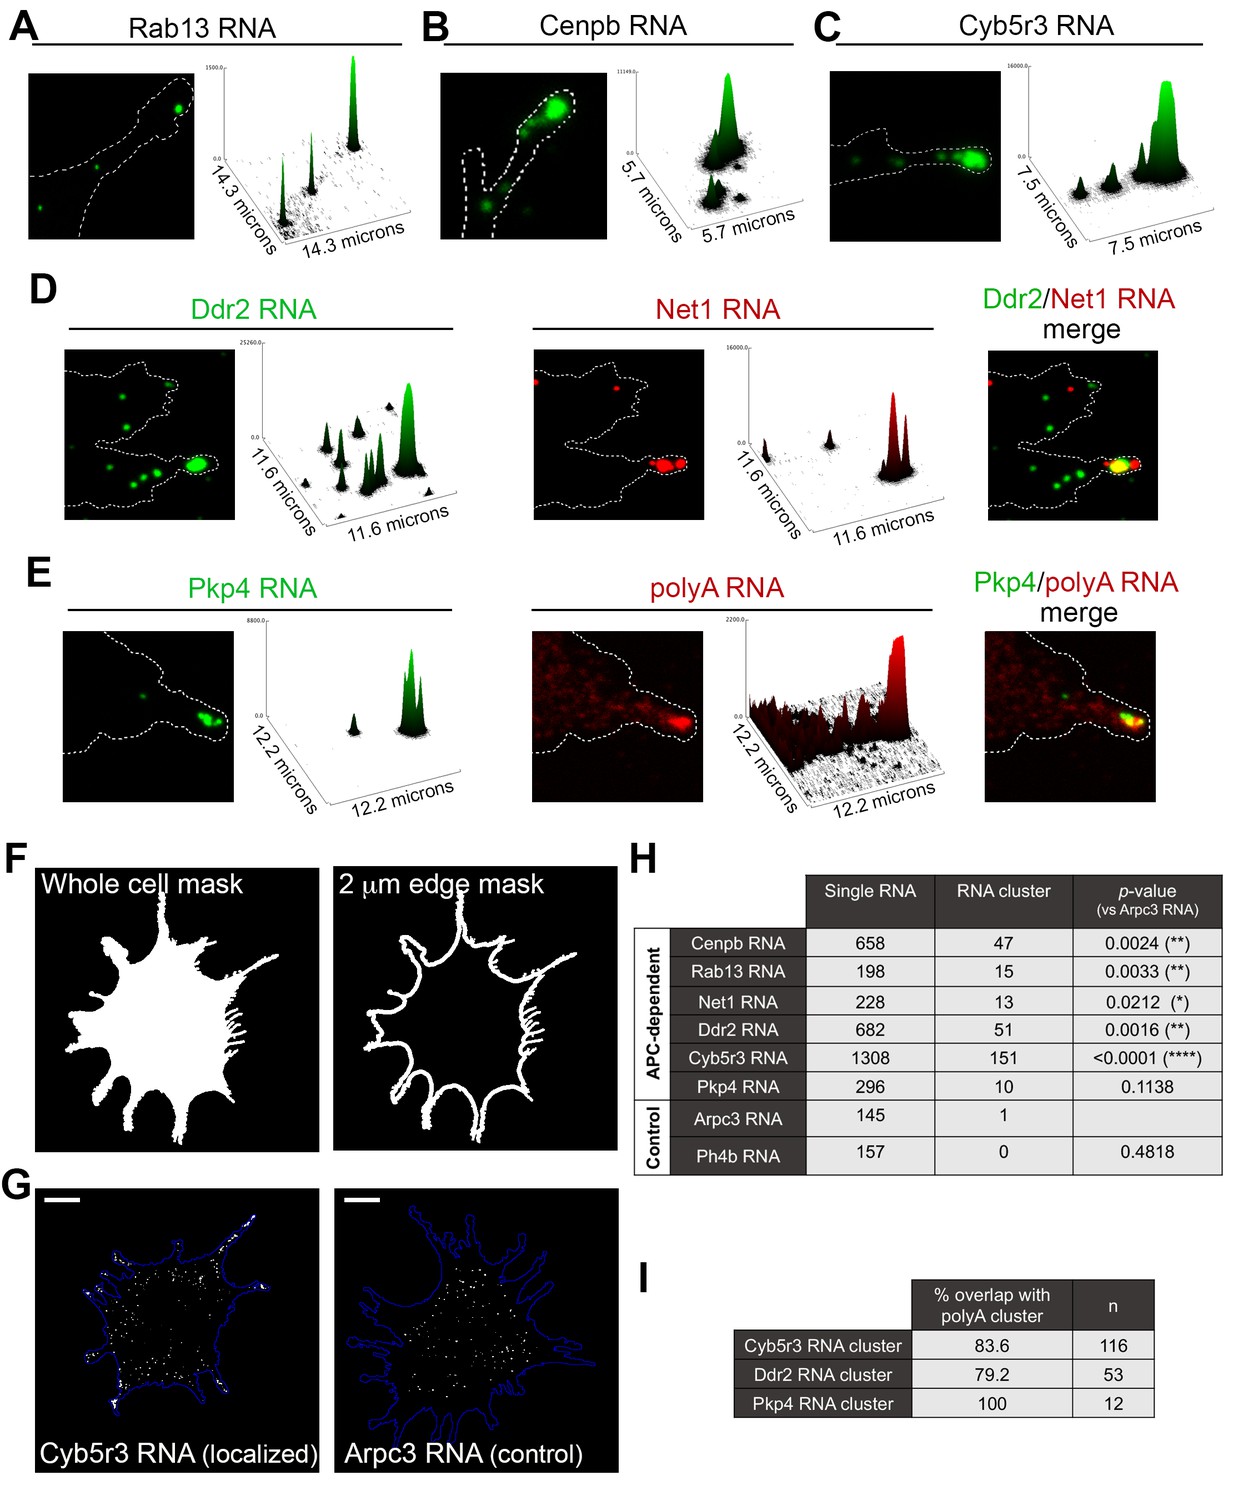
APC-dependent RNAs associate with heterogeneous clusters at the tips of protrusions.
(A-C) The indicated endogenous RNAs were detected by in situ hybridization. Signal intensities of observed spots are shown in the associated surface plot profiles, which also indicate the size of each image in microns. In internal regions all detected RNAs exist as single molecules. At the tips of protrusions, they exist in clusters of multiple RNAs. (D) In situ hybridization images and surface plot profiles of endogenous Ddr2 and Net1 RNAs detected in the same cell. Peripheral clusters can contain distinct RNA species. (E) In situ hybridization images and surface plot profiles of endogenous Pkp4 RNA and polyA RNA detected in the same cell. Peripheral clusters are characterized by a visible accumulation of polyA RNA. (Note that only enlarged views of individual protrusions are shown in panels A-E). (F) Whole cell masks of cells processed for FISH were used to derive a 2 μm-wide peripheral edge mask. (G) Whole-cell FISH images of the indicated endogenous RNAs (for additional examples see Figure 5—figure supplement 1). Scale bars: 15 μm. (H) For each RNA, signal intensity histograms of all detected particles found within the 2μm-wide peripheral edge area, were used to group particles into single RNAs or RNA clusters (see Figure 5—figure supplement 1 ). Table lists number of particles in each category for the indicated RNAs. p-values based on Fisher’s exact test against Arpc3 RNA. (I) Percent of overlap of the indicated RNA clusters with polyA clusters. n = number of particles observed in ca. 25 cells.
Figure 5—figure supplement 1

Intensity histograms of endogenous APC-dependent or control RNAs.
(A) Whole cell masks of cells processed for FISH were used to derive a 2 μm-wide peripheral edge mask. (B) FISH images of the indicated endogenous APC-dependent RNAs or non-localized RNAs (Arpc3 and P4hb). For each RNA, the associated graphs present a frequency distribution histogram of the signal intensities (in arbitrary units) of all detected particles found within the 2μm-wide peripheral edge area, as shown in (A). Intensities > 400 were all grouped in one bin. Number of analyzed particles: 150–1500, depending on the RNA, imaged in >25 cells. The existence of one major peak indicates that the majority of analyzed particles reflect single RNA molecules. Particles with higher intensities (>400) reflect homotypic RNA clusters. (See Figure 5H). Note that peripheral clusters of APC-dependent RNAs are not observed in all cells. The amount of each RNA in clusters is a small proportion of the total RNA amount.
Figure 5—figure supplement 2
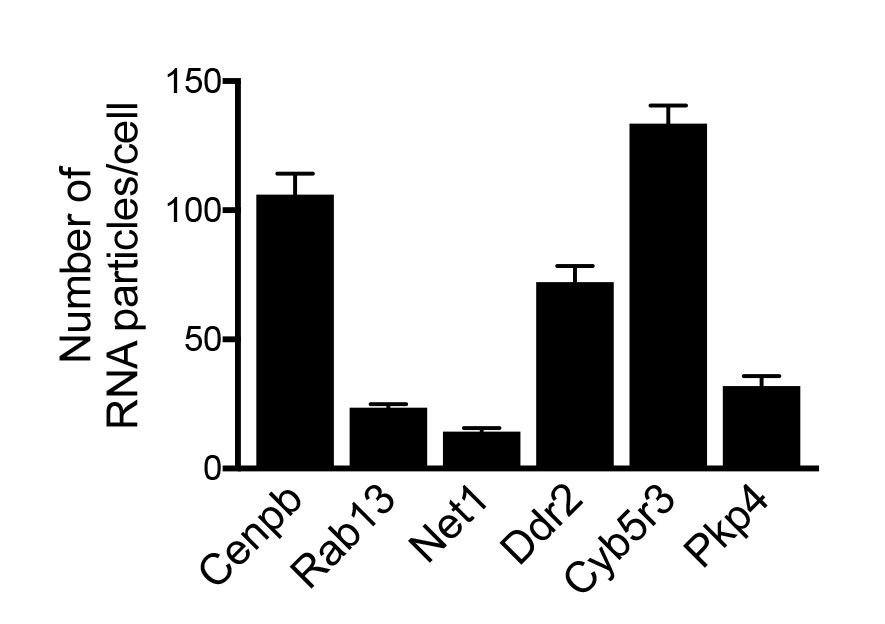
Amount of APC-dependent RNAs per cell.
Graph shows the average number of the indicated RNAs detected per cell, based on FISH images such as those shown in Figure 5—figure supplement 1. n > 25 cells; error bars: standard error.
Figure 5—figure supplement 3
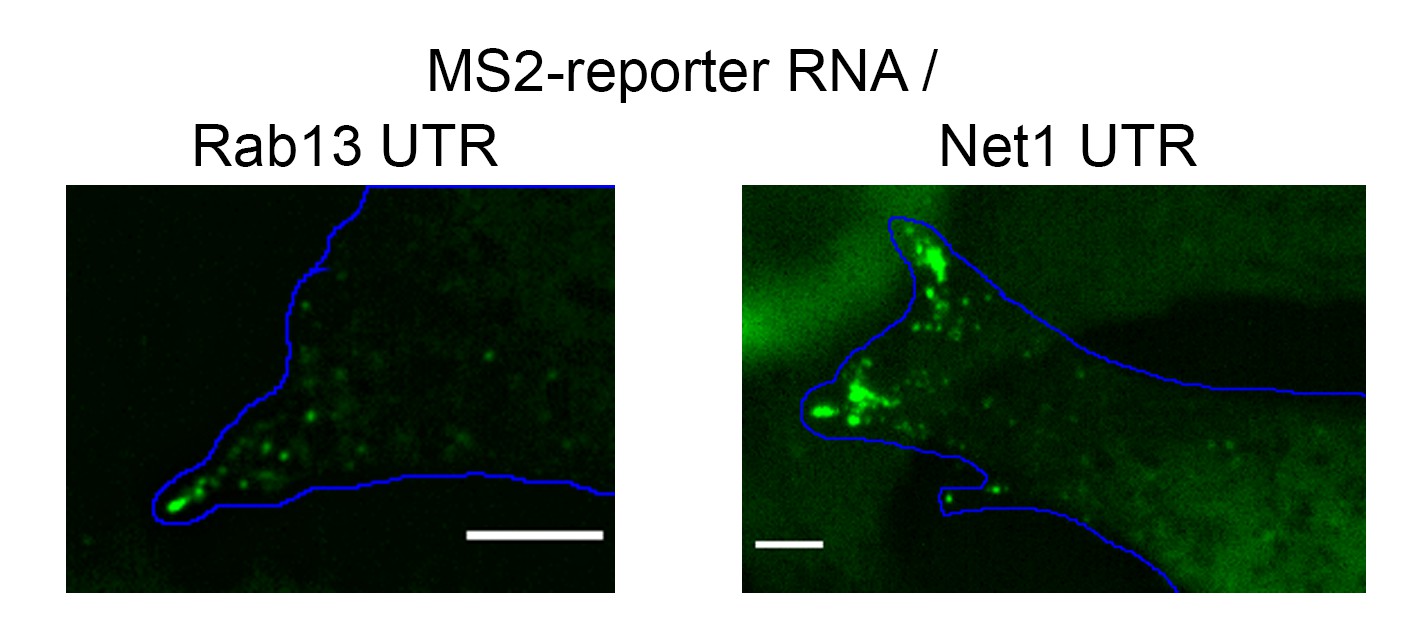
Peripheral cluster formation by MS2-reporter RNAs.
Localized reporter RNAs, which carry the 3’UTR of Rab13 or Net1 RNAs, as well as 24 copies of MS2-binding sites, were expressed in cells expressing GFP-tagged MS2 coat protein. Snapshots of live cell images show that the RNAs exist as single particles in internal regions and as clusters at the tips of protrusions. Scale bars: 5 μm.
Figure 6
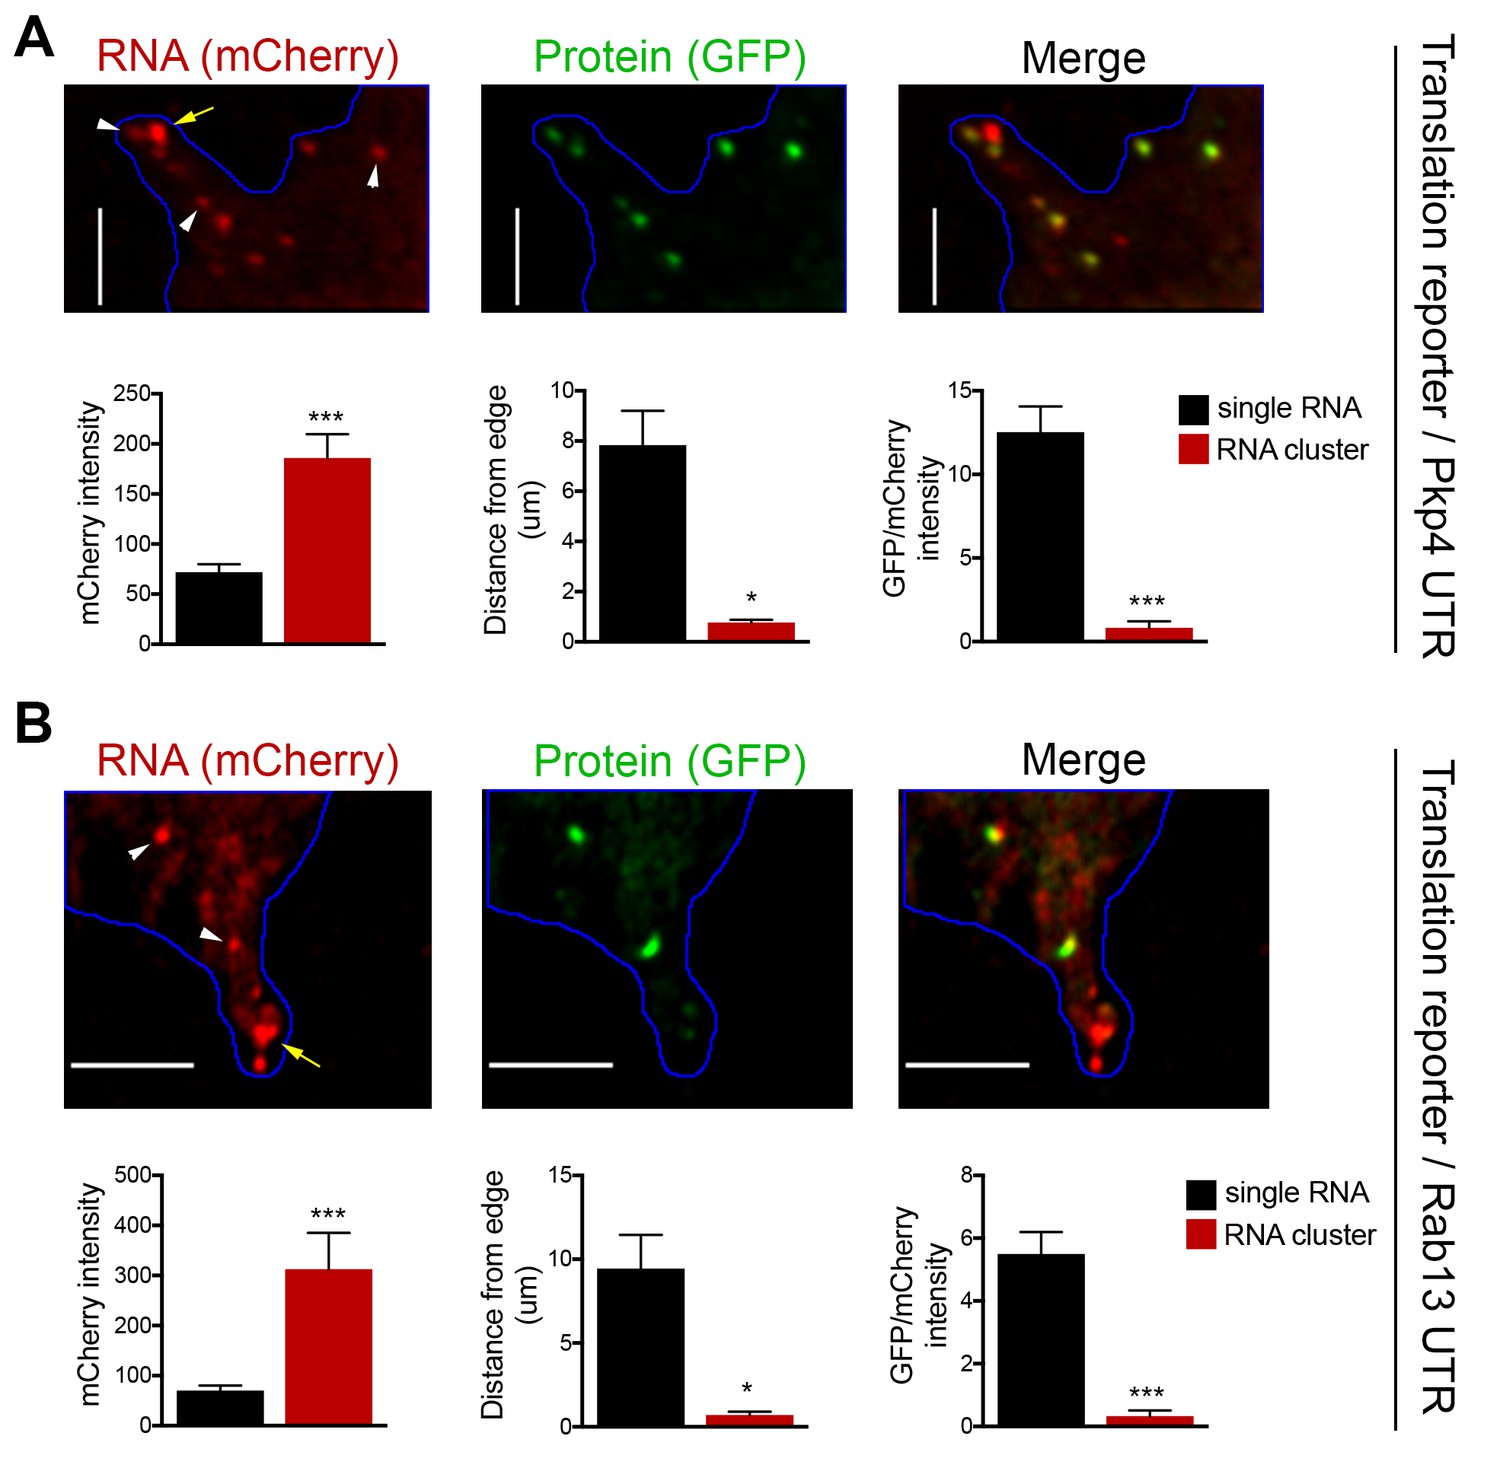
RNA clusters at the tips of protrusions are translationally silent.
(A, B) Imaging of cells expressing localized translation reporters carrying either the Pkp4 (A) or Rab13 (B) UTRs. White arrowheads point to single RNA molecules. Yellow arrows point to clustered RNAs at the tips of protrusions. mCherry intensity, distance from the edge and GFP/mCherry intensity are plotted for either single RNAs or RNA clusters observed in the same protrusions. error bars: standard error; n = 10 for RNA clusters, n > 25 for single RNAs, from 4 or eight different cells; p-value: *<0.02, ***<0.001 by Student’s t-test. Scale bars: 5 μm.
Figure 7 with 1 supplement
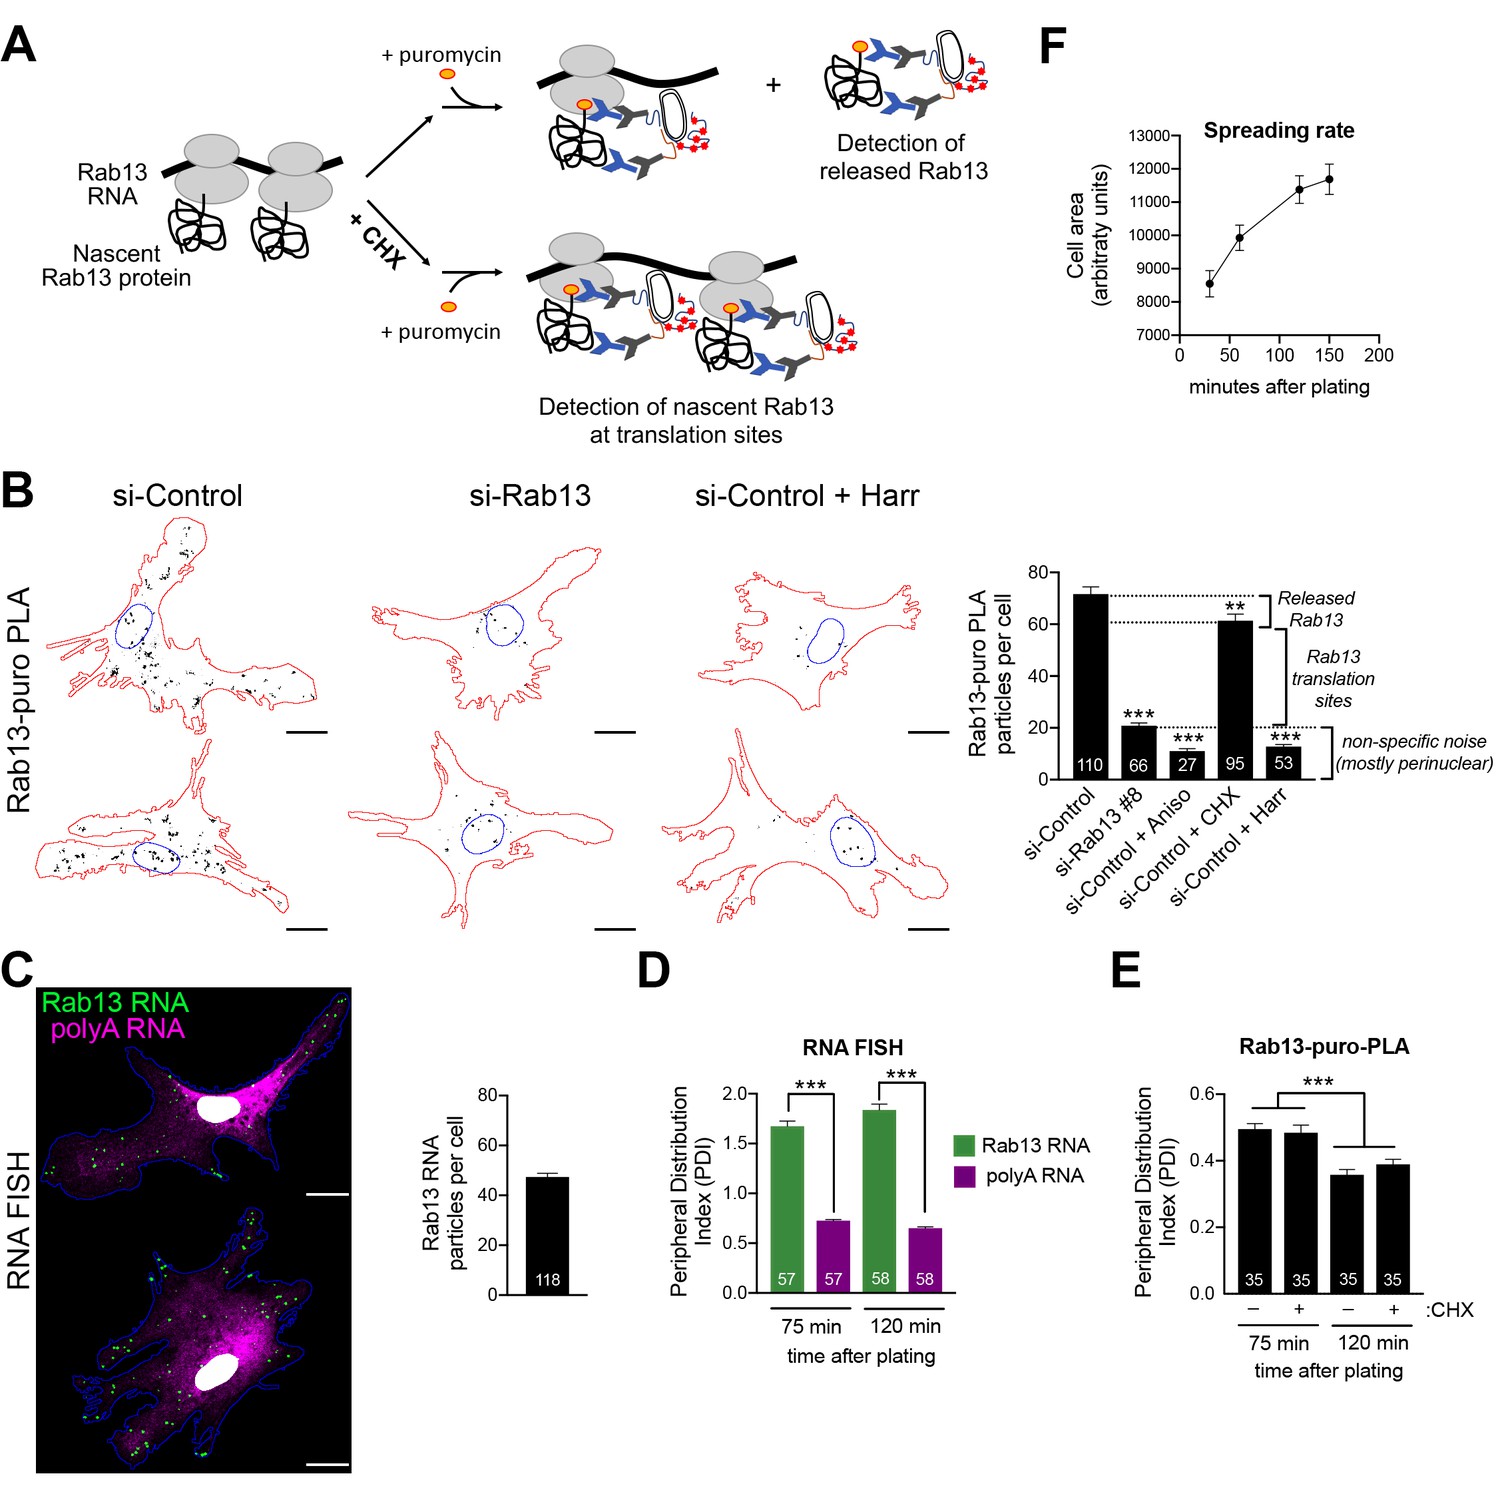
Endogenous Rab13 RNA is translated in both internal and peripheral locations, and is silenced at the periphery.
(A) Schematic depicting nascent Rab13 protein detection through puro-PLA. Puromycylation leads to detection of both Rab13 released from ribosomes as well as nascent Rab13 at translation sites. Pre-treatment with cycloheximide (CHX) prevents release of nascent protein. (B) Rab13-puro-PLA signal in primary human dermal fibroblasts transfected with control siRNAs, or siRNAs against Rab13, or pre-treated for 15 min with anisomycin (Aniso), cycloheximide (CHX) or harringtonine (Harr). Representative images from some of the conditions are shown on the left and quantitations in the graph. (C) In situ hybridization of Rab13 and polyadenylated (polyA) RNA in primary dermal fibroblasts. Graph shows the average number of Rab13 RNA particles detected per cell. (D, E) Images as those shown in (C) and (B) respectively were used to quantify a peripheral distribution index (PDI) at different times after plating on fibronectin. (F) Cell area of dermal fibroblasts at various timepoints after plating on fibronectin. Error bars: standard error. Number of cells analyzed in 2–4 independent experiments are shown within each bar. For (F) > 145 cells were analyzed for each timepoint. p-value: **<0.01, ***<0.001 by one-way ANOVA with Dunnett’s multiple comparisons test, compared to control or indicated samples. Scale bars: 15 μm.
Figure 7—figure supplement 1
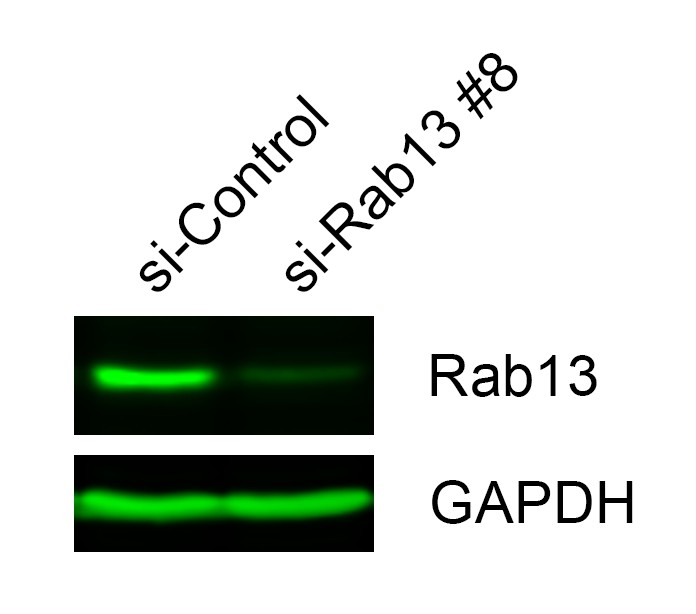
Rab13 protein levels.
Western blot to assess expression and degree of knockdown of Rab13 in lysates of primary human dermal fibroblasts.
Figure 8

Peripheral Rab13 RNA is silenced at retracting protrusions.
(A) Snapshots of time lapse imaging of MDA-MB-231 cells expressing Lifeact-GFP. Arrow points to protrusion that retracts within a few minutes. The full-length movie of this sample is presented in Video 11. (B) In situ hybridization of Rab13 and polyadenylated (polyA) RNA in MDA-MB-231 cells and PDI quantitations. Arrows point to Rab13 RNA in retracting protrusions. (C) Quantitation of Rab13-puro-PLA signal in MDA-MB-231 cells under the indicated conditions. (D) Representative images of Rab13-puro-PLA and phalloidin staining in MDA-MB-231 cells exhibiting retracting protrusions. Note that Rab13-puro-PLA signal is absent in retracting protrusions (arrows). (E) Rab13-puro-PLA intensity in lamellipodia or retracting protrusions. (See Figure 9A for representative outlines). (F) Percent of retracting protrusions positive for Rab13 RNA or puro-PLA signal based on images such as those shown in (B) and (D). Error bars: standard error. Number of cells analyzed in 2–3 independent experiments are shown within each bar. p-value: **<0.01, ***<0.001, ****<0.0001 by Student’s t-test (B, E) or one-way ANOVA with Dunnett’s multiple comparisons test, compared to control (C). Scale bars: 10 μm.
Figure 9
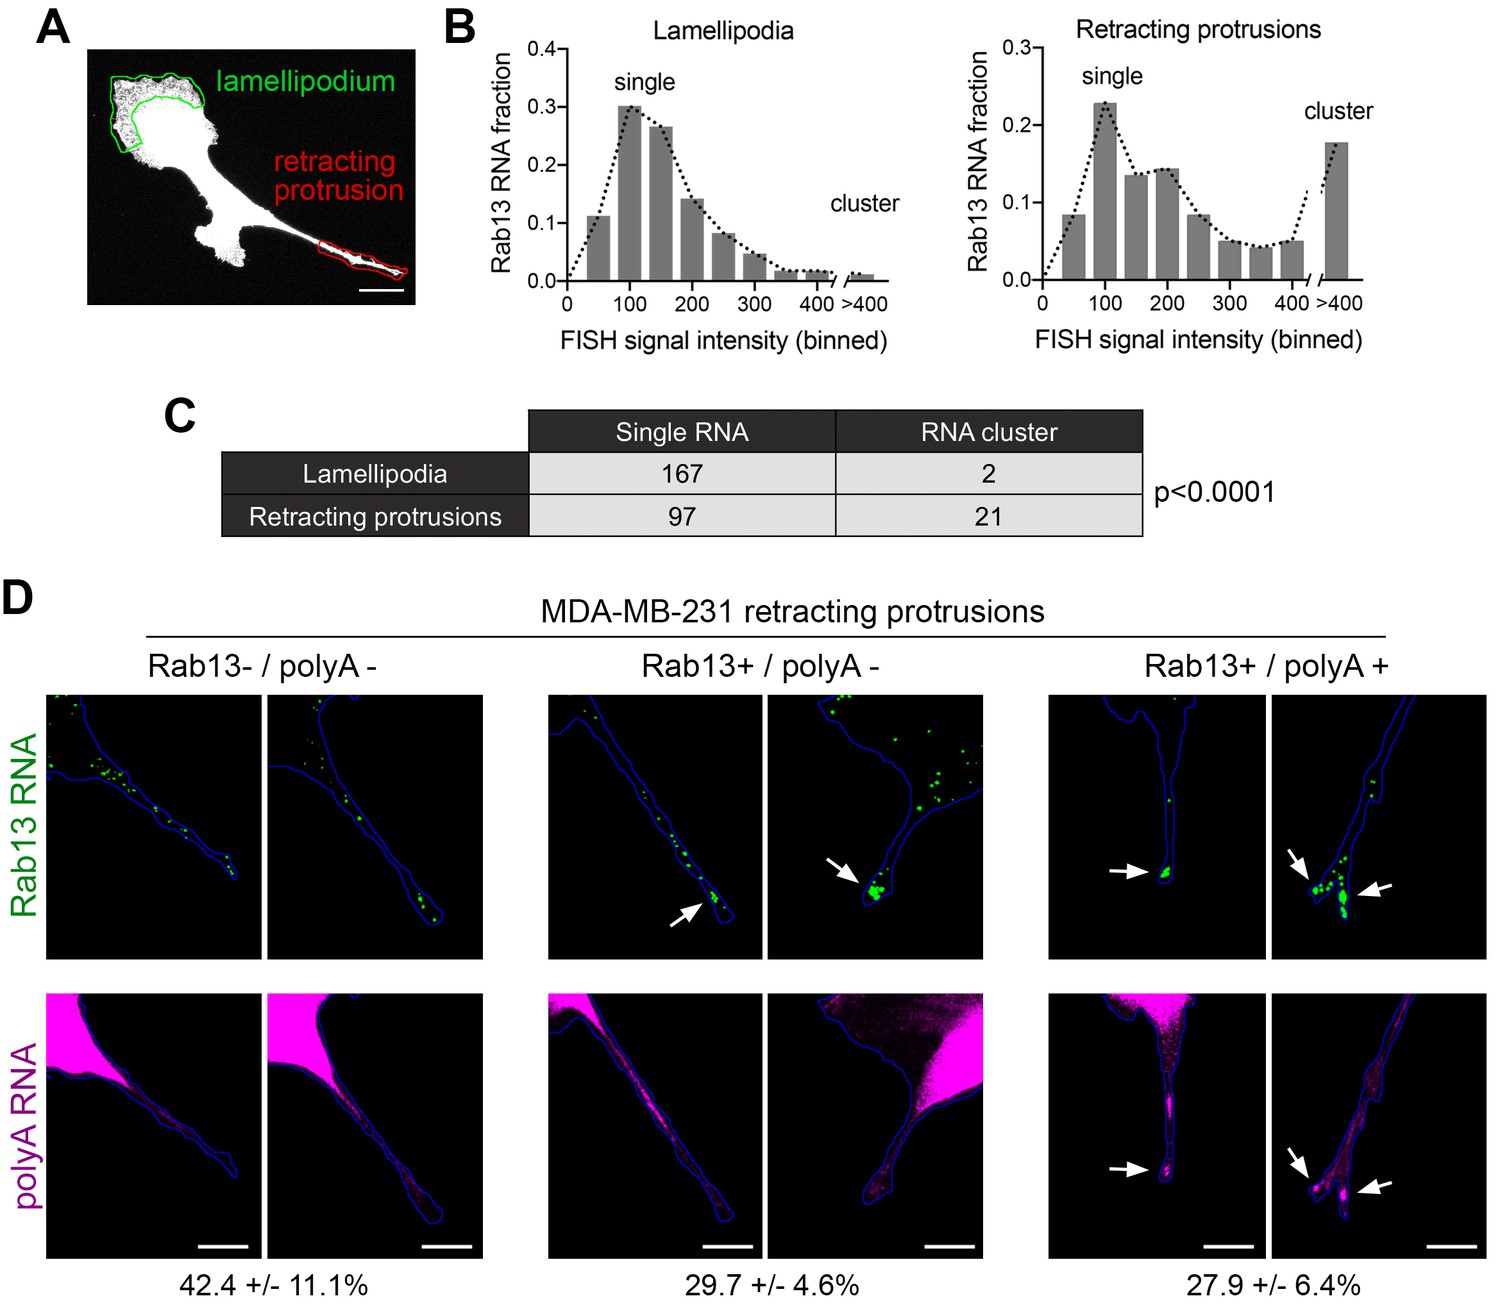
Silenced Rab13 RNA at retracting protrusions can be found in heterogeneous clusters.
(A) Outlines of ‘lamellipodia’ or ‘retracting protrusion’ regions used for quantitations Scale bar:10 μm. (B, C) Frequency distribution histograms of signal intensities (in arbitrary units) of Rab13 RNA particles within lamellipodia or retracting protrusions of MDA-MB-231 cells, as shown in (A). Intensities > 400 were grouped in one bin and indicate RNA clusters. Table lists numbers of single RNAs or RNA clusters observed in 32 cells. p-value by Fisher’s exact test. Essentially identical results were obtained in three independent experiments. (D) Retracting MDA-MB-231 protrusions (outlined in blue) stained for Rab13 and polyA RNAs. Based on the staining pattern, protrusions were grouped into three categories: Rab13-/polyA- do not exhibit visible Rab13 clusters or obvious local accumulations of polyA RNA; Rab13+/polyA- exhibit clusters of Rab13 RNA (arrows) but no obvious polyA clusters; Rab13+/polyA +exhibit Rab13 clusters which coincide with obvious corresponding polyA clusters (arrows). Values indicate average fraction of protrusions in each category ± standard error. n = 60 from two independent experiments. Scale bars: 10 μm.
Figure 10 with 1 supplement
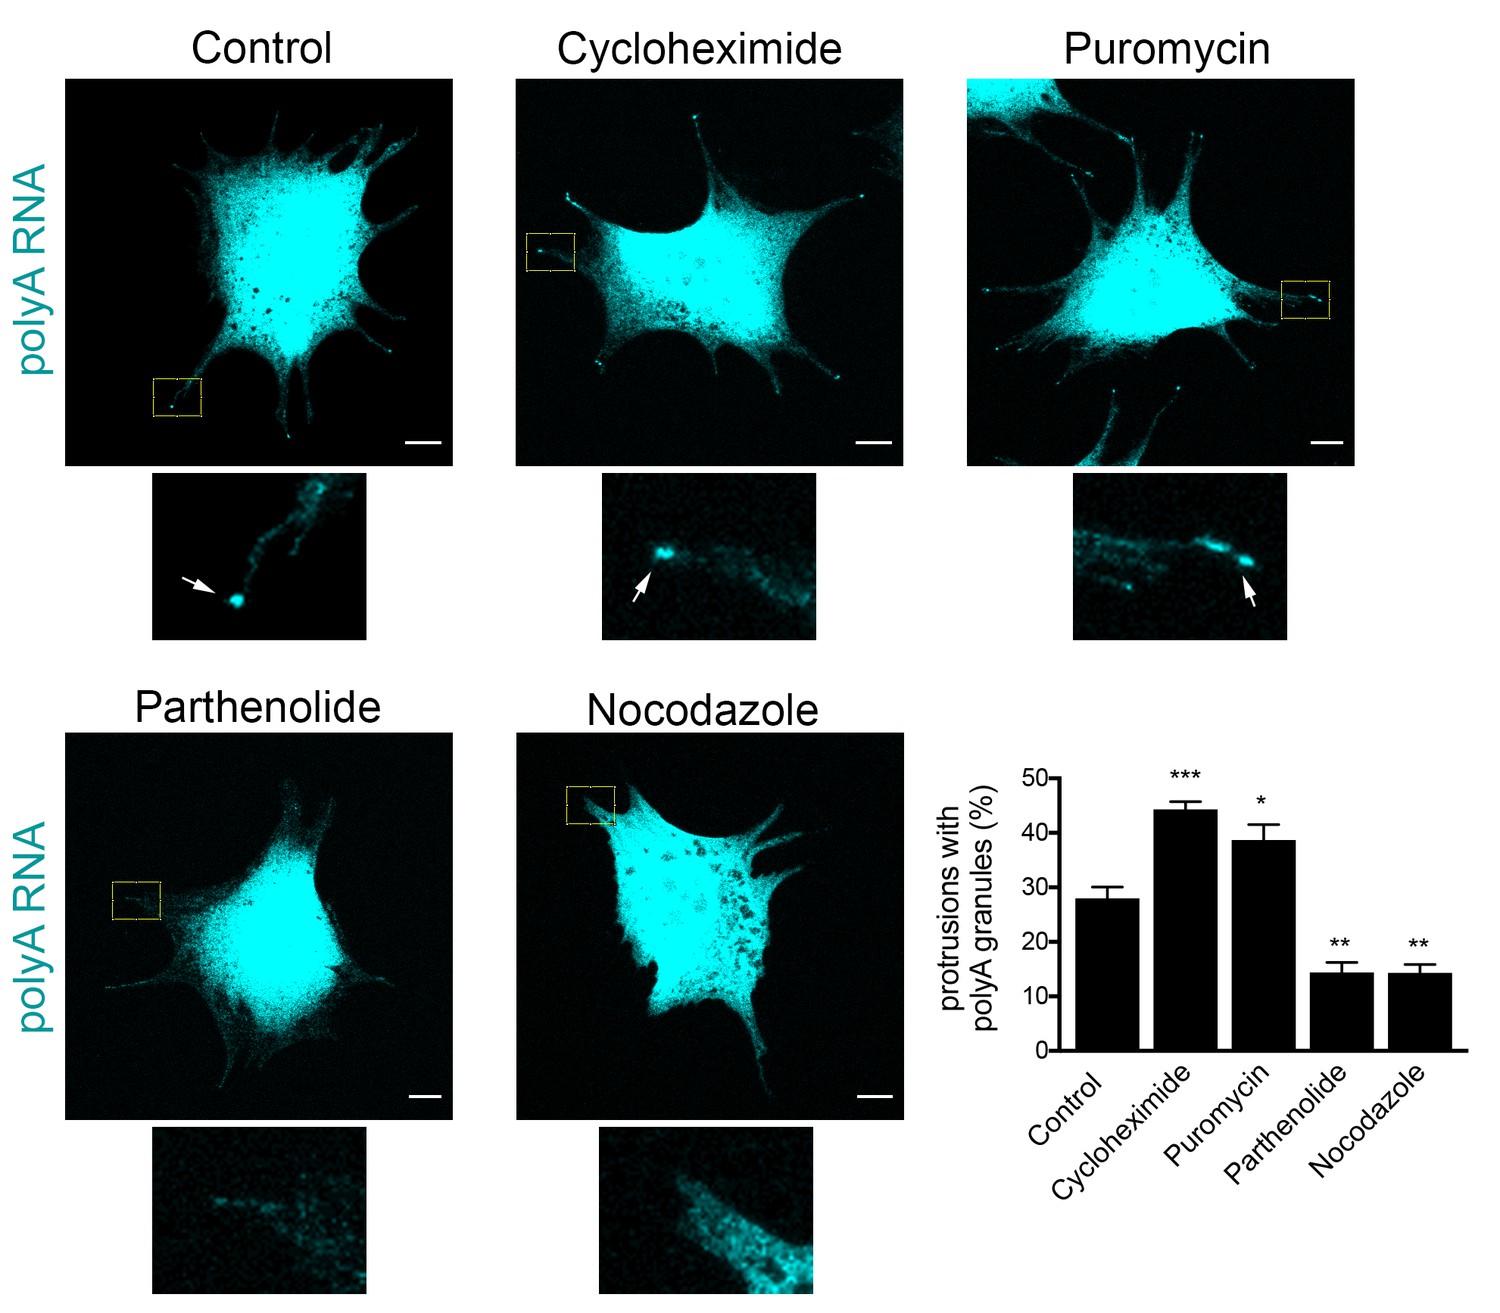
Formation of RNA clusters at protrusions is promoted by translational inhibition and requires microtubules.
PolyA RNA was detected in NIH/3T3 cells with the indicated treatments. Boxed regions are enlarged to show the presence (arrows) or absence of polyA RNA granules at the tips of protrusions. Graph shows scoring of protrusions for the presence of polyA RNA granules. Values are mean and standard error of at least three independent experiments. For each experiment approximately 300 protrusions from more than 25 cells were observed. p-value: *<0.02, **<0.01, ***<0.001 by one-way ANOVA with Dunnett’s multiple comparisons test, compared to control. Scale bars: 10 μm.
Figure 10—figure supplement 1
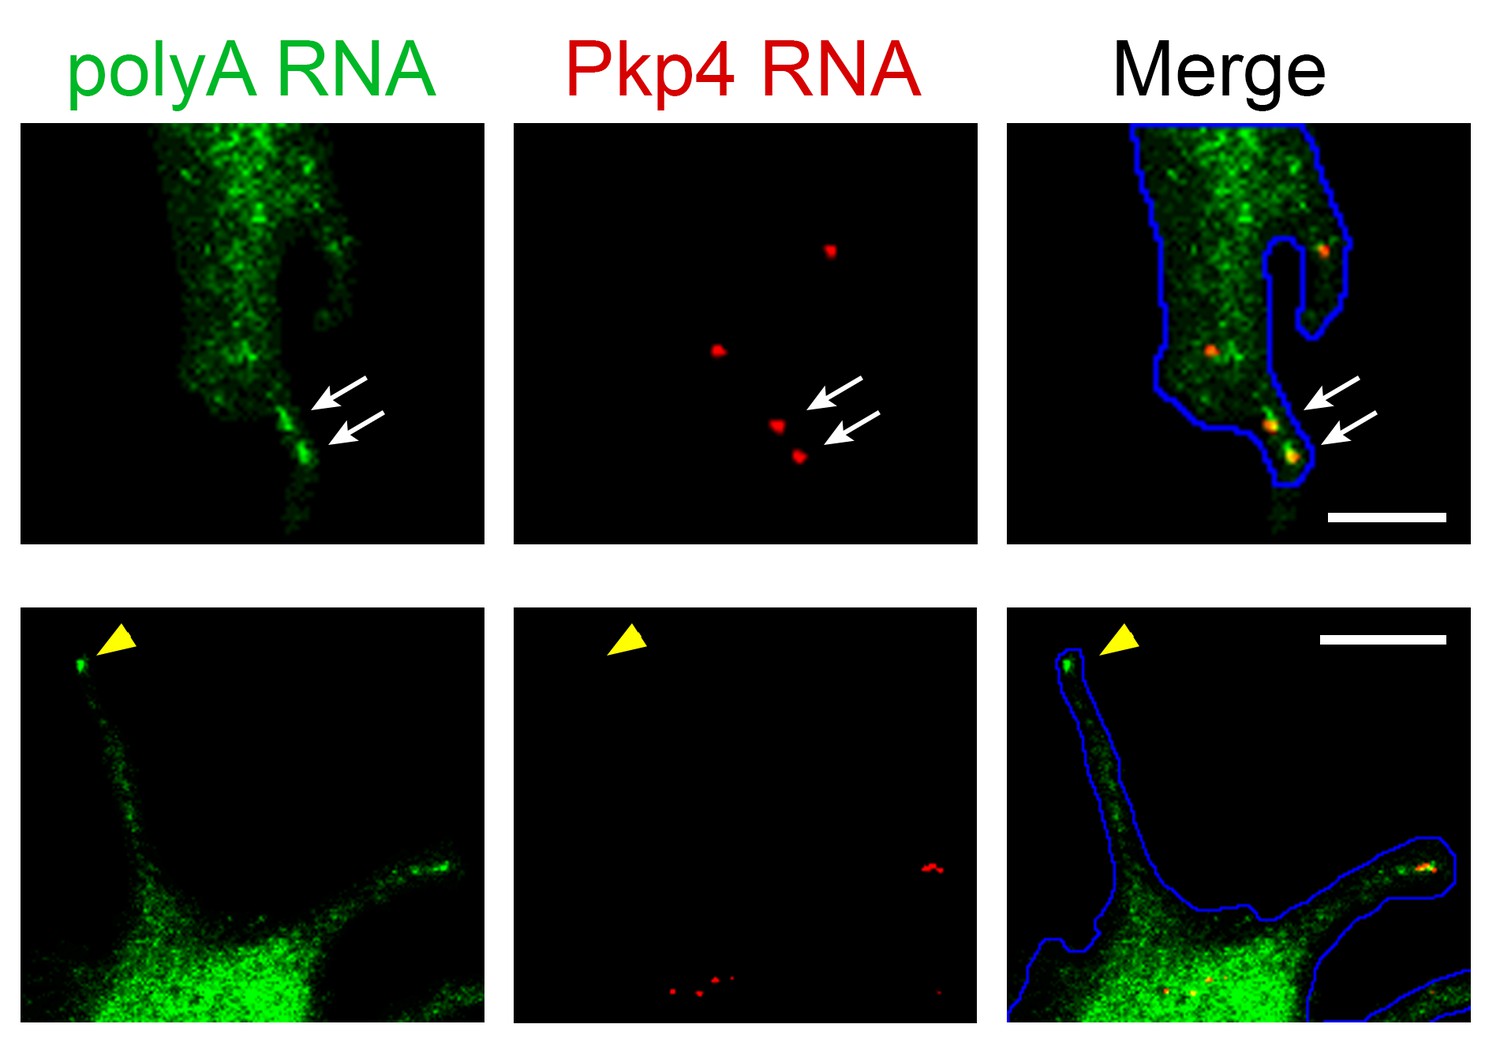
PolyA RNA staining is a more reliable identifier of peripheral clusters in 3T3 cells.
Enlarged views of individual protrusions from cells processed by in situ hybridization to detect the Pkp4 RNA or polyadenylated RNA. Single Pkp4 RNAs can be observed at protrusions in association with accumulated polyA RNA signal indicative of peripheral clusters (upper panels; white arrows). We also observe peripheral polyA RNA clusters that do not contain any detectable Pkp4 RNAs (lower panels; yellow arrowhead). Scale bars: 5 μm (upper panels), 10 μm (lower panels).
Author response image 1
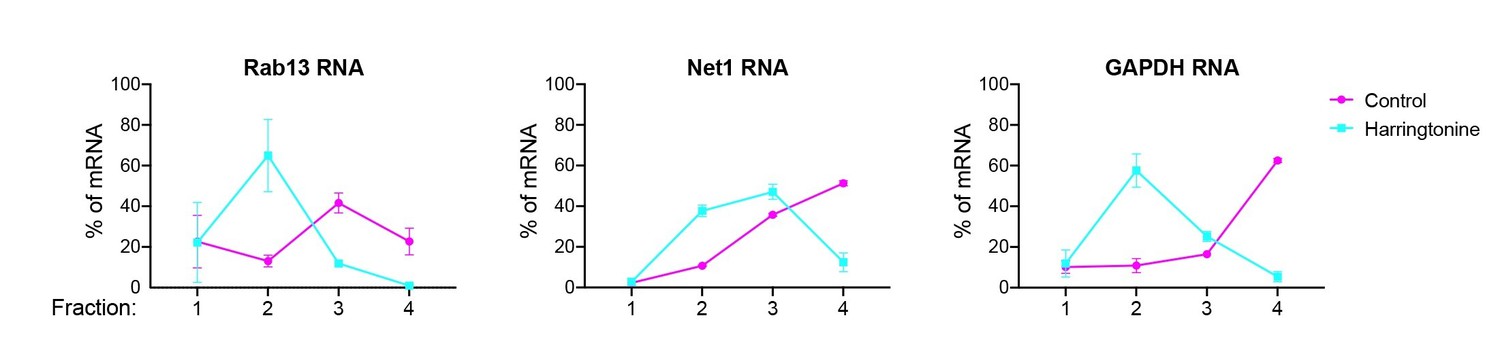
MDA-MB-231 cells were treated, or not, with harringtonine for 15min.
Fractions of polysome gradients were isolated and analyzed by RT-ddPCR to detect two localized, APC-dependent RNAs (Rab13 and Net1) and a non-localized control RNA (GAPDH).
Videos
Video 1
NIH/3T3 cell expressing scFv-GFP (green), 3x-mCherry-PCP (red) and the control translation reporter.
Frames were acquired sequentially and with no time delay, for the duration of the movie (45 s). A merged image of the two channels is shown. Overlapping red and green spots indicate translation sites. Blue line: cell outline. Cyan line: nucleus outline. Scale bar: 5 μm. Single frames of this movie are shown in Figure 3B.
Video 2
NIH/3T3 cell expressing scFv-GFP (green), 3x-mCherry-PCP (red) and the control translation reporter.
Frames were acquired sequentially and with no time delay, for the duration of the movie (13 s). A merged image of the two channels is shown. Blue line: cell outline. Scale bar: 5 μm. Single frames of this movie are shown in Figure 4A (upper panels).
Video 3
NIH/3T3 cell expressing scFv-GFP (green), 3x-mCherry-PCP (red) and the localized translation reporter carrying the Pkp4 UTR.
Frames were acquired sequentially and with no time delay, for the duration of the movie (36 s). A merged image of the two channels is shown. Blue line: cell outline. Scale bar: 5 μm. Single frames of this movie are shown in Figure 4A (middle panels). RNAs are translated both in the periphery and internal regions.
Video 4
NIH/3T3 cell expressing scFv-GFP (green), 3x-mCherry-PCP (red) and the localized translation reporter carrying the Rab13 UTR.
Frames were acquired sequentially and with no time delay, for the duration of the movie (63 s). A merged image of the two channels is shown. Blue line: cell outline. Cyan line: nucleus outline. Scale bar: 5 μm. Single frames of this movie are shown in Figure 4A (bottom panels). RNAs are translated both in the periphery and internal regions.
Video 5
NIH/3T3 cell expressing scFv-GFP (green), 3x-mCherry-PCP and the localized translation reporter carrying the Rab13 UTR.
Images of the GFP channel were acquired sequentially and with no time delay, for the duration of the movie (13 s). Blue line: cell outline. Scale bar: 3 μm. Single frames of this movie are shown in Figure 4—figure supplement 3A. The edge of the protrusion is towards the top. One of the observed translation sites moves in an apparently directed manner towards the edge of the protrusion.
Video 6
NIH/3T3 cell expressing scFv-GFP (green), 3x-mCherry-PCP and the localized translation reporter carrying the Pkp4 UTR.
Images of the GFP channel were acquired sequentially and with no time delay, for the duration of the movie (19 s). Blue line: cell outline. Scale bar: 3 μm. Single frames of this movie are shown in Figure 4—figure supplement 3B. The edge of the protrusion is towards the right. One of the observed translation sites moves in an apparently directed manner towards the edge of the protrusion.
Video 7
NIH/3T3 cell expressing tdMCP-GFP (green) and a MS2-reporter RNA carrying the Rab13 UTR.
Images of the GFP channel were acquired sequentially and with no time delay, for the duration of the movie (29 s). A single frame of this movie is shown in Figure 5—figure supplement 3. Fainter spots reflect single RNA molecules. At the tip of the protrusion a brighter cluster of RNAs is observed. Single particles can be observed moving towards and incorporating into the cluster at the tip (at frames around seconds 3–4 and second 21). Scale bar: 5 μm.
Video 8
NIH/3T3 cell expressing tdMCP-GFP (green) and a MS2-reporter RNA carrying the Net1 UTR.
Images of the GFP channel were acquired sequentially and with no time delay, for the duration of the movie (22 s). A single frame of this movie is shown in Figure 5—figure supplement 3. Fainter spots reflect single RNA molecules. At the edges of the protrusion multiple brighter clusters of RNAs are observed. Single particles from internal regions can be observed moving towards and incorporating into clusters at the tip. Scale bar: 5 μm.
Video 9
Primary human dermal fibroblast expressing Lifeact-GFP.
Images were acquired every 6 min for a total of 3 hr. Note that each protrusion is very dynamic undergoing retracting and extending phases within minutes.
Video 10
Primary human dermal fibroblast expressing Lifeact-GFP.
Images were acquired every 6 min for a total of 3 hr. Note that each protrusion is very dynamic undergoing retracting and extending phases within minutes.
Video 11
MDA-MB-231 cell expressing Lifeact-GFP.
Images were acquired every 3 min for a total of 51 min. Arrow points to protrusion that retracts over a period of few minutes. Note that lamellipodial regions undergo constant dynamic retracting and extending phases.
Video 12
MDA-MB-231 cell expressing Lifeact-GFP.
Images were acquired every 3 min for a total of 51 min. Arrow points to protrusion that retracts over a period of few minutes. Note that lamellipodial regions undergo constant dynamic retracting and extending phases.
Video 13
NIH/3T3 fibroblast expressing Lifeact-GFP.
Images were acquired every 6 min for a period of 1 hr. Note that, in comparison to MDA-MB-231 cells, NIH/3T3 cells exhibit much slower dynamics with protrusions persisting relatively unchanged for the duration of imaging.
Tables
Key resources table
| Reagent type (species) or resource | Designation | Source or reference | Identifiers | Additional information |
|---|---|---|---|---|
| Cell line (Homo sapiens) | MDA-MB-231 | ATCC | ATCC Cat# HTB-26, RRID: CVCL_0062 | |
| Cell line (Mus musculus) | NIH/3T3 | ATCC | RRID:CVCL_0594 | |
| Cell line (Homo sapiens) | Primary dermal fibroblasts | provided by Dr. Ramiro Iglesias-Bartolome (NCI, NIH) | ||
| Cell line (Mus musculus) | NIH/3T3-PCFvGdelta1-PP7 (control translation reporter) | This study | NIH/3T3 cells expressing SunTag-based control translation reporter. | |
| Cell line (Mus musculus) | NIH/3T3-PCFvGdelta1-deltaPP7 (control translation reporter) | This study | NIH/3T3 cells expressing SunTag-based control translation reporter with deletion of the PP7 repeats. | |
| Cell line (Mus musculus) | NIH/3T3-PCFvGdelta1-Rab13U (translation reporter/Rab13 UTR) | This study | NIH/3T3 cells expressing SunTag-based translation reporter with the mouse Rab13 UTR. | |
| Cell line (Mus musculus) | NIH/3T3-PCFvGdelta1-Pkp4U (translation reporter/Pkp4 UTR) | This study | NIH/3T3 cells expressing SunTag-based translation reporter with the mouse Pkp4 UTR. | |
| Cell line (Mus musculus) | NIH/3T3-tdMCP-GFP_pIND20-b24bs/Net1 (MS2 reporter/Net1 UTR) | This study | NIH/3T3 cells expressing MS2 reporter with the mouse Net1 UTR. | |
| Cell line (Mus musculus) | NIH/3T3-tdMCP-GFP_pIND20-b24bs/Rab13 (MS2 reporter/Rab13 UTR) | This study | NIH/3T3 cells expressing MS2 reporter with the mouse Rab13 UTR. | |
| Antibody | anti-Rab13 rabbit polyclonal | Novus Biologicals | NBP1-85799 | (1:1,000 WB; 1:200 PLA) |
| Antibody | anti-GAPDH (14C10) rabbit monoclonal | Cell Signaling | 2118 | (1:2,000 WB) |
| Antibody | anti-puromycin (3RH11) mouse monoclonal | Kerafast | EQ0001 | (1:2,000 PLA) |
| Recombinant DNA reagent | pHR-tdPP7-3x-mCherry | Addgene | 74926 | |
| Recombinant DNA reagent | pcDNA4TO-24xGCN4_v4-kif18b-24xPP7 | Addgene | 74928 | |
| Recombinant DNA reagent | pcDNA4TO-24xGCN4_v4-kif18b | Addgene | 74934 | |
| Recombinant DNA reagent | pHR-scFv-GCN4-sfGFP-GB1-NLS-dWPRE | Addgene | 60906 | |
| Recombinant DNA reagent | pHR-scFv-GCN4-sfGFP-GB1-deltaNLS-dWPRE | This study | Plasmid expressing scFv against GCN4 peptide of the SunTag system, fused to sfGFP, without NLS. Derived from pHR-scFv-GCN4-sfGFP-GB1-NLS-dWPRE after introduction of stop codon before the NLS sequence. | |
| rRcombinant DNA reagent | pInducer 20 | Addgene | 44012 | |
| Recombinant DNA reagent | Phage-ubc-nls-ha-tdMCP-gfp | Addgene | 40649 | |
| Recombinant DNA reagent | pInducer20-24xGCN4_v4-kif18b-24xPP7-Rab13 UTR | This study | Dox-inducible translation reporter carrying the mouse Rab13 3'UTR | |
| Recombinant DNA reagent | pInducer20-24xGCN4_v4-kif18b-24xPP7-Pkp4 UTR | This study | Dox-inducible translation reporter carrying the mouse Pkp4 3'UTR | |
| Recombinant DNA reagent | pInducer20-beta24bs-Rab13 UTR | This study | Dox-inducible MS2 reporter carrying the mouse Rab13 3'UTR | |
| Recombinant DNA reagent | pInducer20-beta24bs-Net1 UTR | This study | Dox-inducible MS2 reporter carrying the mouse Net1 3'UTR | |
| Sequence-based reagent | All Stars Negative control siRNA | Qiagen | 1027281 | |
| Sequence-based reagent | Rab13 siRNA, si-Rab13 #8 | Qiagen | SI02662702 | target sequence: 5’-ATGGTCTTTCTTGGTATTAAA-3’ |
| Sequence-based reagent | FISH probes against mouse Net1 | Thermo Fisher Scientific | VB1-3034209 | |
| Sequence-based reagent | FISH probes against mouse Cyb5r3 | Thermo Fisher Scientific | VB1-18647 | |
| Sequence-based reagent | FISH probes against mouse Cenpb | Thermo Fisher Scientific | VB1-18648 | |
| Sequence-based reagent | FISH probes against mouse Rab13 | Thermo Fisher Scientific | VB1-14374 | |
| Sequence-based reagent | FISH probes against human Rab13 | Thermo Fisher Scientific | VA1-12225 | |
| Sequence-based reagent | FISH probes against mouse Pkp4 | Thermo Fisher Scientific | VB4-600264 | |
| Sequence-based reagent | FISH probes against human Kif18b | Thermo Fisher Scientific | VA6-3170686 | |
| Sequence-based reagent | FISH probes against mouse Ddr2 | Thermo Fisher Scientific | VB1-14375 | |
| Sequence-based reagent | FISH probes against mouse Arpc3 | Thermo Fisher Scientific | VB1-14507 | |
| Sequence-based reagent | FISH probes against mouse P4hb | Thermo Fisher Scientific | VB6-15898 | |
| Sequence-based reagent | Custom-made codeset | NanoString Technologies | Item # 116000002 | |
| Commercial assay or kit | Duolink In Situ Red kit | Sigma Aldrich | DUO92101 | |
| Commercial assay or kit | ViewRNA ISH Cell Assay kit | Thermo Fisher Scientific | QVC0001 |
Additional files
-
Transparent reporting form
- https://doi.org/10.7554/eLife.44752.036
Download links
A two-part list of links to download the article, or parts of the article, in various formats.
Downloads (link to download the article as PDF)
Open citations (links to open the citations from this article in various online reference manager services)
Cite this article (links to download the citations from this article in formats compatible with various reference manager tools)
Translational regulation of protrusion-localized RNAs involves silencing and clustering after transport
eLife 8:e44752.
https://doi.org/10.7554/eLife.44752


