Structural basis of phosphatidylcholine recognition by the C2–domain of cytosolic phospholipase A2α
- Memorial Sloan-Kettering Cancer Center, United States
- Nara Institute of Science and Technology (NAIST), Japan
- University of Minnesota, United States
- Virginia Commonwealth University Medical Center, United States
- University of South Florida, United States
- James A. Haley Veterans Hospital, United States
- The Moffitt Cancer Center, United States
Figures
Figure 1 with 2 supplements
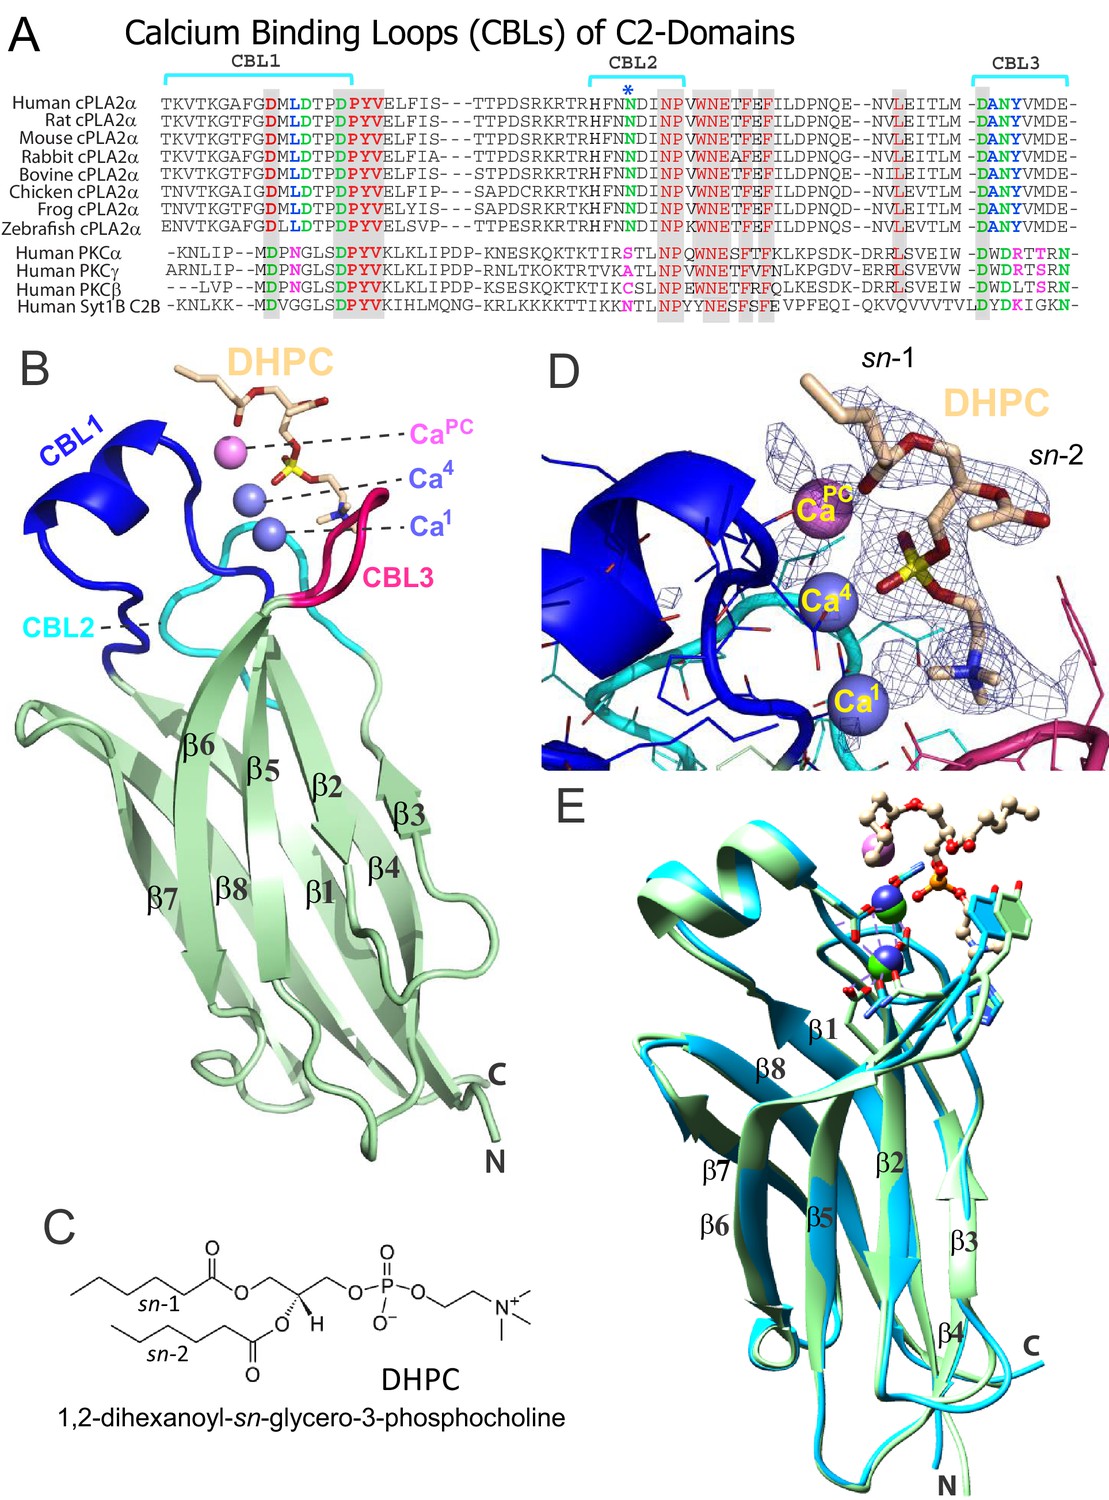
Structure of cPLA2α C2‒domain containing bound DHPC and calcium.
(A) Sequence alignment of C2-domain calcium-binding loop (CBL) regions in cPLA2α from different eukaryotes compared to human PKCs and Syt1. Residues that bind Ca2+ are green. Residues interacting directly with PC in our structural complex (blue or blue asterisk) are absolutely conserved among eukaryotic cPLA2α proteins but not in PKCs and Syt1. Conversely, residues that interact with PS in the PKCα-PS structure (magenta) are highly conserved in PKCs and Syt1, but not in cPLA2α. Shaded residues are identical. The human and chicken cPLA2α CBL sequences are 92% identical and 94.5% highly conserved (see Figure 1—figure supplement 1 for full-length sequence alignment). (B) Ribbon structure representation of the cPLA2α C2-domain bound to 1,2-dihexanoyl-sn-glycero-3-phosphocholine (DHPC). The DHPC molecule (beige stick) straddles the β1–β2 loop (CBL1, blue), β3–β4 loop (CBL2, cyan) and β5–β6 loop (CBL3, red). Ca1 and Ca4 (blue spheres) are in a similar position in the apo-form structure; whereas CaPC (magenta sphere) is unique to the DHPC-bound form. (C) DHPC structural formula. (D) Fo-Fc omit electron density map for the bound DHPC molecule at the 2.5σ contour level. (E) Superimposition of the chicken cPLA2α C2-domain with bound DHPC (colored as in Figure 1B) on the human lipid-free structure (PDB: 1RLW, cyan). Root mean square deviation = 0.7 Å after superimposition of Cα atoms.
Figure 1—figure supplement 1
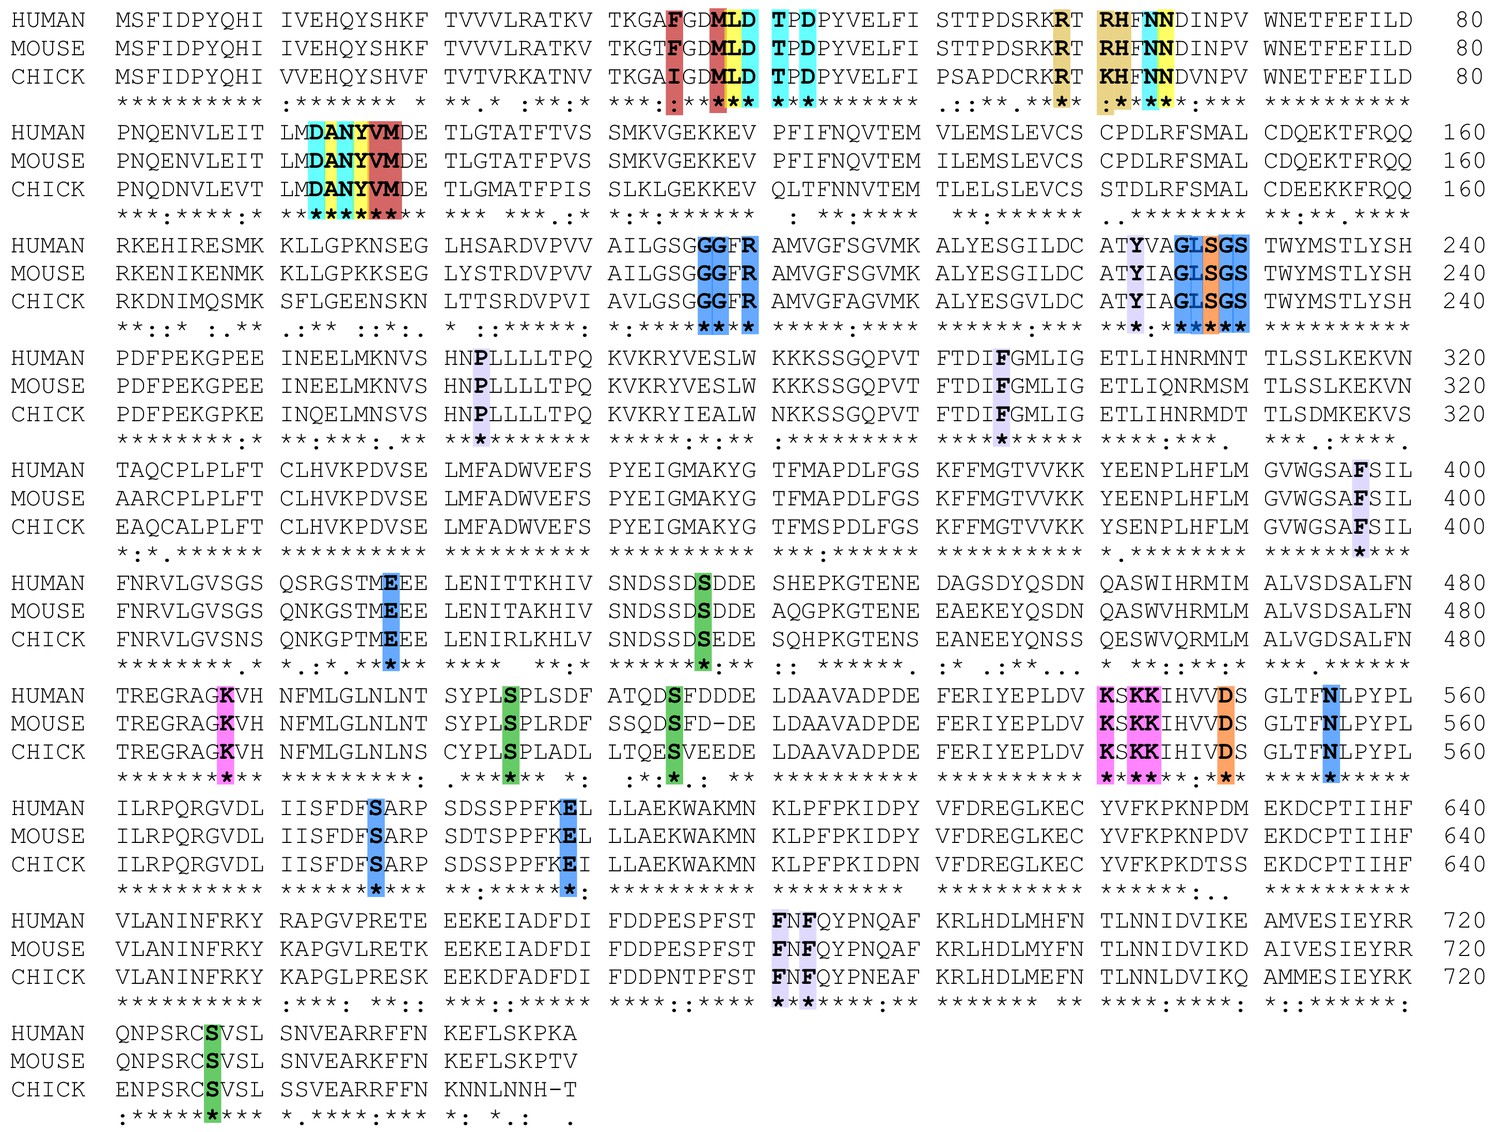
Sequence alignment of cPLA2α for human, mouse, and chicken proteins.
In the C2-Domains, Ca2+ binding residues are cyan, DHPC binding residues are yellow; C1P binding residues are beige, and membrane interaction residues are burgundy. In the Catalytic Domains, active site residues are orange, PAPC polar headgroup interacting residues are blue, PAPC acyl chain interacting residues are lavender, PIP2 interacting residues are magenta, and phosphorylation sites are green. Sequence alignment was generated using Clustal W (Larkin et al., 2007).
Figure 1—figure supplement 2
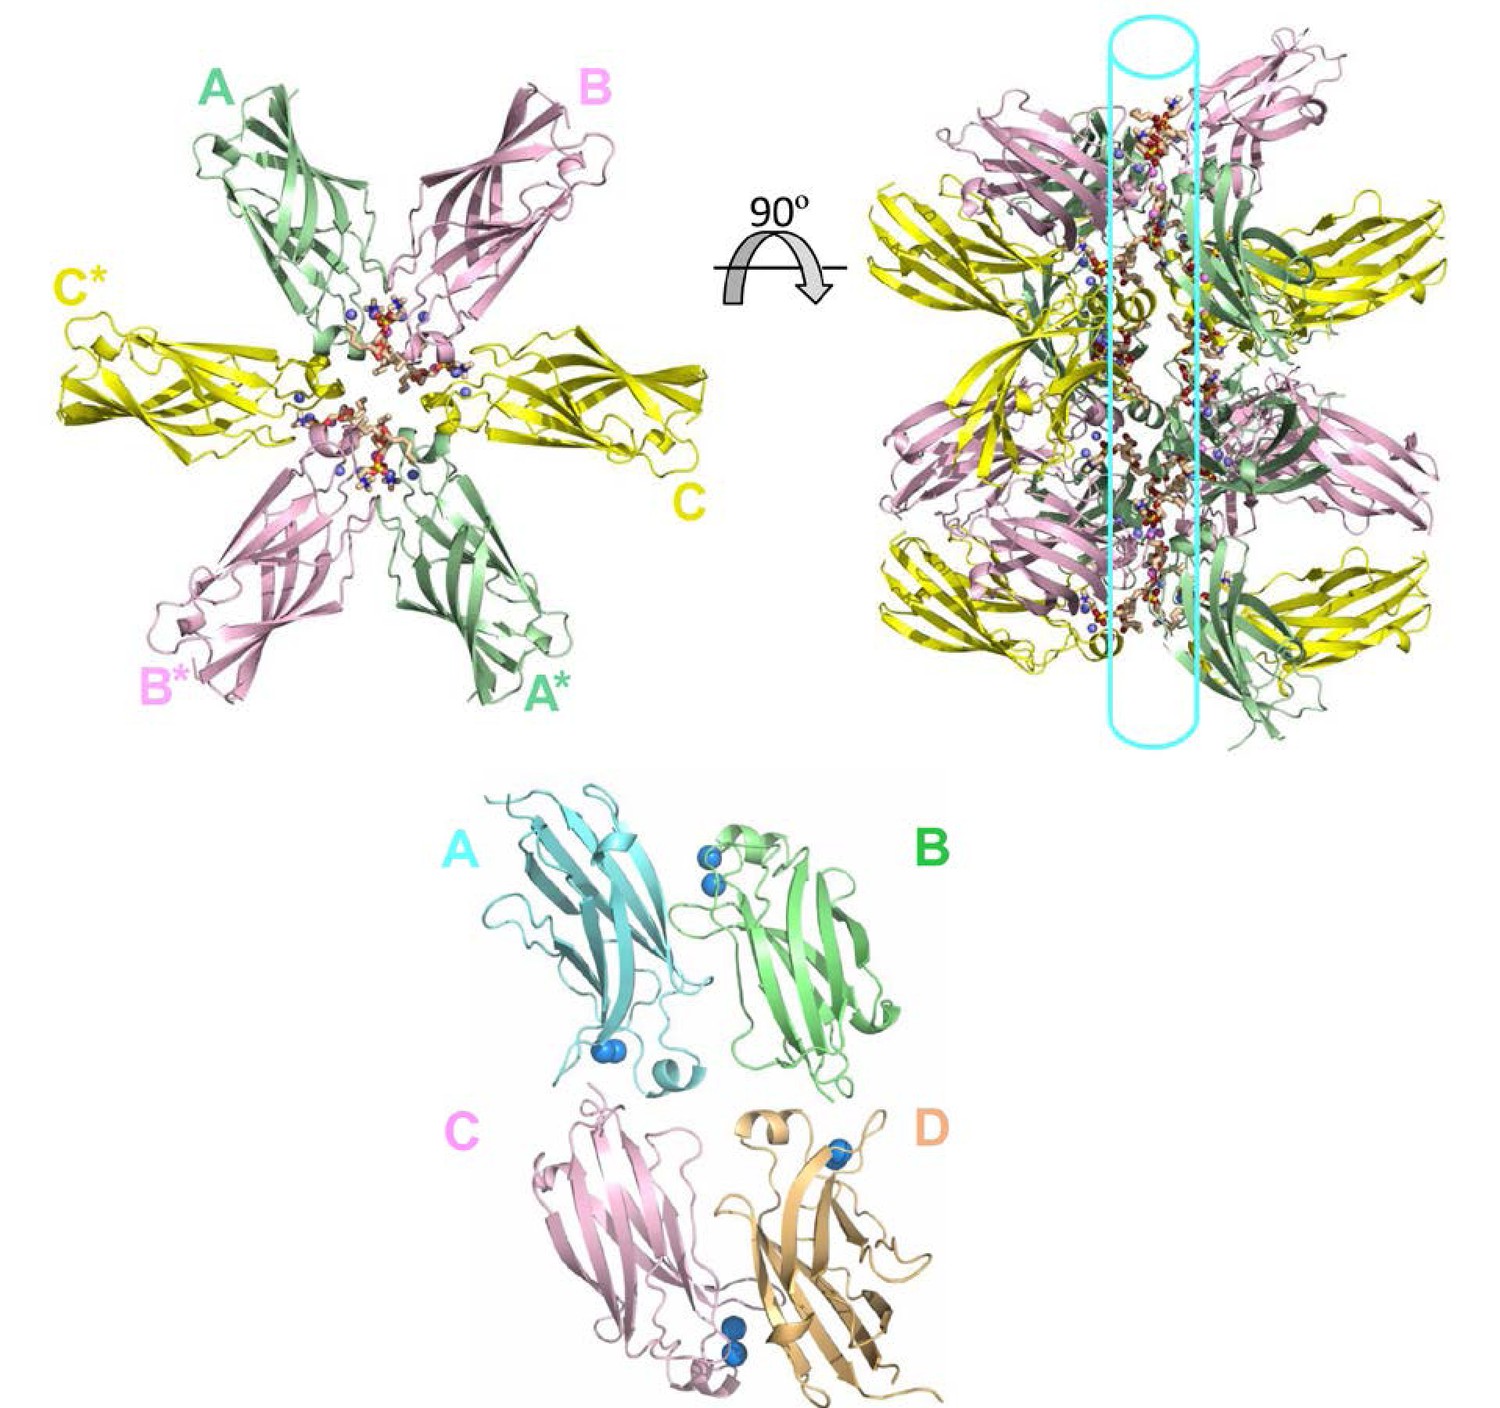
Tubular topology formed in the crystal lattice of the cPLA2α C2-domain–DHPC structural complex.
(Upper left panel) Cross-sectional view of three cPLA2α C2-PC complexes in the asymmetric unit (labeled A, B, C) and three complexes in the neighboring asymmetric unit (A*, B* and C*) that together form a ring-like structure. The hexanoyl acyl chains associated in one complex are separated from hexanoyl acyl chains in adjacent complexes by 4.9 to 7.2 Å. (Upper right panel) Rotation by 90° reveals PC lipids packed into a ring-like topology that forms a tubular-like scaffold. (Lower panel) The crystal packing lattice of lipid-free human cPLA2α C2-domain (PDB: 1RLW). The incorporated Ca2+ is shown as blue spheres. Protomer A packs with protomers B and C, but not with protomer D.
Figure 2 with 1 supplement
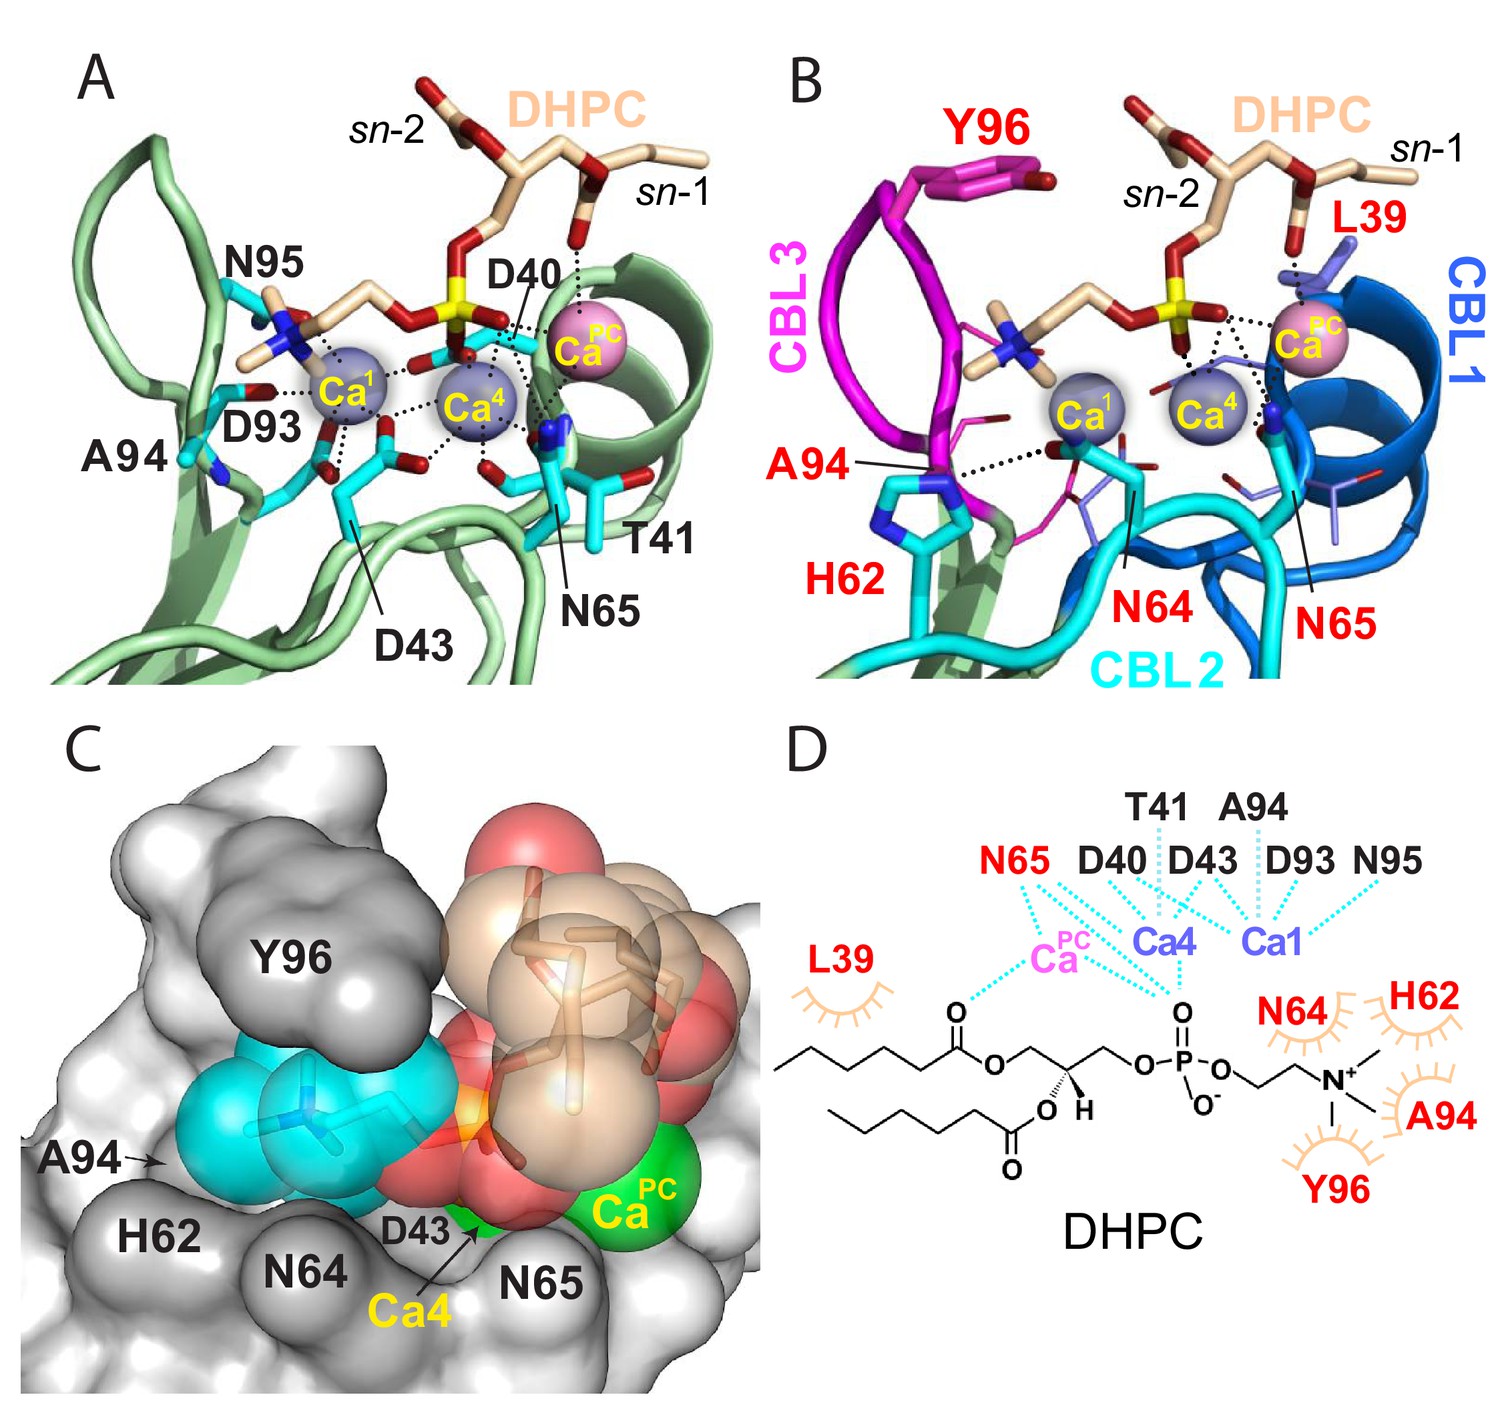
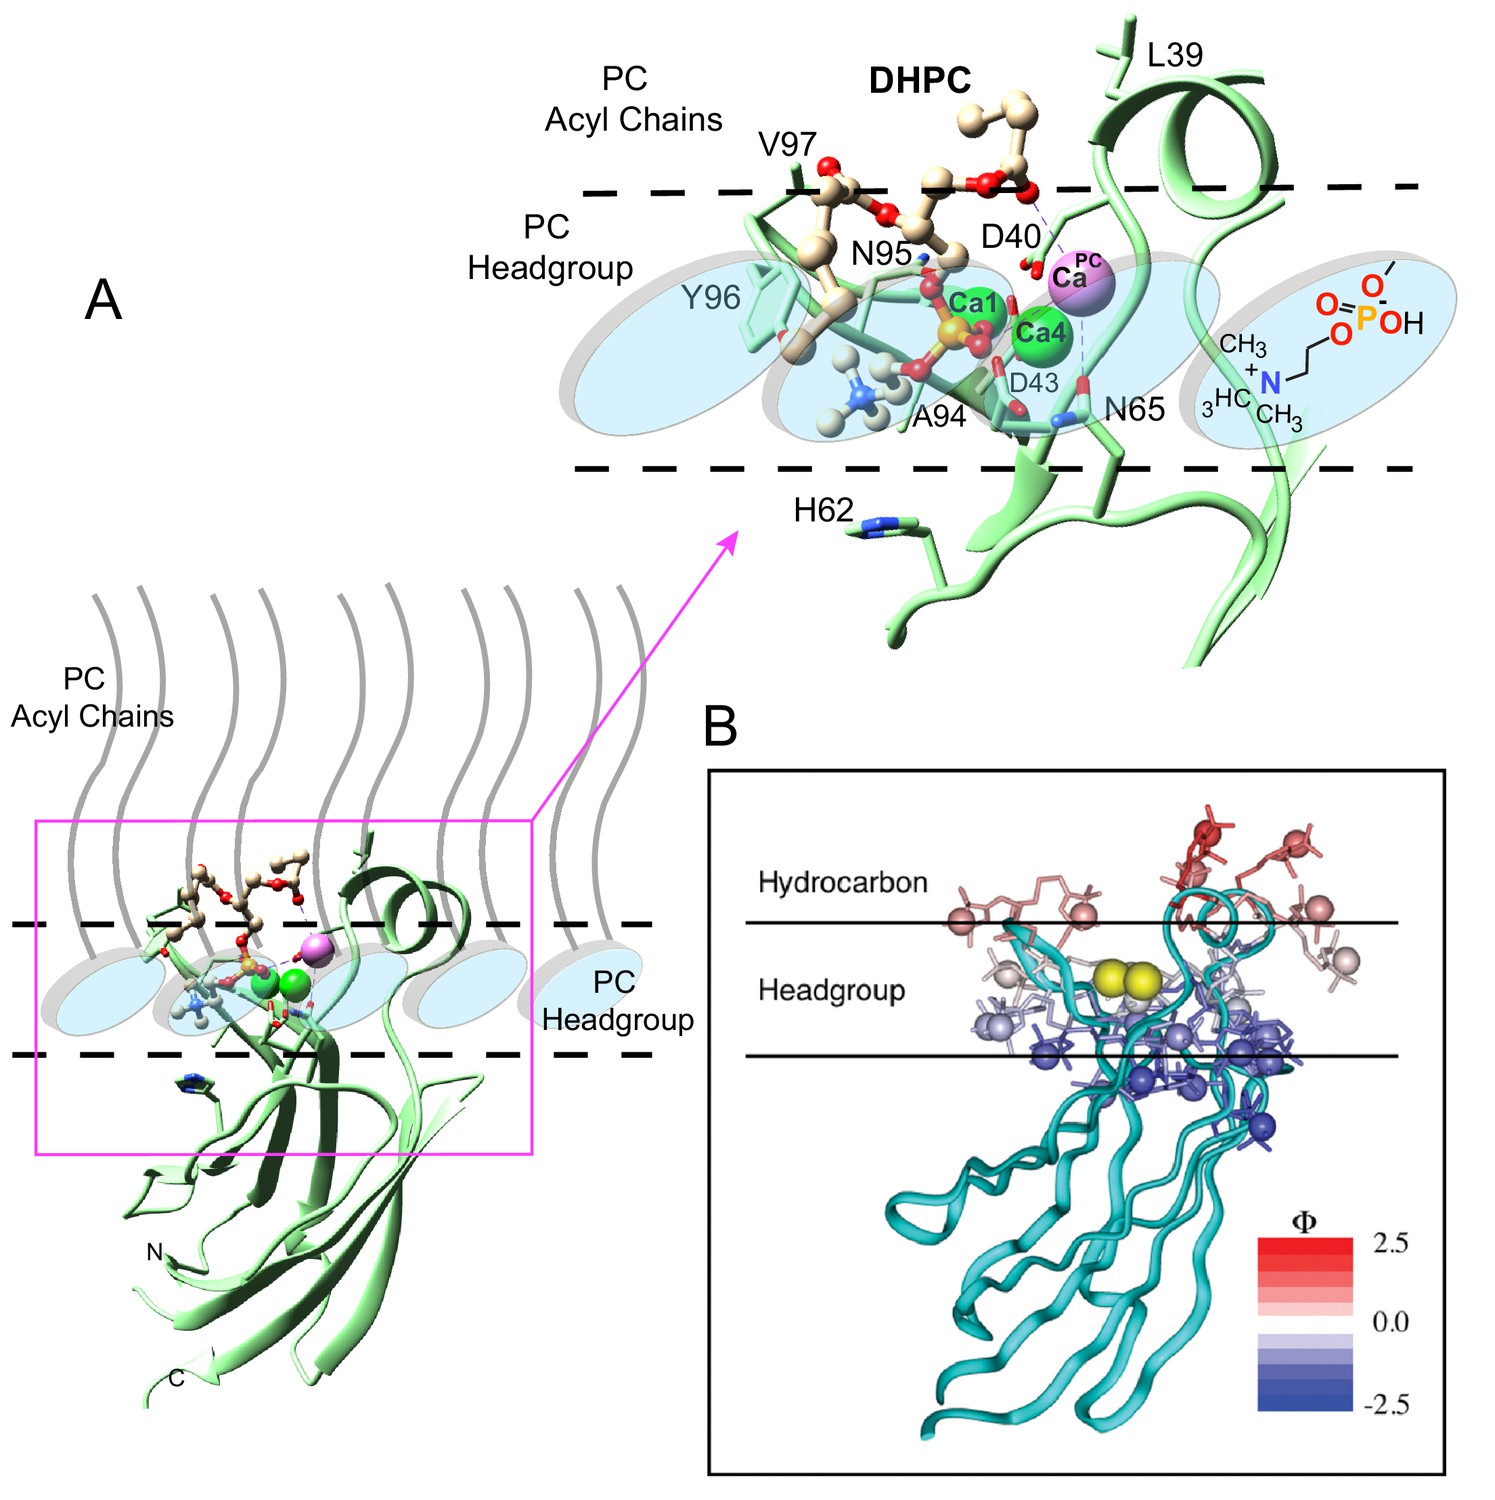
Structural interactions of the cPLA2α C2-domain complexed with Ca2+ and DHPC.
(A) Coordination of three bound Ca2+ ions observed in the C2-domain–DHPC complex. Residues that interact with Ca2+ ions are labeled in black with their side-chains (cyan) depicted in a stick representation. (B) Same view as in panel (A), but with PC-mediated interactions highlighted. Residues that interact directly with DHPC are labeled in red. (C) Space-filling view of bound DHPC and of Ca4 and CaPC in the cPLA2α C2-domain. Darker gray residues (Y96, A94, H62, N64, and D43) provide contact surfaces for choline (cyan). Phosphorus is represented in orange; calcium in green; oxygen in red; and acyl carbons in beige. (D) Schematic summary of DHPC- and Ca2+-binding interactions with the cPLA2α C2-domain.
Figure 2—figure supplement 1
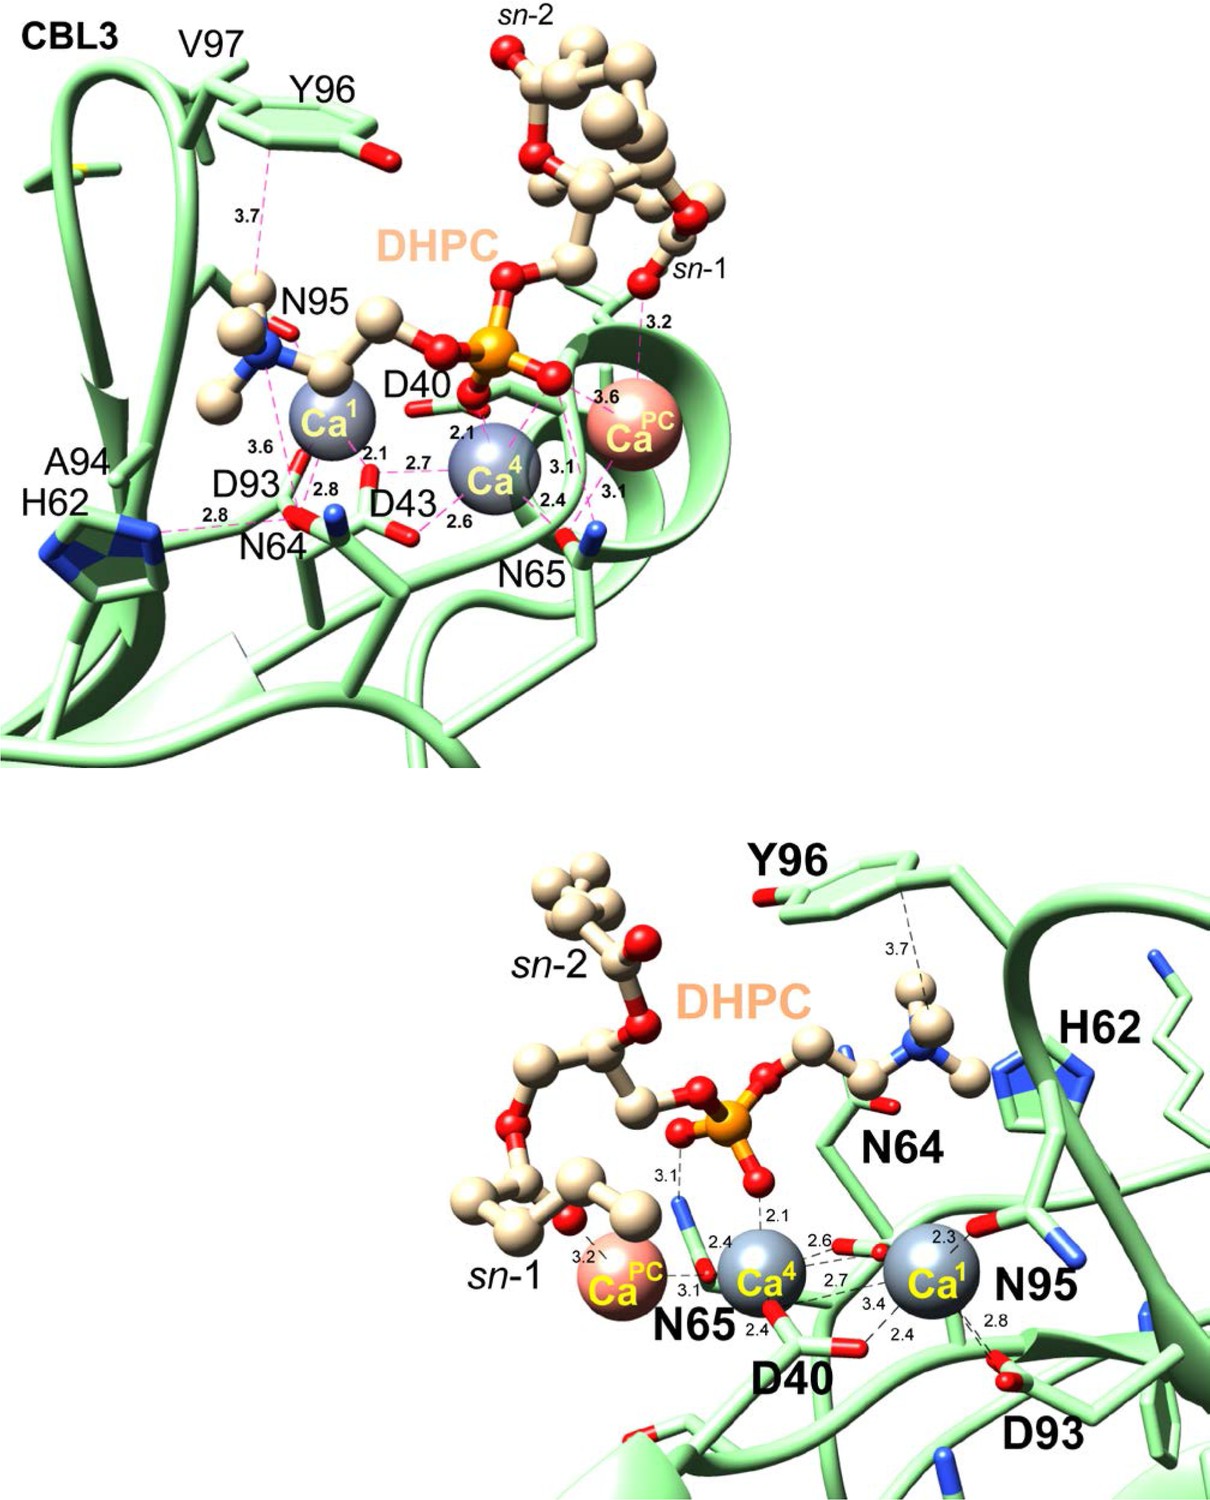
Zoomed views of the cPLA2α C2-domain complexed with Ca2+ and DHPC.
C2-domain and DHPC are shown in lime green and beige, respectively. Nitrogen, oxygen, and phosphorus atoms are blue, red, and orange, respectively. Numeric labels for dashed lines equal distances in Ångstroms. Lower structure provides a ‘backside’ view (relative to the upper structure) by rotation 180° in the xy plane.
Figure 3
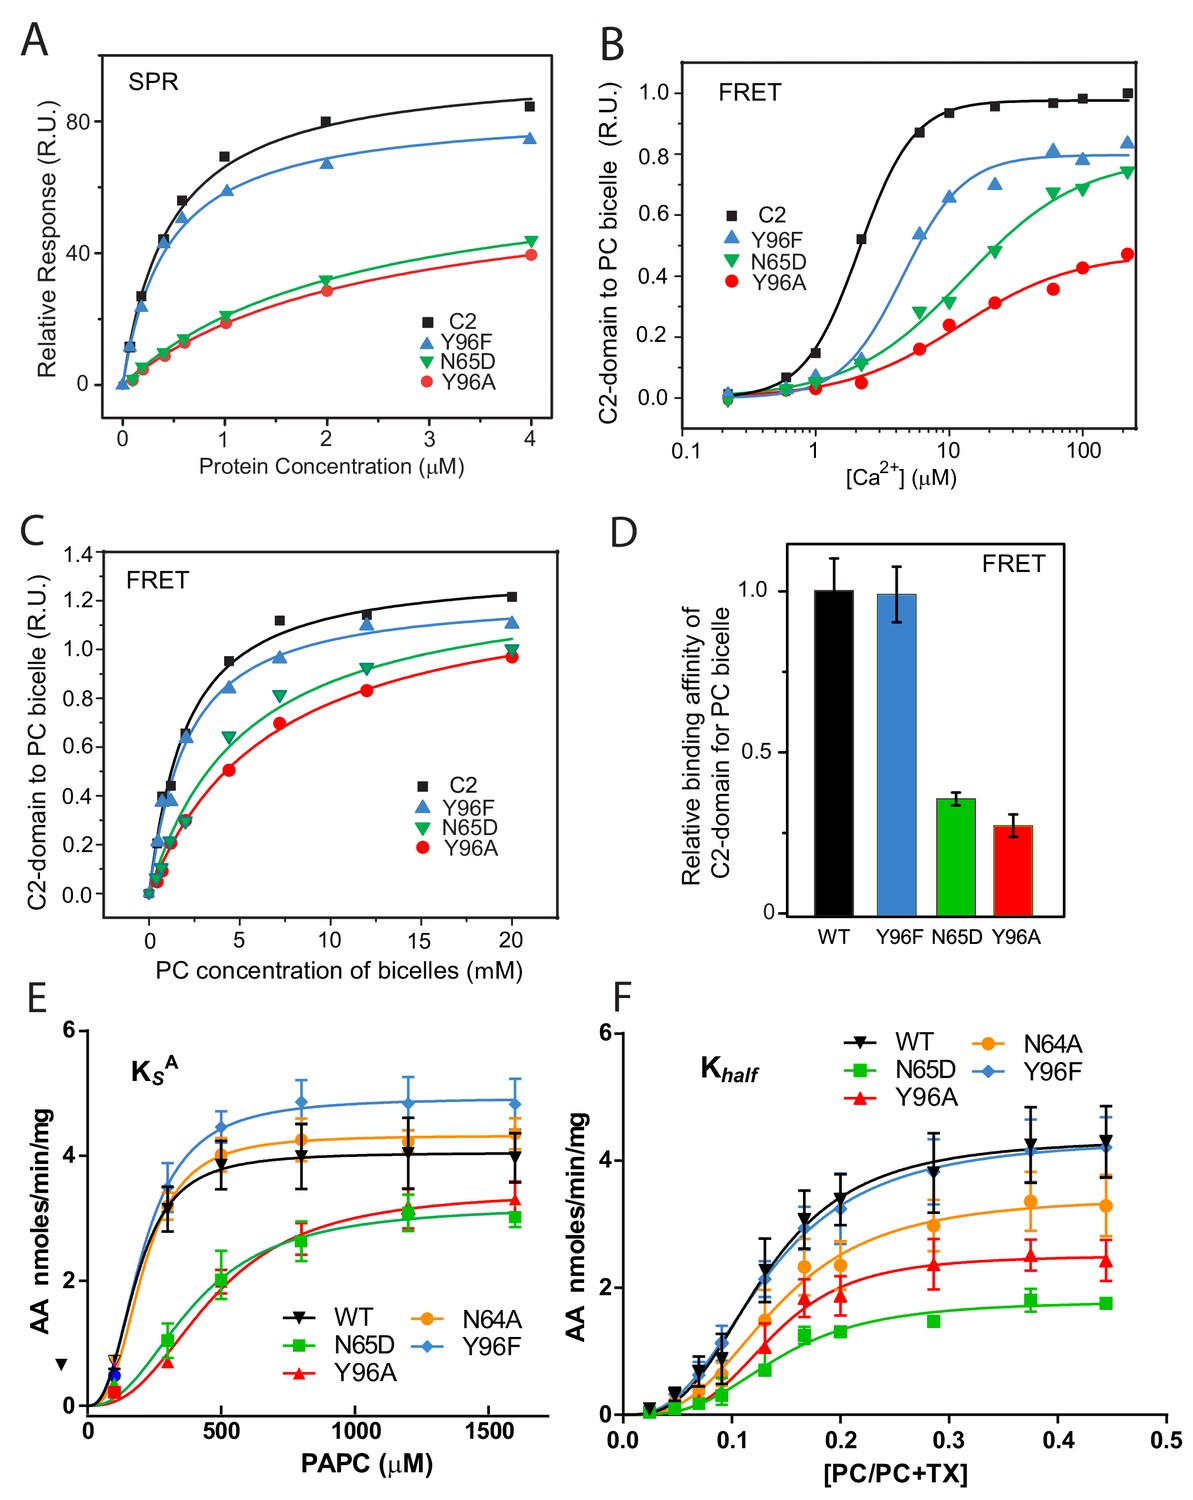
Membrane partitioning of cPLA2α C2-domains and cPLA2α catalytic activities of point-mutated C2-domains in the PC-binding region.
(A) SPR binding isotherms showing point mutant and control protein equilibrium adsorption to immobilized 1-palmitoyl-2-oleoyl phosphatidylcholine (POPC) vesicles saturating a L1 sensor chip at 5 μl/min solution flow rates (see 'Materials and methods'). (B) FRET binding isotherms showing the Ca2+ dependence of point mutant and control protein (0.5 μM) equilibrium adsorption to POPC–DHPC bicelles (4 μM) (see 'Materials and methods'). (C) FRET-binding isotherms showing the POPC–DHPC bicelle dependence of point mutant and control protein (0.5 μM) equilibrium adsorption at 50 μM Ca2+ (see 'Materials and methods'). (D) Relative binding affinity of C2-domain point mutants and control protein obtained for binding isotherms shown in panel (C). (E) Effect of the Y96F, Y96A, N64A, and N65D mutations on the dissociation constant (KsA) of human cPLA2α activity. Proteins were purified as described Stahelin et al. (2007). Activity was measured as a function of PC molar concentration for 60 min at 37°C. The PC mole fraction was held constant at 0.285. cPLA2α activities (nmol of arachidonic acid released/min/mg of recombinant cPLA2α) were collected on eight separate occasions and are presented as n = 4 for Y96F, n = 4 for Y96A, n = 4 for N64A, n = 4 for N65D, and n = 8 for WT. Error = standard deviation. R2 values are 0.9021, 09609, 0.9586, 0.9780, and 0.9485 for WT, Y96F, Y96A, N64A, and N65D, respectively. (F) Effect of Y96F, Y96A, N64A, and N65D mutations on the allosteric sigmoidal constant (Khalf) of human cPLA2α activity. Activity was measured as a function of increasing PC mole fractions for 60 min at 37°C. The PC mole fraction ([PC]/[PC]+[TX-100]) was 0.024 at 50 μM PC, 0.047 at 100 μM PC, 0.069 at 150 μM, 0.091 at 200 μM, 0.13 at 300 μM PC, 0.166 at 400 μM, 0.2 at 500 μM PC, 0.28 at 800 μM PC, 0.37 at 1200 μM PC, and 0.44 at 1600 μM PC. cPLA2α activities (nmol of arachidonic acid released/min/mg of recombinant cPLA2α) were collected on ten separate occasions and are presented as n = 4 for Y96F, n = 4 for Y96A, n = 4 for N64A, n = 4 for N65D, and n = 4 for WT. Error = standard deviation. R2 values are 0.9413, 0.9577, 0.9407, 0.9376, and 0.9761 for WT, Y96F, Y96A, N64A, and N65D, respectively.
-
Figure 3—source data 1
Membrane partitioning data for cPLA2α C2-domains mutated in PC binding region.
- https://doi.org/10.7554/eLife.44760.009
-
Figure 3—source data 2
Activity data for cPLA2α C2-domains mutated in PC binding region.
- https://doi.org/10.7554/eLife.44760.010
Figure 4 with 2 supplements
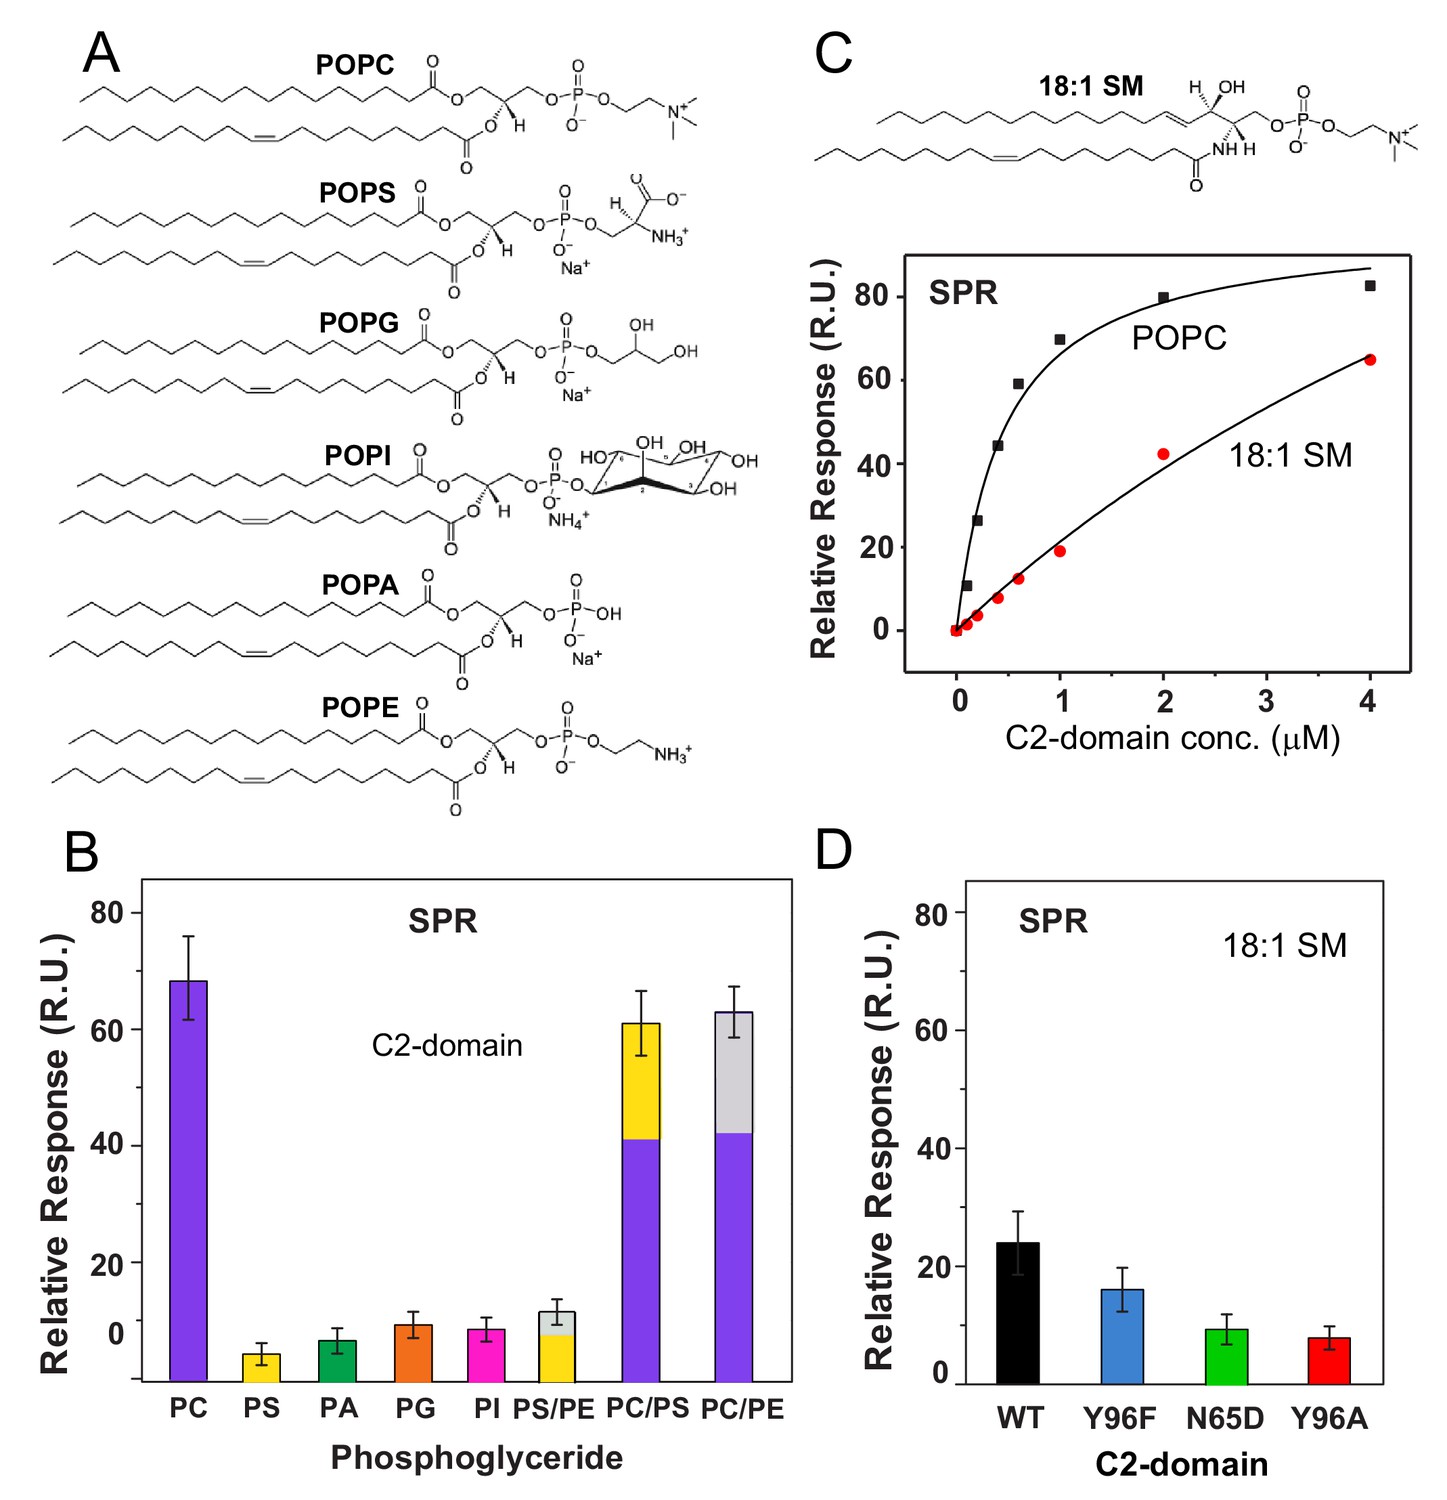
cPLA2α C2-domain binding affinity for phosphoglyceride and sphingomyelin (SM) vesicles.
(A) Phosphoglyceride structural formulas. (B) Relative affinities of the C2-domain (1 μM) for different phosphoglycerides obtained by SPR. Molar ratios for PS/PE, PC/PS and PC/PE mixed composition vesicles are 7:3. (see Figure 4—figure supplement 1). (C) SPR binding isotherms showing C2-domain equilibrium adsorption to immobilized POPC or 18:1-SM vesicles as a function of protein concentration (see Figure 4—figure supplement 2 for additional information). (D) Effect of C2-domain mutations (1 μM) on binding to 18:1 SM obtained by SPR (see 'Materials and methods' for other details).
-
Figure 4—source data 1
cPLA2α C2-domain binding affinity for phosphoglyceride and sphingomyelin (SM) vesicles.
- https://doi.org/10.7554/eLife.44760.017
Figure 4—figure supplement 1
Assessment of C2-domain binding to different phosphoglycerides.
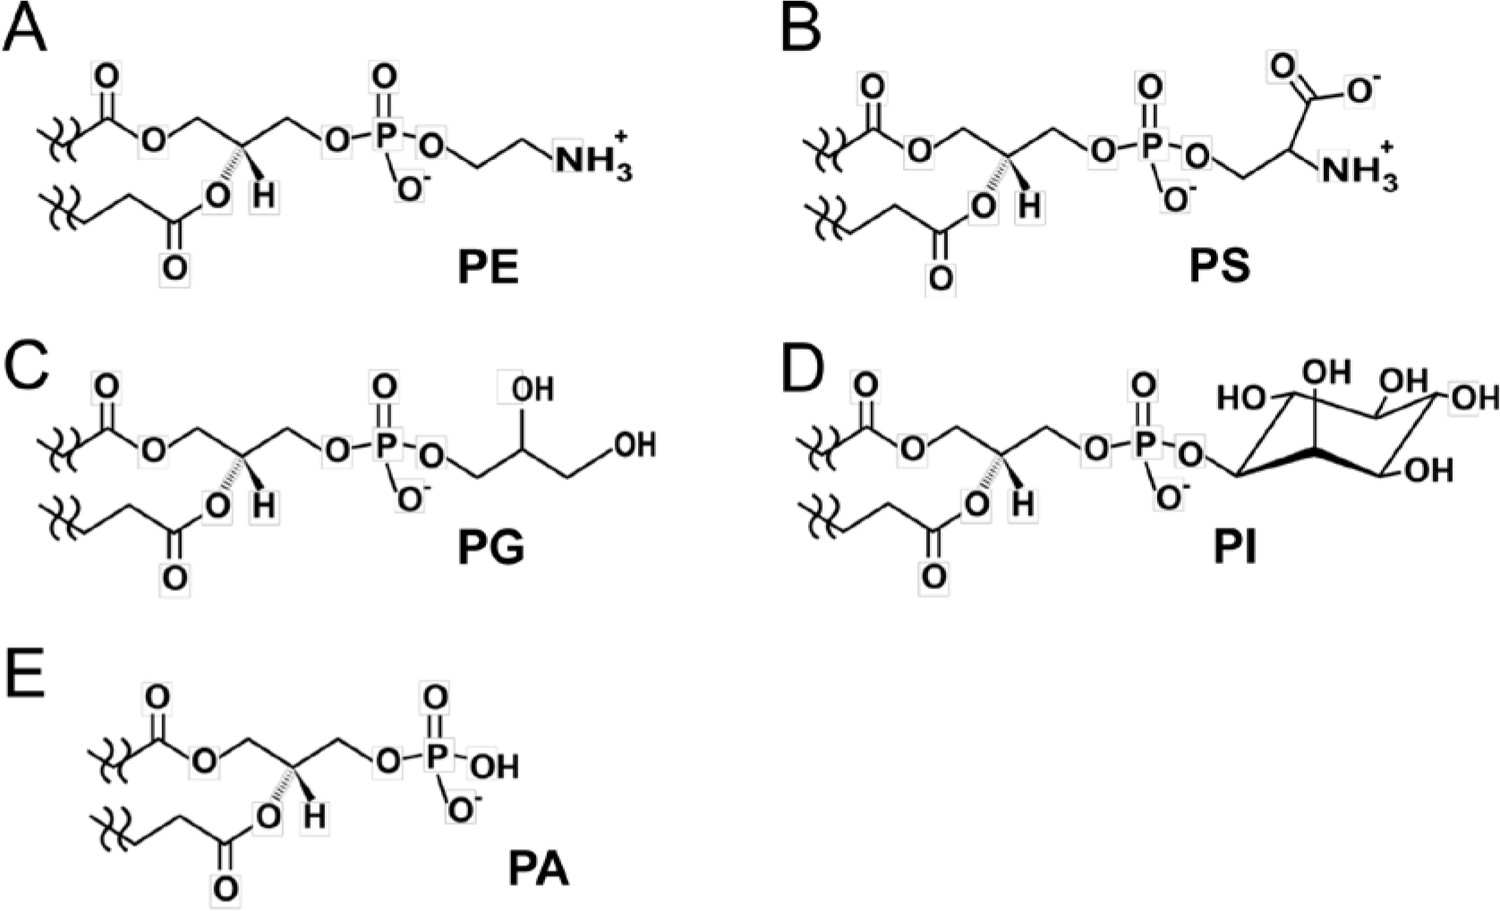
Head group chemical formulas of various non-PC membrane phosphoglycerides are (A) phosphatidylethanolamine, PE; (B) phosphatidylserine, PS; (C) phosphatidylglycerol, PG; (D) phosphatidylinositol, PI; and (E) phosphatidic acid, PA. All of the phosphoglycerol-based lipids have the same backbone topology but different head groups that define C2-domain binding specificity. Our findings reveal that the π-cation interaction is critical for binding to PC. PE (A) has a primary ammonium group replacing the –N+(CH3)3 group in PC. Yet, earlier FRET data (Nalefski et al., 1998) and our SPR data (Figure 4B) indicate relatively weak binding of cPLA2α C2-domain to PE. The electrostatic potential difference and diminished van der Waals contacts with Ala94, His62, and Asn64 could account for the binding affinity decrease for PE compared to PC. PS has a seryl group (B) replacing the –N+(CH3)3 group in PC. Although the primary ammonium group in the seryl group would seem to be a candidate for undergoing π-cation interaction with Tyr96, binding by C2-domain is weak (Figure 4B) suggesting steric clashing of the seryl carboxylate group with CBL residues. PG (C) and PI (D) are not suitable for interaction with cPLA2α C2-domain due to lack of an ammonium group and steric clashing by their bulky head groups. PA (E) has only a phosphoryl moiety as its head group, which promotes weak interaction. Our SPR binding data showing much weaker binding of these phosphoglyerides compared to PC (Figure 4B) are consistent with previous findings obtained using other techniques (Mosior et al., 1998; Nalefski et al., 1998; Six and Dennis, 2003).
Figure 4—figure supplement 2
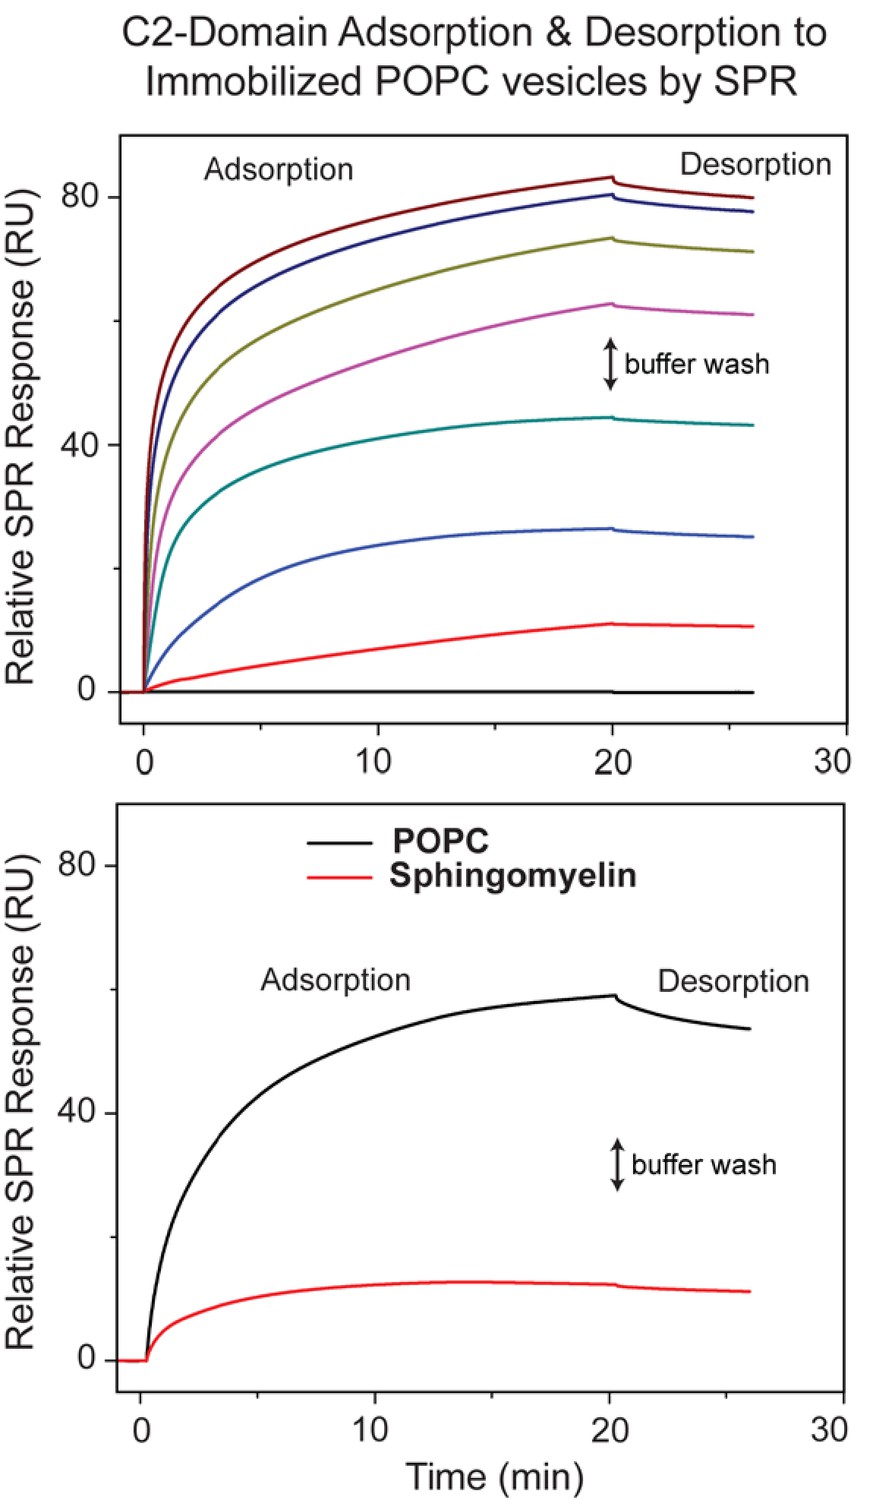
The concentration- and time-dependence of C2-domain adsorption/desorption to/from immobilized POPC and 18:1 SM vesicles measured by SPR.
(Upper panel) SPR data showing cPLA2α C2-domain adsorption/desorption to/from immobilized POPC vesicles at varying protein concentrations (0.1, 0.2, 0.4, 0.6, 1, 2, and 4 μM; bottom to top) and 5 μl/min flow rate. The two-headed arrow indicates switch to buffer containing no protein. The same approach was used to assess C2-domain adsorption to immobilized 18:1-SM vesicles shown in Figure 4C and 4D. The Kd values calculated from the binding isotherms for C2-domain and the point mutants are reported in Table 1. (Lower panel) SPR data showing the time-dependence for cPLA2α C2-domain adsorption/desorption to/from immobilized 18:1 SM vesicles at 0.6 μM protein concentration.
Figure 5
Model of the cPLA2α C2-domain selectively interacting with the PC membrane interface.
(A) Interaction of the C2-domain–DHPC structural complex with a PC membrane interface produced by ad hoc modeling. The dashed horizontal lines represent planar boundaries for the lipid headgroup and hydrocarbon regions of the PC bilayer. The crystal structure of the C2-domain–DHPC complex is represented as pale green ribbon. The Ca2+ ion that is unique to the C2-domain–DHPC complex is shown as a pale magenta sphere; whereas the other two Ca2+ ions are shown as green spheres. In the bound DHPC structure, blue, red, orange, and beige colors represent nitrogen, oxygen, phosphorus, and carbon atoms, respectively. The zoomed view shows how the orientation and position of the PC headgroup bound by the C2-domain requires no major conformational change relative to those of unbound PC headgroups comprising the membrane interface. Membrane docking orientation and penetration depth by the C2-domain are based on previous data illustrated in panel (B) (Nalefski and Falke, 1998; Ball et al., 1999; Malmberg et al., 2003; Malmberg and Falke, 2005). (B) cPLA2α C2-domain docking orientation and penetration depth at the membrane interface, as determined by electron paramagnetic resonance power saturation. [Reprinted (adapted) with permission Malmberg et al., 2003, Biochemistry 42, 13227–13240. Copyright: American Chemical Society.]. The crystal structure of the lipid-free C2-domain (PDB: RLW) is represented by the cyan ribbon with two Ca2+ ions shown as yellow spheres. The horizontal lines represent planar boundaries for the lipid headgroup and hydrocarbon regions of the bilayer. Protein spin labels oriented in their final optimized conformations are colored according to their measured depth parameters (Φ), with positive and negative depth parameters indicated by increasing red and blue color intensity, respectively.
Figure 6 with 1 supplement
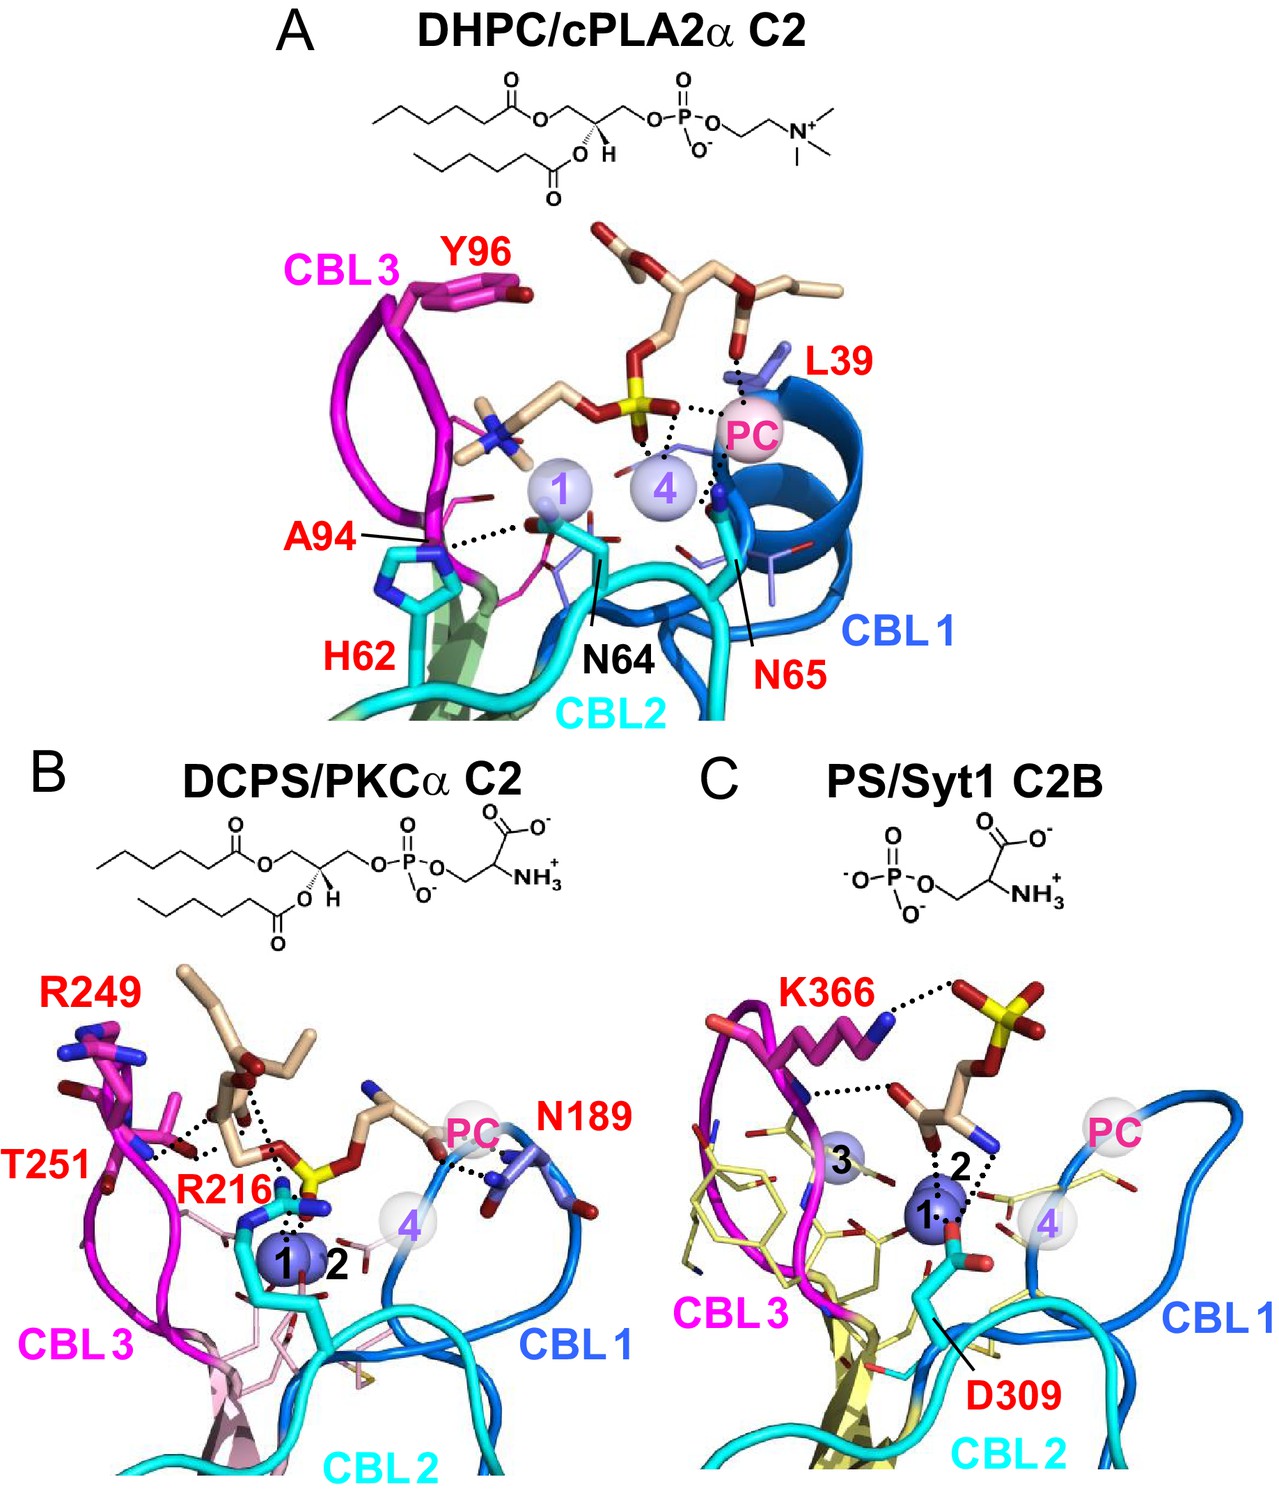
Structures of various C2-domains bound to lipids.
(A) cPLA2α C2-domain bound to DHPC determined in this study. (B) PKCα C2-domain bound to phosphatidylserine (PDB 1DSY). (C) Synaptotagmin-1 C2B-domain bound to phosphoserine (PDB 2YOA). For comparison, Ca4 (purple sphere) and CaPC (pink sphere) in panel (A) are overlaid as pale white spheres in panels (B) and (C). Residues that are interacting directly with ligand are shown as stick models and labeled in red.
Figure 6—figure supplement 1
Ca2+binding site differences in the synaptotagmin-1 C2A domain versus the cPLA2α C2-domain complexed with DHPC.
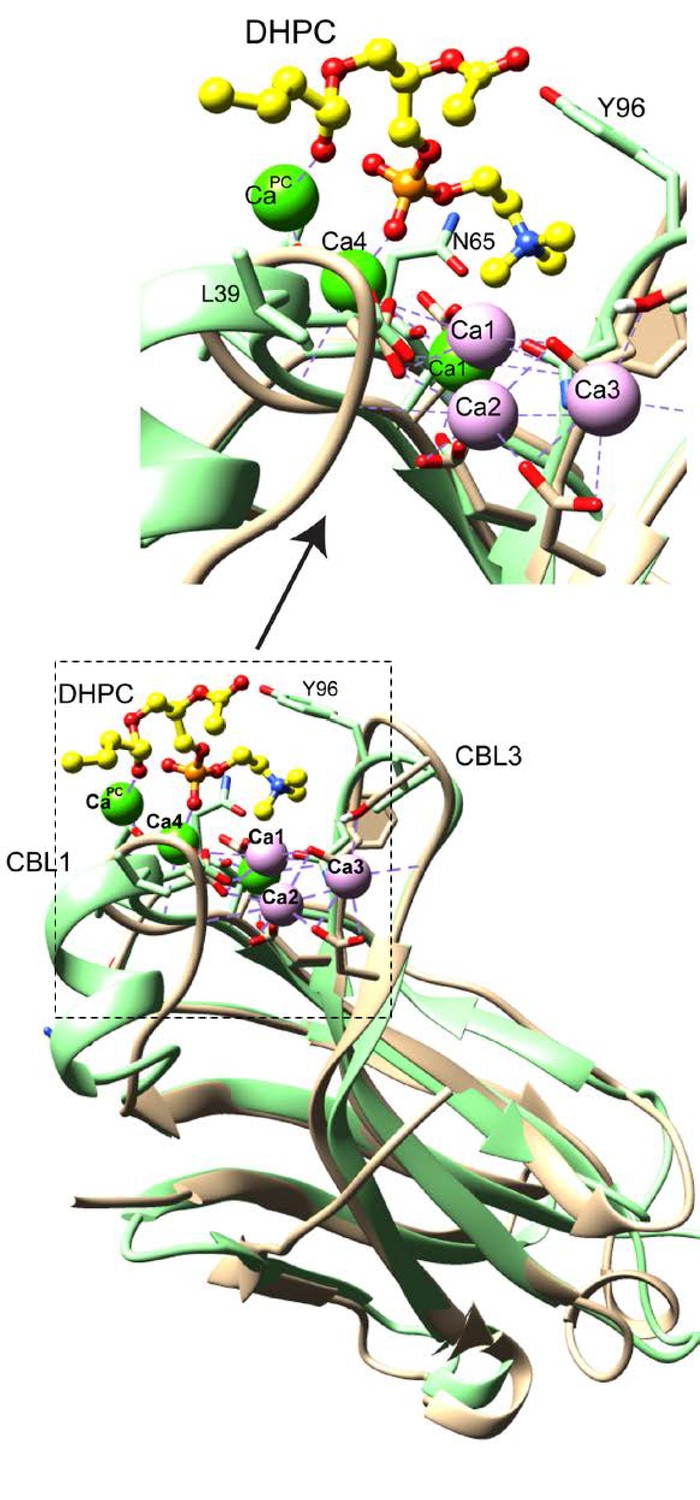
cPLA2α C2-domain complexed with DHPC. cPLA2α C2-domain (green) is shown with bound Ca2+ (green) and bound DHPC (yellow). Both Ca4 and CaPC are directly involved in DHPC binding. Synaptotagin-1 C2A domain (beige) also binds three Ca2+ atoms (plum) (PBD:1BYN). Only one Ca2+ binding site (Ca1) overlaps with cPLA2 C2-domain. In contrast, all three Ca2+ binding positions in synaptotagin-1 C2B domain (Figure 6C) overlap with those in synaptotagin-1 C2A. Ca2+ binding site identification corresponds with the numbering system of Rizo and Südhof (1998).
Figure 7

C2-domain sequence alignment for five human cPLA2 isoforms showing the uniqueness of the Tyr96 residue in the cPLA2α C2-domain.
β-strand sequences (arrows) as well as CBL2 and CBL3 sequences (bracketed) are shown above the alignment. Green highlights represent identical residues. Cyan highlights represent similar residues. The yellow highlights facilitate comparison of other isoform residues with N65 and Y96 (red) which are key for PC selectivity by the cPLA2α C2-domain. Underlined black residues in cPLA2α (R59, R61, and H62) participate in C1P binding (Stahelin et al., 2007; Ward et al., 2013). Sequence alignment was generated using Clustal Omega.
Tables
Table 1
Interaction distances in cPLA2α C2-domain.
Interaction distances (Å) associated with bound calcium in the lipid-free cPLA2α C2-domain structure (2.4 Å resolution; PDB 1RLW) of Perisic et al. (1998) and with bound calcium and DHPC in the C2-domain–DHPC crystal complex (2.2 Å resolution) of the present study.
| 1RLW | Ca1 | Ca4 | ||||||||
|---|---|---|---|---|---|---|---|---|---|---|
| Asp40 | 2.3/3.4 | 2.3 | ||||||||
| Asp43 | 2.1 | 2.6/2.2 | ||||||||
| Asp93 | 2.7/2.5 | |||||||||
| Asn65 | 2.1 | |||||||||
| Asn95 | 2.2 | |||||||||
| C2/DHPC | C2 | DHPC | ||||||||
| Ca1 | Ca4 | CaPC | N+(CH3)3 | PO4 | sn-2 C=O | sn-1 C=O | sn-1 chain | |||
| Asp40 | 2.4/3.4 | 2.4 | ||||||||
| Asp43 | 2.3 | 2.6/2.7 | ||||||||
| Asp93 | 2.7/2.8 | |||||||||
| Asn65 | 2.4 | 3.1 | ||||||||
| Asn95 | 2.3 | |||||||||
| Tyr96 | ~4.0 | |||||||||
| Ala94 | 3.6 | |||||||||
| His62 | ~5.0 | ~8.5 | ||||||||
| Asn64 | 3.6 | |||||||||
| Leu39 | 5.4 | |||||||||
| Ca1 | 5.5 | 5.7 | ||||||||
| Ca4 | 6.3 | 2.1 | ||||||||
| CaPC | 8.5 | 3.6 | 3.2 | 3.1 | ||||||
Table 2
Kd values determined by SPR.
https://doi.org/10.7554/eLife.44760.011| Protein | Kd (M) | Fold increase* |
|---|---|---|
| WT-C2-domain | (4.2 ± 0.8)×10−7 | ---- |
| Y96F-C2-domain | (4.3 ± 0.5)×10−7 | 1 |
| Y96A-C2-domain | (2.4 ± 0.4)×10−6 | 5.7 |
| N65D-C2-domain | (2.2 ± 0.5)×10−6 | 5.2 |
-
*Fold increase in Kd relative to the C2-domain binding to POPC vesicles. Kd values were determined from the normalized saturation binding responses (Req) at the protein concentrations shown in Figure 4—figure supplement 1 after fitting by nonlinear least squares analysis using Req = Rmax/(1 + Kd/C).
Table 3
Kinetic activity parameters for point-mutated PC-binding-site residues in the C2-domain of cPLA2α*.
https://doi.org/10.7554/eLife.44760.012| Protein | KsA (μM) | Vmax (nmol/min/mg) |
|---|---|---|
| WT-cPLA2α | 182.8 ± 12.5 | 4.053 ± 0.092 |
| Y96F-cPLA2α | 205.8 ± 12.7 | 4.930 ± 0.111 |
| Y96A-cPLA2α | 467.5 ± 31.6 | 3.438 ± 0.177 |
| N65D-cPLA2α | 394.9 ± 29.8 | 3.203 ± 0.166 |
| N64A-cPLA2α | 207.7 ± 9.63 | 4.328 ± 0.069 |
-
*Analyses for data shown in Figure 3E.
Table 4
Kinetic activity parameters for point-mutated PC-binding-site residues in the C2-domain of cPLA2α *
https://doi.org/10.7554/eLife.44760.013| Protein | K0.5 (mole fraction) | Vmax (nmol/min/mg) |
|---|---|---|
| WT-cPLA2α | 0.130 ± 0.007 | 4.352 ± 0.183 |
| Y96F-cPLA2α | 0.132 ± 0.007 | 4.362 ± 0.172 |
| Y96A-cPLA2α | 0.139 ± 0.006 | 2.510 ± 0.098 |
| N65D-cPLA2α | 0.143 ± 0.005 | 1.791 ± 0.050 |
| N64A-cPLA2α | 0.142 ± 0.008 | 3.436 ± 0.168 |
-
*Analyses for data shown in Figure 3F
Key resources table
| Reagent (species) or resource | Designation | Source or reference | Identifiers | Additional information |
|---|---|---|---|---|
| Strain, strain background (Escherichia coli) | BL21 (DE) Star competent cells | ThermoFisher Scientific | SKU# C6010-03 | Cells for protein expression |
| Transfected construct (E. coli) | pET SUMO | Snapgene | https://www.snapgene.com/resources/plasmid-files/?set=ta_and_gc_cloning_vectors&plasmid=pET_SUMO _(linearized) | Protein expression vector |
| Commercial assay or kit | JCSG Core Suites | Qiagen | https://www.qiagen.com/us/shop/sample-technologies/protein/crystallization/the-jcsg-core-suites/#orderinginformation | Protein crystallization; crystallization screening kit |
| Chemical compound, drug | 1,2-dihexanoyl -sn-glycero-3- phosphocholine | Avanti Polar Lipids | https://avantilipids.com/product/850305/ | DHPC |
| Chemical compound, drug | 1-palmitoyl-2- oleoyl-glycero-3- phosphocholine | Avanti Polar Lipids | https://avantilipids.com/product/850457/ | POPC |
| Chemical compound, drug | 1-palmitoyl-2-oleoyl-sn-glycero-3-phospho-L-serine | Avanti Polar Lipids | https://avantilipids.com/product/840034/ | POPS |
| Chemical compound, drug | 1-palmitoyl-2-oleoyl-sn-glycero-3-phosphoethanolamine | Avanti Polar Lipids | https://avantilipids.com/product/850757 | POPE |
| Chemical compound, drug | 1-palmitoyl-2- oleoyl-sn-glycero-3-phosphate | Avanti Polar Lipids | https://avantilipids.com/product/840857 | POPA |
| Chemical compound, drug | 1-palmitoyl-2-oleoyl-sn-glycero-3-phospho-(1'-rac-glycerol) | Avanti Polar Lipids | https://avantilipids.com/product/840457 | POPG |
| Chemical compound, drug | N-oleoyl-D-erythro-sphingosylphosphorylcholine | Avanti Polar Lipids | https://avantilipids.com/product/860587 | 18:1 SM |
| Chemical compound, drug | 1,2-dioleoyl-sn-glycero-3-phosphoethanolamine-N-(7-nitro-2–1,3-benzoxadiazol-4-yl) | Avanti Polar Lipids | https://avantilipids.com/product/810145 | NBD-PE |
| Software, algorithm | GeneCards | http://genecards.org | RRID:SCR_002773 | Orthologs; retrieval of protein sequences for human, mouse, and chicken proteins |
| Software, algorithm | UniProtKB | http://www.uniprot.org/help/uniprotkb | RRID:SCR_004426 | C2-domain sequences for various proteins and organisms |
| Software, algorithm | NCBI Protein | http://www.ncbi.nlm.nih.gov/protein | RRID:SCR_003257 | Protein sequences for human, mouse, and chicken proteins |
| Software, algorithm | Clustal Omega | http://www.ebi.ac.uk/Tools/msa/clustalo/ | RRID:SCR_001591 | Software package for multiple sequence alignment |
| Software, algorithm | Clustal W2 | http://www.ebi.ac.uk/Tools/ msa/clustalw2/ | RRID:SCR_002909 | Multiple sequence alignment program for DNA or proteins. |
| Software, algorithm | UCSF Chimera | http://plato.cgl.ucsf.edu/chimera/ | RRID:SCR_004097 | Program for interactive visualization and analysis of molecular structures |
| Software, algorithm | Protein Data Bank (PDB) | http://www.wwpdb.org/ | RRID:SCR_006555 | Macromolecular structure archive that oversees and reviews deposition and processing data |
| Software, algorithm | Coot | http://www2.mrc-lmb.cam.ac.uk/personal/pemsley/coot/ | RRID:SCR_014222 | Software for macromolecular model building, completion and validation, and protein modeling using X-ray data |
| Software, algorithm | PHENIX | https://www.phenix-online.org/ | RRID:SCR_014224 | Python-based software suite for determination of X-ray crystallographic molecular structures |
| Software, algorithm | PyMol | http://www.pymol.org/ | RRID:SCR_000305 | Data processing, 3D visualization and rendering software |
| Software, algorithm | PDBeFold | http://pdbe.org/fold/ | RRID:SCR_004312 | Co-alignment of compared structures |
| Peptide, recombinant protein | Cytosolic phospholipase A2 | https://www.uniprot.org/uniprot/P47712 | Human cPLA2 sequence | |
| Peptide, recombinant protein | Cytosolic phospholipase A2 | https://www.uniprot.org/uniprot/P47713 | Mouse cPLA2 sequence | |
| Peptide, recombinant protein | Cytosolic phospholipase A2 | https://www.uniprot.org/uniprot/P49147 | Chicken cPLA2 sequence |
Table 5
X-ray data collection statistics.
https://doi.org/10.7554/eLife.44760.022| Native | |
|---|---|
| Data collection | |
| Space group | C222 |
| Cell dimensions | |
| a, b, c (Å) | 108.3, 187.4, 68.8 |
| Wavelength (Å) | 1.00000 |
| Resolution (Å) * | 50–2.20 (2.24–2.20) |
| Rsym* | 5.9 (36.3) |
| I/σI* | 30.9 (1.9) |
| Completeness (%)* | 99.5 (97.7) |
| Redundancy* | 7.7 (6.6) |
| Refinement | |
| Resolution (Å) | 47–2.2 |
| No. reflections | 35,185 |
| Rwork/Rfree (%) | 22.4/24.9 |
| No. atoms | |
| Protein | 2998 |
| Water | 82 |
| Ion | 11 |
| Ligand | 75 |
| B-factor (Å2) | |
| Protein | 59.9 |
| Water | 56.6 |
| Ion | 54.2 |
| Ligand | 81.3 |
| R.m.s. deviations | |
| Bond lengths (Å) | 0.008 |
| Bond angles (°) | 1.117 |
-
One crystal was used for each data set.
*Highest resolution shell is shown in parenthesis.
Additional files
-
Transparent reporting form
- https://doi.org/10.7554/eLife.44760.023
Download links
A two-part list of links to download the article, or parts of the article, in various formats.
Downloads (link to download the article as PDF)
Open citations (links to open the citations from this article in various online reference manager services)
Cite this article (links to download the citations from this article in formats compatible with various reference manager tools)
Structural basis of phosphatidylcholine recognition by the C2–domain of cytosolic phospholipase A2α
eLife 8:e44760.
https://doi.org/10.7554/eLife.44760


