Microsecond sub-domain motions and the folding and misfolding of the mouse prion protein
- Tata Institute of Fundamental Research, India
- Indian Institute of Science Education and Research, India
Figures
Figure 1 with 1 supplement
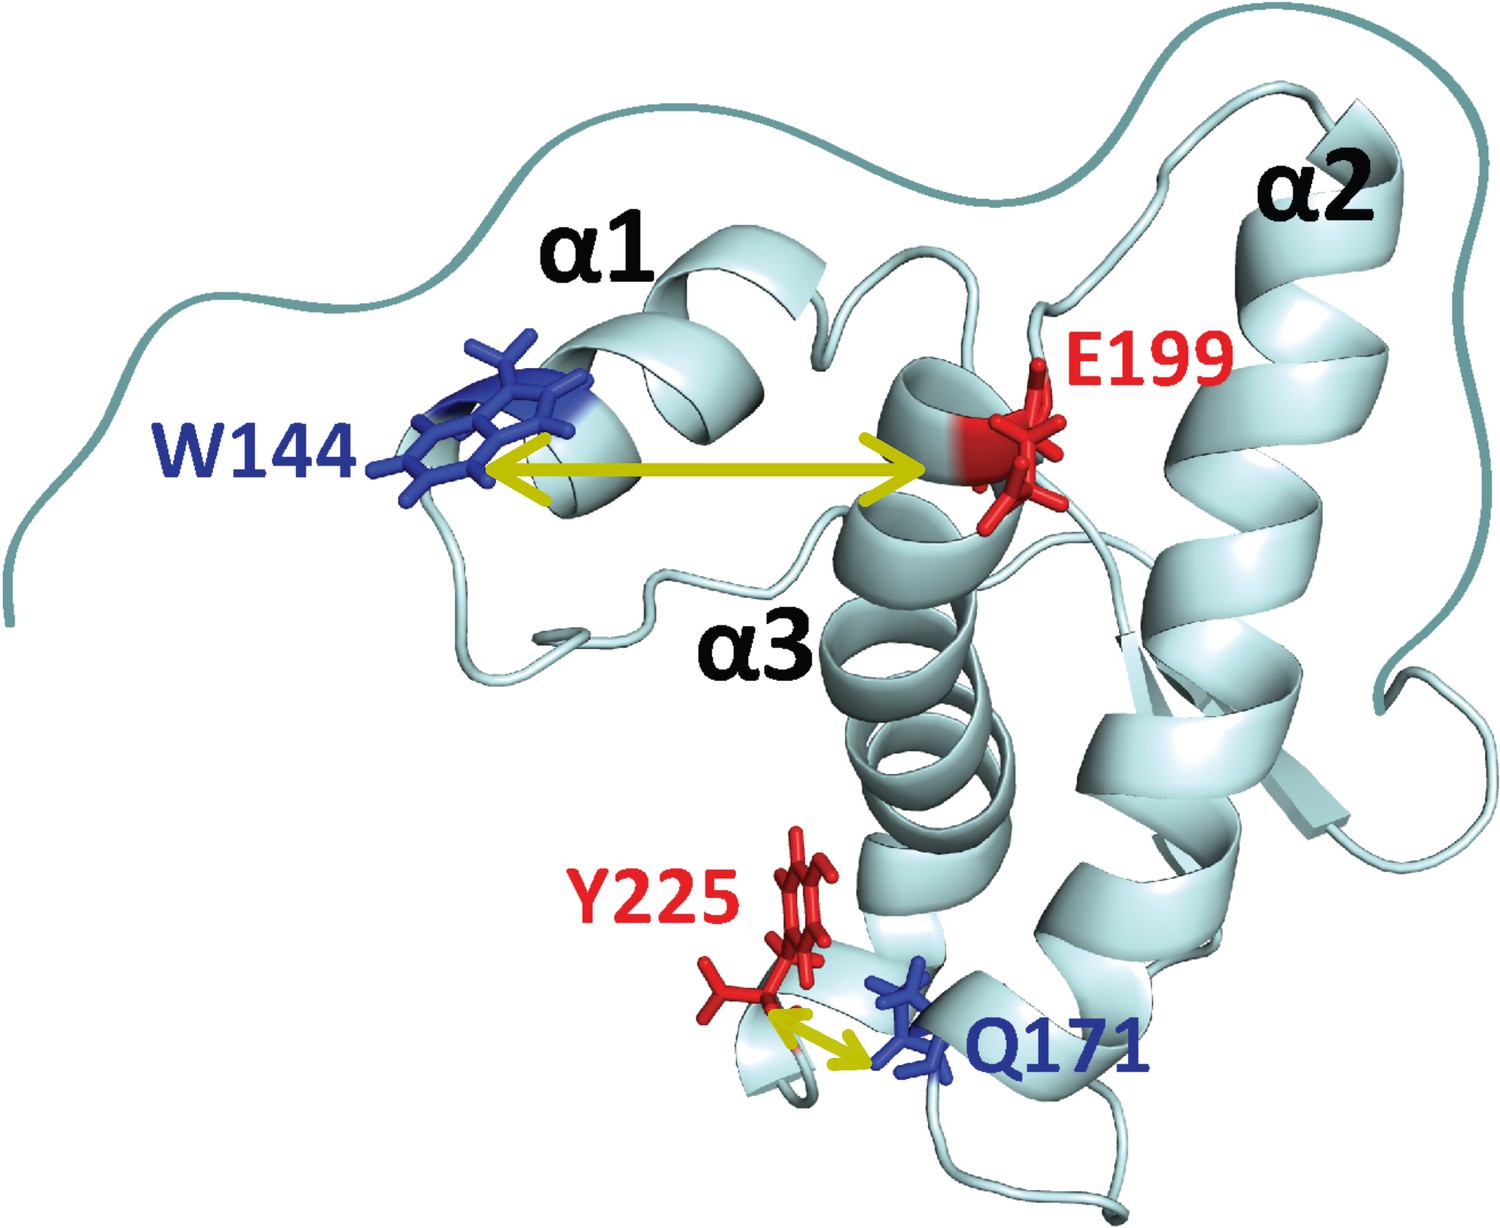
Structure of moPrP.
Full length moPrP (23-231) is shown (PDB ID: 1AG2). The two distances, W144/C199 and W171/C225, across which the structural dynamics were monitored by PET-FCS are indicated by yellow arrows. For each distance, the position of the quencher (Trp residue) is indicated in blue, and the position where a Cys residue was introduced for Atto655 labeling, is colored red. The three α-helices (α1, α2, α3) are indicated.
Figure 1—figure supplement 1

Far-UV CD spectra of different labeled and unlabeled mutant variants of moPrP.
The CD spectra of (a) W144/C199 moPrP, (b) Trp-less control protein C199 moPrP, (c) W171/C225 moPrP, and (d) Trp-less control protein C225 moPrP are shown. The spectra of the unlabeled and labeled proteins for each variant are shown in black and red, respectively, in each panel. The spectrum of the unlabeled wt protein is shown in blue in each of the panels.
Figure 2 with 3 supplements
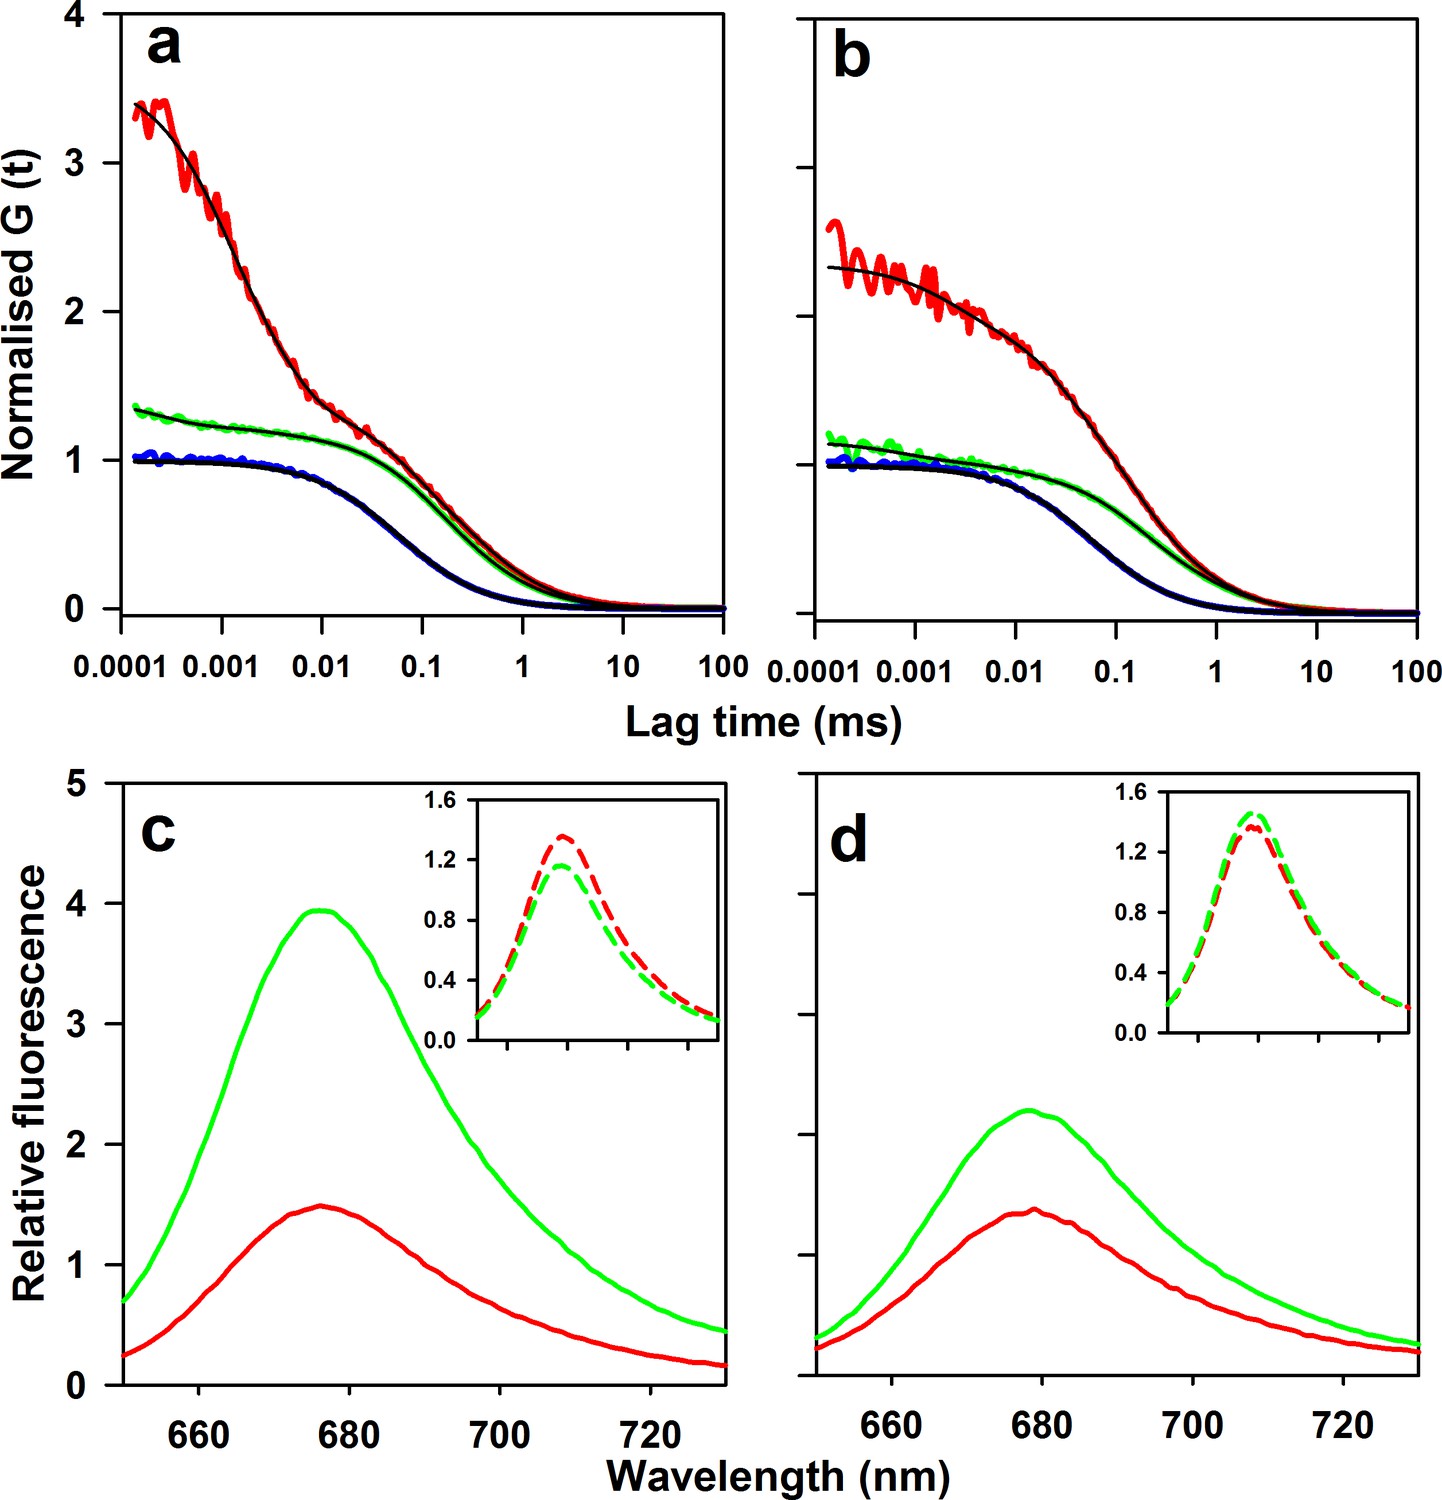
Microsecond dynamics of moPrP at pH 4 monitored by PET-FCS.
(a) The autocorrelation function (ACF) of W144/C199-Atto moPrP is shown in red. The ACF of free Atto dye, acquired under identical conditions, is shown in blue. The ACF of the control Trp-less variant, C199-Atto moPrP, is shown in green. The fits to appropriate models are shown in black for each ACF. (b) The ACF of W171/C225-Atto moPrP, free Atto dye and the Trp-less control protein C225-Atto moPrP are shown in red, blue and green, respectively. The fits to appropriate models are shown in black for each ACF. The values of τd for free Atto dye, W144/C199-Atto moPrP and W171/C225-Atto moPrP are 66 ± 5, 304 ± 22 and 316 ± 30 µs. (c) Atto fluorescence emission spectra of W144/C199-Atto moPrP (red) and the corresponding Trp-less control protein C199-Atto moPrP (green) at pH 4, are shown. (d) Atto 655 fluorescence emission spectra of W171/C225-Atto moPrP (red) and corresponding Trp-less control protein C225-Atto moPrP (green) at pH 4, are shown. In panels c and d, the spectra of the native proteins are shown as continuous lines; the insets show the spectra of the unfolded proteins (in 6 M Urea) as dashed lines (inset). The spectra were normalized to the fluorescence of the Trp-containing protein at 690 nm.
-
Figure 2—source data 1
ACFs and fluorescence spectra of moPrP mutant variants, control Trp-less proteins and dye.
- https://doi.org/10.7554/eLife.44766.011
Figure 2—figure supplement 1
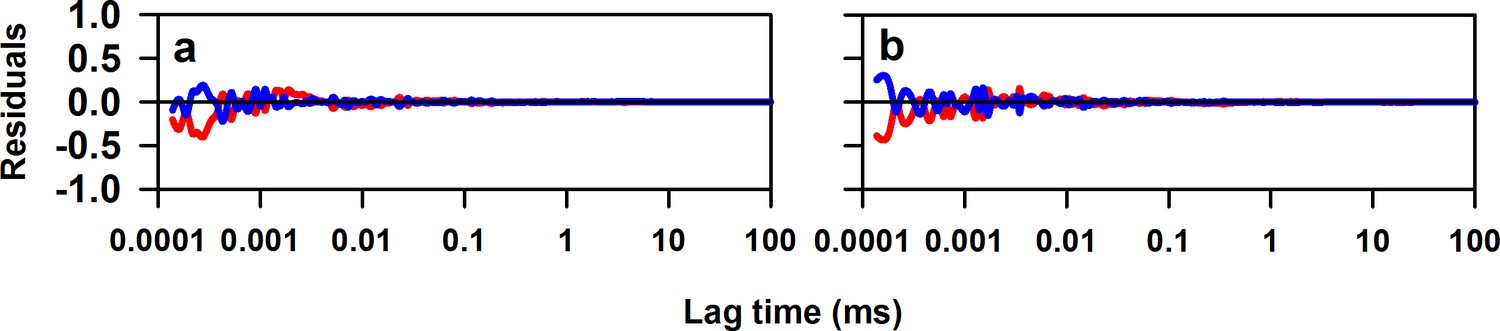
Residuals of fits to the ACF to Equation 1 in main text.
(a) Residuals for the fit to the ACF of W144/C199-Atto moPrP (The data and fit are shown in Figure 2a). (b) Residuals of the fit to the ACF of W171/C225-Atto moPrP (The data and fit are shown in Figure 2b). In each panel, the red line indicates the residuals for the fit to an equation having two exponential components and the blue line represents residuals for the fit to an equation having three exponential components.
-
Figure 2—figure supplement 1—source data 1
Residuals of fits to the ACF.
- https://doi.org/10.7554/eLife.44766.006
Figure 2—figure supplement 2
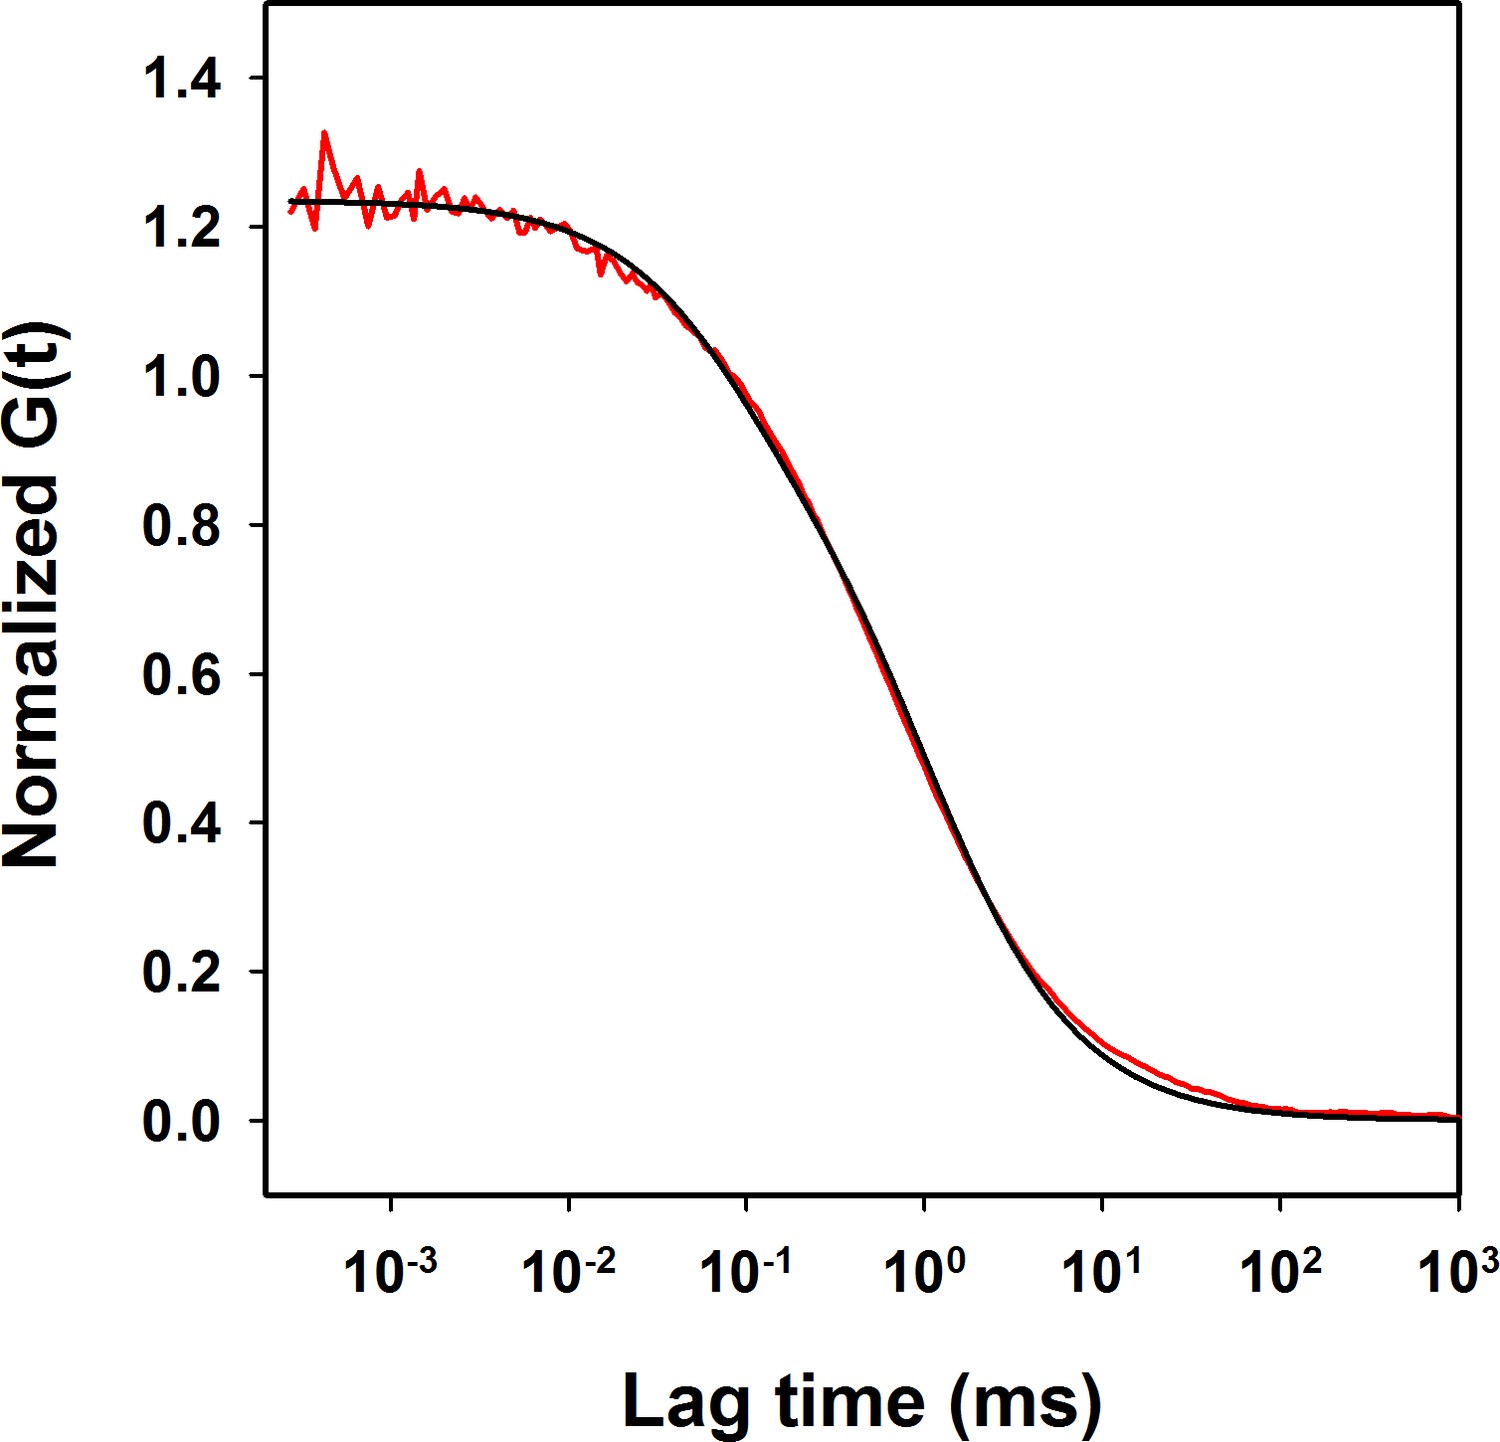
ACF of W144/C199-Atto moPrP in 6 M urea at pH 4.
The raw data are shown in red and fit to the data to the equation having a diffusion component and a single exponential component is shown in black. The diffusion time obtained is 955 µs and the time scale of conformational dynamics obtained is 75 µs. The ACF is normalized to the number of molecules in the confocal volume.
-
Figure 2—figure supplement 2—source data 1
ACF of W144/C199-Atto moPrP in6Murea at pH 4.
- https://doi.org/10.7554/eLife.44766.008
Figure 2—figure supplement 3
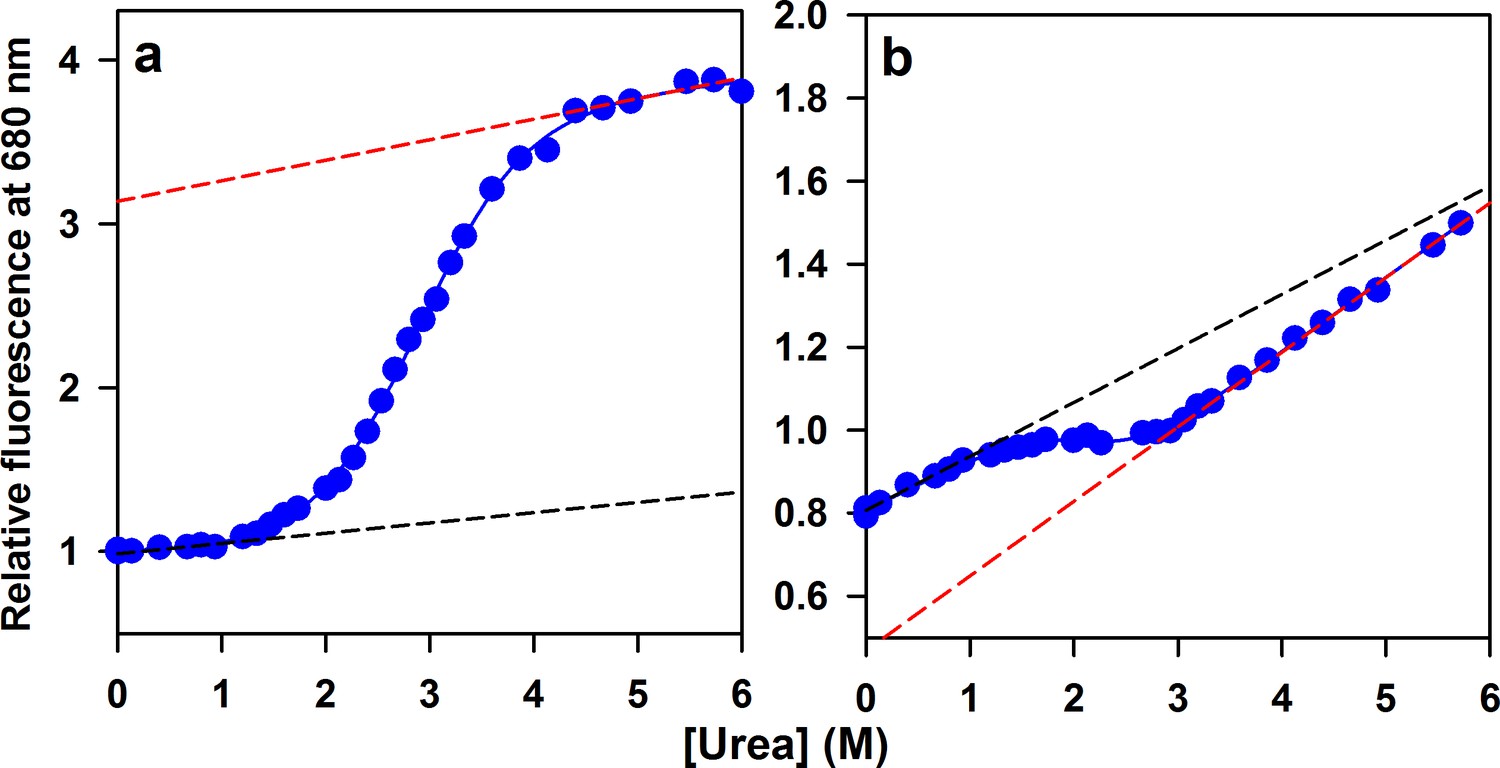
Equilibrium unfolding transition of Atto655-labeled mutant variants of moPrP.
(a) Equilibrium unfolding transition of W144/C199-Atto moPrP, monitored by measuring the fluorescence of Atto 655 moiety attached to the protein is shown. The continuous line through the data points is the fit to a six para equation for a two-state equilibrium unfolding model. The ΔGNU and m values obtained from the fit are 3.9 kcal/mol and 1.3 kcal/mol/M, respectively. (b) Equilibrium unfolding transition of W171/C225-Atto moPrP, measured similarly, is shown. The ΔGNU and m value obtained from the fit are 3.6 kcal/mol and 1.7 kcal/mol/M, respectively. All the fluorescence values were normalized the fluorescence of W144/C199-Atto moPrP at 0 M Urea. Native (dashed black line) and unfolded (dashed red line) baselines were indicated.
-
Figure 2—figure supplement 3—source data 1
Equilibrium unfolding transition of Atto655-labeled mutant variants of moPrP.
- https://doi.org/10.7554/eLife.44766.010
Figure 3 with 1 supplement
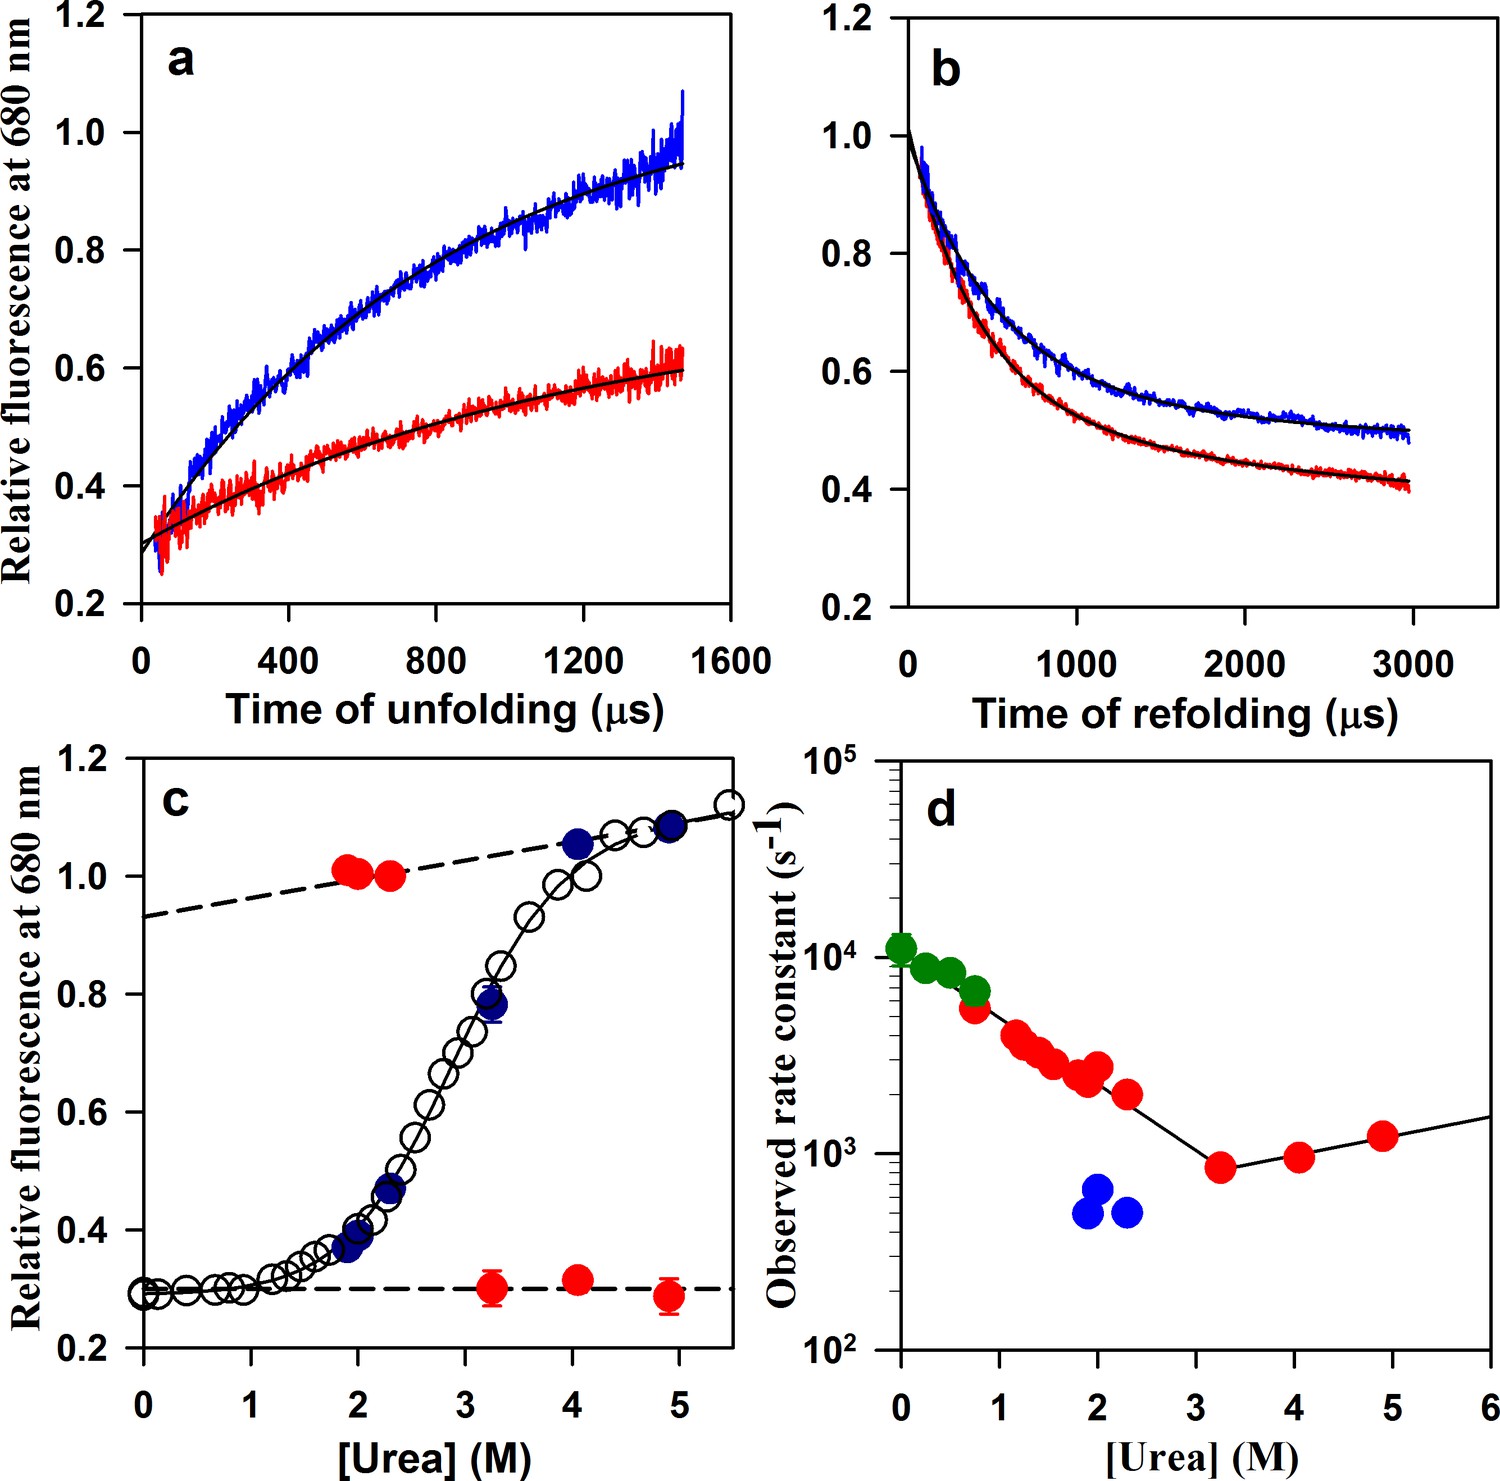
Folding/unfolding kinetics of W144/C199-Atto moPrP monitored by microsecond mixing experiments.
(a) Unfolding kinetic traces at 3.25 M urea and 4.9 M urea are shown in red and blue, respectively. (b) Refolding kinetic traces at 1.9 M urea (red) and 2.3 M urea (blue) are shown. (c) A comparison of the equilibrium and kinetic fluorescence signal change upon folding/unfolding is shown. The equilibrium fluorescence transition is shown in black circles. The t = 0 values obtained from the kinetic traces are shown in red, and the t = ∞ points are shown in blue. The dashed lines are the linearly extrapolated native protein and unfolded protein baselines. (d) The apparent rate constants of the fast phase of folding and of unfolding (red symbols), obtained from the microsecond mixing experiments are plotted against urea concentration. Also plotted are the rate constants of the slow phase of folding (blue symbols). The microsecond mixing experiments for studying folding were carried out at two flow rates: 7 ml/min for Urea concentrations in the range of 1.2 to 1.9 M, and 3.5 ml/min for urea concentrations in the range of 1.9 to 2.3 M. The relaxation rate constants obtained from PET-FCS are shown in green. The black lines through the unfolding and refolding arms of the chevron are linear regression fits through the data points.
-
Figure 3—source data 1
Folding/unfolding kinetics of W144/C199-Atto moPrP monitored by microsecond mixing experiments.
- https://doi.org/10.7554/eLife.44766.017
Figure 3—figure supplement 1
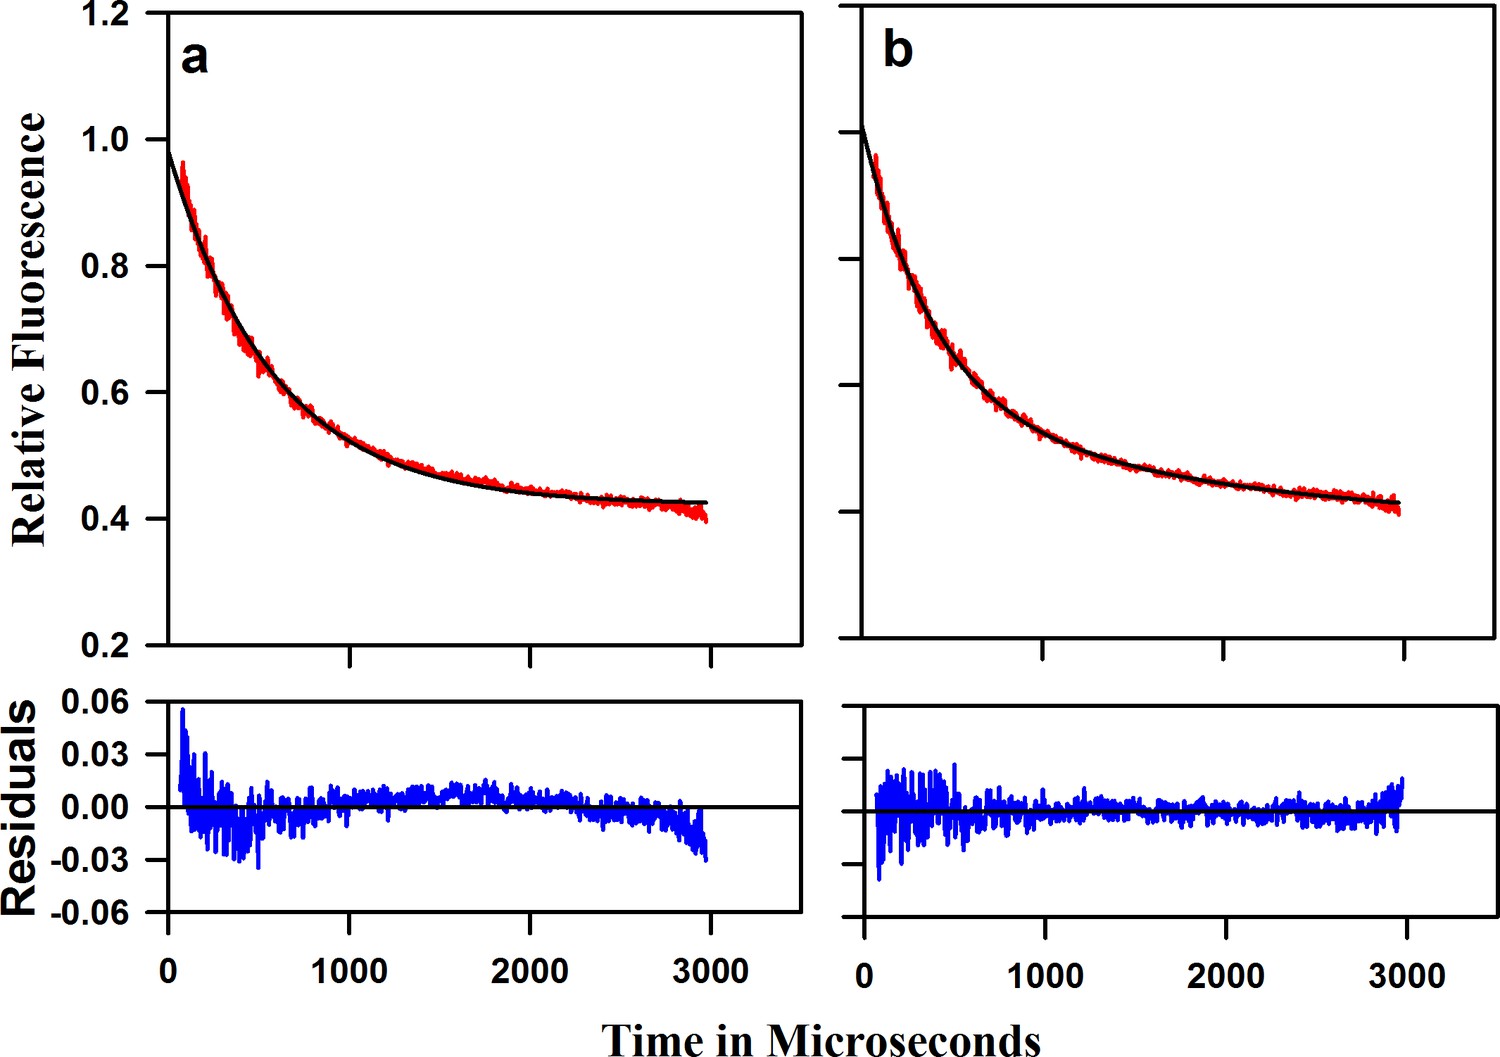
Refolding kinetic trace of W144/C199-Atto moPrP at 1.9 M Urea concentration.
(a) The fit to a single exponential equation is shown in black. The residuals are plotted below the plot. (b) The fit to a double exponential equation is shown in black and the residuals are shown below the plot.
-
Figure 3—figure supplement 1—source data 1
Refolding kinetic trace of W144/C199-Atto moPrP at1.9MUrea concentration along with the residuals to fit to a single and double exponetial equation.
- https://doi.org/10.7554/eLife.44766.016
Figure 4
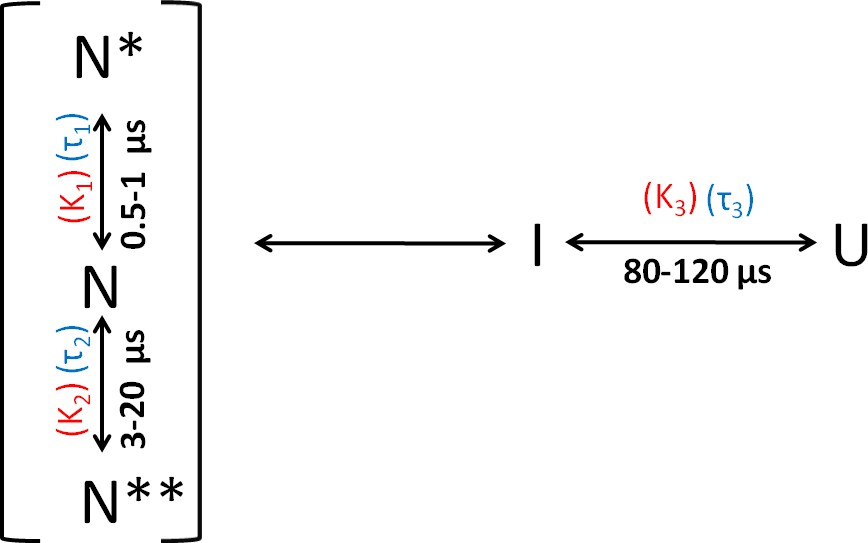
Folding scheme of moPrP at pH 4.
The folding scheme is based on the data obtained from PET-FCS and microsecond mixing experiments. The faster exponential components in the ACFs of PET-FCS experiments have been attributed to native state dynamics. In non-fluorescent N* and N**, the Atto 655 fluorescence is quenched by the Trp-residue coming into contact to form dye-Trp complexes, during the N ↔ N* and N ↔ N** conformational transitions. The corresponding equilibrium constant (KNN*) and time constant for the N to N* transition were obtained from the amplitude (K1) and time constant (τ1) of the faster exponential component of the ACF, respectively. Similarly, the equilibrium constant (KNN**) and the time constant for the N to N** transition were obtained from the K2 and τ2 values of the ACFs. The slowest exponential component was found to correspond to the U ↔ I transition. The equilibrium constant (KUI) and time constant for the U ↔ I transition were obtained from the amplitude (K3) and time constant (τ3) of the slowest exponential component of ACF, respectively.
Figure 5 with 1 supplement

Effect of salt on the microsecond dynamics of moPrP at pH 4.
(a) ACFs of W144/C199-Atto moPrP are shown, in the absence (red line) and in the presence (blue line) of 150 mM NaCl. (b) ACFs of W171/C225-Atto moPrP are shown, in the absence (red line) and the presence (blue line) of 150 mM NaCl. The parameters obtained from the fits (black lines) to the data are listed in Table 1.
-
Figure 5—source data 1
Effect of salt on the microsecond dynamics of moPrP at pH 4.
- https://doi.org/10.7554/eLife.44766.022
Figure 5—figure supplement 1
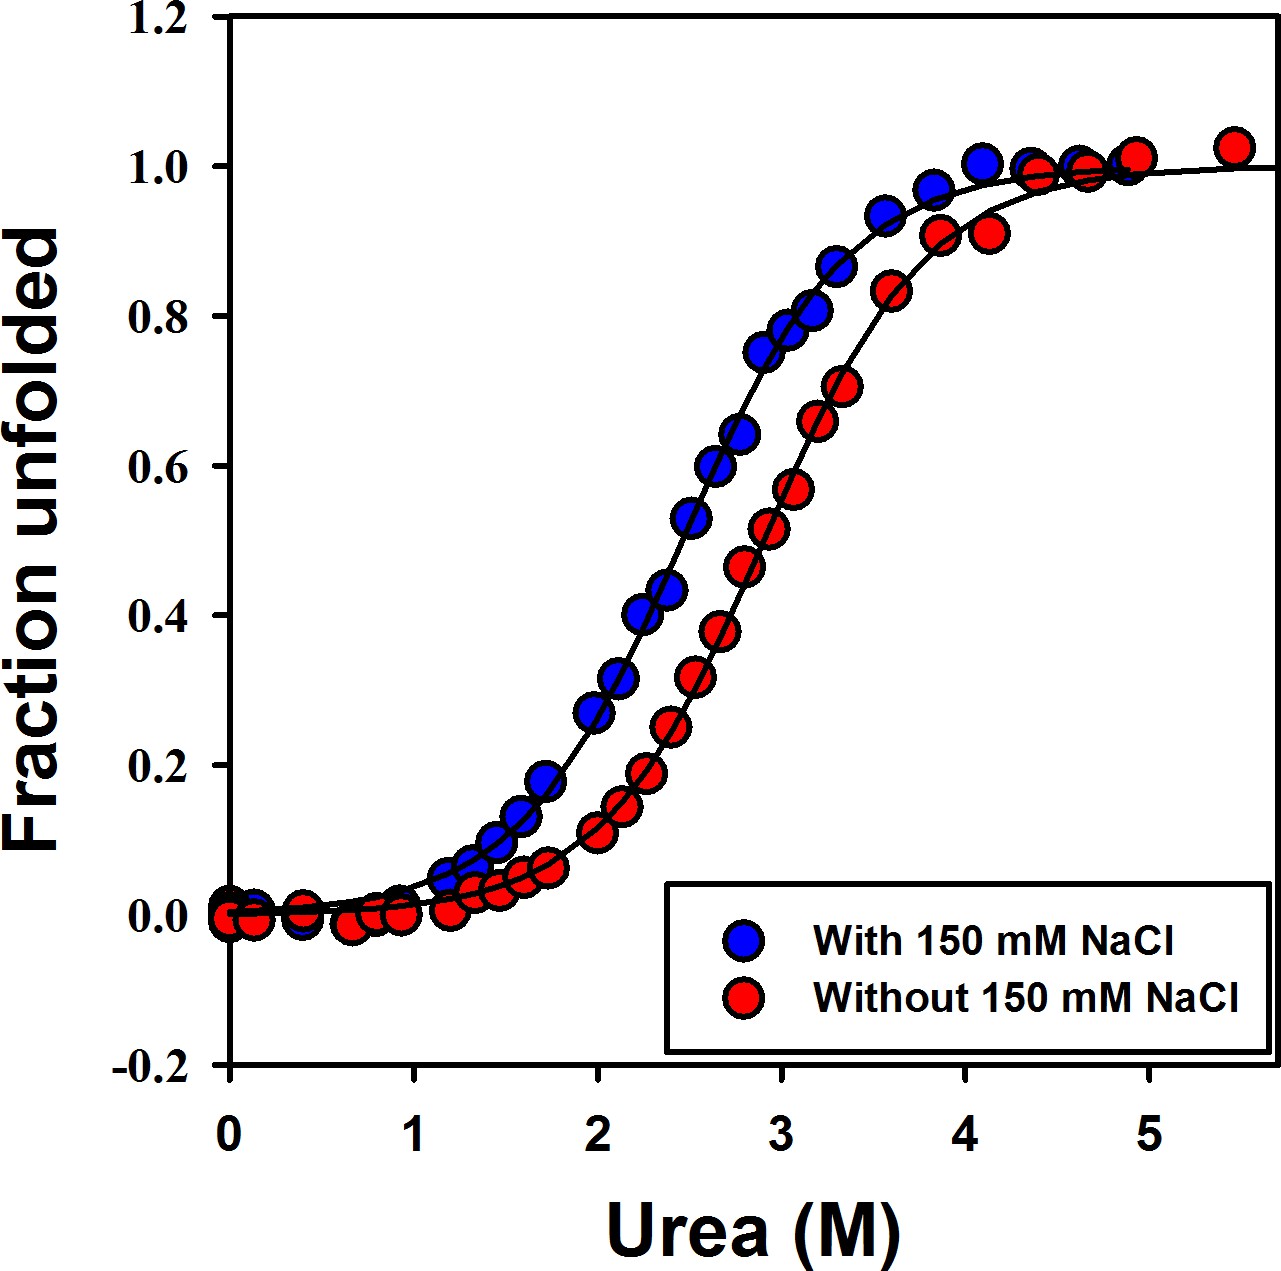
Effect of salt on the stability of moPrP.
Equilibrium unfolding transitions of W144/C200-Atto moPrP in the presence of 150 mM NaCl (blue data points), and in the absence of salt (red data points). Equilibrium unfolding experiments were carried out in 20 mM sodium acetate buffer at pH four by following the fluorescence of the Atto moiety attached to C 199.
-
Figure 5—figure supplement 1—source data 1
Equilibrium unfolding transitions of W144/C200-Atto moPrP in the presence and absence of salt.
- https://doi.org/10.7554/eLife.44766.021
Figure 6
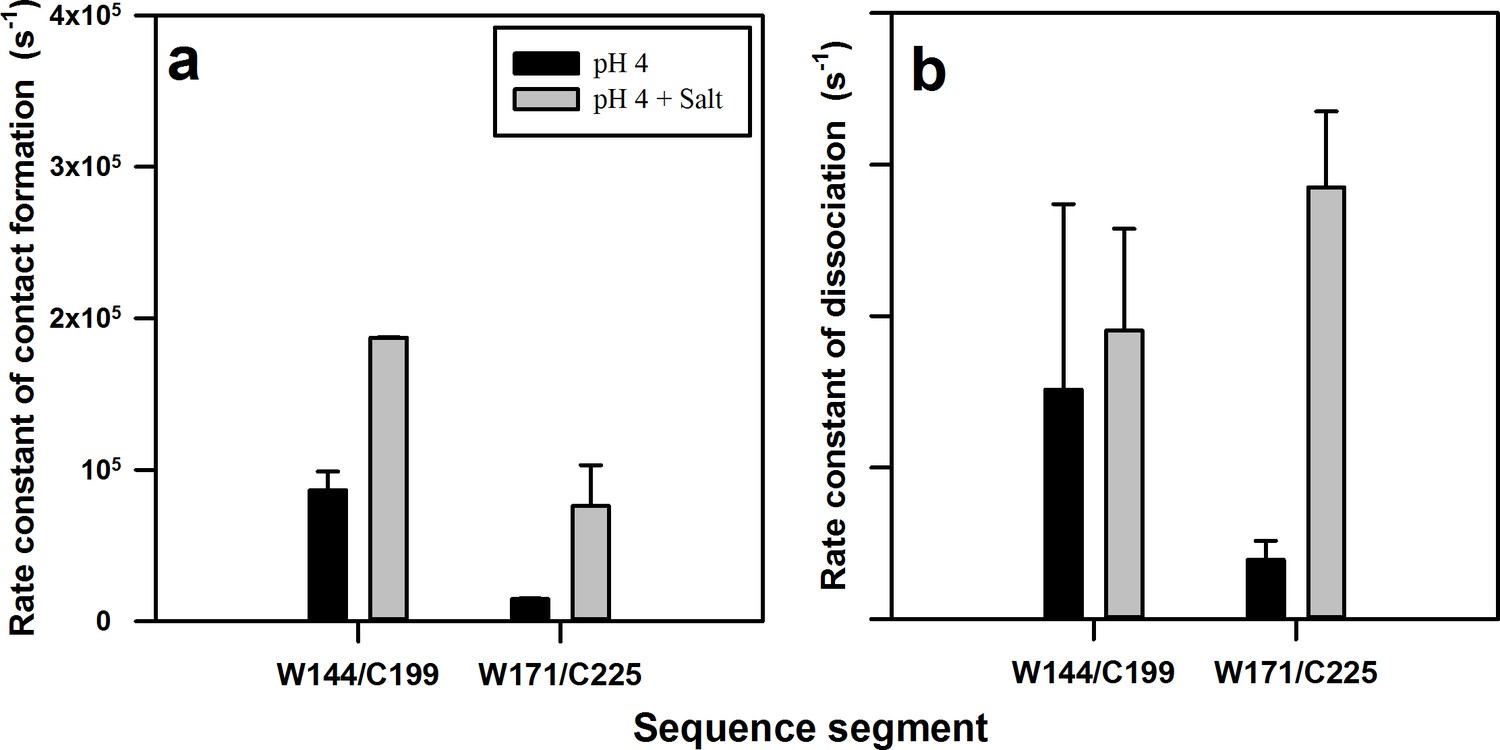
Rate constants of contact (complex) formation and dissociation within the native state ensemble of moPrP at pH 4.
The rate constants were calculated for the N to N** transition using equilibrium constant K2 and time constant τ2 obtained from PET FCS ACFs. The rate constants of (a) contact formation and (b) dissociation for the W144-C199 and W171-C225 segments in the native state, in the absence and the presence of 150 mM NaCl, are shown. Error bars represent the standard deviations obtained from at least two independent repeats of each experiment.
-
Figure 6—source data 1
Rate constants of contact (complex) formation and dissociation within the native state ensemble of moPrP at pH 4.
- https://doi.org/10.7554/eLife.44766.025
Figure 7
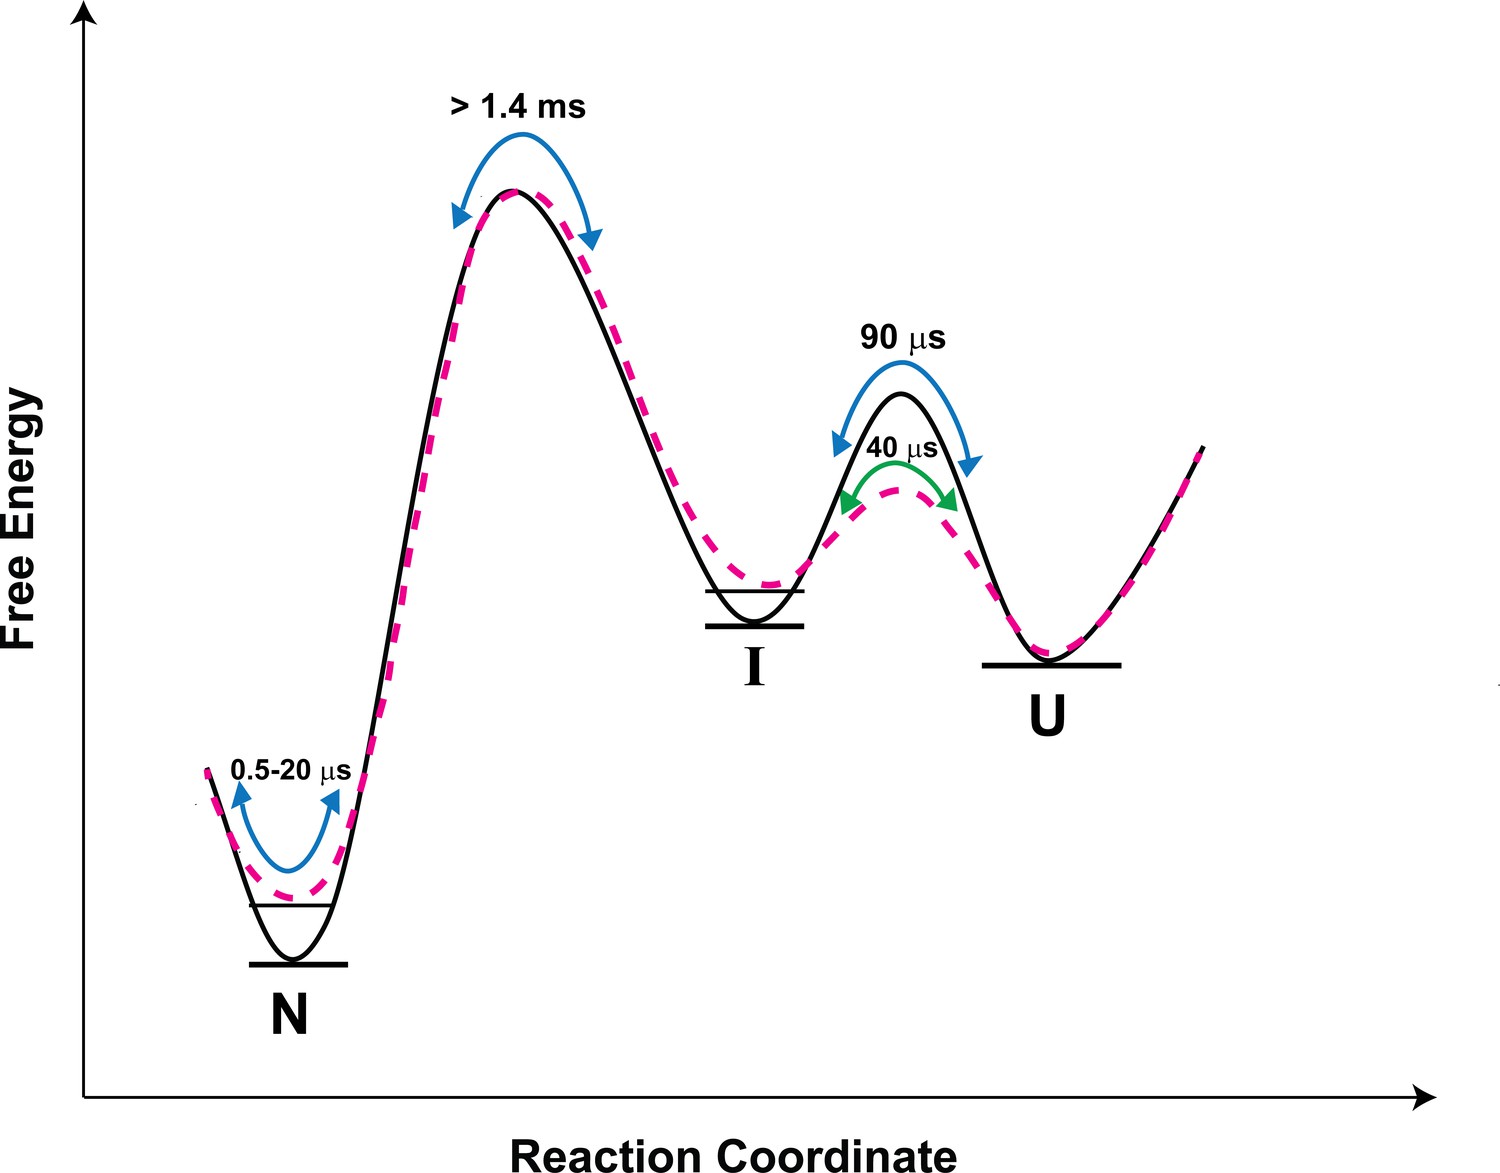
Schematic free-energy diagram of moPrP showing the conformational fluctuations in the absence (continuous line) and in the presence of salt (dashed line).
The free energy diagram is constructed based on the values of thermodynamic parameters listed in Table 3. The U ↔ I transitions are described by the time constants of the slowest exponential process of the ACF. The fluctuations within the native state are represented by the two faster exponential components of the ACF, and occur on the time scale of 0.5 to 20 µs. In the presence of salt, the native state and the I state are destabilized by 0.7, and 0.4 kcal/mol, respectively, with respect to the U state.
Tables
Table 1
Parameters obtained from the ACFs of W144/C199-Atto moPrP and W171/C225-Atto moPrP.
The parameters defining the dynamics in the absence of added salt were obtained from the fits to the data shown in Figure 2a and b. The errors shown are the standard deviations determined from measurements made in at least two independent experiments.
| W144/C199-Atto moPrP | W171/C225-Atto moPrP | |||
|---|---|---|---|---|
| pH 4 | pH 4, 150 mM NaCl | pH 4 | pH 4, 150 mM NaCl | |
| K1 | 1.2 ± 0.1 | 0.9 ± 0.2 | 0.3 ± 0.07 | 0.65 ± 0.08 |
| K2 | 0.8 ± 0.4 | 1.3 ± 0.2 | 0.4 ± 0.1 | 0.3 ± 0.1 |
| K3 | 0.4 ± 0.02 | 0.2 ± 0.02 | 0.65 ± 0.3 | 0.25 ± 0.1 |
| τ1 (µs) | 1.1 ± 0.3 | 0.8 ± 0.1 | 1 ± 0.8 | 0.5 ± 0.06 |
| τ2 (µs) | 5 ± 2 | 3 ± 0.2 | 19 ± 3 | 4 ± 1 |
| τ3 (µs) | 80 ± 11 | 61 ± 28 | 122 ± 11 | 89 ± 24 |
| τD (µs) | 306 ± 26 | 321 ± 20 | 277 ± 3 | 323 ± 20 |
Table 2
Comparison of equilibrium constants between the dark (N*+N**) states and the fluorescent (N) state obtained from fluorescence spectra and PET-FCS.
The ratio of the fluorescence intensity of the Trp-containing PET construct to that of the corresponding Trp-less control protein (Figure 2c and d), which is equal to 1 + K1+K2, was used to determine K1 +K2 ((N*+N**)/N)). K1 +K2 was also determined as the sum of the amplitudes of the two faster exponential components observed in the ACFs (Figure 2a and b). It was assumed that in both N* and N**, the fluorescence of the Atto 655 dye moiety is fully quenched by PET. The errors shown represent the standard deviations determined from at least two independent experiments.
| (K1 + K2) calculated from fluorescence spectra | (K1 + K2) obtained from ACFs of PET-FCS | |
|---|---|---|
| W144/C199-Atto moPrP | 1.8 ± 0.2 | 2 ± 0.5 |
| W171/C225-Atto moPrP | 0.5 ± 0.2 | 0.7 ± 0.2 |
Table 3
Effect of salt on thermodynamic parameters governing the dynamics of W144/C199-Atto moPrP.
The equilibrium constants were obtained from the amplitudes of ACFs obtained from PET-FCS experiments. Note that KNN*=N*/N, KNN**=N**/N and KUI = I/U. ΔGUI is calculated from the value of KUI. The total free energy change (ΔG(N+N*+N**)U) for unfolding was obtained from equilibrium unfolding experiments. The errors represent the standard deviations obtained from measurements made in at least two independent experiments.
| W144/C199-Atto moPrP | ||
|---|---|---|
| pH 4 | pH 4, 150 mM salt | |
| KNN* (K1) | 1.2 ± 0.1 | 0.9 ± 0.2 |
| KNN** (K2) | 0.8 ± 0.4 | 1.3 ± 0.2 |
| KUI (K3) | 0.4 ± 0.02 | 0.2 ± 0.02 |
| ΔG UI (kcal/mol) | 0.5 ± 0.1 | 0.9 ± 0.1 |
| ΔG (N+N*+N**)I (kcal/mol) | 4.4 ± 0.2 | 4.1 ± 0.2 |
| ΔG(N+N*+N**)U (kcal/mol) | 3.9 ± 0.3 | 3.2 ± 0.3 |
Key resources table
| Reagent type (species) or resource | Designation | Source or reference | Identifiers | Additional information |
|---|---|---|---|---|
| Cell line (E. coli BL21 Star (DE3)) | E. coli BL21 DE3* | Thermo Fisher scientific | ||
| Recombinant DNA reagent (plasmid pET 22b) | Plasmid expressing W144/C199 moPrP | Generated by Dr. Ishita Sengupta (Udgaonkar lab) | The results of the publication are under communication | |
| Recombinant DNA reagent (plasmid pET 22b) | Plasmid expressing Trp-less control protein C199 moPrP | This paper | This construct was made by site directed mutagenesis | |
| Recombinant DNA reagent (plasmid pET 22b) | Plasmid expressing W171/C225 moPrP | This paper | This construct was made by site directed mutagenesis | |
| Recombinant DNA reagent (plasmid pET 22b) | Plasmid expressing Trp-less control protein C225 moPrP | This paper | This construct was made by site directed mutagenesis | |
| Software, algorithm | SigmaPlot | Systat Software Inc | ||
| Software, algorithm | Symphotime-64 | PicoQuant |
Additional files
-
Supplementary file 1
Dependence of the parameters obtained from the PET-FCS ACFs on excitation power.
The parameters listed were obtained by fitting the ACFs to Equation 1 (Materials and Methods). The experiment was carried out using the W144/C199-Atto moPrP variant at pH 7, in the presence of 150 mM salt. The excitation power was measured from the counts from a calibrated photodiode placed before the main dichroic mirror.
- https://doi.org/10.7554/eLife.44766.027
-
Supplementary file 2
Parameters obtained from the ACFs of W144/C199-Atto moPrP and W171/C225-Atto moPrP at pH 7.
- https://doi.org/10.7554/eLife.44766.028
-
Transparent reporting form
- https://doi.org/10.7554/eLife.44766.029
Download links
A two-part list of links to download the article, or parts of the article, in various formats.
Downloads (link to download the article as PDF)
Open citations (links to open the citations from this article in various online reference manager services)
Cite this article (links to download the citations from this article in formats compatible with various reference manager tools)
Microsecond sub-domain motions and the folding and misfolding of the mouse prion protein
eLife 8:e44766.
https://doi.org/10.7554/eLife.44766


