Liquid-crystal organization of liver tissue
- Max Planck Institute of Molecular Cell Biology and Genetics, Germany
- Max Planck Institute for the Physics of Complex Systems, Germany
- Technische Universität Dresden, Germany
- Massachusetts Institute of Technology, United States
- Skolkovo Institute of Science and Technology, Russia
- MV Lomonosov Moscow State University, Russia
- TU Dresden, Germany
Figures
Figure 1 with 6 supplements
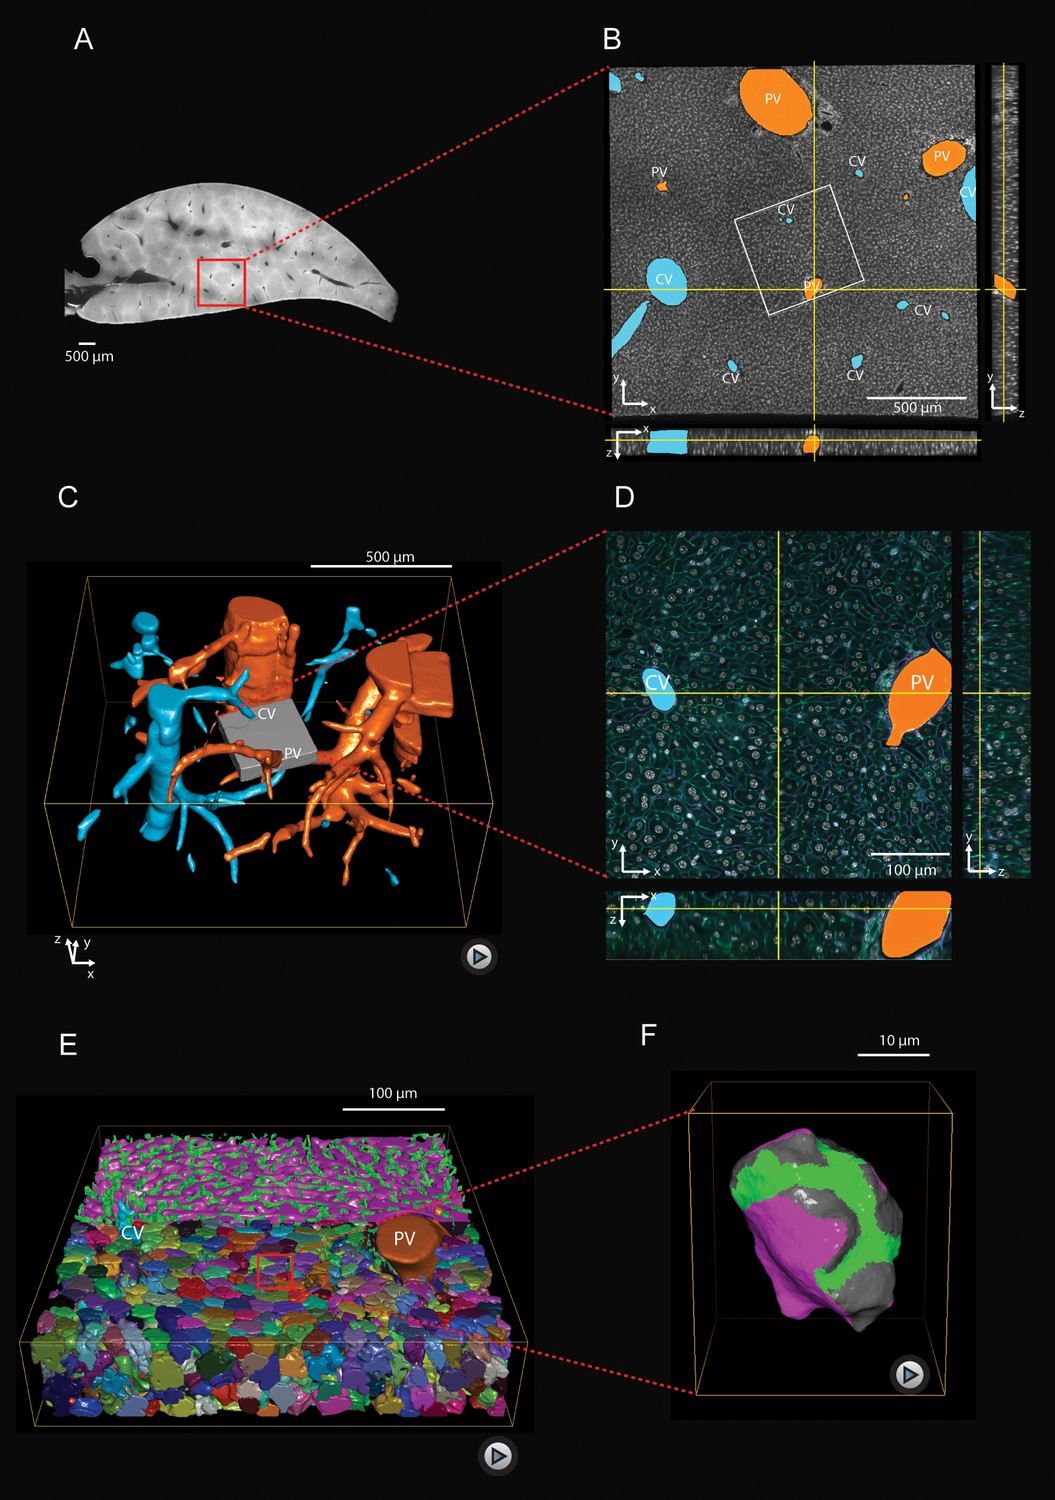
Multi-resolution imaging and 3D reconstruction of the mouse liver lobule.
(A, B) Low-resolution imaging of an optically cleared liver tissue slice, stained for hepatocyte cell borders (cyan, Phalloidin) and nuclei (gray, DAPI); voxel size 1 μm x 1 μm x 1 μm. Central veins (CV, cyan) and portal veins (PV, orange) are highlighted. (C) 3D reconstruction from a stack of low-resolution images from 10 serial slices (Figure 1—video 1). (D) High-resolution imaging was performed in a sub-region (indicated as gray box in panel (C) and stained with four different markers for hepatocyte cell borders (cyan, Phalloidin), nuclei (gray, DAPI), hepatocyte apical plasma membrane (green, CD13), and basal plasma membrane (magenta, fibronectin/laminin) – facing the sinusoidal endothelial cells (Figure 1—figure supplement 1); voxel size 0.3 μm x 0.3 μm x 0.3 μm. (E) Reconstruction of sinusoidal (magenta) and bile canaliculi (green) networks connecting CV and PV, as well as contacting hepatocytes (Figure 1—video 2). (F) 3D representation of a single hepatocyte showing apical (green), basal (magenta) and lateral (gray) plasma membrane domains (Figure 1—video 3). A quantitative analysis of the structural parameters of hepatocytes and the networks (BC and sinusoids) along the CV-PV axis is shown in Figure 1—figure supplement 2 and Figure 1—figure supplement 3, respectively.
Figure 1—figure supplement 1
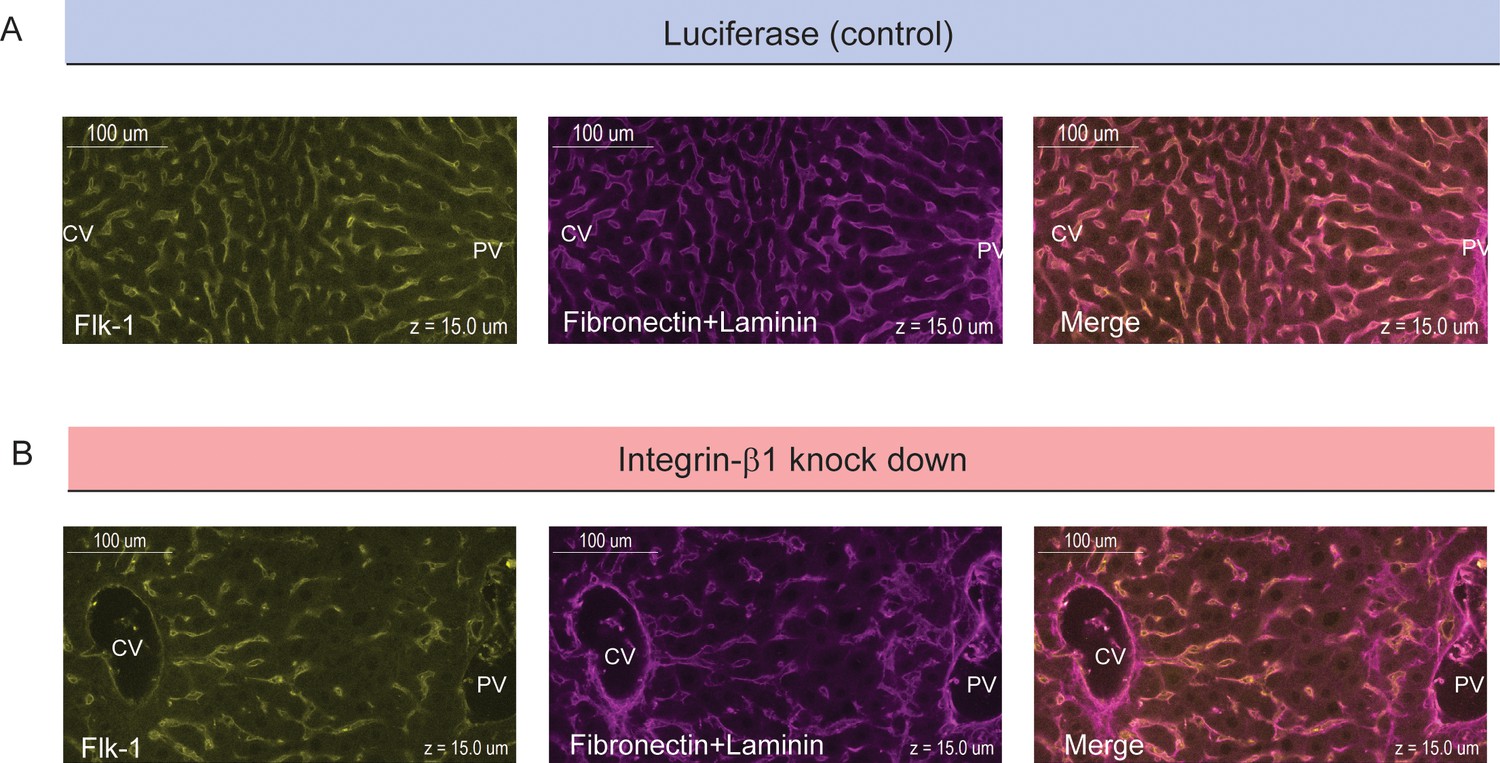
Colocalization of sinusoids and basal plasma membrane.
High-resolution images of samples for control conditions (top, siRNA against Luciferase) and Integrin-β1 knock down (bottom, siRNA against Integrin-β1 receptor) are shown. Samples were stained for sinusoidal network (left, Flk-1 staining) and extracellular matrix (middle, Fibronectin+Laminin staining). The right panels show images of overlapping staining. All panels correspond to a z-plane at 15 µm depth of liver tissue.
Figure 1—figure supplement 2
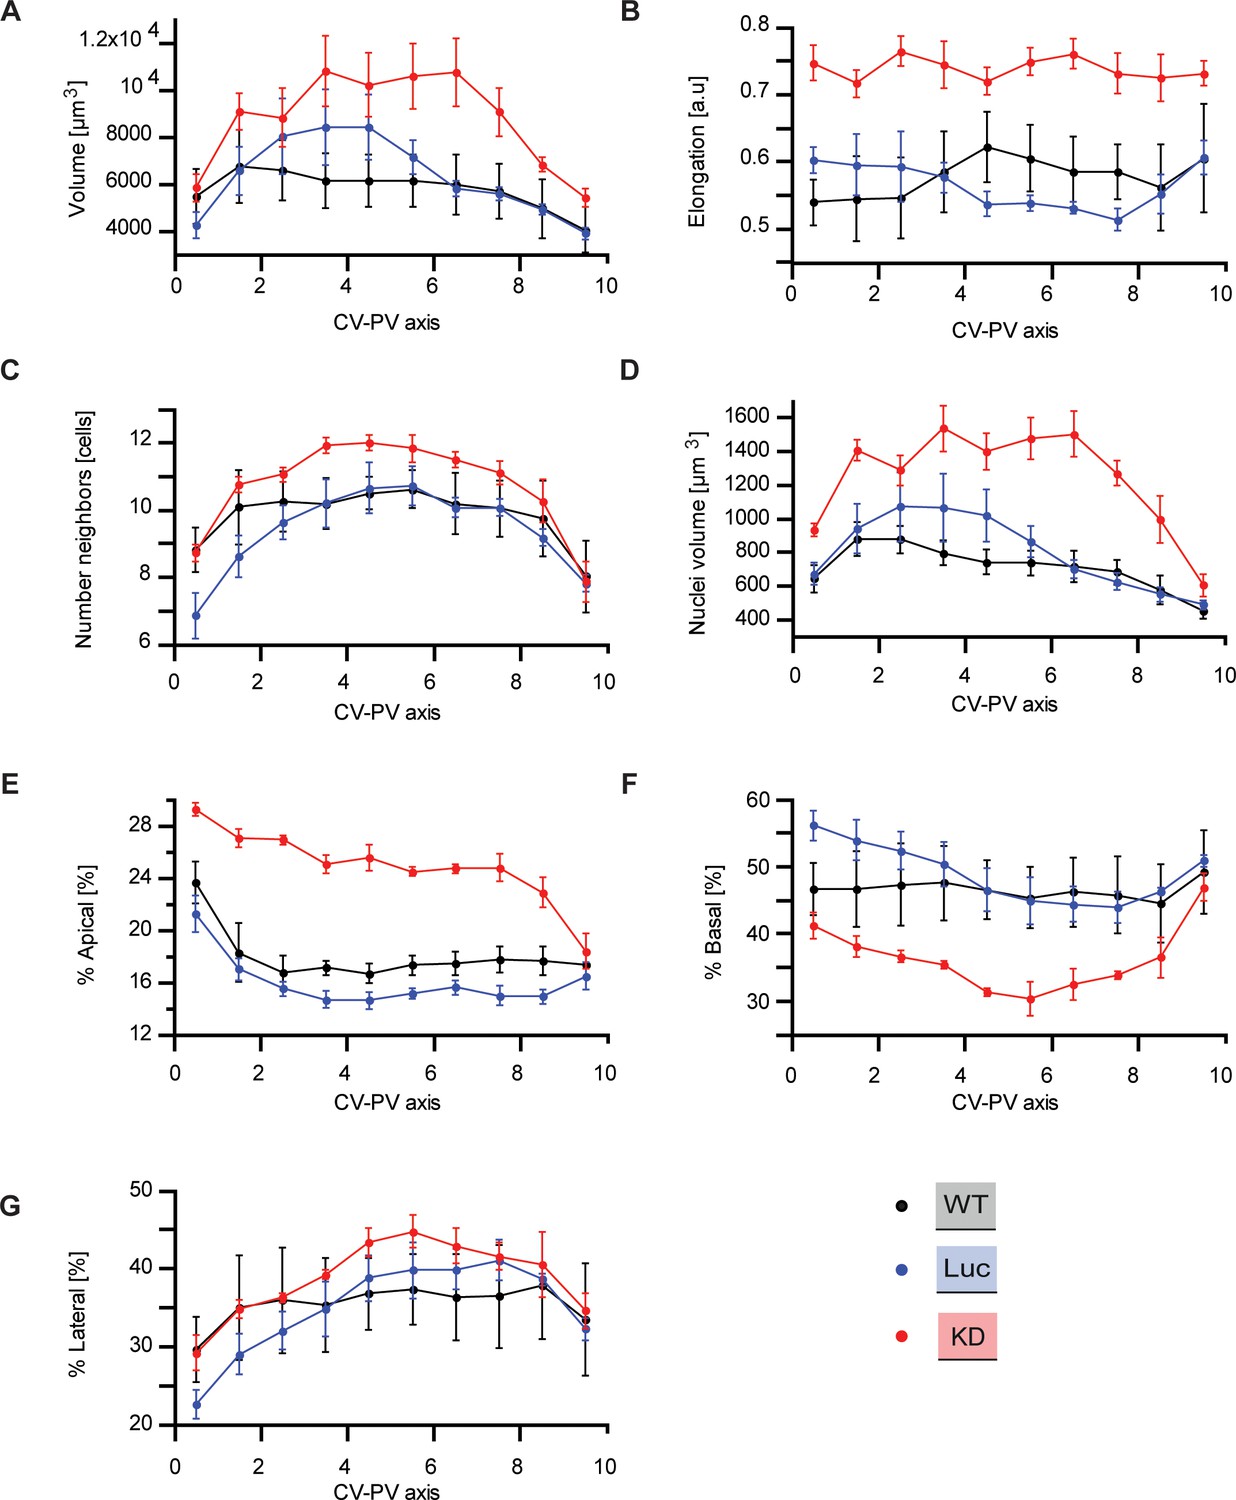
Quantitative structural parameters of hepatocytes along CV-PV axis.
Structural parameters of hepatocytes for wild type (black), Luciferase control (blue), Integrin-β1 knockdown (red). As described in Meyer et al. (2017); Morales-Navarrete et al., 2015 the CV-PV axis was divided in 10 zones (from 0 to 10) in order to show the variability of each parameter along this axis. (A) Hepatocyte volume. (B) Cell elongation. (C) Number of neighboring hepatocytes per cell. (D) Nuclear volume per cell. (E, F, G) Percentage of apical, basal and lateral domains of the cytoplasmic membrane of individual hepatocytes, respectively. Statistics: n=3 independent samples from different animals (wild type), n=5 animals (Luciferase control), n=4 animals (Integrin-β1 knock-down). Error bars show standard error of the mean (s.e.m). Data available in Figure 1—figure supplement 2—source data 1.
-
Figure 1—figure supplement 2—source data 1
Raw data structural parameters of hepatocytes along CV-PV axis.
- https://doi.org/10.7554/eLife.44860.005
Figure 1—figure supplement 3
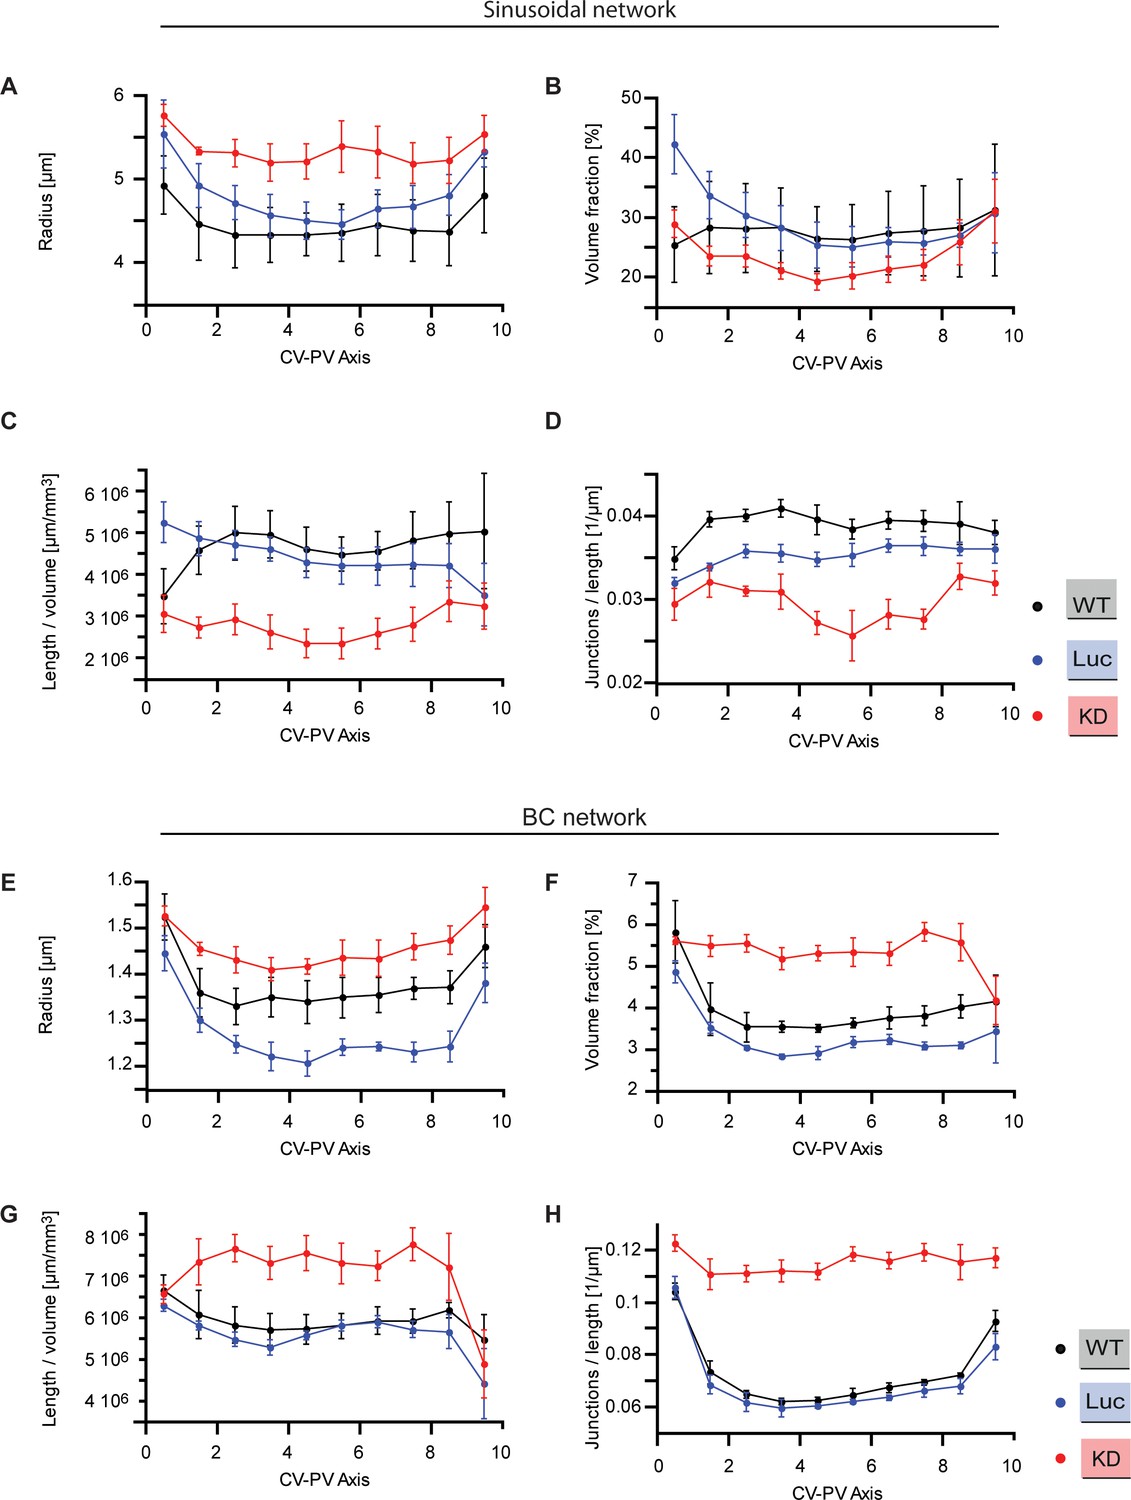
Quantitative structural parameters of sinusoidal and BC networks along CV-PV axis.
Structural parameters of the sinusoidal and BC networks for wild type (black), Luciferase control (blue), Integrin-β1 knockdown (red). The CV-PV axis was divided in 10 zones (from 0 to 10), showing change along the CV-PV axis. (A, E) Estimated radius of the tubular networks. (B, F) Percentage of tissue volume occupied by the network (excluding the volume occupied by CV and PV). (C, G) Total length of the network per tissue volume unit. (D, H) Number of branching points (junctions) per unit length. A junction is defined as a node of the network that has, at least, three branches. Statistics: n=3 independent samples from different animals (wild type), n=5 animals (Luciferase control), n=4 animals (Integrin-β1 knock-down). Error bars show standard error of the mean (s.e.m.). Data available in Figure 1—figure supplement 3—source data 1.
-
Figure 1—figure supplement 3—source data 1
Raw data structural parameters of sinusoidal and BC networks along CV-PV axis.
- https://doi.org/10.7554/eLife.44860.007
Figure 1—video 1
Supplementary video for Figure 1C. Tissue-level reconstruction of the liver lobule.
Digital reconstruction of large veins in mouse liver tissue, generated from low-resolution 3D images of serial slices (CV: cyan, PV: orange. Dimensions of imaging box: approximately 1 mm x 1 mm x 1mm.
Figure 1—video 2
Supplementary video for Figure 1E.
Cellular-level reconstruction of liver tissue. 3D high-resolution reconstruction of main components of liver tissue: CV (cyan), PV (orange), sinusoidal network (magenta), bile canaliculi network (green), hepatocyte nuclei (random colors), and hepatocytes (random colors). Dimensions of imaging box: approximately 400 μm x 400 μm x 100 μm.
Figure 1—video 3
Supplementary video for Figure 1F.
Subcellular-level reconstruction of liver tissue. Single hepatocyte showing apical (green), basal (magenta) and lateral (gray) plasma membrane domains, reconstructed from high-resolution 3D images.
Figure 2 with 2 supplements
Biaxial cell polarity of hepatocytes.
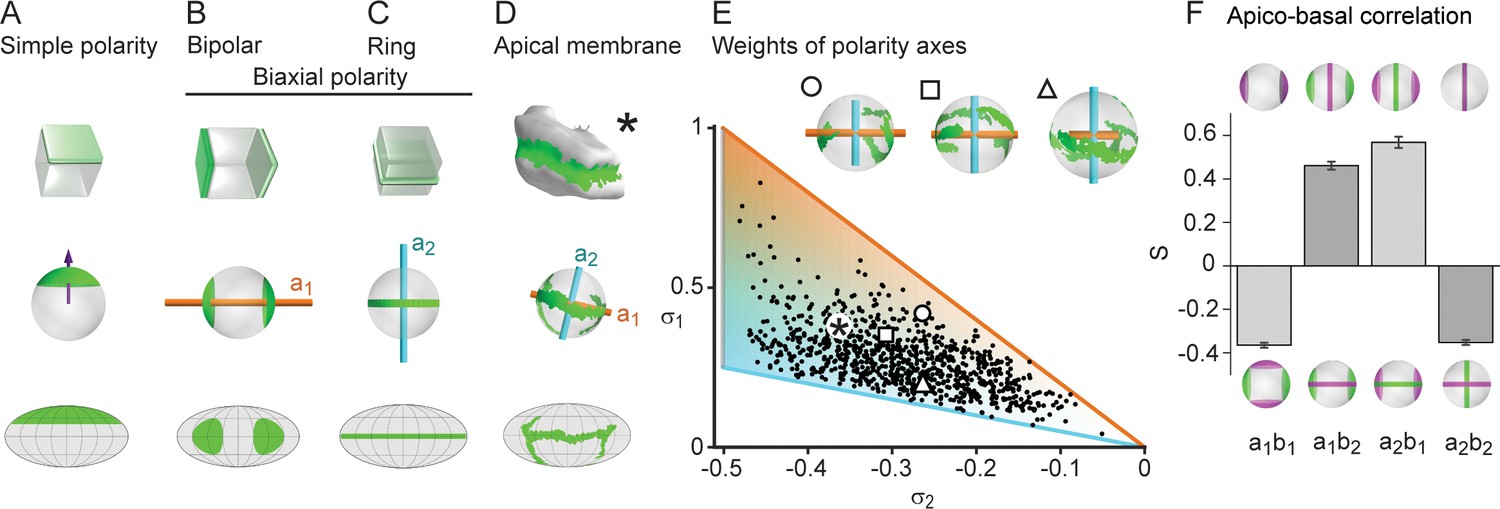
(A) Idealized representation of simple cell polarity, as found in cells of sheet-like epithelial tissue, showing schematic representation, spherical projection and Mollweide cartographic projection (top to bottom). Simple cell polarity is characterized by a single domain of apical membrane localized at one side of the cell, thus defining a vector (magenta arrow) that points toward the patch of apical plasma membrane. (B, C) Two extreme cases of biaxial polarity. Biaxial polarity, as introduced here, associates two nematic axes to complex membrane patterns: bipolar and ring axis. We show the bipolar axis (, gold) for the idealized case of two antipodal poles of apical plasma membrane (pure bipolar polarity, ring axis degenerated), and the ring axis (, cyan) for the case of a perfect ring of apical plasma membrane (pure ring polarity, bipolar axis degenerated). (D) Reconstructed 3D shape of typical hepatocyte with patches of apical plasma membrane (green). The spherical projection is characterized by well-defined bipolar and ring axes. (E) Respective weights of bipolar axis () and ring axis () for n=857 reconstructed hepatocytes, defined in terms of the eigenvalues of the nematic cell polarity tensor. Extreme cases of pure bipolar or pure ring polarity as shown in B and C correspond to the golden and blue line, respectively. Inset: Spherical projections for three example hepatocytes with corresponding polarity axes (indicated by symbols in scatter plot, corresponding to panel 2A). The analogous pair of axes for the distribution of basal plasma membrane showed similar results (Figure 2—figure supplement 1). (F) Cross-correlation analysis of nematic cell polarity axes for apical and basal plasma membrane patterns reveals that axes of same type are preferentially perpendicular, while axes of different type are preferentially parallel, indicating repulsion between apical and basal plasma membrane domains (n=3 animals). Error bars show standard deviations (s.d.).
Figure 2—figure supplement 1
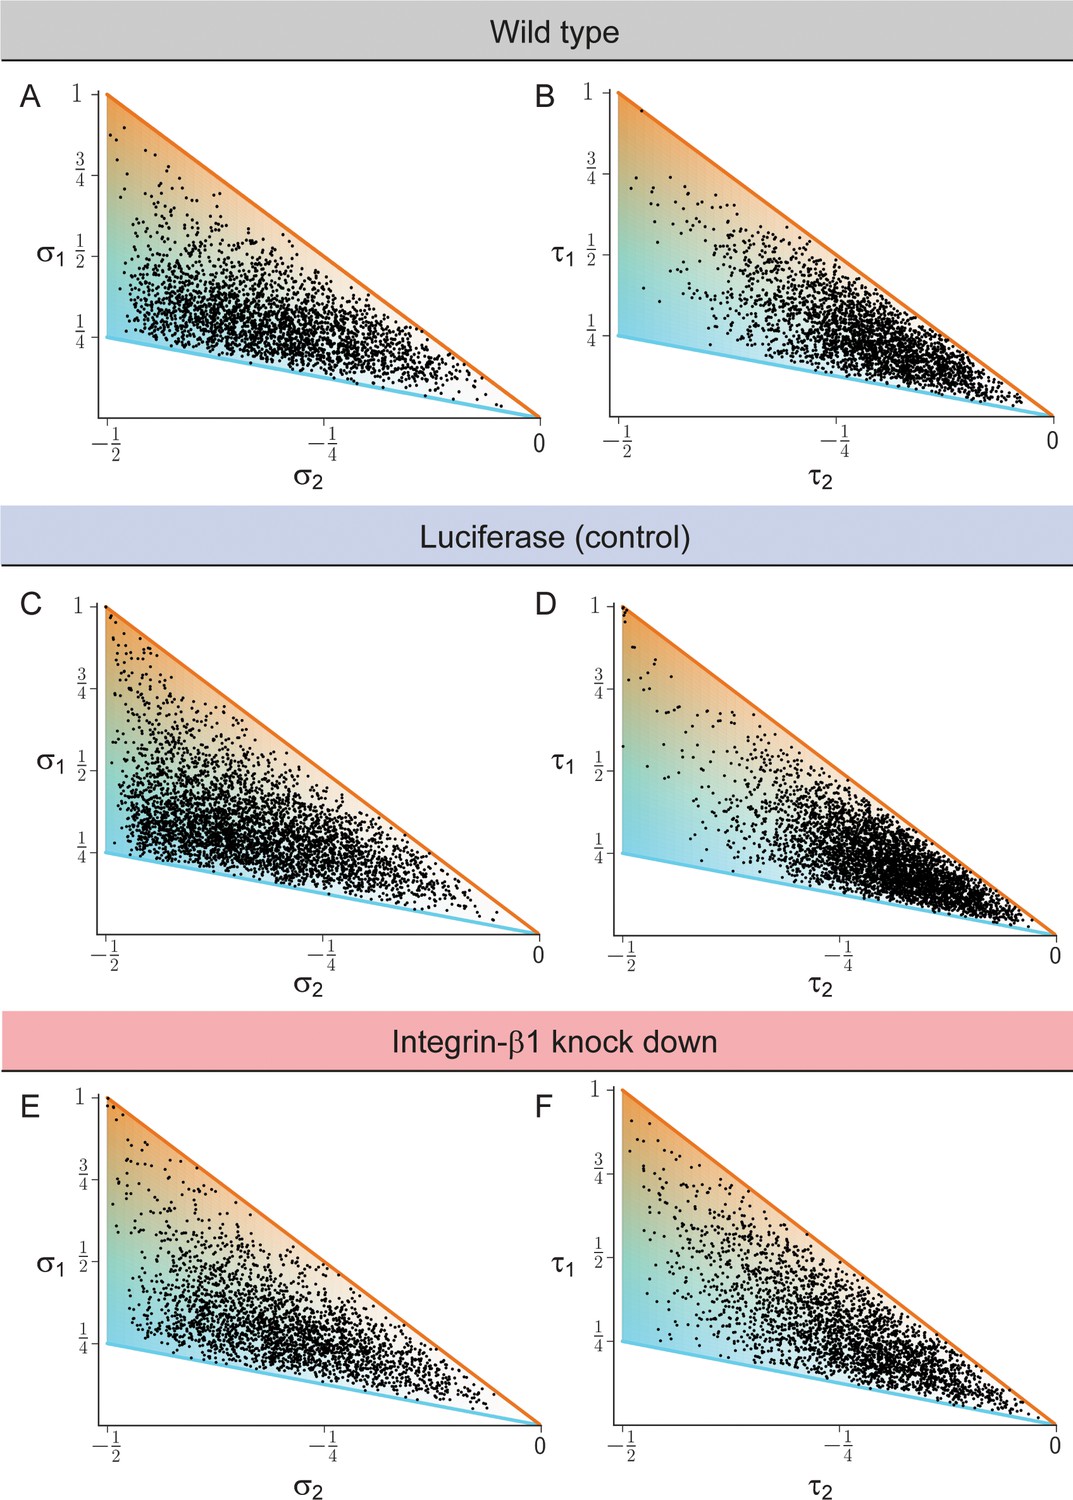
Biaxial cell polarity of basal plasma membrane distribution.
(A, C, E) Respective weights of bipolar axis () and ring axis () for reconstructed hepatocytes, defined in terms of the eigenvalues of the nematic cell polarity tensor for the apical plasma membrane distribution, for wildtype (panel A, identical to Figure 2E), Luciferase control (panel C), and Integrin-β1 knock-down (panel E). (B, D, F). Analogous scatter plots displaying the weight of the bipolar axis () and the weight of the ring axis () of basal plasma membrane distribution for reconstructed hepatocytes, defined in terms of the eigenvalues of the nematic cell polarity tensor for the basal plasma membrane distribution, for wildtype (panel B), Luciferase control (panel D), and Integrin-β1 knock-down (panel F). Data: n=3 independent samples from different animals (wild type), n=5 animals (Luciferase control), n=4 animals (Integrin-β1 knock-down).
Figure 2—figure supplement 2
Hepatocyte shape anisotropy.
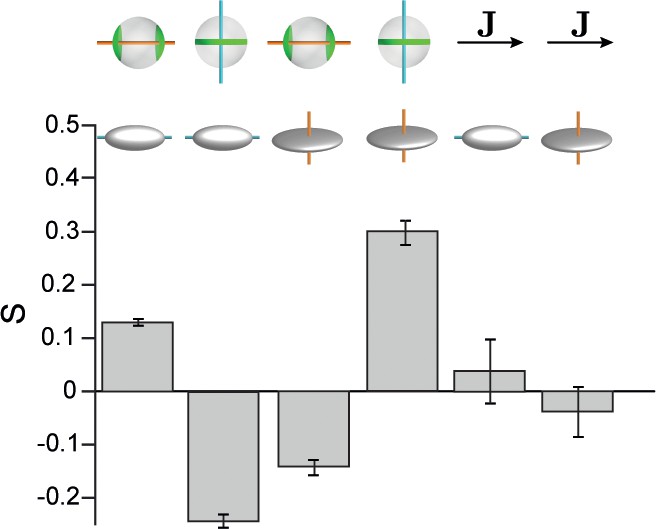
Cell shape axis were defined in terms of a second-moments tensor with components , where the integral extends over the whole (non-projected) surface of each hepatocyte. The eigenvalues and principal axes of this tensor define cell shape axes , , with corresponding eigenvalues . Correlations between cell shape polarity axes and apical cell polarity axis, as well as with lobule-level reference field J are shown. From left to right: , , , , Although we observed weak correlations between cell shape polarity axes and apical cell polarity axes, no significant alignment with the lobule-level reference system was found. Error bars denote s.d., n=3 animals (wild-type).
Figure 3 with 2 supplements

Lobule-level organization of nematic cell polarity.
(A) Bipolar cell polarity axes of apical plasma membrane distribution () shown as lines of constant length for individual hepatocytes at their respective position in the lobule. (B) Same as A after local averaging using a 3D Gaussian kernel at each hepatocyte cell center (standard deviation 20 μm, indicated in red above the scale bar). (C) Lobule-level reference system with local reference direction () tangent to flow lines (blue), obtained by solving the diffusion equation with sources and sinks placed at the surface of PV (orange) and CV (cyan). (D) Same as B, but now axes are color-coded according to their alignment with the local reference direction ( defined in panel C). Red colors indicate parallel alignment, whereas blue indicate perpendicular co-orientation. (E) Same as D, but for the ring axis of apical plasma membrane distribution (). (F) Same as D, but for the preferred direction of the local sinusoidal network surrounding each hepatocyte. (G) Quantification of alignment with local reference direction for apical bipolar axis, apical ring axis, and preferred sinusoid orientation. The correlation for the apical ring axis exceeds a trivial baseline (hatched bar) that follows from the correlation of the bipolar axis (see Materials and methods for details) (error bars denote standard deviations, n=3 animals). Analogous results for the preferred BC orientation are shown in Figure 3—figure supplement 1. (H) Layered order in the liver lobule. Upper: density of sinusoids in region-of-interest (average density projection along z-axis) and reference direction (blue). Lower: cross-correlation along reference direction between projected density of hepatocytes and sinusoids (magenta) and hepatocytes and bile canaliculi (green). The oscillatory signals reveal layered order with a wavelength of approximately one hepatocyte diameter. Detailed description in Figure 3—figure supplement 2. All scale bars 100 μm.
Figure 3—figure supplement 1
Anisotropy of BC network.
Quantification of alignment with local reference direction for the preferred direction of the local BC network surrounding each hepatocyte (), analogous to Figure 3G. Statistics: n=3 independent samples from different animals (wild type), n=5 animals (Luciferase control), n=4 animals (Integrin-β1 knock-down). Error bars show standard deviations (s.d.).
Figure 3—figure supplement 2
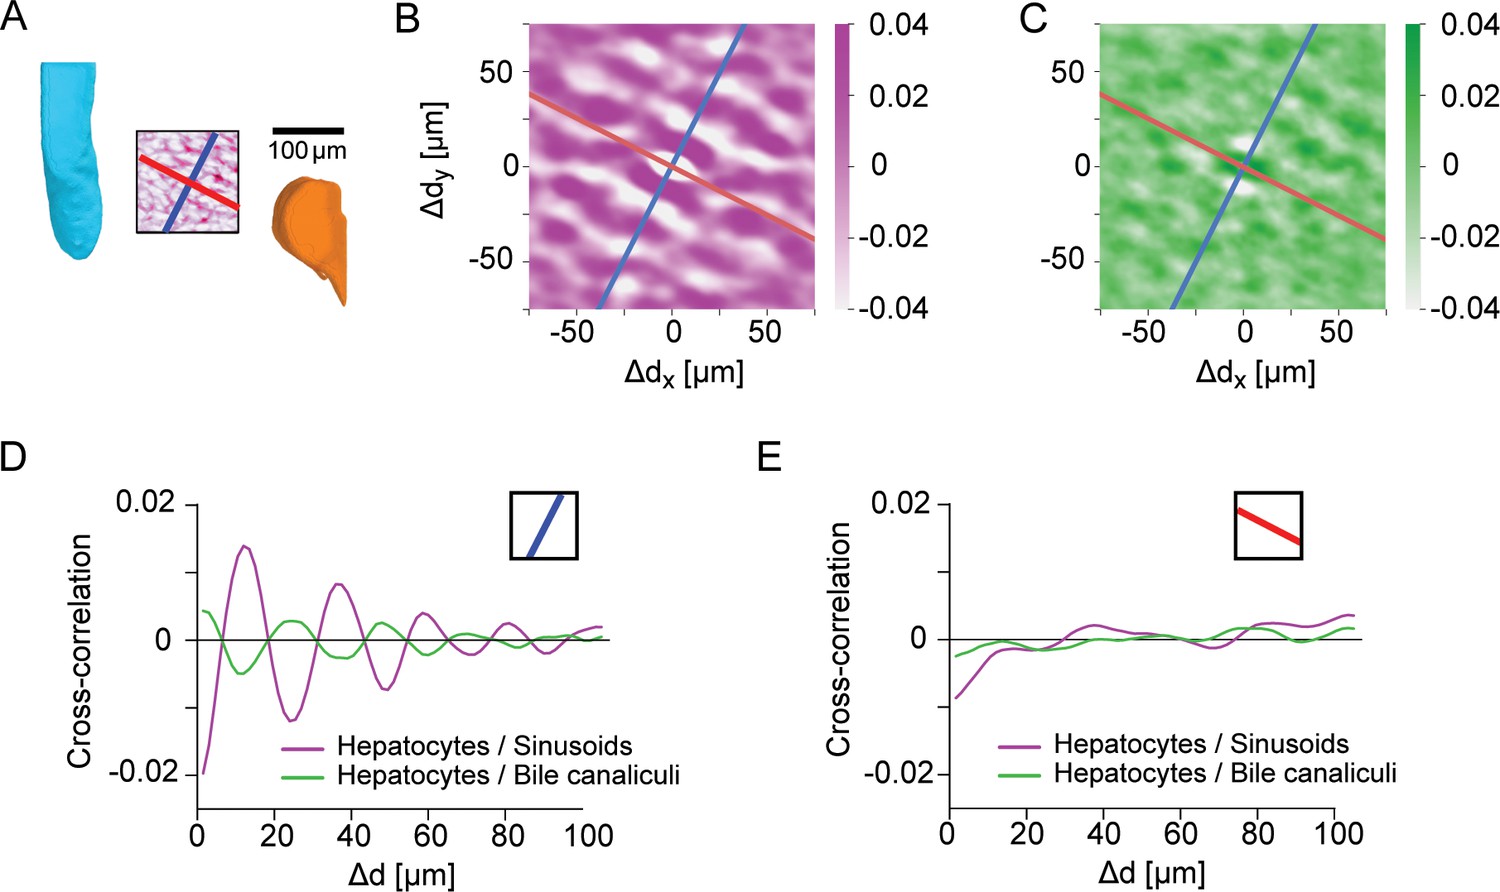
Control for layered order in the liver lobule.
(A) Region-of-interest (ROI) in the central region of a liver lobule, with CV (cyan) and PV (orange) serving as landmarks; identical to inset of Figure 3H. Inside the ROI, the density of sinusoids is shown (average density projection along z-axis), together with a reference direction for layered order (blue) and a control direction (red), perpendicular to the reference direction. (B) Two-dimensional cross-correlation between the projected density of hepatocytes and the projected density of sinusoids. (C) Analogous to panel B for the cross-correlation between hepatocytes and the BC network. (D) One-dimensional cross-correlations between the projected density of hepatocytes and sinusoids (magenta), as well as between hepatocytes and bile canaliculi (green), obtained from the two-dimensional cross-correlations by projection on the reference direction; identical to Figure 3H. (E) Same as panel D, but for projection on the control direction. The absence of oscillatory signals is consistent with layered order of liver tissue with layers approximately orthogonal to the reference direction, but parallel to the control direction. Scale bar 100 μm.
Figure 4 with 2 supplements
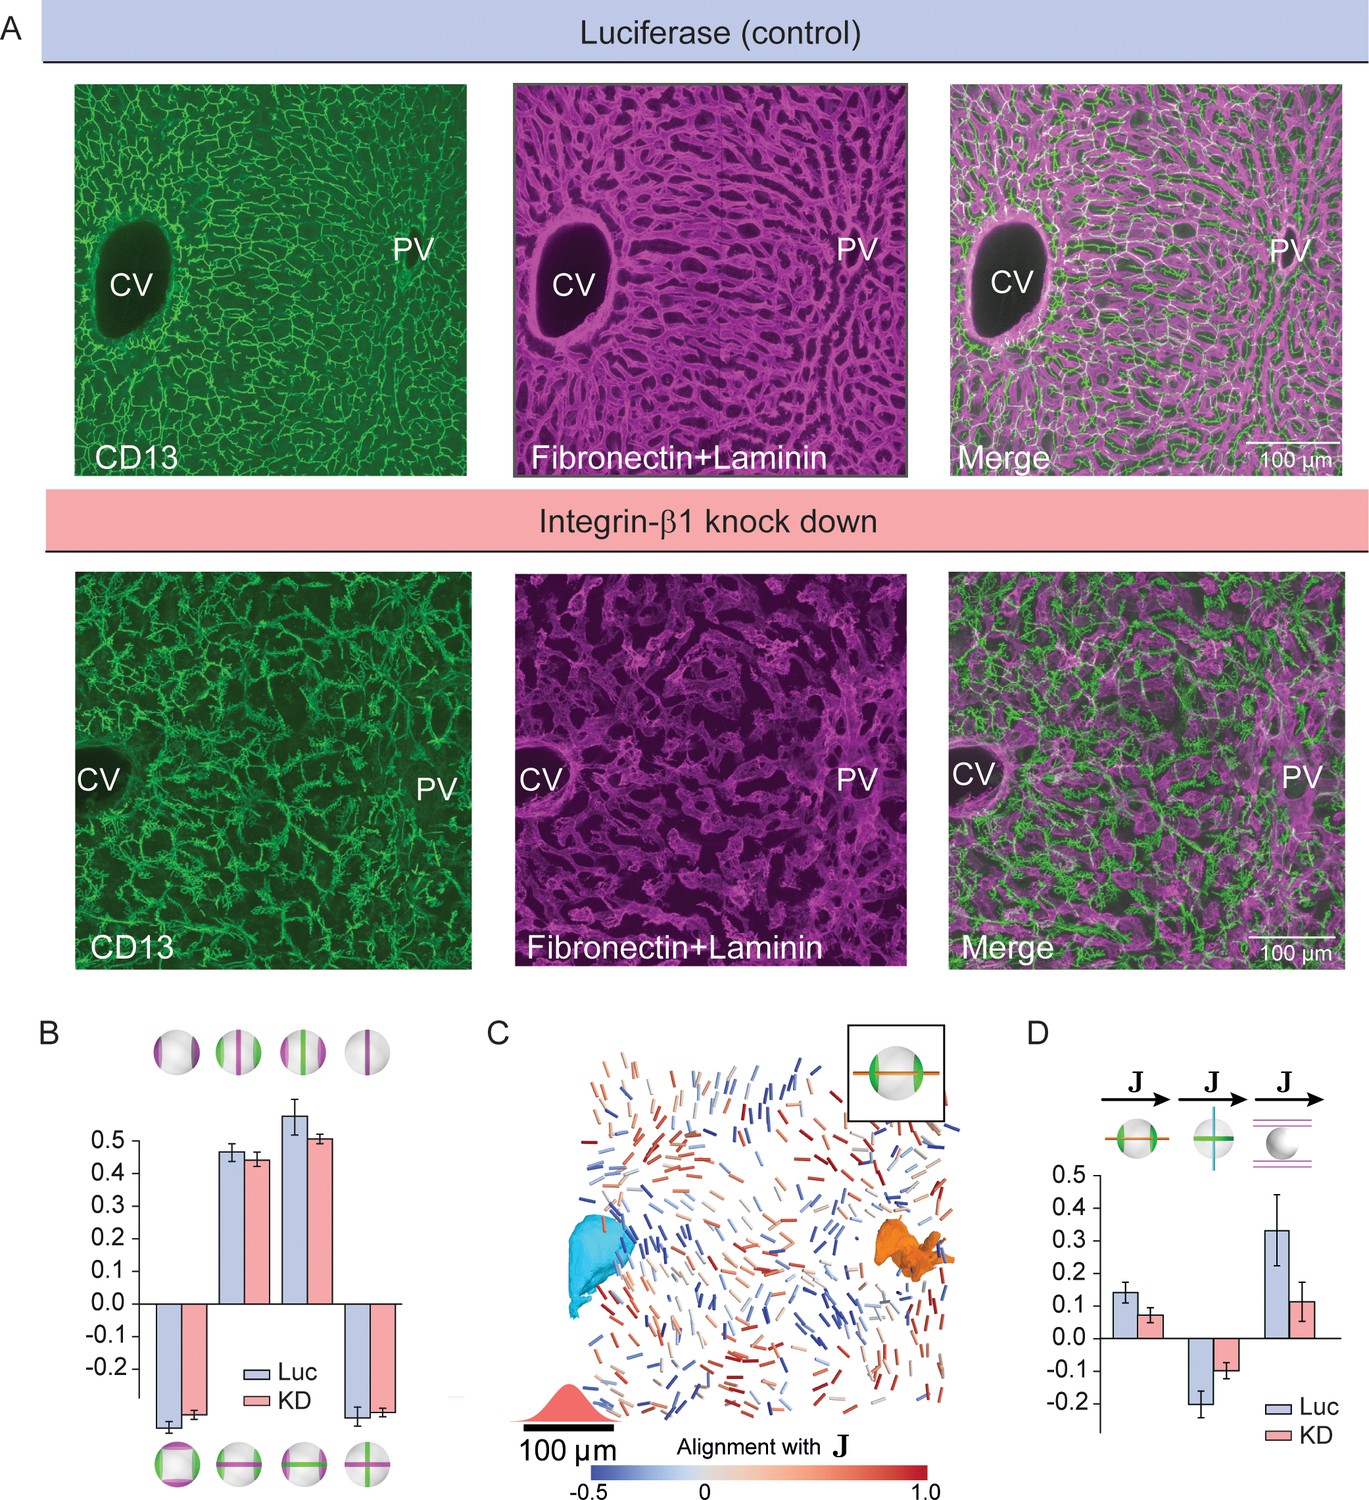
Liquid-crystal order, but not biaxial polarity of hepatocytes, is perturbed in Integrin-β1 KD mice.
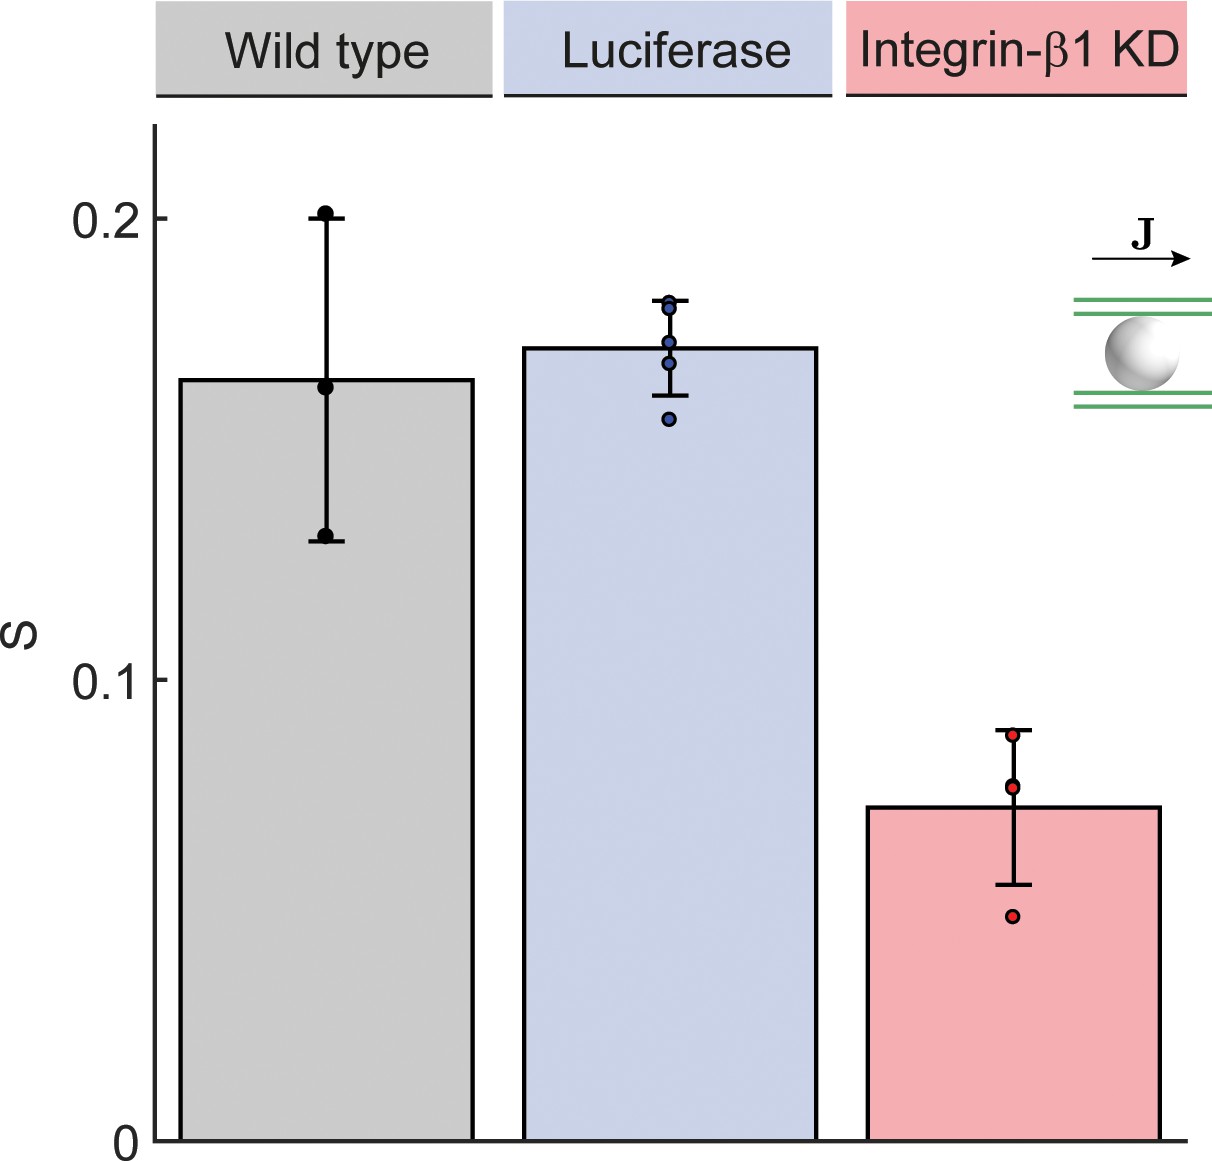
(A) Silencing Integrin-β1 in the liver results in distortion of both bile canalicular and sinusoidal networks, with reduced apparent alignment with the CV-PV axis in comparison to control conditions. Shown are representative samples for control conditions -upper panels, siRNA against Luciferase (Luc) and Integrin-β1 knock down -lower panels, siRNA against Integrin-β1 receptor (KD) stained for bile canalicular network (left, CD13 staining), sinusoidal network (middle, fibronectin/laminin staining), and merge (right). All panels correspond to maximal intensity z-projection of 60 μm of liver tissue. (B) Individual hepatocytes retain their biaxial cell polarity in Integrin-β1 KD, as revealed by cross-correlation analysis of nematic cell polarity axes for apical and basal plasma membrane patterns (analogous to Figure 2F). (C, D) In contrast, the alignment of biaxial cell polarity axes and the local preferred direction of the sinusoidal network with are reduced in Integrin-β1 KD. Panel C shows bipolar cell polarity axes of apical plasma membrane color-coded according to their alignment with the local reference direction () (analogous to Figure 3D). Panel D shows the quantification of alignment of apical bipolar axis, apical ring axis, and preferred sinusoid orientation with local reference direction (analogous to Figure 3G). A detailed graphical representation can be found in Figure 4—figure supplement 1. Statistics in B, D: mean+/-s.d. for n=5 animals (Luc) and n=4 animals (KD); statistical significance: panel B: , , , ; panel D: , , , two-sided t-test assuming unequal variances).
Figure 4—figure supplement 1

Analysis of the Integrin-β1 expression by immunofluorescence staining.
A) High-resolution images of liver samples for control conditions (top, siRNA against Luciferase) and Integrin-β1 knock down (bottom, siRNA against Integrin-β1) showing staining for the sinusoidal endothelial cells (Flk-1 on the left), Integrin-β1 (middle) and cell border and nuclei (Phalloidin and DAPI, on the right). (B) Zoomed images from the red insets in panel A. White arrows indicate the presence of Integrin-β1 on the lateral surface of hepatocytes only in the control but not in the KD. Images in A and B correspond to the average image of 50 sequential time-lapse images. (C) Super-resolution localization microscopy (see Materials and methods) of Phalloidin (left) and Integrin-β1 (right, dotted pattern) staining of the yellow insets on panel A resolved the individual membranes of neighboring hepatocytes and sinusoids (S, yellow arrows). Integrin-β1 is present on the lateral and basal plasma membrane of hepatocytes as well as on the sinusoidal endothelial cell membranes in the control (upper right), but only in the sinusoids in the KD (bottom right). Scale bar: 20 µm, 10 µm and 5 µm for panels A, B and C, respectively. Control and KD images were acquired using the same microscopy settings.
Figure 4—figure supplement 2
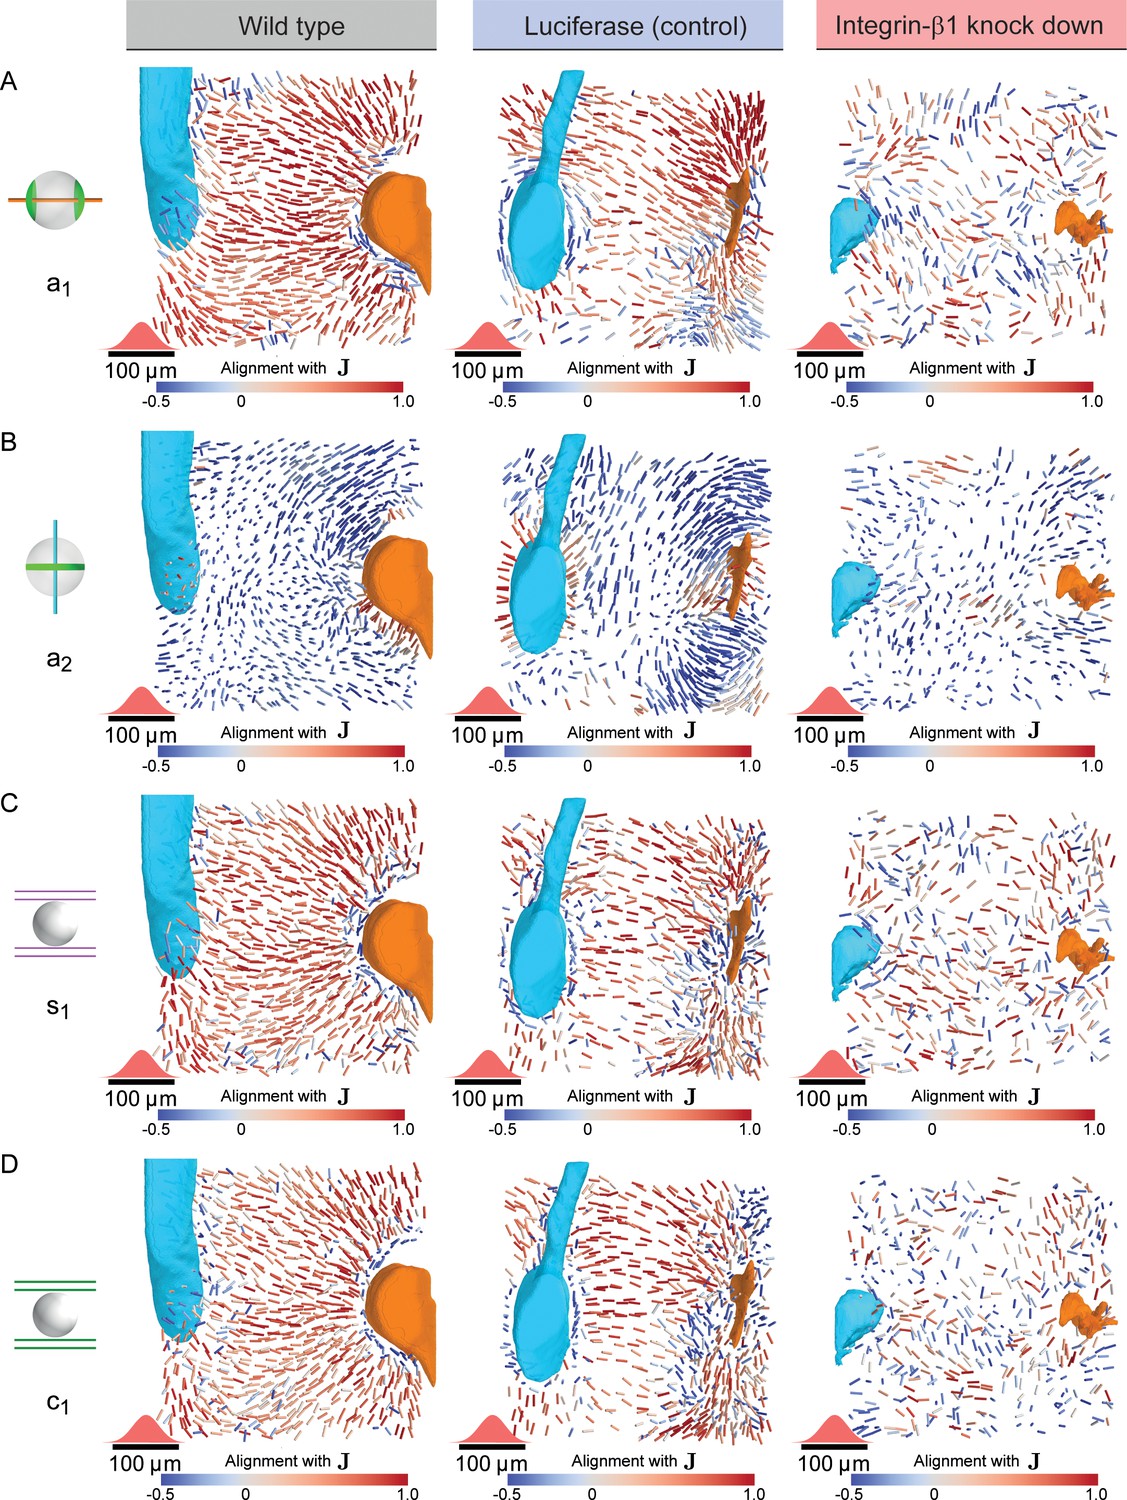
Disturbed nematic liquid-crystal order in Integrin-β1 knock-down.
(A) Bipolar cell polarity axes of apical plasma membrane distribution () shown as lines of constant length for individual hepatocytes at their respective position in the lobule after local averaging using a 3D Gaussian kernel at each hepatocyte cell center (standard deviation 20 μm, indicated in red above the scale bar) color-coded according to their alignment with the lobule-level reference field () for wildtype (left, identical to Figure 3D), Luciferase control (middle) and Integrin-β1 knock-down (right, identical to Figure 4C). (B) Same as panel A, but for the ring axis of apical plasma membrane distribution (), analogous to Figure 3E. (C) Same as panel A, but for the preferred direction of the local sinusoidal network surrounding each hepatocyte, analogous to Figure 3F. (D) Same as panel A, but for the preferred direction of the local bile canaliculi network surrounding each hepatocyte.
Figure 5
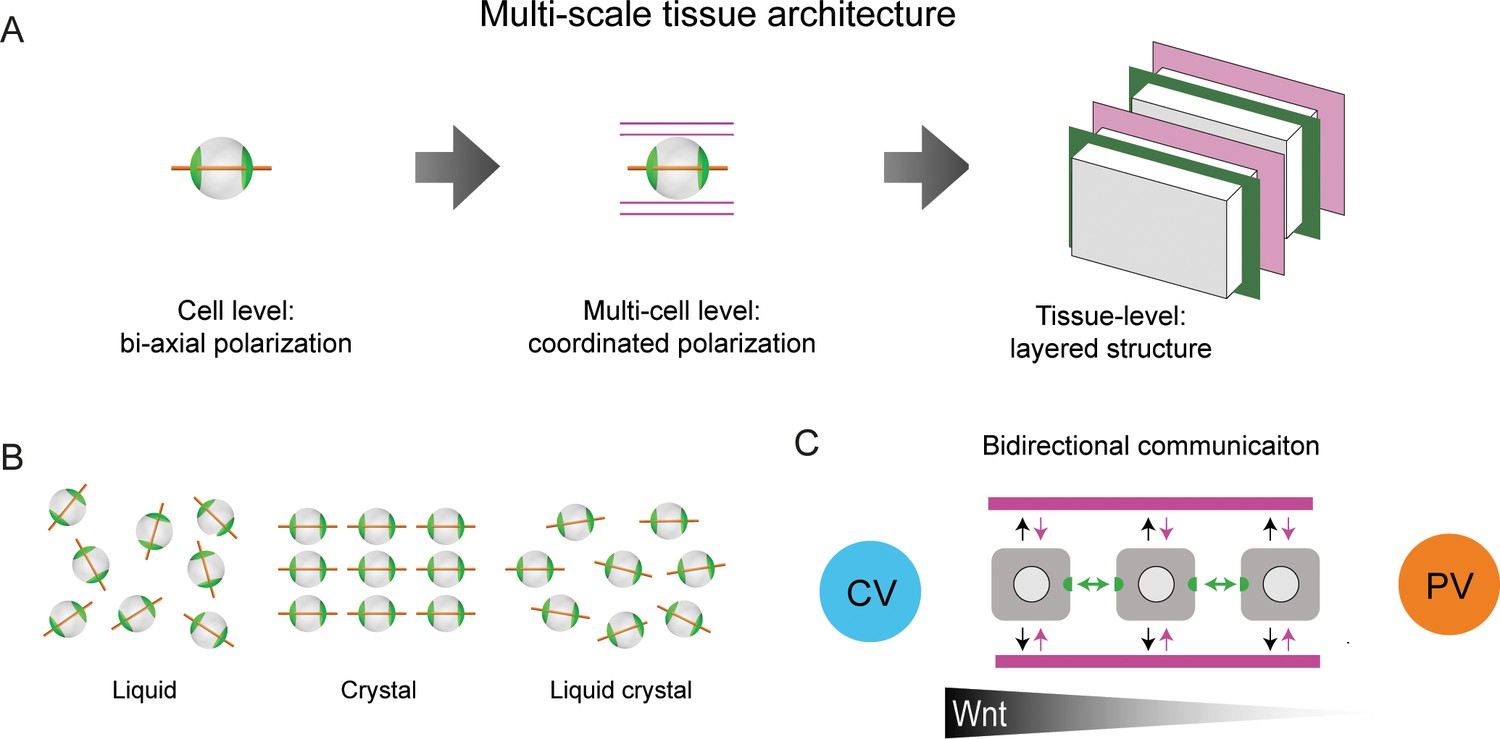
Proposed model of liver tissue architecture.
(A) Our work proposes a new multi-scale model of liver architecture, characterized by liquid-crystal order of hepatocytes with biaxial nematic cell polarity, co-alignment of hepatocyte polarity and preferred direction of the sinusoidal network, and layered order of alternating sinusoidal network and layers of hepatocytes with a thickness of one cell diameter. (B) Cartoon representation of isotropic liquid with lack of positional and orientational order, crystalline order, and nematic liquid-crystal with orientational order. (C) Schematic of bidirectional communication between sinusoids and hepatocytes. Long-range gradients, for example Wnt signaling, could provide alignment cues for the orientation biaxial cell polarity of hepatocytes (top-down organization), in addition to local interactions between hepatocytes and sinusoids (bottom-up organization).
Tables
Key resources table
| Reagent type (species) or resource | Designation | Source or reference | Identifiers | Additional information |
|---|---|---|---|---|
| Antibody | anti-Flk-1 (goat polyclonal) | R and D system | AF644 / RRID:AB_355500 | (1:200) |
| Antibody | anti-laminin (rabbit polyclonal) | Sigma | L9393/RRID:AB_477163 | (1:5000) |
| Antibody | anti-fibronectin (rabbit polyclonal) | Millipore | AB2033/RRID:AB_2105702 | (1:1000) |
| Antibody | anti-CD13 (rat monoclonal) | Novus | NB100−64843/RRID:AB_959651 | (1:500) |
| Antibody | anti-integrin ß1 (rat monoclonal) | Millipore | MAB1997/RRID:AB_2128202 | (1:1000) |
| Antibody | Donkey anti-goat Alexa Fluor 647 | Invitrogen | A21447/RRID:AB_2535864 | (1:1000) |
| Antibody | Donkey anti-rabbit Alexa Fluor 647 | Invitrogen | A31573/RRID:AB_2536183 | (1:1000) |
| Antibody | Donkey anti-rat CF 568 | Biotium | 20092/RRID:AB_10559037 | (1:1000) |
| Other | Phalloidin-488 | LIFE technologies | A12379/RRID:AB_2315147 | (1:150) |
| Other | Dapi | LIFE technologies | D1306/RRID:AB_2629482 | (1 µg/ml) |
| Sequence-based reagent | LNP-formulated siRNAs against luciferase | Bogorad et al., 2014 | (1 mgKg-1) | |
| Sequence-based reagent | LNP-formulated siRNAs against Integrin-ß1 | Bogorad et al., 2014 | (1 mgKg-1) | |
| Strain, strain background (M. musculus C57BL/6JOlaHsd) | Wild type, Luciferase, Integrin-ß1 knock down | Charles River Laboratory | ||
| Software, algorithm | MotionTracking | Morales-Navarrete et al., 2015 | ||
| Software, algorithm | MuSiCal | Agarwal and Macháň, 2016 |
Additional files
-
Transparent reporting form
- https://doi.org/10.7554/eLife.44860.021
Download links
A two-part list of links to download the article, or parts of the article, in various formats.
Downloads (link to download the article as PDF)
Open citations (links to open the citations from this article in various online reference manager services)
Cite this article (links to download the citations from this article in formats compatible with various reference manager tools)
Liquid-crystal organization of liver tissue
eLife 8:e44860.
https://doi.org/10.7554/eLife.44860


