Identification of compounds that rescue otic and myelination defects in the zebrafish adgrg6 (gpr126) mutant
- University of Sheffield, United Kingdom
- Sosei Heptares, United Kingdom
Figures
Figure 1 with 1 supplement
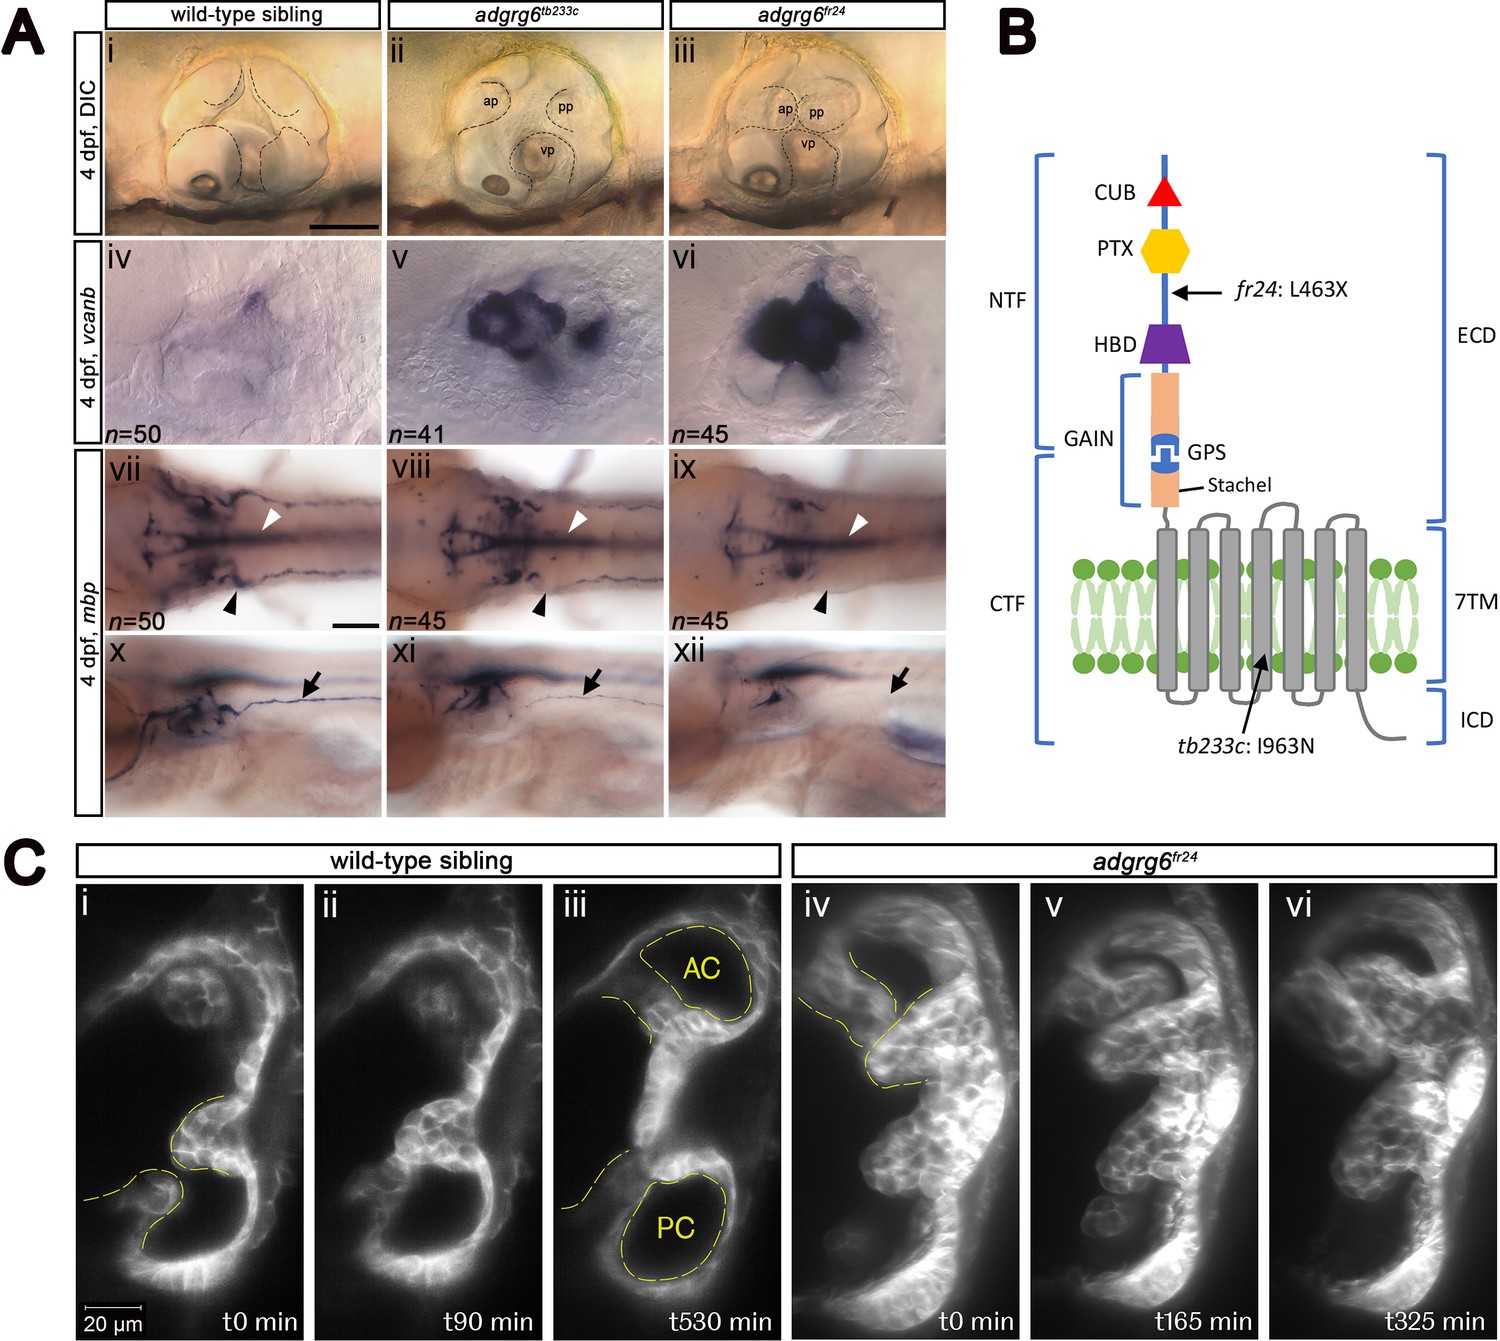
Comparison of adgrg6 mutant allele phenotypes in the inner ear and peripheral nervous system.
(A) (i–iii) Live images of 4 dpf otic vesicles, lateral view. (i) Wild-type sibling, (ii) adgrg6tb233c, (iii) adgrg6fr24 showing the swollen, unfused projections in the homozygous mutant otic vesicles in ii and iii compared with the fused pillars in the wild-type ear (marked with dotted lines). (iv–vi) ISH with vcanb at 4 dpf. (iv) Wild-type sibling, (v) adgrg6tb233c, (vi) adgrg6fr24 mutant ears showing overexpression of vcanb in the unfused projections. Stronger staining is seen in the stronger allele, fr24. (vii–xi) ISH with mbp at 4 dpf, (vii-ix) dorsal views, (x–xii) lateral views. (vii, x) wild-type sibling, (viii, xi) adgrg6tb233c, (ix, xii) adgrg6fr24 showing complex staining patterns in the PNS (black arrows and arrowheads) and CNS (white arrowheads). mbp staining around the PLLg is absent in both tb233c and fr24 alleles (black arrowheads); staining in the posterior lateral line nerve is variable in tb233c mutants and absent in fr24 mutants (black arrows). (B) Schematic diagram showing the structure of the Adgrg6 receptor and the positions of the predicted amino acid changes for the two adgrg6 mutant alleles used in this study. (C) Light-sheet microscope images using a transgenic line expressing GFP in the otic epithelium, showing a dorsal view of the ear (anterior to the top). (i–iii) Wild-type sibling showing anterior and posterior pillars formed from fused projections (iii). Note that images are flipped horizontally from the originals for ease of comparison (see Video 1; t0 on the stills corresponds to ~100 mins into the video). (iv–vi) Still images from a time-lapse video of adgrg6fr24 mutant with unfused projections that roll around each other (see Video 2). Abbreviations: AC, lumen of anterior semicircular canal; ap, anterior projection; CTF, carboxy-terminal fragment; CUB, Complement C1r/C1s, Uegf, BMP1 domain; ECD, extracellular domain; GAIN, GPCR auto-proteolysis domain; GPS, GPCR proteolytic site; HBD, hormone binding domain; ICD, intracellular domain; NTF, amino-terminal fragment; PC, lumen of posterior semicircular canal; pp, posterior projection; PTX, Pentraxin domain; vp, ventral projection; 7TM, 7-transmembrane domain. Scale bars: 50 μm in Ai, for Aii–vi; 100 μm in Avii, for Aviii–xii; 20 μm in Ci, for Cii–vi.
Figure 1—figure supplement 1
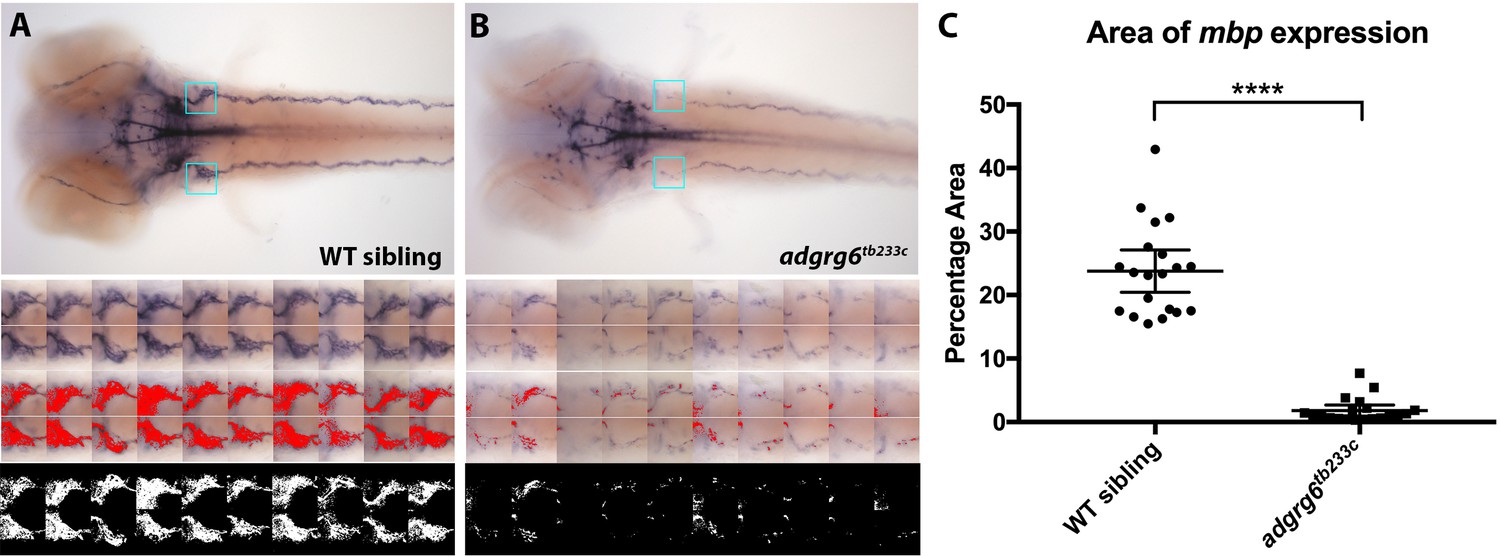
Quantification of mbp expression around the posterior lateral line ganglion in adgrg6tb233c mutants and wild-type sibling embryos.
(A) Top, wild-type (WT) sibling: bright-field image of 4 dpf embryo stained with mbp. Dorsal view, anterior to the left. Blue box indicates the region of interest (ROI) used for the quantification of the left and right posterior lateral line ganglion region. Below, three sets of images of the left and right ROI for each of 10 embryos (total of 20 areas), including the bright-field images, the threshold area (red) levels set with HSB on Fiji (Hue: 166–236, Saturation: 43–98, Brightness: 31–184), and the binary image used to determine the area of staining. (B) adgrg6tb233c mutant embryo images comparable to those shown in A with identical threshold settings used in Fiji. (C) Comparison of the area of mbp staining between the adgrg6tb233c mutant and wild-type sibling embryos using the quantification obtained in A and B. ****p<0.0001, Student’s t-test. Error bars represent the mean ±95% CI.
-
Figure 1—figure supplement 1—source data 1
Source data for the percentage area of mbp expression shown in Figure 1—figure supplement 1.
- https://doi.org/10.7554/eLife.44889.004
Figure 2
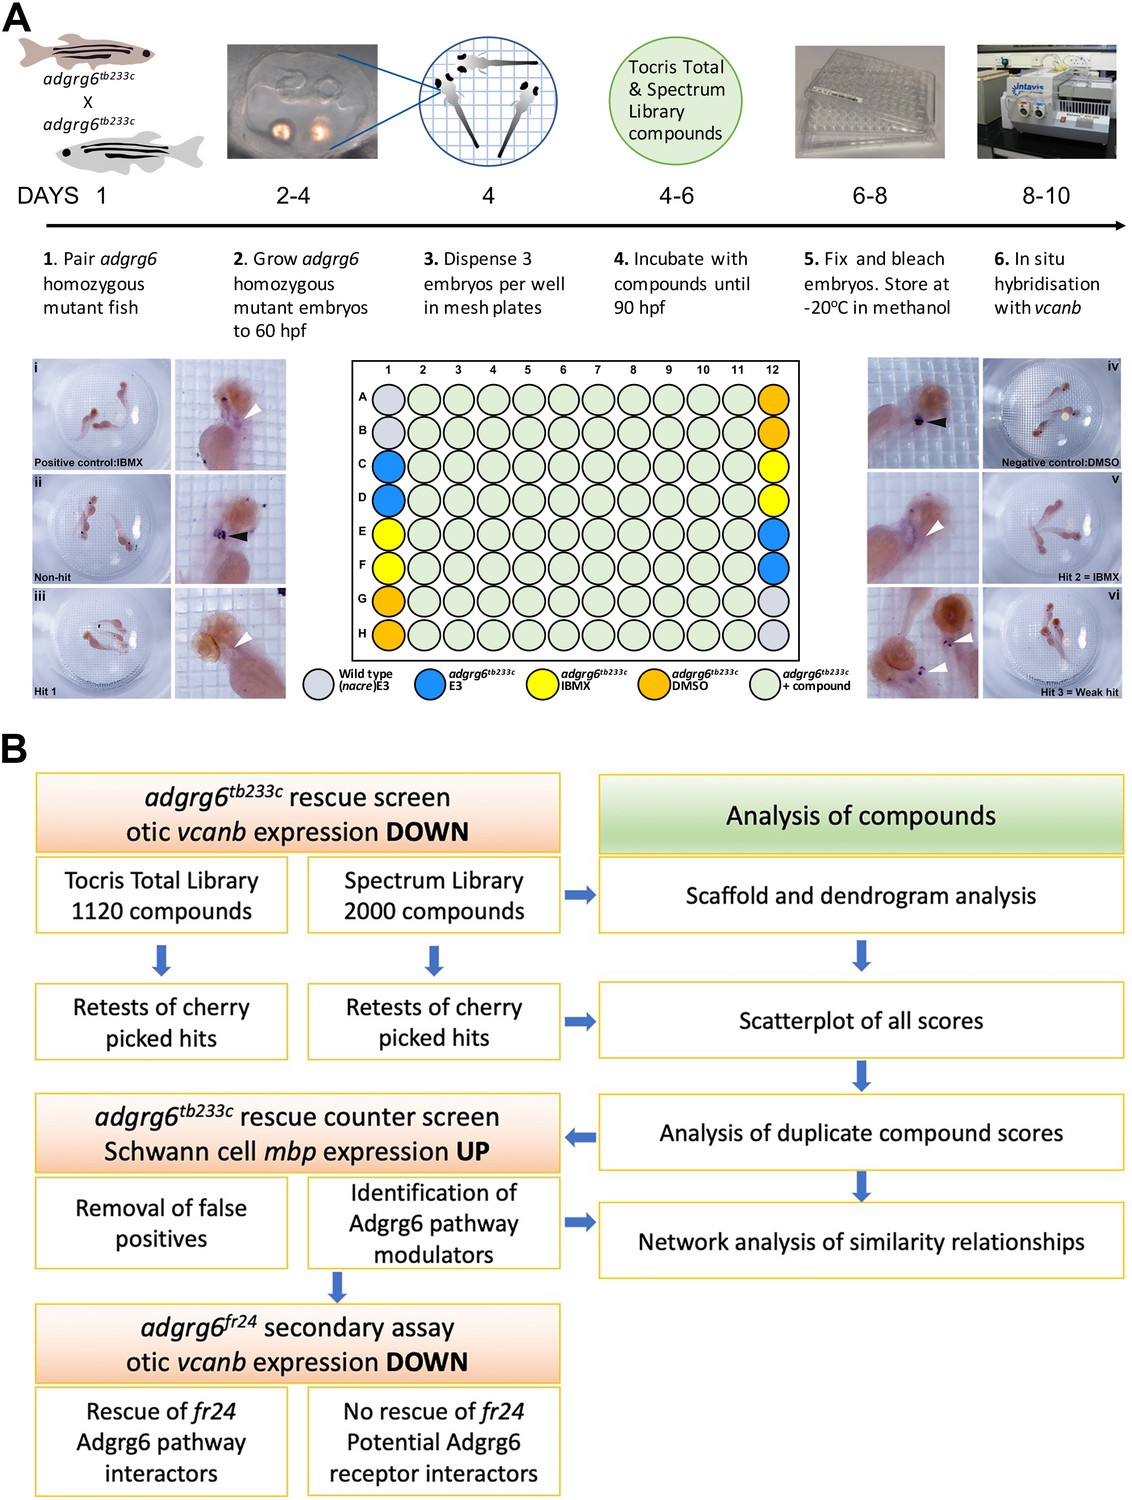
Overview of the screening assay protocol and strategy.
(A) Schematic of the screening assay protocol. Homozygous adult adgrg6tb233c mutant fish were paired to raise large numbers of adgrg6tb233c mutant embryos. Embryos were grown until 60 hpf, when the lateral, anterior and posterior epithelial projections in the inner ear are evident. Three embryos were aliquoted into each well of a mesh-bottomed multiwell plate in E3 medium. The mesh-bottomed plate was then transferred to the drug plate containing control compounds as shown in the plate layout and library compounds at 25 µM in 250 µL of E3 embryo medium. Plates were incubated at 28°C until 90 hpf. The mesh-bottomed plate and embryos were then transferred to 4% PFA for fixation (4°C, overnight) and then processed for ISH to vcanb. Micrographs show a selection of typical results. Treatment with 100 µM IBMX (positive control, top) results in loss (rescue) of otic vcanb expression (white arrowhead). Strong otic vcanb expression (black arrowhead) is evident in embryos where the compound had no effect (non-hit) and in negative control wells (not shown). Note the spot of stain in each embryo, marking expression in the otic vesicle. Three examples are shown of wells where compounds were scored as a hit; one of these (Hit 2) was IBMX, represented in the Spectrum collection. (B). Pipeline of the compound screening strategy and chemoinformatics analysis. The left hand side describes the flow of experimental work and the right hand side describes the complementary chemoinformatics processes. For details, see the text.
Figure 3 with 1 supplement
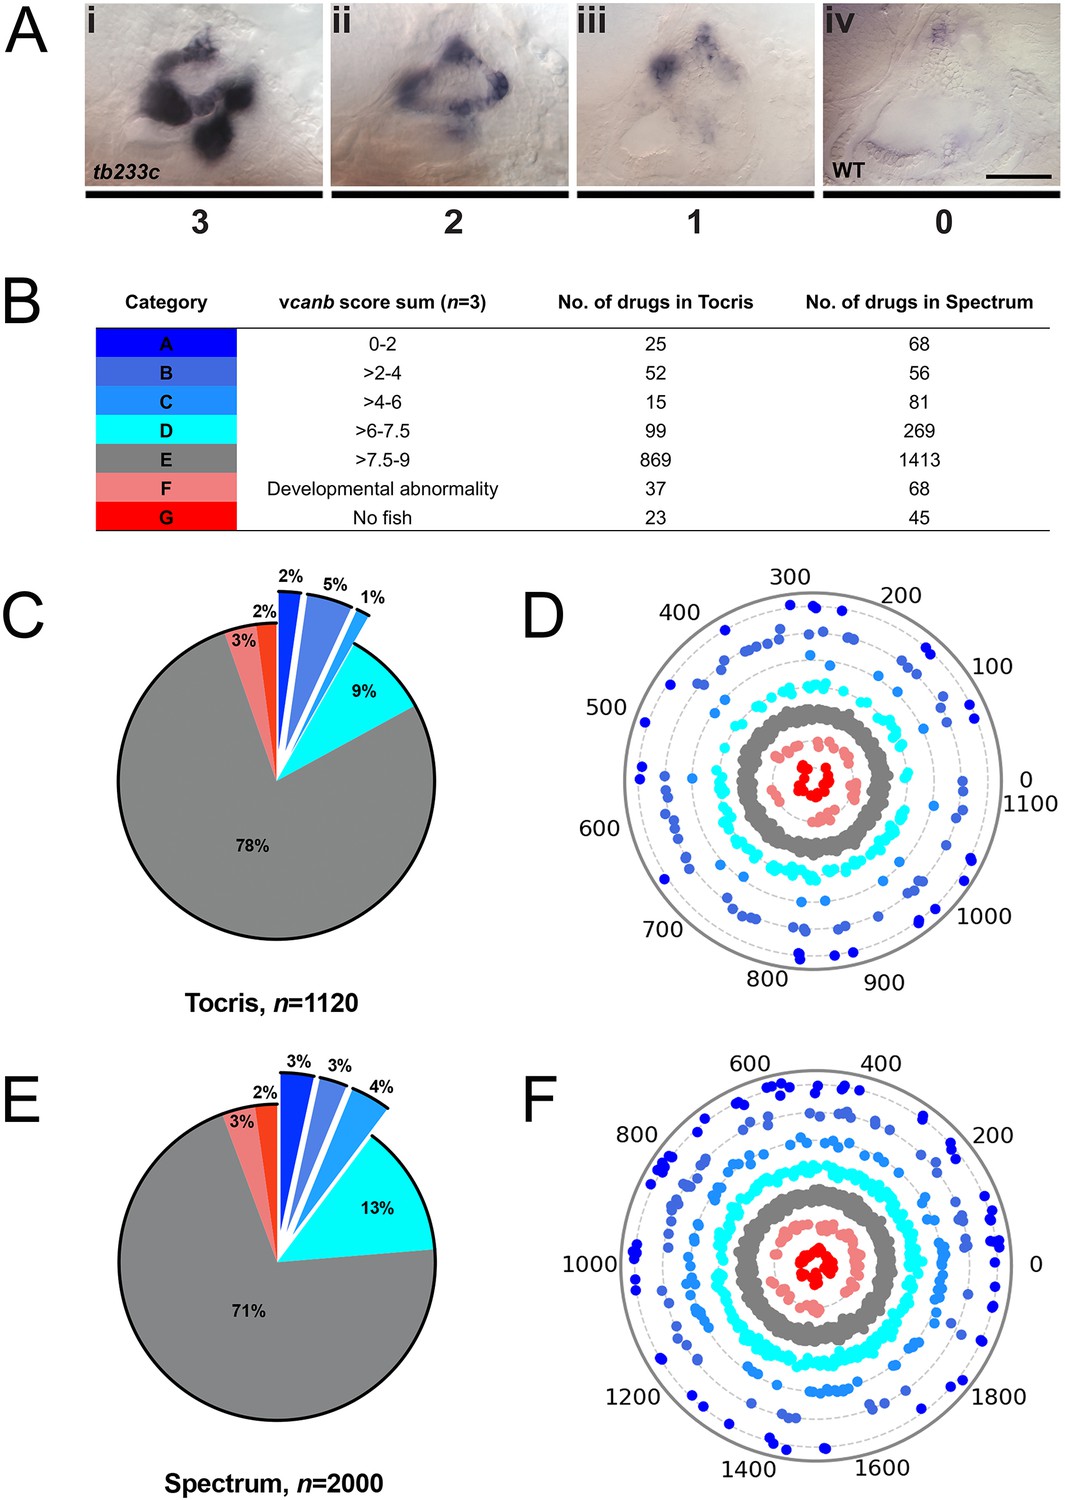
A primary drug screen identified 92 (Tocris) and 205 (Spectrum) putative hit compounds able to down-regulate vcanb mRNA expression in adgrg6tb233c mutants.
(A) Scoring system used to assess vcanb mRNA expression levels in the inner ear of adgrg6tb233c embryos after treatment. (Ai) vcanb mRNA expression in the untreated/DMSO-treated adgrg6tb233c mutant ear (score 3). Scores 2 (Aii) and 1 (Aiii) were given to embryos that showed reduced vcanb mRNA expression to some extent, with 1 given for a stronger down-regulation than 2. (Aiv) Score 0 was given to embryos where vcanb mRNA levels were equivalent to wild-type levels. (B) Compounds were categorised A–G according to the total vcanb score from the three embryos treated. Colours for each category correspond to the colours used in panels C–F. (C, E) Pie charts showing the distribution of compounds from the Tocris (C) and Spectrum (E) libraries in categories A–G. (D, F) Compounds from the Tocris and Spectrum libraries were ordered according to similarities in their chemical structure and presented as individual dots in polar scatterplots in D and F, respectively, with jitter (noise) introduced to improve visualisation. The Spectrum library results have a higher level of clustering as expected from the scaffold analyses. Scale bar: 50 μm.
-
Figure 3—source data 1
Source data for Figure 3D.
Dendrogram representing structural similarity between library compounds (Tocris). Dendrogram of the Tocriscreen Total library compounds based on the similarity matrix between all pairs of compounds (Ward’s method of hierarchical agglomerative clustering—see Materials and methods). Compounds are named by their plate and well ID.
- https://doi.org/10.7554/eLife.44889.011
-
Figure 3—source data 2
Source data for Figure 3F.
Dendrogram representing structural similarity between library compounds (Spectrum). Dendrogram of the Spectrum library compounds based on the similarity matrix between all pairs of compounds. Compounds are named by their plate and well ID.
- https://doi.org/10.7554/eLife.44889.012
Figure 3—figure supplement 1
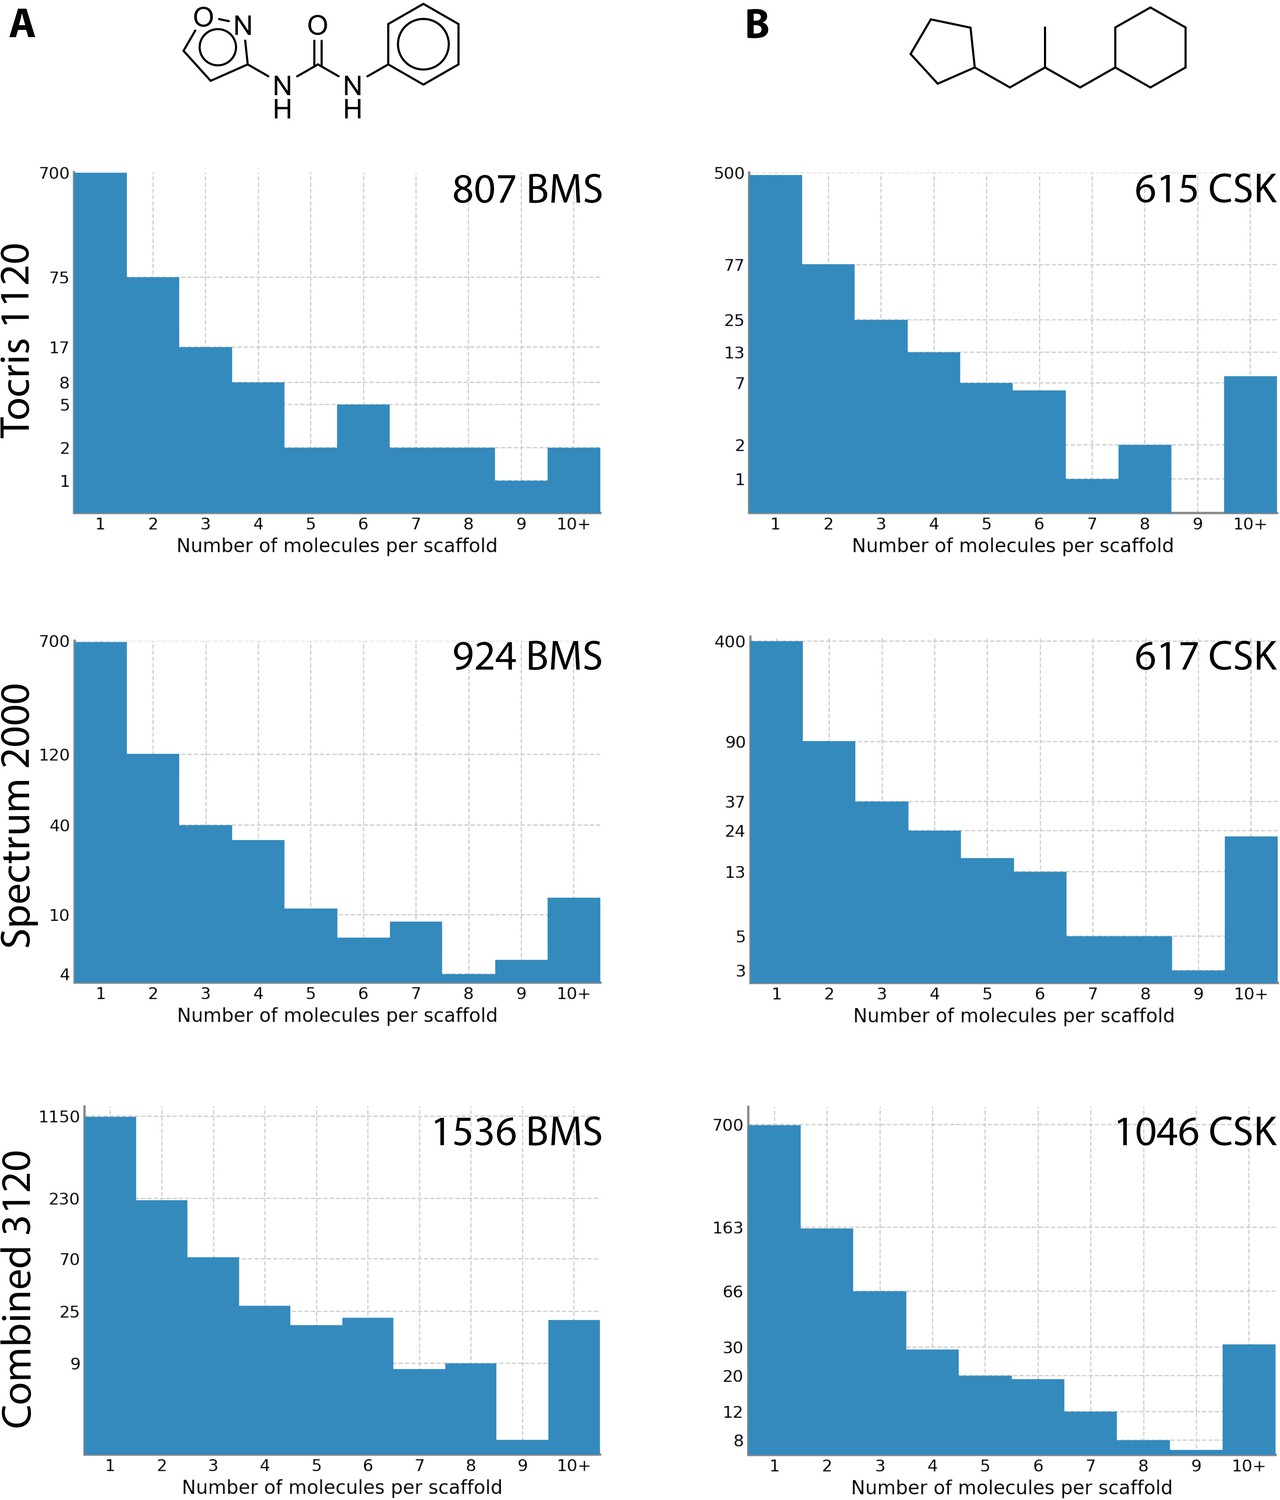
Scaffold analysis of compound structures in the Tocriscreen Total and Spectrum libraries.
Two different methods were used to remove side chains and determine the core structures of each compound. Scaffolds were then compared and a histogram produced with the number of molecules per scaffold. The histograms on the left use Bemis and Murcko scaffolds (Bemis and Murcko, 1996), an example of which shown at the top. The histograms on the right were generated using CSK scaffolds. The number of scaffolds for each library is shown in the top right of each graph. An example BMS scaffold and CSK scaffold (obtained from the same compound) are shown above the histograms.
Figure 4
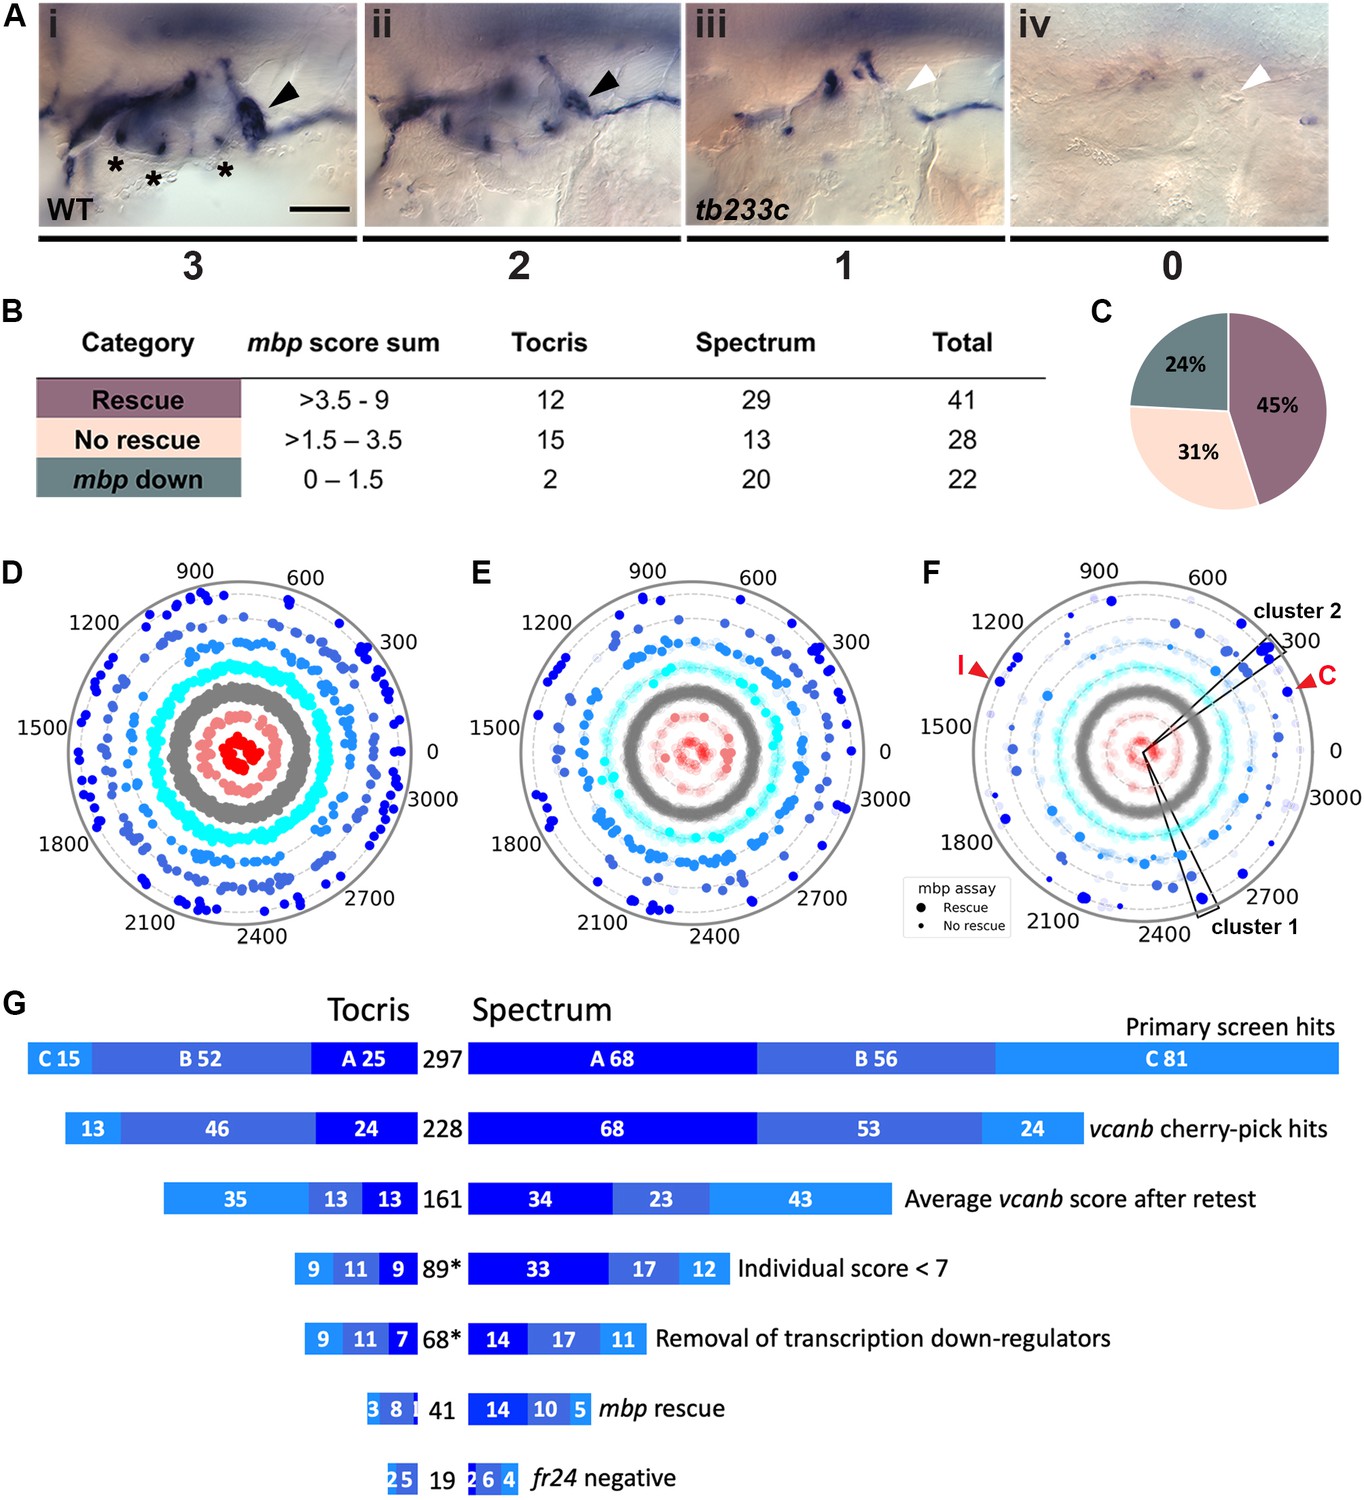
Retesting and counter screen for mbp expression reveals chemical clustering of hit compounds.
(A) Scoring system used to assess mbp mRNA expression levels around the PLLg of adgrg6tb233c embryos after treatment. (Ai) A score of 3 was given to embryos where mbp mRNA expression was similar to wild-type levels. Black arrowhead: mbp expression around the PLLg. (Aii) A score of 2 was given to embryos that showed weak mbp expression around the PLLg. (Aiii) A score of 1 was given to embryos with mbp expression identical to that in untreated adgrg6tb233c mutants (absence of mbp expression around the PLLg (white arrowhead), with weak expression elsewhere). (Aiv) A score of 0 was used to indicate embryos where mbp mRNA expression was absent throughout the PNS. Asterisks mark expression near the three cristae of the ear. Scale bar: 50 μm. (B, C) mbp scoring system and classification of the compounds. (B) Compounds were categorised according to the mbp score sum from three embryos (average from two experiments; six embryos total) and grouped into compounds able to rescue mbp expression (score >3.5–9) and unable to rescue mbp expression (>1.5–3.5). A third class of compounds down-regulated both vcanb and mbp (score 0–1.5) and were not followed further. (C) Distribution of the compounds in the different rescue categories after the mbp counter screen. (D) Compounds from both libraries are represented as individual dots in a combined polar scatterplot (3120 compounds in total; https://adlvdl.github.io/visualizations/polar_scatterplot_whitfield_vcanb.html). Compounds were ordered according to similarities in their chemical structure and placed in concentric circles according to the category A–G they were assigned to after the primary screen, with jitter (noise) introduced to improve visualisation. (E) Polar scatter plot of the 91 hit compounds that passed the first retest and were followed up with mbp counter screens; previous scores for the compounds not followed are faded. (F) Polar scatter plot of the final 68 hit compounds (non-faded) after mbp counter screens. Bigger dots represent compounds that rescued mbp expression, whereas smaller dots correspond to the compounds that did not rescue mbp expression; compounds that downregulated mbp expression, or were not followed, are faded. Wedges on the scatter plot delineate the two clusters of compounds with similar structures for which some hits were followed up in further analysis (see text). The positions of IBMX (I) and colforsin (C) are indicated (red arrowheads). (G) Overview of the hit selection process. The length of the horizontal bars is proportional to the number of hit compounds taken through to each stage. Data for the Tocris library are on the left-hand side; data for the Spectrum library are on the right-hand side. The proportion of compounds in hit categories A, B and C are shown using the same colour scheme as in Figure 3, with the top bar representing the number of hits from the primary screen listed in Figure 3B. The second bar shows the number of compounds that were cherry-picked. The average scores from nine embryos (after retests) is shown in the third bar. Note that some compounds will change category after the retests and the number of category C compounds is increased. Any compounds that failed to rescue in any single retest were also not taken forward (fourth bar). The mbp data (E) are represented in the fifth and sixth bars. The final bar represents the compounds that were unable to rescue the strong fr24 allele. The total number of compounds at each stage is shown in the centre. Asterisks denote numbers that do not include duplicate compounds.
-
Figure 4—source data 1
Source data for Figure 4D.
Dendrogram representing structural similarity between library compounds (Combined). Dendrogram of the combined Spectrum and Tocriscreen Total library compounds based on the similarity matrix between all pairs of compounds. Compounds are named by their plate and well ID.
- https://doi.org/10.7554/eLife.44889.014
Figure 5
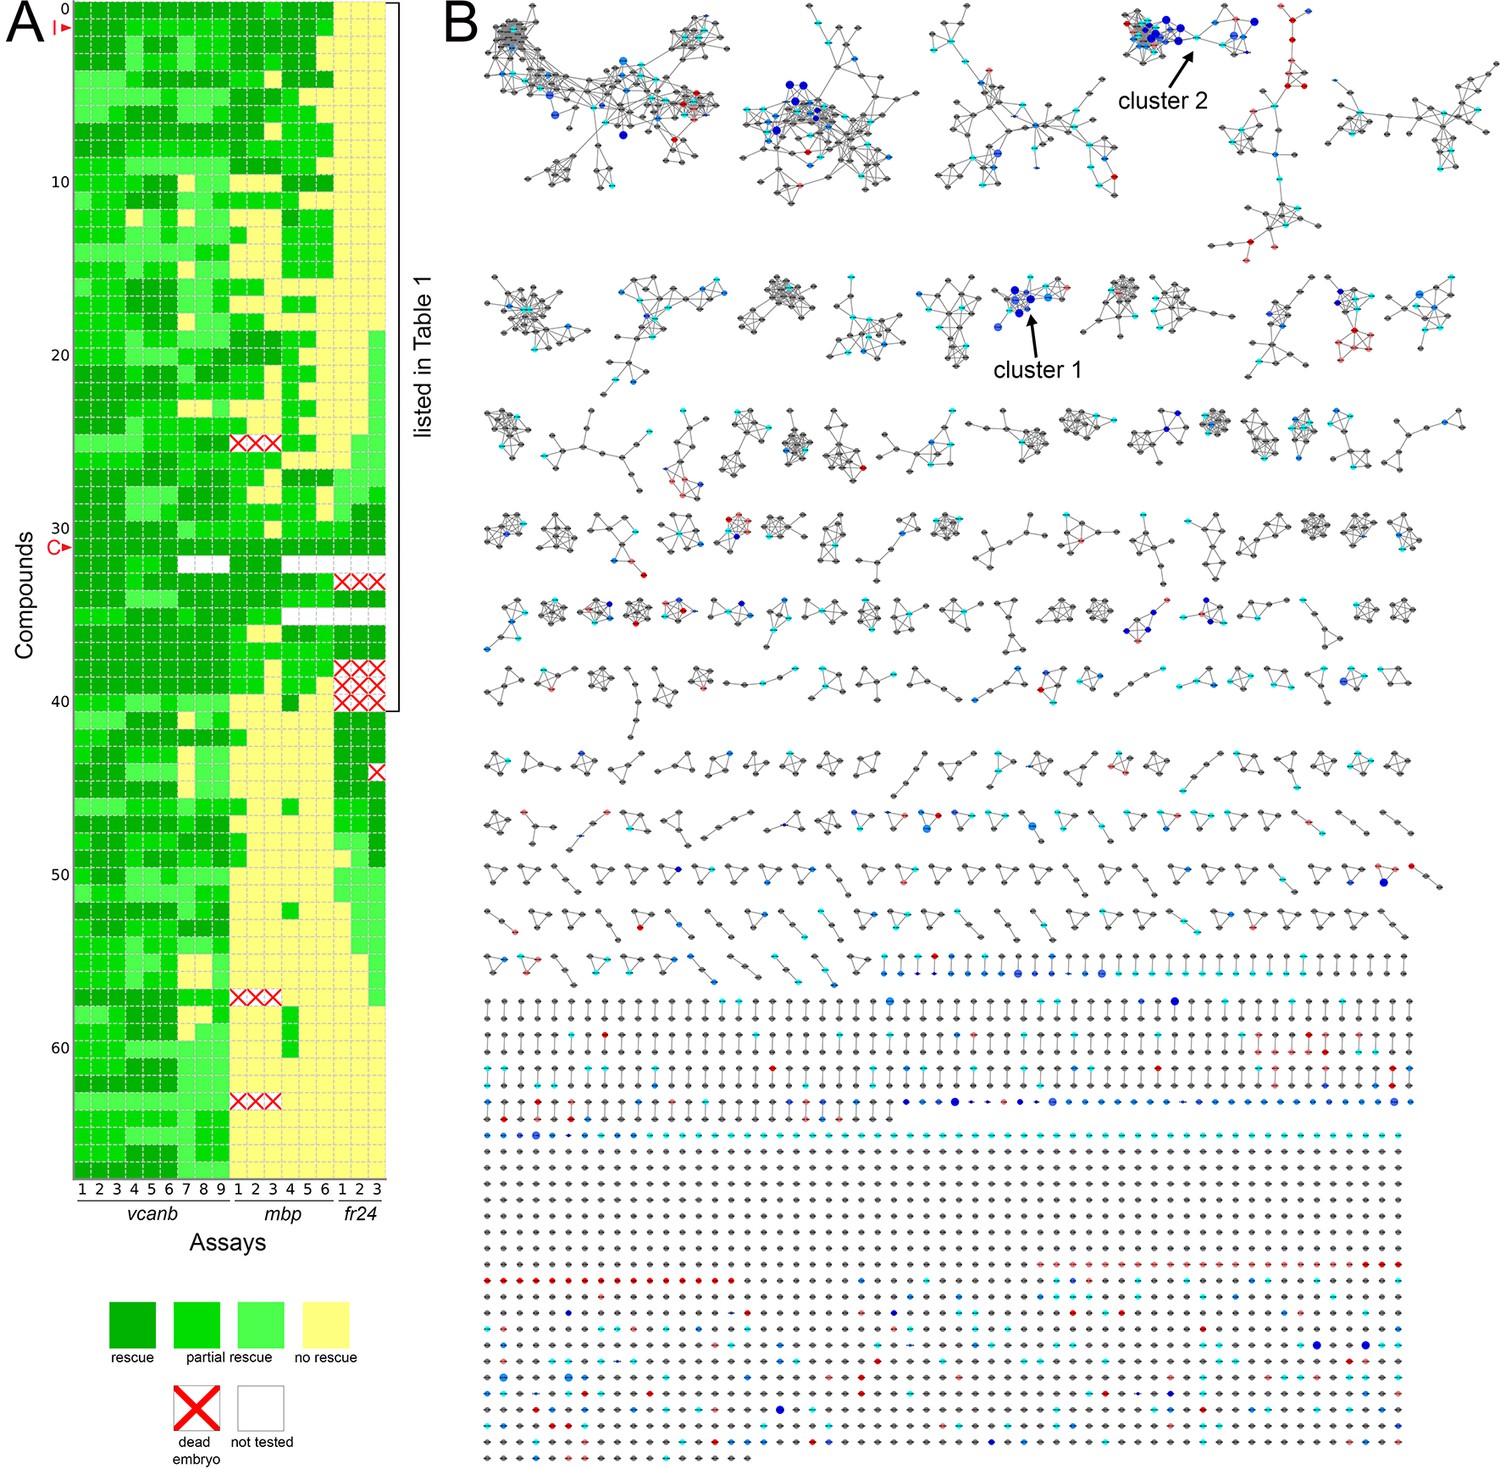
Heatmap of the assay results and network analysis for 68 compounds identified in the vcanb screen.
(A) Heatmap of the assay results for each of the 68 hit compounds. Each box represents an embryo screened in each of the three assays (vcanb, mbp and fr24) as listed at the bottom of the heatmap. Each row corresponds to a different compound. Colours correspond to the scoring system used for each screen (0–3), with dark green, a strong hit (rescue of the mutant phenotype); yellow, no rescue; white, no data; white with red cross, toxic. Compounds were sorted based on the average score for mbp with strongest rescue at the top. The bracket indicates the 41 compounds that rescued both vcanb and mbp expression in adgrg6tb233c mutants and thus represent putative Adgrg6 pathway modulators. Abbreviations: C, colforsin; I, IBMX. (B) Network analysis based on structural similarity, showing all 3120 compounds from the two libraries. Compounds that rescued mbp expression are shown as larger nodes; compounds that did not rescue mbp expression are shown as smaller nodes. The colours used for compounds/nodes correspond to categories A–G (as indicated in Figure 3) and the two clusters of structurally similar compounds highlighted in Figure 4 are also shown here. An interactive version of this figure can be accessed and mined at: https://adlvdl.github.io/visualizations/network_whitfield_vcanb_mbp/index.html.
Figure 6

Hit compounds from the vcanb screen vary in their ability to restore mbp expression in adgrg6tb233c mutant embryos.
(A) Section of the heatmap in Figure 5A showing the results for nifedipine, cilnidipine, tracazolate hydrochloride and FPL 64176. (B) Enlargement of the dihydropyridine cluster (cluster 1 in Figures 4G and 5B), highlighting cilnidipine and nifedipine. Compounds that rescued mbp expression are shown as larger nodes, whereas compounds that did not rescue mbp expression are shown as smaller nodes. The relationship of nilvadipine (green circle) to the other compounds in this cluster is also illustrated. (C) (i–vii) Lateral images of the inner ear at 4 dpf stained for vcanb by ISH. (i) Wild-type, (ii) adgrg6tb233c mutant treated with DMSO as a control, (iii–vii) treatment of adgrg6tb233c mutants with test compounds at 25 µM, with the exception of nilvadipine, which was tested at 22.5 µM. (viii–xiv) mbp mRNA expression of embryos treated as indicated above. Black arrowheads indicate mbp expression around the PLLg; white arrowhead in (ix) indicates the position of the PLLg in the untreated mutant, lacking mbp expression. Nifedipine, cilnidipine, tracazolate hydrochloride and nilvadipine all rescued mbp expression around the PLLg, whereas FPL 64176 did not rescue mbp expression around the PLLg so efficiently. (xv–xix) Representation of the chemical structures of the five compounds tested. Scale bar in (i), 50 µm (applies to i-vii); scale bar in viii, 50 µm (applies to viii–xiv).
Figure 7 with 3 supplements
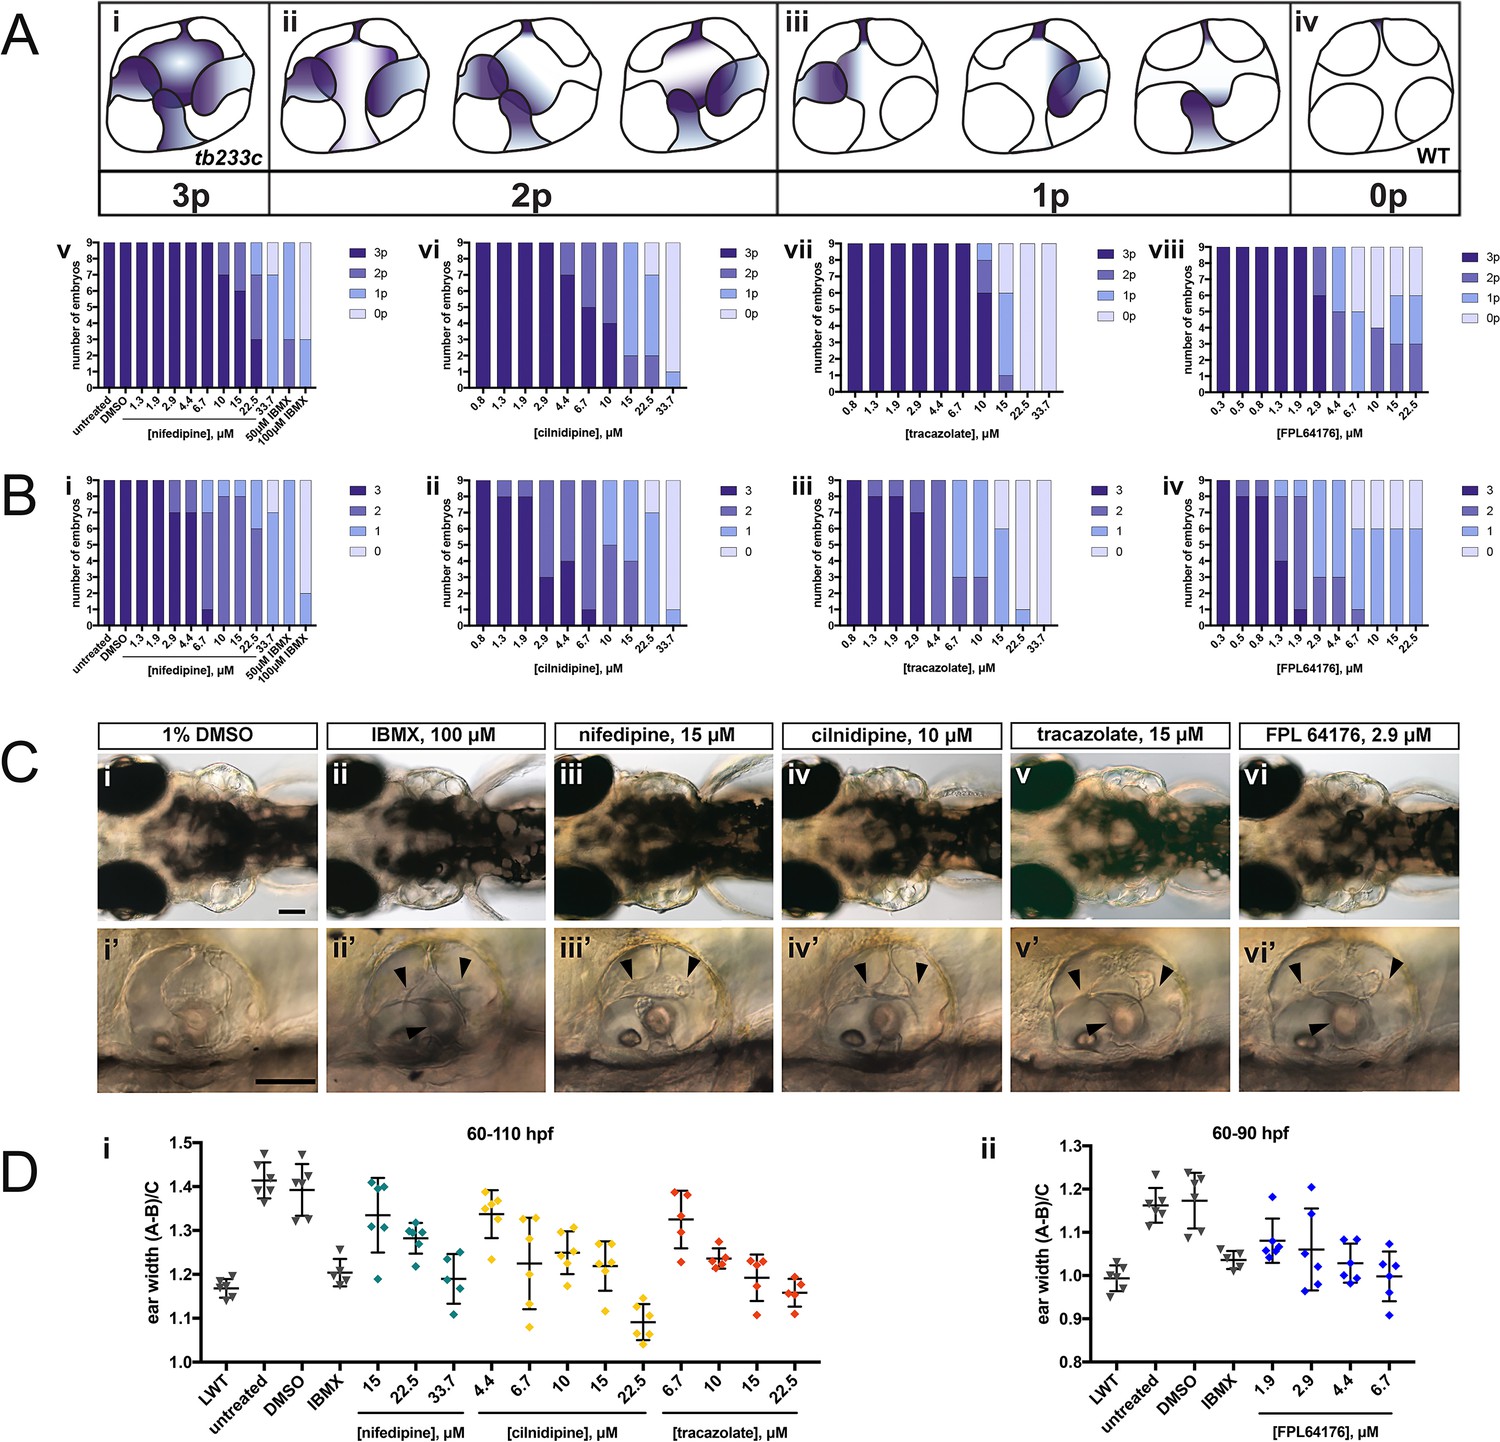
Selected hit compounds rescue the adgrg6tb233c mutant ear phenotype in a dose-dependent manner.
adgrg6tb233c homozygous embryos were exposed to a 1.5-fold dilution series of concentrations (ranging from 0.3 μM to 33.7 μM), tailored to the toxicity of nifedipine, cilnidipine, tracazolate hydrochloride and FPL 64176. IBMX (50 μM and/or 100 μM) was used as a positive control; DMSO (1%) was used as a negative control. Embryos were treated between 60–110 hpf prior to fixation and analysis for vcanb expression by whole-mount in situ hybridisation. Embryos were scored in accordance with two scoring systems, in order to assess the localisation (A) and the intensity (B) of vcanb ISH staining. (A) (i–iv) Scoring system used to assess the number of projections (p) with vcanb ISH staining. (v–viii) Charts showing the number of embryos that scored 0 p, 1 p, 2 p, or 3 p. (B) (i–iv) Charts showing the number of embryos that scored 0, 1, 2, or 3, according to the scoring system shown in Figure 3A. (C) (i–vi) Live DIC images of 110 hpf (or 90 hpf for FPL 64176-treated embryos) adgrg6tb233c mutants treated with the compounds shown above. Dorsal views with anterior to the left. (i’–vi’) Lateral views of the inner ear of the embryos depicted in i–vi, showing rescue of pillar fusion (arrowheads) following treatment. (D) Measurements of the ear-to-ear width were taken from live embryos mounted dorsally and photographed at a focal plane that highlighted the largest visible dimensions (see Figure 7—figure supplement 2). Error bars represent the mean ± standard deviation. Combined data from two experimental repeats. Scale bars: 50 μm.
-
Figure 7—source data 1
Source data for the dose-response experiments shown in Figure 7D.
- https://doi.org/10.7554/eLife.44889.023
Figure 7—figure supplement 1
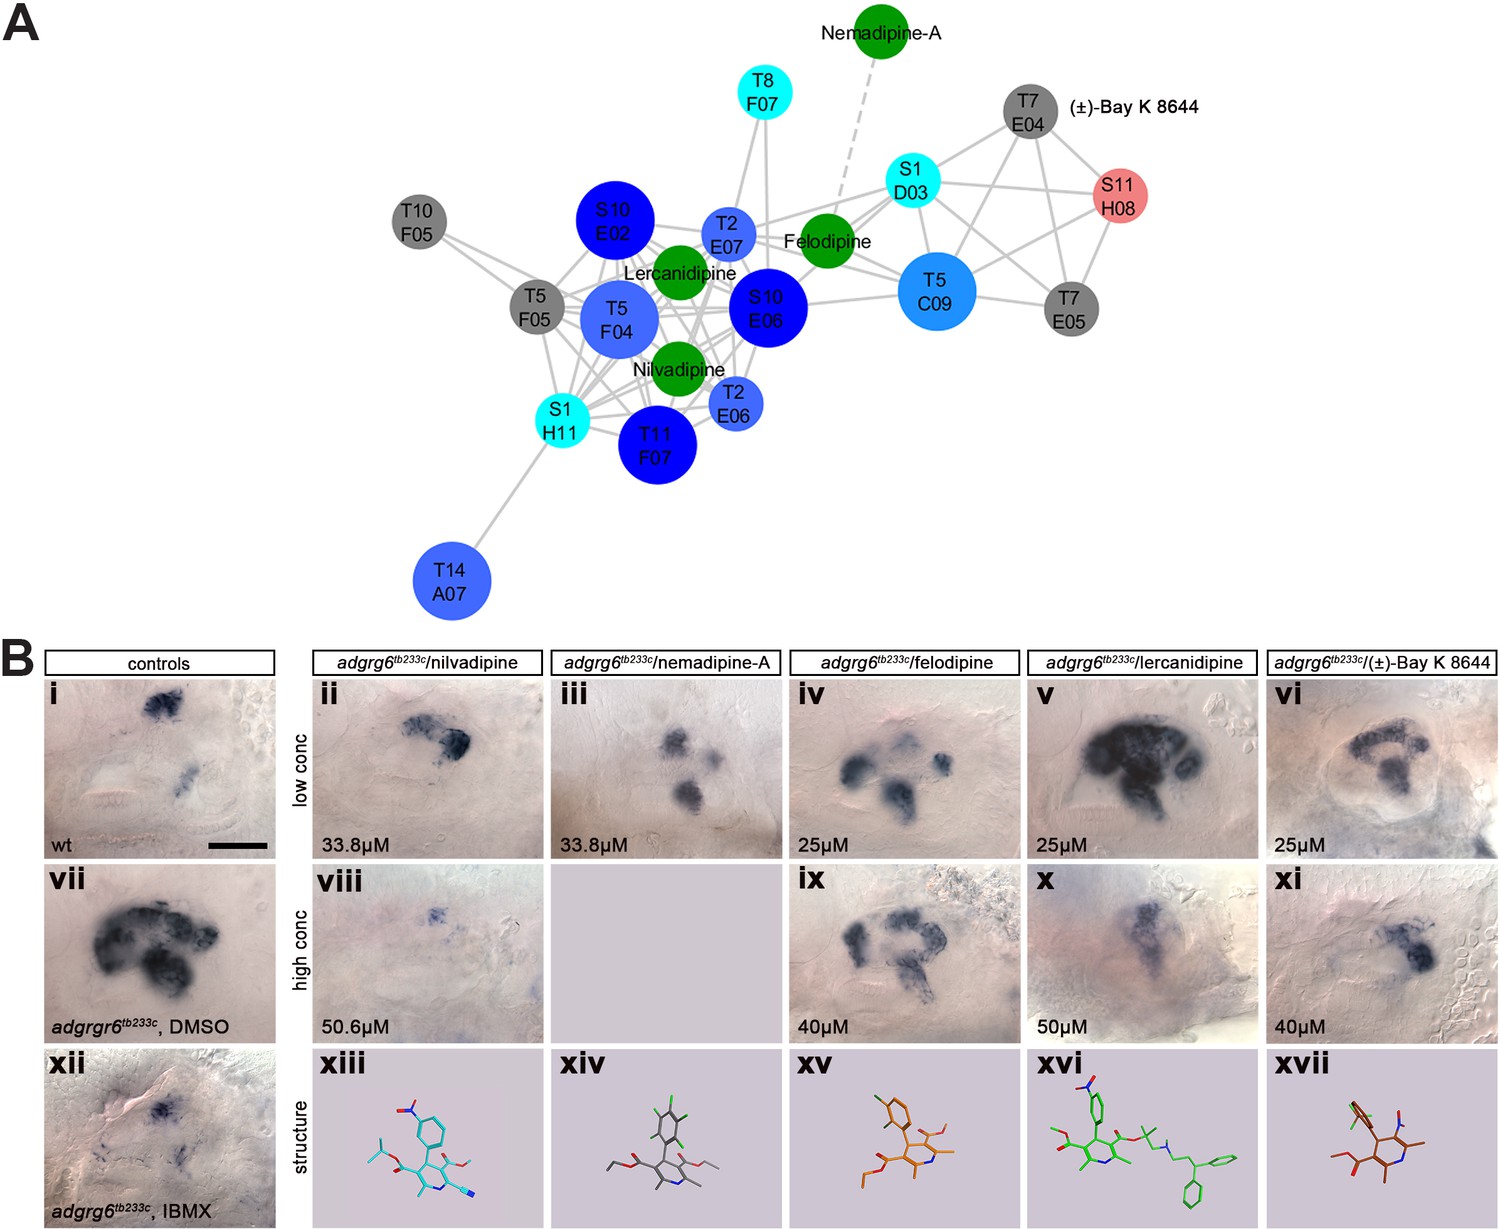
Additional dihydropyridines are able to downregulate otic vcanb expression in adgrg6tb233c mutant embryos.
(A) Adapted dihydropyridine cluster including compounds not represented in the Tocris or Spectrum collections. The new compounds tested are shown as green circles. Nemadipine-A falls just below the threshold of the network analysis performed, illustrated by the dotted line connecting to its closest related compound. (B) Dose-responsive activity of the dihydropyridines in the vcanb assay. (i-xii) Lateral views of the inner ear at four dpf stained for vcanb by ISH; anterior to the left. Controls: (i) wild-type, untreated; (vii) adgrg6tb233c mutant treated with DMSO as a negative control; (xii) adgrg6tb233c mutant treated with 100 µM IBMX as a positive control. (ii-vi) Treatment of adgrg6tb233c mutants with test compounds at a low concentration (25–33.8 µM), (viii-xi) treatment of adgrg6tb233c mutants with test compounds at a high concentration (40–50.6 µM), (xiii-xvii) Representation of the chemical structure of the five compounds tested. Scale bar in (i), 50 µm (applies to i-xii).
Figure 7—figure supplement 2
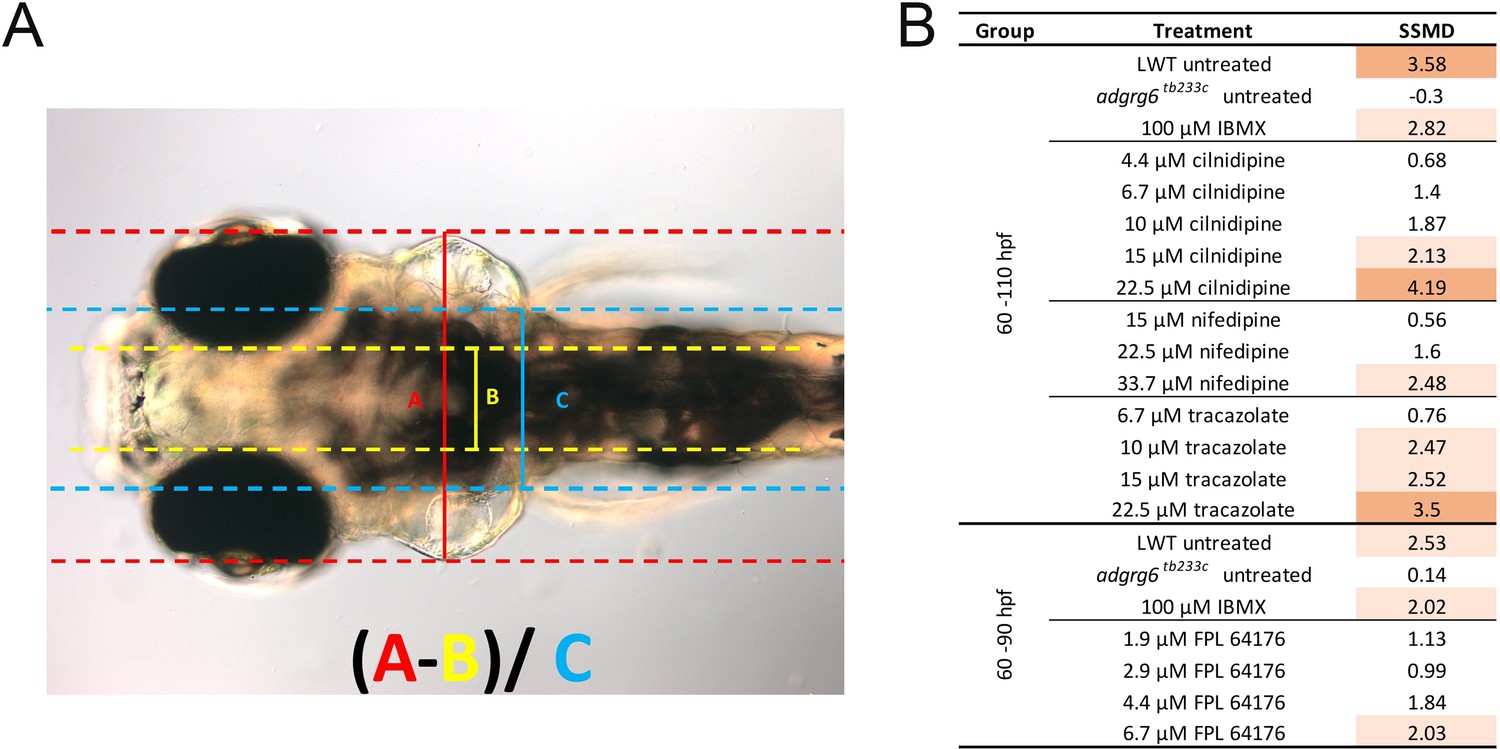
Normalisation of ear width with respect to size of the head.
(A) Live DIC image of an adgrg6tb233c mutant embryo at 110 hpf, mounted dorsally with anterior to the left, showing the parameters A, B and C (as defined in the figure) used to calculate the normalised ear width. This value was used to assess how the ear swelling is affected after treatment with different compounds. (B) Table showing the strictly standardised mean difference (SSMD) values for each treatment group in respect to the vehicle control (adgrg6tb233c, 1% DMSO), as a means of assessing the size of compound effect at different concentrations. SSMD scores > 2 indicate a strong effect (pale orange); SSMD scores > 3 indicate a very strong effect (dark orange).
-
Figure 7—figure supplement 2—source data 1
Source data for the SSMD calculations shown in Figure 7—figure supplement 2B.
- https://doi.org/10.7554/eLife.44889.024
Figure 7—figure supplement 3
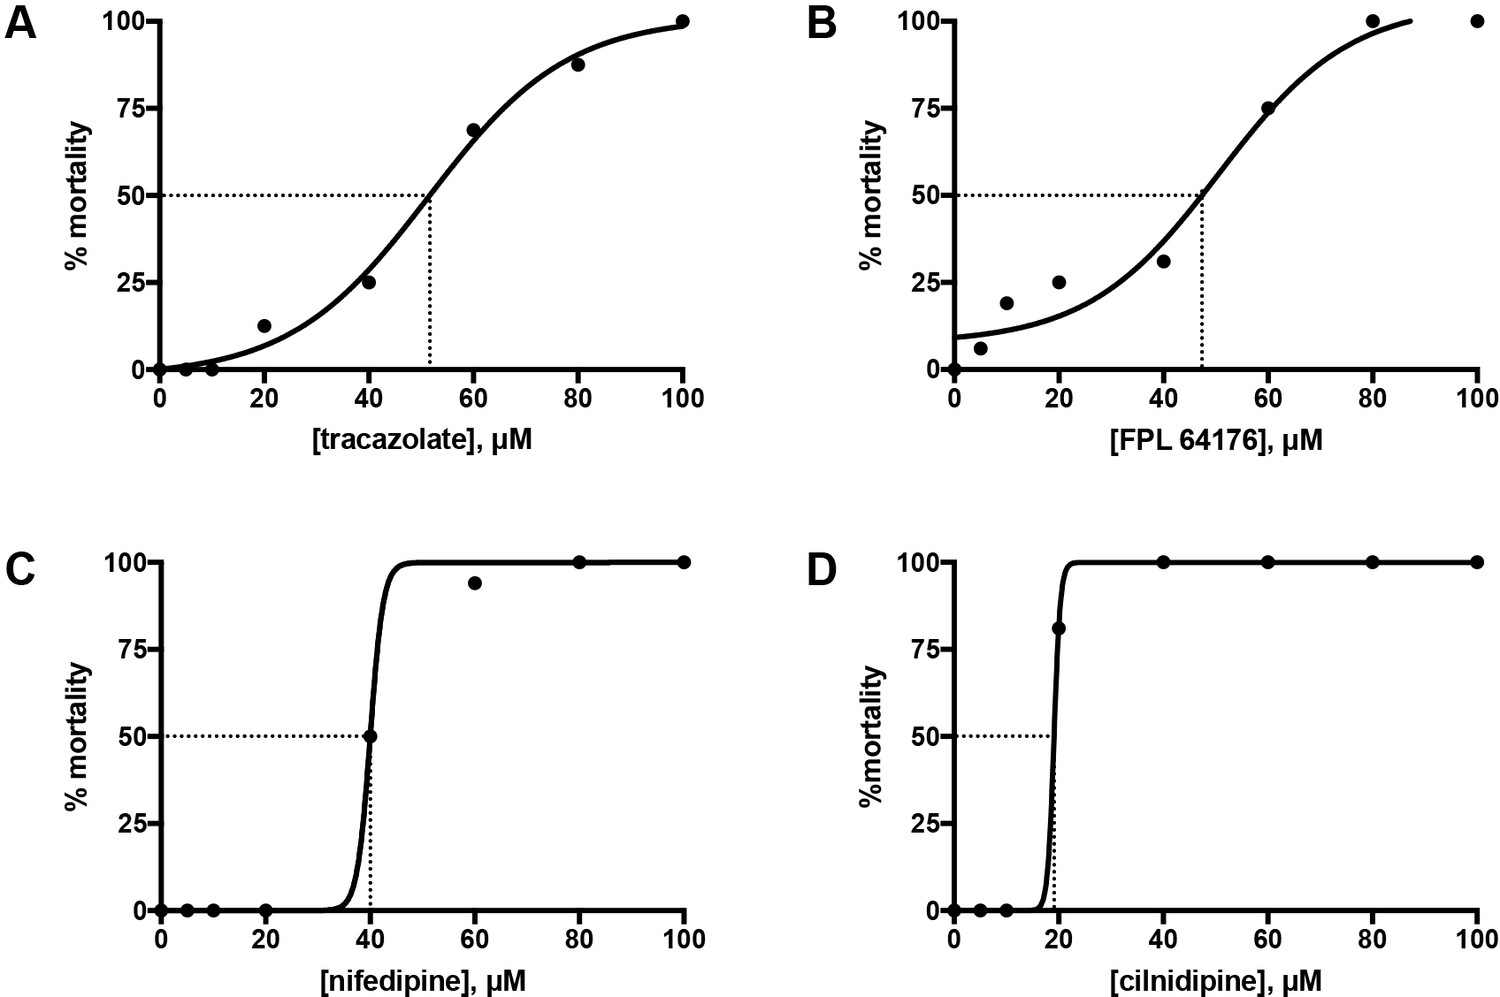
LD50 curves from the treatment of wild-type embryos from 60 to 110 hpf.
Sixteen LWT wild-type embryos, each kept in a separate well of a 96-well plate, were treated with each of the following concentrations: 5, 10, 20, 40, 60, 80 and 100 μM, from 60 to 110 hpf. At the end of the treatment, the number of alive versus dead embryos was counted and the mortality percentage was plotted against concentration. PRISM LD50, a nonlinear fit algorithm, was used to fit the curves for tracazolate hydrochloride (A), FPL 64176 (B), nifedipine (C) and cilnidipine (D). The LD50 was calculated as the concentration at which 50% of the embryos were dead.
-
Figure 7—figure supplement 3—source data 2
Source data for the mortality counts shown in Figure 7—figure supplement 3.
- https://doi.org/10.7554/eLife.44889.025
Figure 8
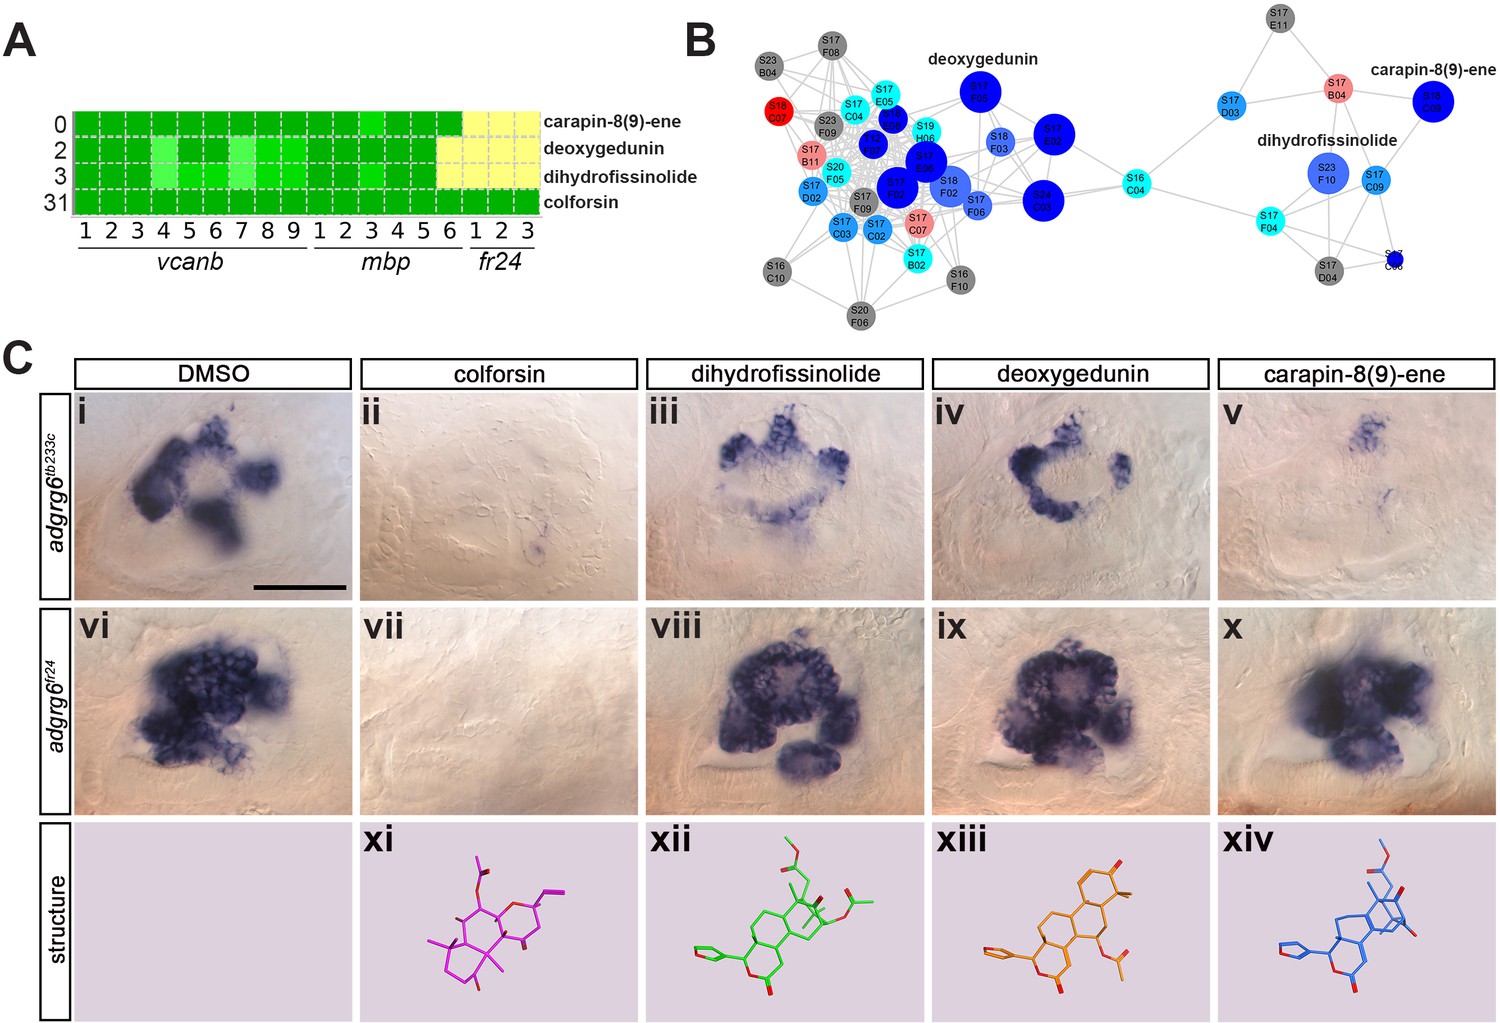
Assay for rescue of the fr24 strong allele distinguishes compounds likely to rescue downstream, or at the level of, the Adgrg6 receptor.
(A) Section of the heatmap in Figure 5A showing the results for colforsin, dihydrofissinolide, deoxygedunin and carapin-8(9)-ene. (B) Enlargement of the cluster containing gedunin-related compounds (cluster two in Figures 4G and 5B), highlighting deoxygedunin, dihydrofissinolide and carapin-8(9)-ene. Compounds that rescued mbp expression are shown as larger nodes; compounds that did not rescue mbp expression are shown as smaller nodes. (C) (i–x) The inner ear at 4 dpf stained for vcanb. Lateral views; anterior to the left. Scale bar (applies to panels i–x): 50 µm. (i) adgrg6tb233c/DMSO mutant control. (ii – v) Treatment of adgrg6tb233c mutants with the compounds at 25 µM indicated was able to rescue the tb233c mutant ear phenotype to variable degrees. (vi) adgrg6fr24/DMSO mutant control. (vii–x) Treatment of adgrg6fr24 mutants with colforsin rescued otic vcanb expression in the fr24 allele, whereas treatment with dihydrofissinolide, deoxygedunin and carapin-8(9)-ene was unable to rescue the fr24 ear phenotype. (xi–xiv) Representation of the chemical structure of the four compounds tested. Note the structural similarity between deoxygedunin, dihydrofissinolide and carapin-8(9)-ene.
Videos
Video 1
Light-sheet microscope time-lapse video of the ear shown in Figure 1Ci-iii.
Dorsal view (anterior to top) of the left inner ear of a phenotypically wild-type sibling embryo showing the anterior, lateral and posterior projections (the anterior projection is partially out of view). In the video, the posterior projection grows and meets the posterior bulge from the lateral projection. The projection and bulge meet, fuse and resolve to form a pillar over 900 min (approximately 55 hpf–70 hpf). The video shows a Maximum Intensity Projection of selected z-slices spanning approximately 6 µm, captured every 10 min, and played back at 10 frames per second. Selected stills from the video, flipped horizontally to match the panels showing the mutant ear, are shown in Figure 1C.
Video 2
Light-sheet microscope time-lapse video of the ear shown in Figure 1Civ-vi.
Dorsal view of the right inner ear of an adgrg6fr24 mutant embryo showing anterior, lateral and posterior projections (the posterior projection is partially out of view). In the video, the anterior projection and anterior bulge from the lateral projection touch, but continue to grow past one another. The unfused projections roll around each other over 900 min (approximately 60 hpf–75 hpf). The video shows a Maximum Intensity Projection of selected z-slices spanning approximately 20 µm, captured every 5 min, and played back at 20 frames per second. Selected stills from the video are shown in Figure 1C.
Tables
Table 1
List of the 41 hit compounds that rescued the expression of both vcanb and mbp in adgrg6tb233c mutants, thus representing putative Adgrg6 pathway modulators.
The table includes the plate and well ID, along with known activities and the average score from nine adgrg6tb233c embryos in the vcanb assay, from six adgrg6tb233c embryos in the mbp assay and from three adgrg6fr24 embryos in the fr24 assay. Grey shading indicates compounds presumed to interact with Adgrg6 receptor directly; yellow shading indicates compounds presumed to be downstream effectors of the pathway. Abbreviations: DE, dead embryos; ND, no data; S, Spectrum; T, Tocris. *Note that cilnidipine can rescue fr24 at 40 µM (data not shown). See also Table 1—source data 1.
| # | Plate | Well | Compound name | Known activity | vcanb score | mbp score | fr24 score |
|---|---|---|---|---|---|---|---|
| 1 | S18 | C09 | CARAPIN-8(9)-ENE | undetermined | 0.00 | 8.50 | 9.00 |
| 2 | S25 | D08 | 3-ISOBUTYL-1-METHYLXANTHINE (IBMX) | phosphodiesterase inhibitor, non-selective adenosine receptor antagonist | 2.00 | 8.50 | 9.00 |
| 3 | S17 | F05 | DEOXYGEDUNIN | neuroprotective | 2.00 | 8.00 | 9.00 |
| 4 | S23 | F10 | DIHYDROFISSINOLIDE | undetermined | 2.67 | 7.50 | 9.00 |
| 5 | S04 | B02 | IVERMECTIN | antiparasitic | 2.33 | 7.00 | 9.00 |
| 6 | T01 | F06 | SC-10 | protein kinase C activator, NMDA receptor activator | 5.67 | 6.50 | 9.00 |
| 7 | T01 | H11 | 1,3-Dipropyl-8-phenylxanthine | Selective adenosine A1 receptor antagonist | 3.33 | 6.50 | 9.00 |
| 8 | S17 | E02 | 3-DEOXO-3beta-ACETOXYDEOXYDIHYDROGEDUNIN | undetermined | 0.00 | 6.50 | 9.00 |
| 9 | T11 | F07 | Cilnidipine* | dihydropyridine N- and L-type Ca2+ channel blocker | 2.00 | 6.50 | 9.00 |
| 10 | S13 | F03 | AMIODARONE HYDROCHLORIDE | coronary vasodilator, Ca2+ channel blocker | 5.00 | 6.50 | 9.00 |
| 11 | S06 | E02 | HYDROCORTISONE HEMISUCCINATE | glucocorticoid | 3.67 | 6.00 | 9.00 |
| 12 | T01 | C04 | (RS)-(Tetrazol-5-yl)glycine | highly potent NMDA receptor agonist | 3.00 | 5.00 | 9.00 |
| 13 | S02 | E05 | LOMEFLOXACIN HYDROCHLORIDE | antibacterial | 5.33 | 5.00 | 9.00 |
| 14 | S13 | E04 | ETHAMIVAN | CNS & respiratory stimulant | 4.67 | 5.00 | 9.00 |
| 15 | T08 | B04 | CGS 15943 | potent adenosine receptor antagonist | 5.33 | 4.50 | 9.00 |
| 16 | S13 | E09 | ASTEMIZOLE | H1 antihistamine (nonsedating) | 4.67 | 4.50 | 9.00 |
| 17 | T02 | A09 | SKF 91488 dihydrochloride | histamine N-methyltransferase inhibitor | 3.00 | 4.00 | 9.00 |
| 18 | S25 | F05 | 11alpha-HYDROXYPROGESTERONE HEMISUCCINATE | glucocorticoid | 2.67 | 4.00 | 9.00 |
| 19 | T14 | A07 | Efonidipine hydrochloride monoethanolate | dihydropyridine L-type and T-type Ca2+ channel blocker | 3.67 | 4.00 | 9.00 |
| 20 | T05 | C09 | Nifedipine | dihydropyridine L-type Ca2+ channel blocker | 4.33 | 7.00 | 8.00 |
| 21 | T05 | E08 | CGP 37157 | antagonist of mitochondrial Na+/Ca2+ exchange | 3.67 | 6.50 | 8.00 |
| 22 | S05 | D03 | DANAZOL | anterior pituitary suppressant, anti-estrogenic | 1.00 | 5.00 | 8.00 |
| 23 | S18 | H09 | XANTHYLETIN | undetermined | 1.00 | 4.50 | 8.00 |
| 24 | S18 | A06 | FERULIC ACID | antineoplastic, choleretic, food preservative | 3.67 | 4.00 | 8.00 |
| 25 | S18 | F02 | alpha-DIHYDROGEDUNOL | undetermined | 2.33 | 4.00 | 8.00 |
| 26 | T05 | F04 | (S)-(+)-Niguldipine hydrochloride | dihydropyridine L-type Ca2+ channel blocker, α1 antagonist | 3.67 | 5.00 | 7.00 |
| 27 | T07 | F02 | Tracazolate hydrochloride | subtype-selective GABAAallosteric modulator | 2.33 | 4.50 | 7.00 |
| 28 | S10 | E02 | NIMODIPINE | dihydropyridine L-type Ca2+ channel blocker | 0.33 | 7.00 | 6.00 |
| 29 | S17 | E06 | 3beta-ACETOXYDEOXODIHYDROGEDUNIN | undetermined | 2.00 | 4.50 | 5.00 |
| 30 | S17 | F02 | DIHYDROGEDUNIN | undetermined | 1.67 | 5.00 | 2.00 |
| 31 | S22 | F09 | TANGERITIN | undetermined | 1.33 | 5.50 | 1.00 |
| 32 | S10 | F07 | COLFORSIN | adenylate cyclase activator, antiglaucoma, hypotensive, vasodilator | 0.00 | 9.00 | 0.00 |
| 33 | T04 | G02 | Imiloxan hydrochloride | selective α2B-adrenoceptor antagonist | 0.67 | 9.00 | ND |
| 34 | S24 | C03 | 3alpha-ACETOXYDIHYDRODEOXYGEDUNIN | undetermined | 0.33 | 8.50 | DE |
| 35 | S11 | E02 | EZETIMIBE | antihyperlipidemic (sterol absorption inhibitor) | 2.00 | 7.50 | 0.00 |
| 36 | S10 | E06 | NITRENDIPINE | dihydropyridine L-type Ca2+ channel blocker | 1.33 | 7.00 | ND |
| 37 | S11 | E08 | ROSUVASTATIN CALCIUM | antihyperlipidemic | 0.00 | 6.00 | 0.00 |
| 38 | S22 | C07 | DEMETHYLNOBILETIN | undetermined | 0.00 | 6.00 | 0.00 |
| 39 | S22 | G11 | HEXAMETHYLQUERCETAGETIN | undetermined | 0.00 | 5.50 | DE |
| 40 | S22 | F08 | NOBILETIN | matrix metaloproteinase inhibitor, antineoplastic, anti-ERK, NF-κB suppressor | 0.00 | 5.00 | DE |
| 41 | S12 | H07 | PREGNENOLONE SUCCINATE | glucocortcoid, antiinflammatory | 4.67 | 4.00 | DE |
-
Table 1—source data 1
Source data for Table 1.
- https://doi.org/10.7554/eLife.44889.017
Additional files
-
Supplementary file 1
List of the 89 hit compounds that rescued the expression of vcanb in adgrg6tb233c mutants and were followed up by mbp counter screens.
The table includes the plate and well position of each compound, along with known activities and the raw data scores from nine adgrg6tb233c embryos in the vcanb assay (v1–v9), from six adgrg6tb233c embryos in the mbp assay (m1–m6) and from three adgrg6fr24 embryos in the fr24 (fr1–3) assay. Abbreviations: DE, dead embryo; ND, no data; S, Spectrum; T, Tocris. *Deoxygedunin: (Jang et al., 2010); Nobiletin: (Cheng et al., 2016); Angolensin (R): (Weisman et al., 2006); Sinensetin: (Kang et al., 2015); Larixol acetate: (Urban et al., 2016); Gedunin: (Hieronymus et al., 2006; Subramani et al., 2017).
- https://doi.org/10.7554/eLife.44889.027
-
Transparent reporting form
- https://doi.org/10.7554/eLife.44889.028
Download links
A two-part list of links to download the article, or parts of the article, in various formats.
Downloads (link to download the article as PDF)
Open citations (links to open the citations from this article in various online reference manager services)
Cite this article (links to download the citations from this article in formats compatible with various reference manager tools)
Identification of compounds that rescue otic and myelination defects in the zebrafish adgrg6 (gpr126) mutant
eLife 8:e44889.
https://doi.org/10.7554/eLife.44889


