Coordination of rapid cholinergic and dopaminergic signaling in striatum during spontaneous movement
- Northwestern University, United States
Figures
Figure 1 with 1 supplement

Cholinergic interneuron populations are rapidly activated at spontaneous movement onsets.
(A) Schematic of experimental setup. Acute fiber photometry recordings from GCaMP6f expressing ChIs in dorsal striatum (bottom) in head fixed mice moving spontaneously on 1D treadmill in darkness (top). (B) Representative population fluorescence changes (DF/F, green) from ChIs during spontaneous treadmill movement (velocity, black). (C) Mean transient DF/F for each recording (n = 62 sessions, 19 mice) during rest or movement periods. (D) Mean DF/F during all rest, onset, and continuous locomotion periods for the sessions in (C). (E) Mean DF/F (top) and velocity (bottom) aligned on the onset of all clean movement onsets from rest (see Materials and methods, n = 992 onsets, 16 mice). Shaded region DF/F greater than mean of all rest periods, p<0.01 Wilcoxon Rank-Sum test. (F) All peak normalized traces (top) and velocites (bottom) aligned on movement onsets and sorted by peak responses. (G) Zoomed DF/F (green) and velocity (black) for the locomotion initiation period indicated in (B). (H) Zoomed jerk period indicated in (B). (I) Zoomed termination period indicated in (B). (J) Zoomed behavior reset indicated in (B). (K) Mean DF/F (top) and velocity (bottom) aligned on the onset of all clean locomotion initiations from rest (n = 83 onsets, nine mice). (L) Mean DF/F (top) and velocity (bottom) aligned on the onset of all clean jerks from rest (n = 543 jerks, 18 mice). (M) Mean DF/F (top) and velocity (bottom) aligned on the onset of all locomotion terminations (n = 251 terminations, 19 mice). (N) Mean DF/F (top) and velocity and acceleration (bottom) aligned on the onset of all positively-going transients during motion (n = 4192 transients, 19 mice). **p<1×10⁻⁶ Wilcoxon Rank Sum Test. Shaded regions represent ±SEM.
Figure 1—figure supplement 1

Fiber photometry recording sites, histology, and additional properties of movement related ChI signaling.
(A) Coronal (top) and sagittal (bottom) schematics showing the range of recording locations (shaded boxes) in dorsal and ventral striatum. All photometry recording sites were performed within these regions. (B) Representative coronal section from CHAT-cre mouse with cre dependent GCaMP6f expression (green) and immunohistochemical labelling for choline acetyltransferase (purple). The yellow lines indicate the path of the optical fiber for photometry recordings. (C) Zoom-in of the regions indicated by the dashed white boxes in B showing restriction of GCaMP6f expression (green) to ChAT positive cholinergic interneurons (purple). (D) Summary of the percent of GCaMP6f expressing neurons with confirmed co-expression of ChAT from three mice (n = 100, 69, and 50 cells in each respective mouse in dorsal striatum and n = 68, 33, and 46 neurons in ventral striatum). (E) Mean DF/F (top) and velocity (bottom) aligned on the onset of all micro-movement onsets falling below the threshold for movement onsets in Figure 1. (n = 795 onsets, 19 mice). (F) Mean DF/F (top), velocity (mid) and acceleration (bottom) aligned on the zero crossing of accelerations occurring below the 25th percentile of velocities (‘reset’, black) and above the 75th percentile (‘continuous’, grey). (G) Mean DF/F aligned on the onset of all clean movement onsets from rest in mice that had never received rewards on the treadmill (compare with Figure 1C; n = 614 onsets, nine mice). (H) Mean transient DF/F for each recording during rest or movement periods (n = 35 sessions, nine mice) in mice that never received rewards on the treadmill. **p<1×10–15 Wilcoxon Rank Sum Test. Shaded regions represent ±SEM.
Figure 2 with 1 supplement
Movement and reward related signals in ChI populations differ across the dorsal-ventral axis of the striatum.
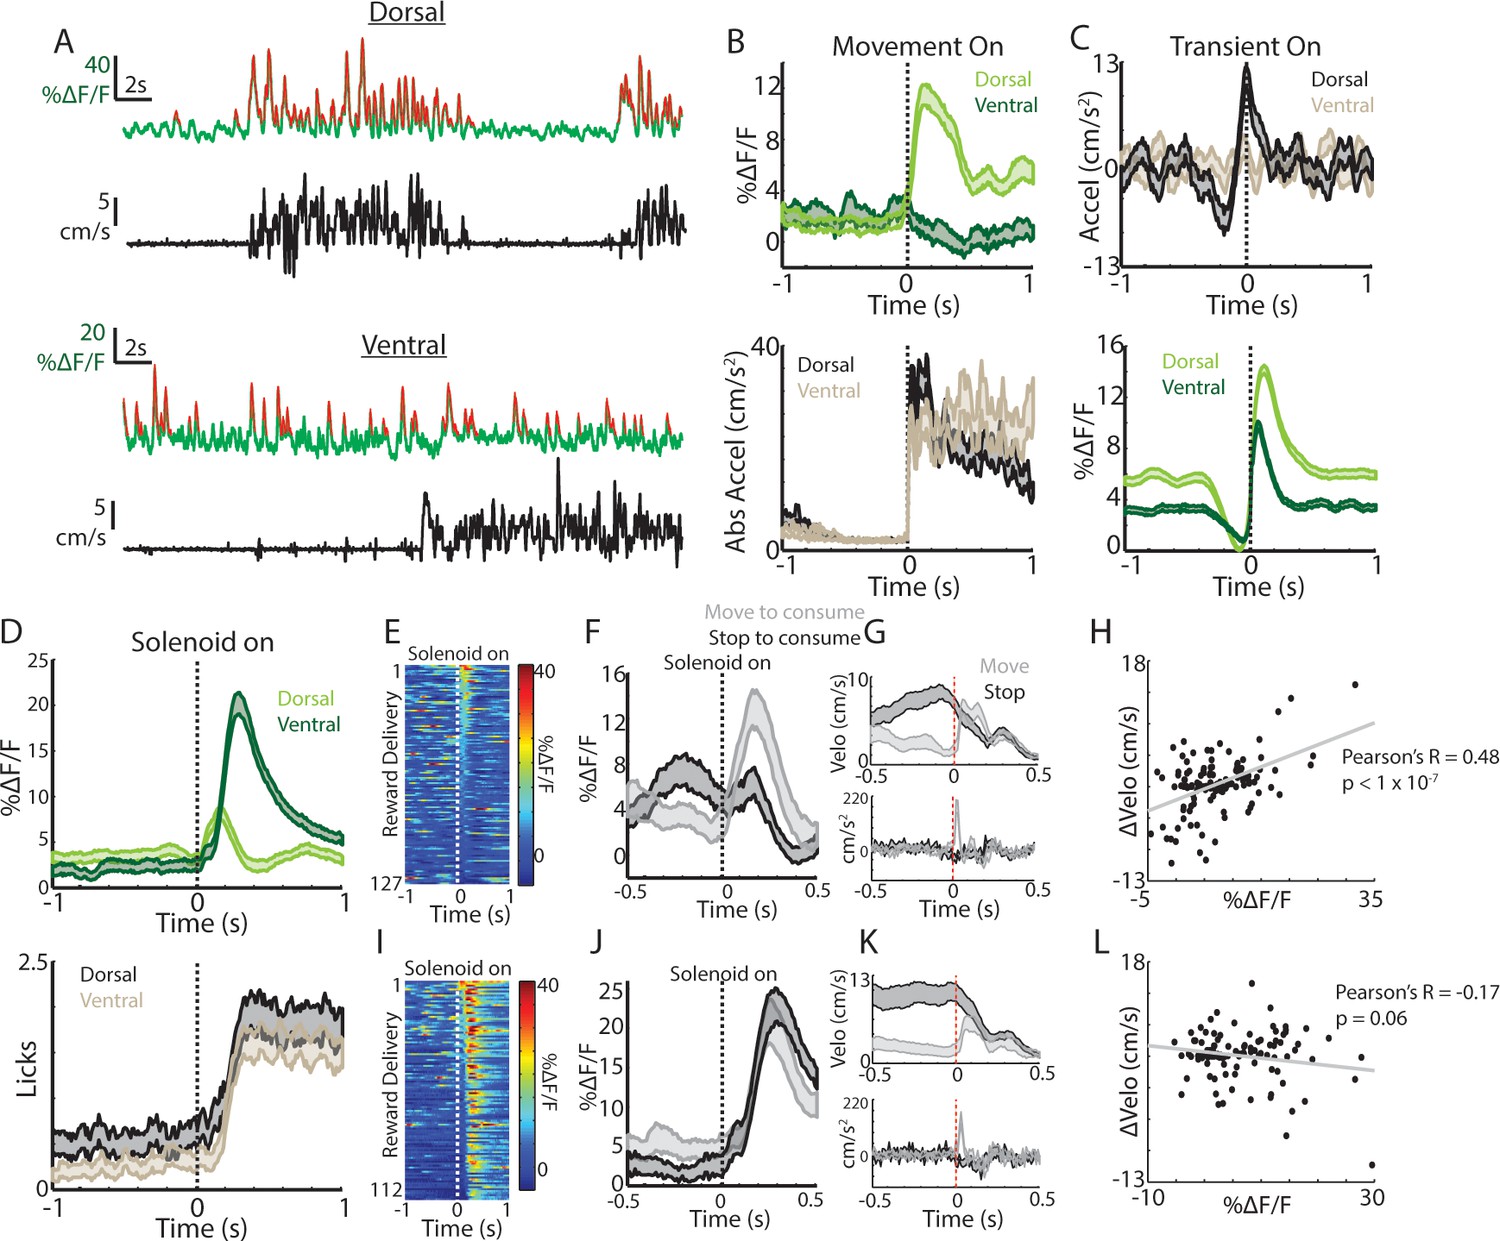
(A) Representative population fluorescence changes (DF/F, green) and velocity (black) from dorsal (top) and ventral (bottom) striatum ChIs during spontaneous movement. Red indicates identified significant positive-going transients. (B) Mean population DF/F (top) and acceleration (bottom) aligned on movement initiations from rest across all dorsal (n = 118 onsets, three mice) and ventral (n = 66 onsets, three mice) ChI recordings without reward deliveries. (C) Mean acceleration (top) and transient population DF/F (bottom) aligned on onsets of significant positive-going transients across dorsal (n = 1215 transients) and ventral (n = 851) ChI recordings without reward. (D) Mean DF/F and spout licking aligned on the unpredicted triggering of the solenoid reward valve for dorsal (n = 127 rewards, 10 mice) and ventral (n = 112 rewards, eight mice) ChI population recordings. (E) DF/F for all unpredicted reward deliveries aligned on solenoid valve trigger for dorsal ChI recordings sorted by peak response. (F) Mean dorsal ChI DF/F for reward deliveries where the mouse stopped to consume the reward from locomotion (bottom quartile of velocity changes at reward delivery, n = 32) or accelerated from a resting state (top quartile, n = 32). (G) Mean velocity (top) and acceleration (bottom) for the deliveries plotted in F. (H) Change in velocity vs the mean dorsal ChI DF/F for each reward delivery. (I) Same as E for ventral ChI recordings. (J) Same as F for ventral ChI recordings (n = 28). (K) Same as G for ventral recordings. (L) Same as H for ventral recordings. Shaded regions represent ±SEM.
Figure 2—figure supplement 1
Dorsal and ventral ChI populations respond differently to unpredicted reward consumption and to conditioned cues.
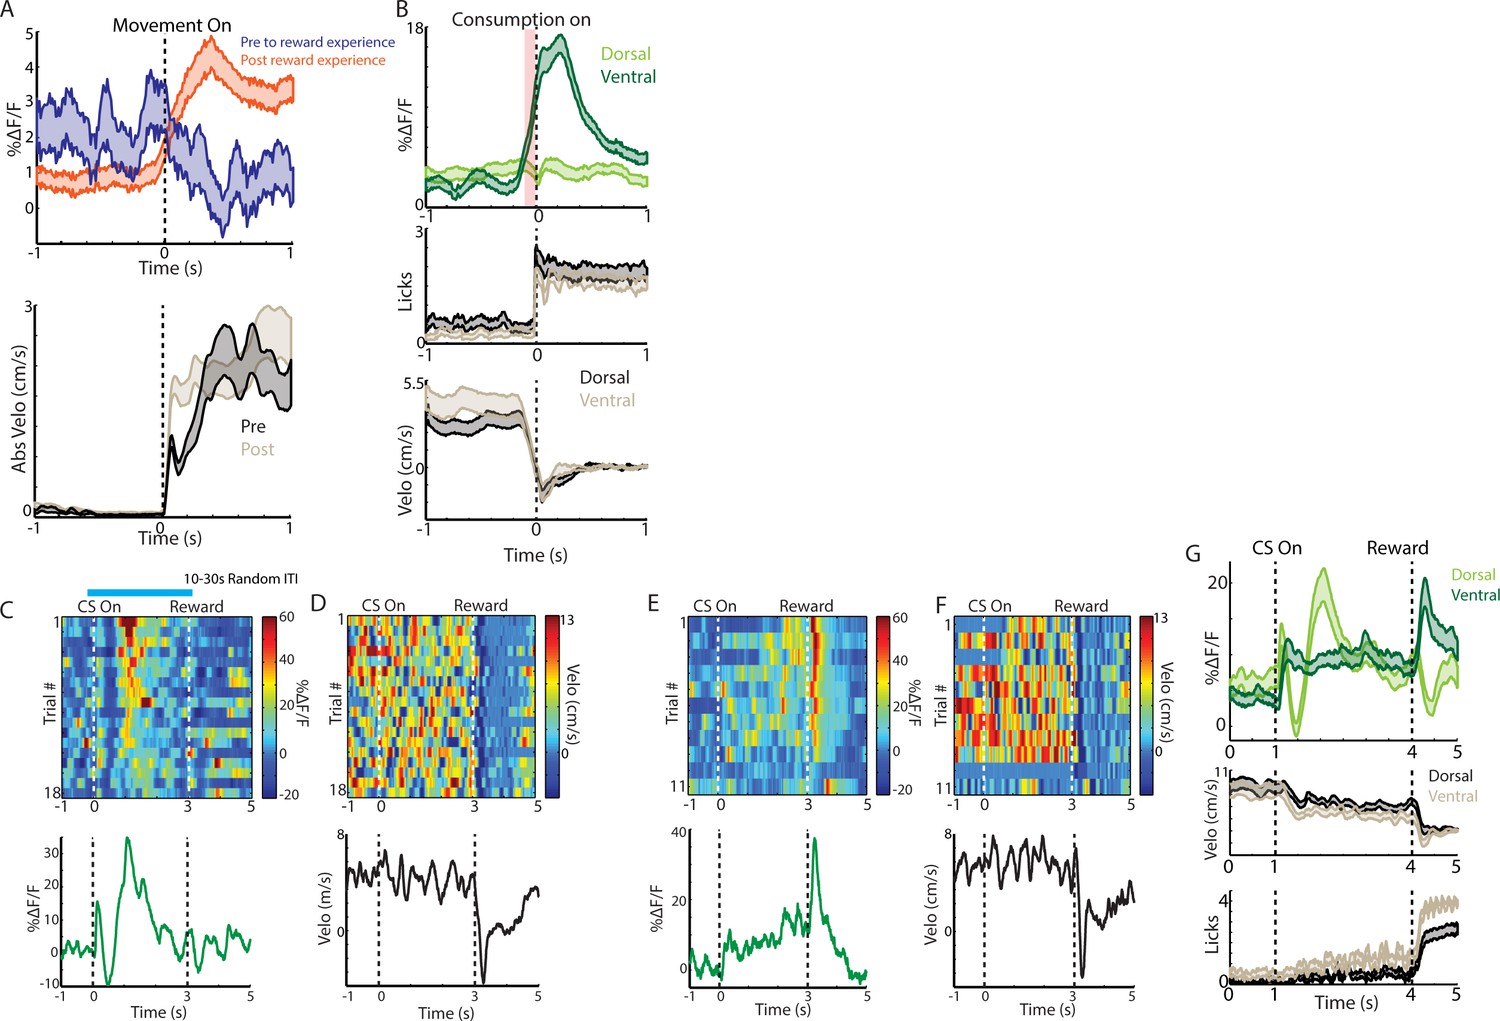
(A) Mean DF/F from ventral striatum ChIs aligned on movement onsets from rest before (n = 78, three mice) and after (n = 253, eight mice) exposure to unpredicted rewards. (B) Mean DF/F (top), spout licking (mid), and velocity (bottom) from dorsal and ventral ChIs aligned on the first spout lick following water reward delivery (same deliveries as Figure 2D). Shaded red region represents the period where the mean ventral striatum DF/F was significantly (p<0.01, Wilcoxon Rank-Sum Test) elevated relative to pre-reward baseline. (C) Dorsal striatum ChI population DF/F for all classical conditioning trials in a single session (top) and the mean DF/F across these trials (bottom). Blue line above plot indicates the time when the CS (blue light) was on. (D) Corresponding velocity traces for all of the trials in C. (E) Ventral striatum ChI population DF/F for all classical conditioning trials in a single session (top) and the mean DF/F across these trials (bottom) from the same mouse as C. (F) Corresponding velocity traces for all of the trials in E. (G) Mean ChI population DF/F (top), velocity (mid), and spout licking (bottom) across all classical conditioning trials from dorsal (n = 73, four mice) and ventral (n = 71, three mice) recordings. Shaded regions represent ±SEM.
Figure 3 with 1 supplement
Single ChIs signals are rapidly elevated at movement onsets and throughout locomotion.
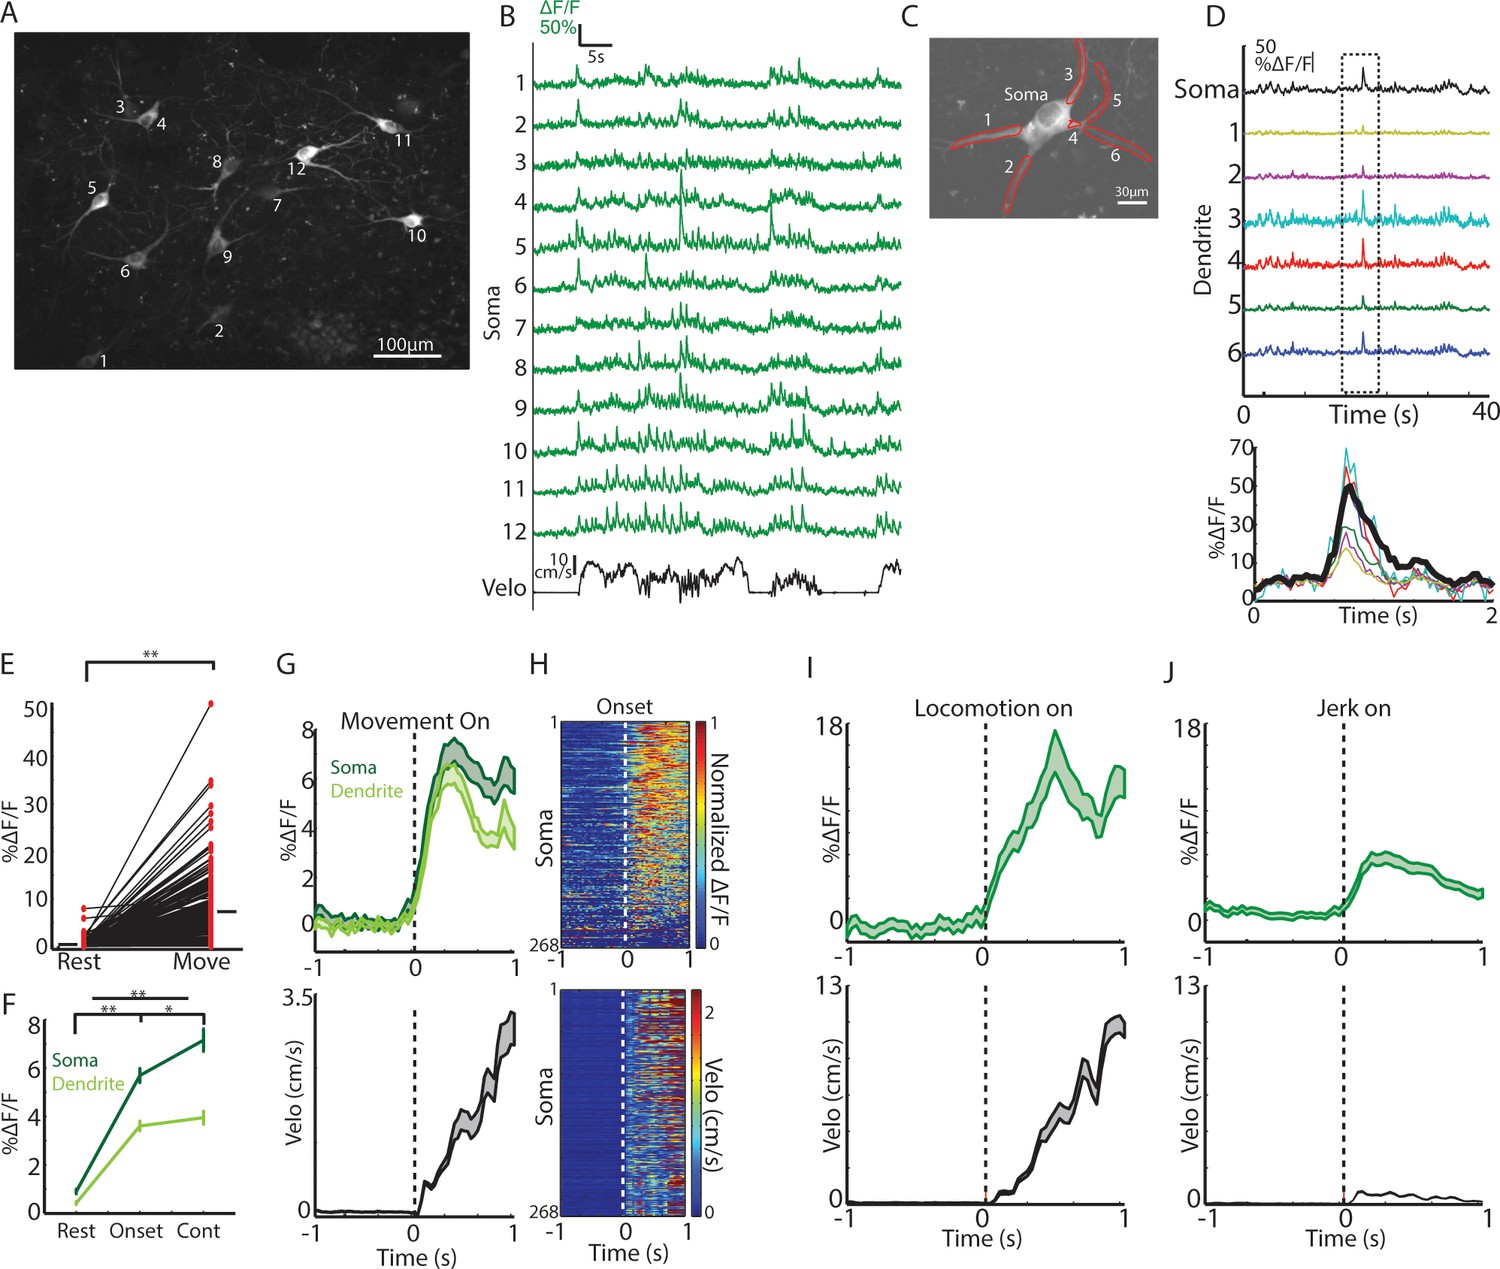
(A) Mean fluorescence projection image from 2-photon imaging of a representative field containing multiple distinct GCaMP6f expressing ChIs. (B) DF/F for each of the ROIs in A during a representative behavior period (velocity, black). (C) Mean fluorescence projection image of a single dorsal striatum ChI. Red ROIs indicate dendritic branches. (D) DF/F from the ROIs in C. Note the presence of synchronized transients across all dendrites (period in dashed box zoomed at bottom). (E) Mean transient DF/F during rest and movement periods for all ChIs somata (n = 268 neurons, six mice). (F) Mean transient DF/F across ChIs somata and dendrites for rest, movement onset, and continuous locomotion periods. (G) Mean DF/F (top) across all ChIs and velocity (bottom) aligned on clean movement onsets from rest. (H) Peak normalized mean DF/F for each ChI soma (top) and velocity (bottom) sorted by peak responses at movement initiation. (I) Mean DF/F (top) across ChI somata (n = 96 cells, six mice) and velocity (bottom) aligned on clean locomotion initiations from rest. (J) Mean DF/F (top) across ChI somata (n = 213 cells, six mice) and velocity (bottom) aligned on clean jerk onsets from rest. *p<0.01, **p<1e-8, Wilcoxon rank sum test. Shaded regions represent ±SEM.
Figure 3—figure supplement 1
Movement related ChI signals are not generated by motion artifact.
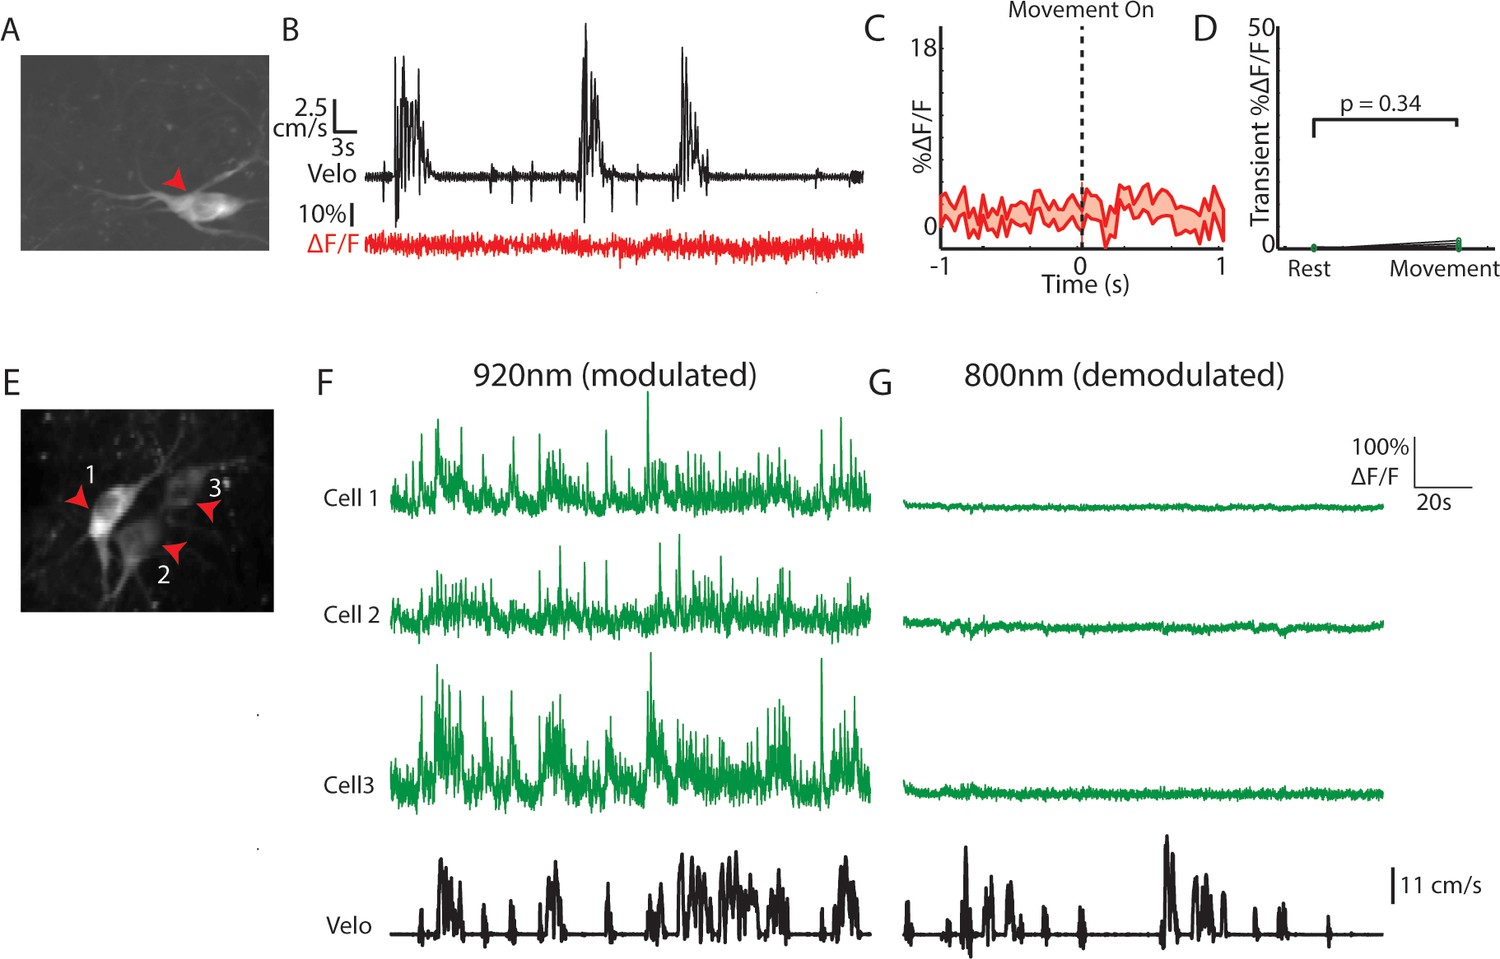
(A) Mean fluorescence projection image of a single dorsal striatum ChI expressing Td-tomato. (B) Velocity (top) and DF/F (bottom) from the td-tomato expressing ChI in A. Note the absence of significant positive-going transients relative to the noise. (C) Mean DF/F across all Td-tomato expressing ChIs (n = 18) aligned on movement onsets from rest. (D) Mean transient DF/F during rest and movement periods for all ChIs expressing Td-tomato (n = 18 neurons, two mice). (E) Mean fluorescence projection image of dorsal striatum ChIs expressing GCaMP6f during 800 nm excitation. (F) DF/F and velocity during a representative period for each of the ChIs indicated in (E) during 920 nm excitation. (G) DF/F and velocity during a representative period during 800 nm excitation for each of the ChIs indicated in E. Note the absence of significant positive-going transients in the absence of calcium sensitivity with 800 nm excitation, despite similar static baseline fluorescence (E). Shaded regions represent ±SEM.
Figure 4 with 1 supplement
Synchrony across ChIs varies with spontaneous movement state.
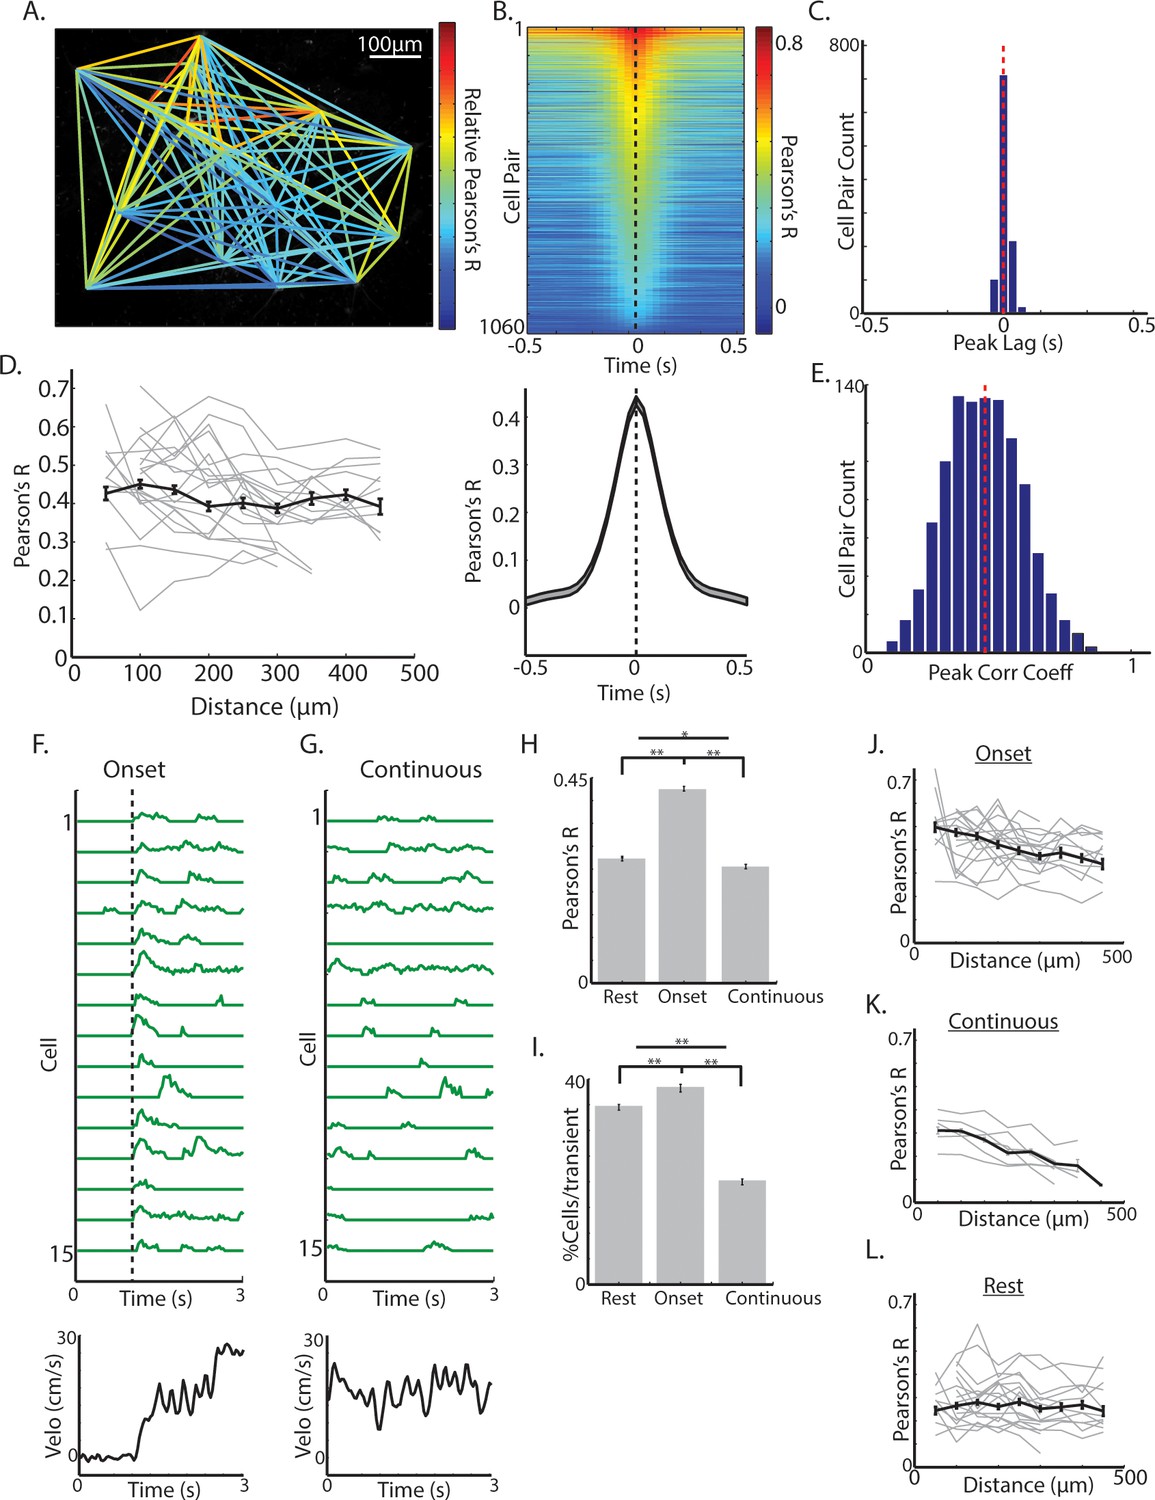
(A) Mean fluorescence projection image from 2-photon imaging with color of lines connecting each cell pair representing relative DF/F correlations of those cells across time. (B) All cell pair cross-correlations sorted by peak correlation (top) and the mean across all cell pairs (n = 1060 pairs, six mice; bottom). (C) Histogram of peak lags across cell-pairs. Red dashed line is the mean lag. (D) Mean correlation vs distance for all periods and all cell pairs (black line) and for cell pairs in individual fields containing >10 pairs (each line is a single field). (E) Histogram of peak correlation coefficients across all cell pairs. Red line is the mean. (F) Transient DF/F from 15 cells aligned on a representative locomotion initiation (velocity, bottom). (G) Same cells as F during a period of continuous locomotion. (H) Mean correlation coefficient for cell pairs at rest (n = 852 pairs), at movement onsets (n = 842 pairs), and during continuous locomotion (n = 524 pairs). (I) Mean percent of cells active for a given transient event during rest (n = 1816 transients), onsets (n = 1158), and continuous locomotion (n = 1059). (J) Mean correlation vs distance for all cell pairs during movement onsets (grey lines are each individual field with >10 pairs). (K) Same as J for continuous locomotion. (L) Same as J,K for rest periods. Shaded regions and error bars represent ±SEM. **p<1×10⁻⁷, *p<0.05; Wilcoxon Rank-Sum test.
Figure 4—figure supplement 1

Network synchrony is similarly elevated at locomotion and jerk onsets.
(A) Mean correlation vs distance for all cell pairs during locomotion initiations (grey lines are individual fields with >10 pairs). (B) Same as A for jerk initiations. (C) Mean correlation coefficient for cell pairs at rest, at movement onsets, and during continuous locomotion for imaging fields which included behavioral periods of all three types (n = 307 pairs). Error bars represent ±SEM. **p<1×10⁻⁷, *p<0.05; Wilcoxon Rank-Sum test.
Figure 5 with 1 supplement
Cross-hemisphere synchrony permits simultaneous comparison of DA and ChI signals during spontaneous movement.
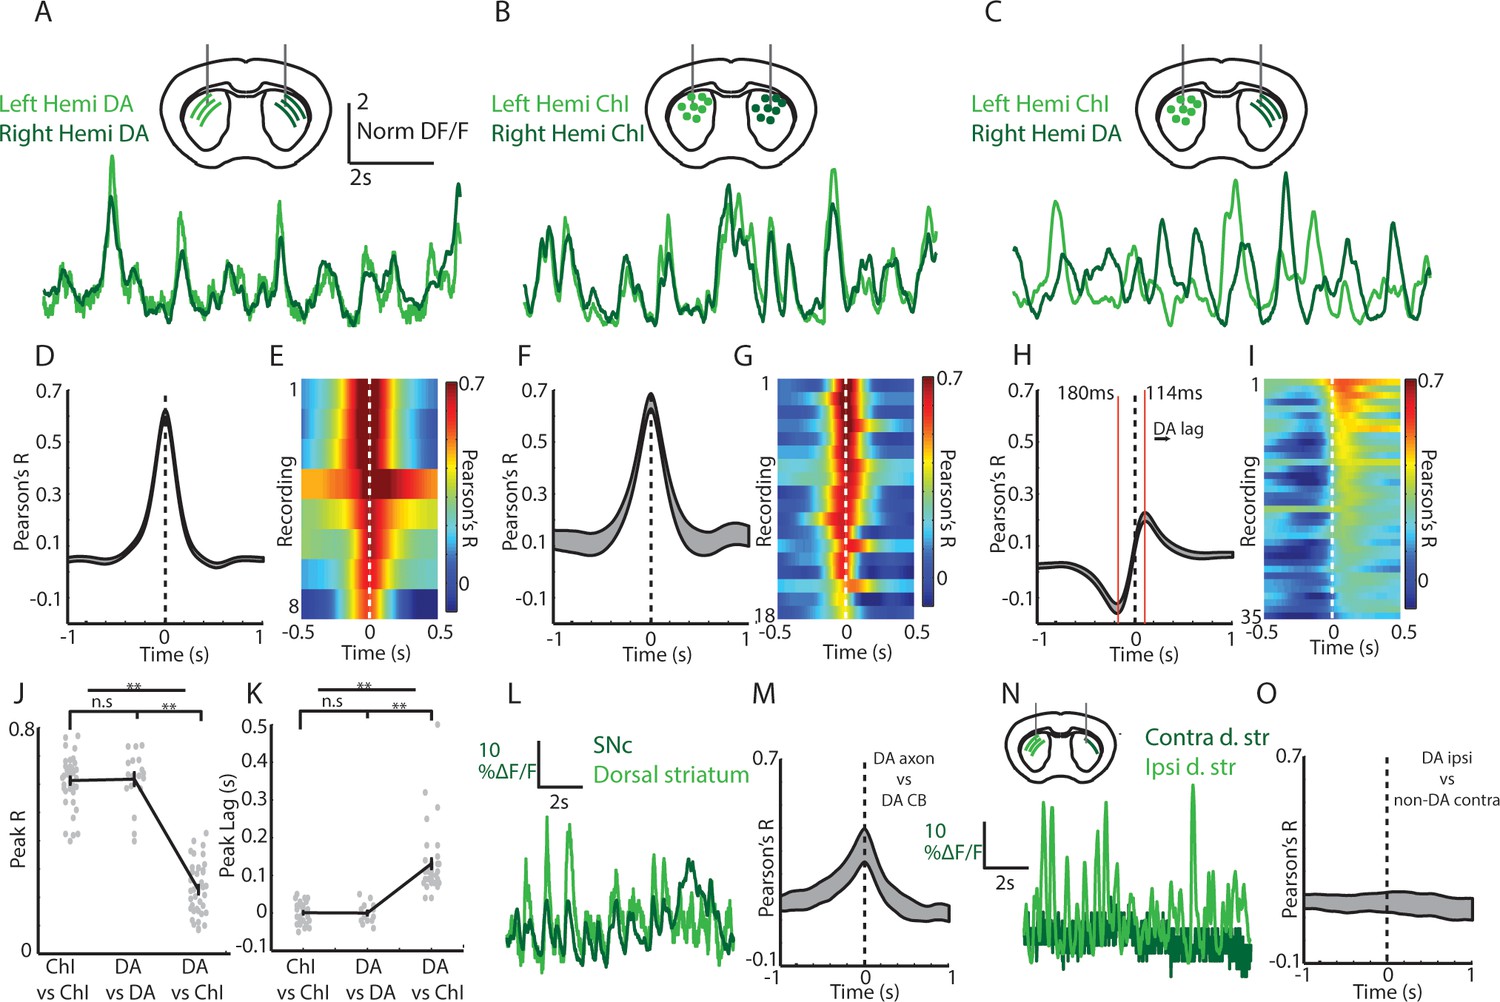
(A) Representative z-score normalized population signals from GCaMP6f expressing DA axons recorded in the left and right hemispheres in the dorsal striatum of a DAT-cre mouse. (B) Representative bi-lateral population signals from dorsal striatum ChIs in a ChAT-cre mouse. (C) Representative population signals from GCaMP6f expressing ChIs recorded in the left striatum and DA axons in the right in a DAT-cre/ChAT-cre mouse. (D) Mean cross correlations between DA signals in the left and right dorsal striatum (n = 8 recording sites in 4 DAT-cre mice). (E) All cross-correlations between DA signals in left and right striatum. Each row corresponds to one recording. (F) Mean cross correlations between ChI signals in the left and right dorsal striatum (n = 18 recordings in 6 ChAT cre mice). (G) All cross-correlations between ChI signals in left and right dorsal striatum. (H) Mean cross correlations between dorsal striatum DA signals and ChAT signals in opposite hemispheres (n = 36 recordings in 8 DAT-cre/ChAT-cre mice). (I) All cross-correlations between ChI and DA signals in opposite hemispheres. (J) Mean peak correlation coefficients for cross-hemisphere population DA signals, ChI signals, and DA/ChI signals. Each dot represents a single recording. (K) Peak lag for cross-hemisphere population DA signals, ChI signals, and DA/ChI signals. Each dot represents a single recording. Positive lag for DA/ChI recordings indicates DA lag. (L) Representative normalized population signals from DA neurons recorded in the SNc and DA axon terminals in the ipsilateral striatum. (M) Mean cross-correlations between SNc and ipsilateral DA terminals in striatum (n = 16 recordings in three mice). (N) Representative population signals from DA axons in the striatum ipsilateral and contralateral to unilateral SNc DA neuron expression. (O) Mean cross-correlations between DA axons ipsilateral and contralateral to unilateral SNc DA neuron expression (n = 10 recordings in three mice). Shaded regions and error bars represent ±SEM. **p<1×10⁻⁸; Wilcoxon Rank-Sum test.
Figure 5—figure supplement 1
Cross-hemisphere measures are consistent across expression configuration and are not a result of subcellular signaling differences.
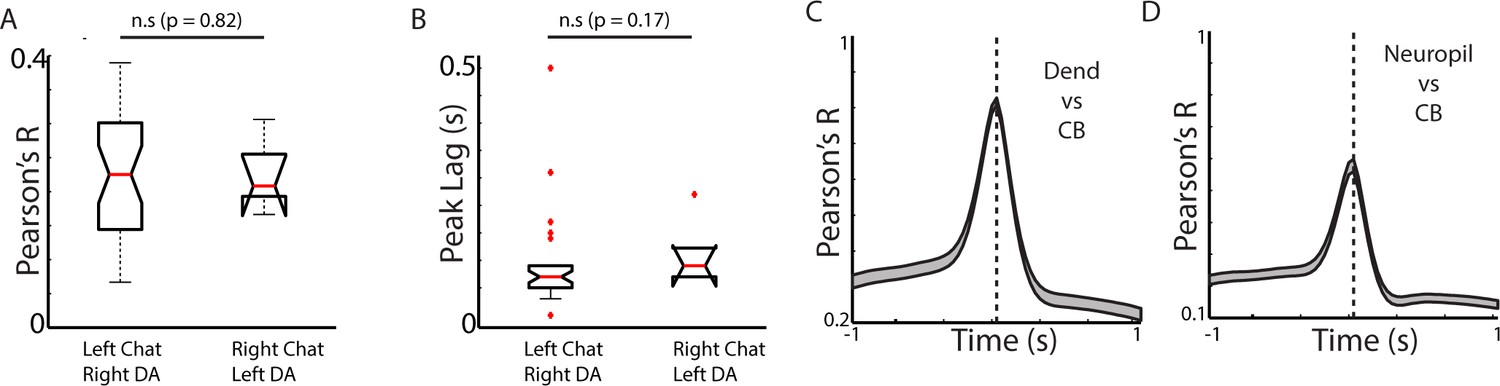
(A) Box plots showing cross-hemisphere peak correlations for mice expressing GCaMP6f in ChIs in either the left (n = 31, five mice) or right (n = 5, two mice) hemisphere (and DA axons in the opposite). (B) Box plots showing the peak lag in the cross-correlation for the sessions plotted in A. (C) Mean cross-correlation between the mean ChI dendritic DF/F signal and ChI somatic DF/F signal for all 2-photon recorded fields (n = 49 fields, six mice). (D) Mean cross-correlation between the mean ChI neuropil DF/F signal (axons and out of focus dendrites) and ChI somatic DF/F signal for all 2-photon recorded fields (n = 49 fields, six mice). Error bars represent ±SEM.
Figure 6 with 1 supplement
Rapid, simultaneous DA terminal and ChI signals at rest exhibit both parallel and divergent dynamics which co-vary with movement onset.
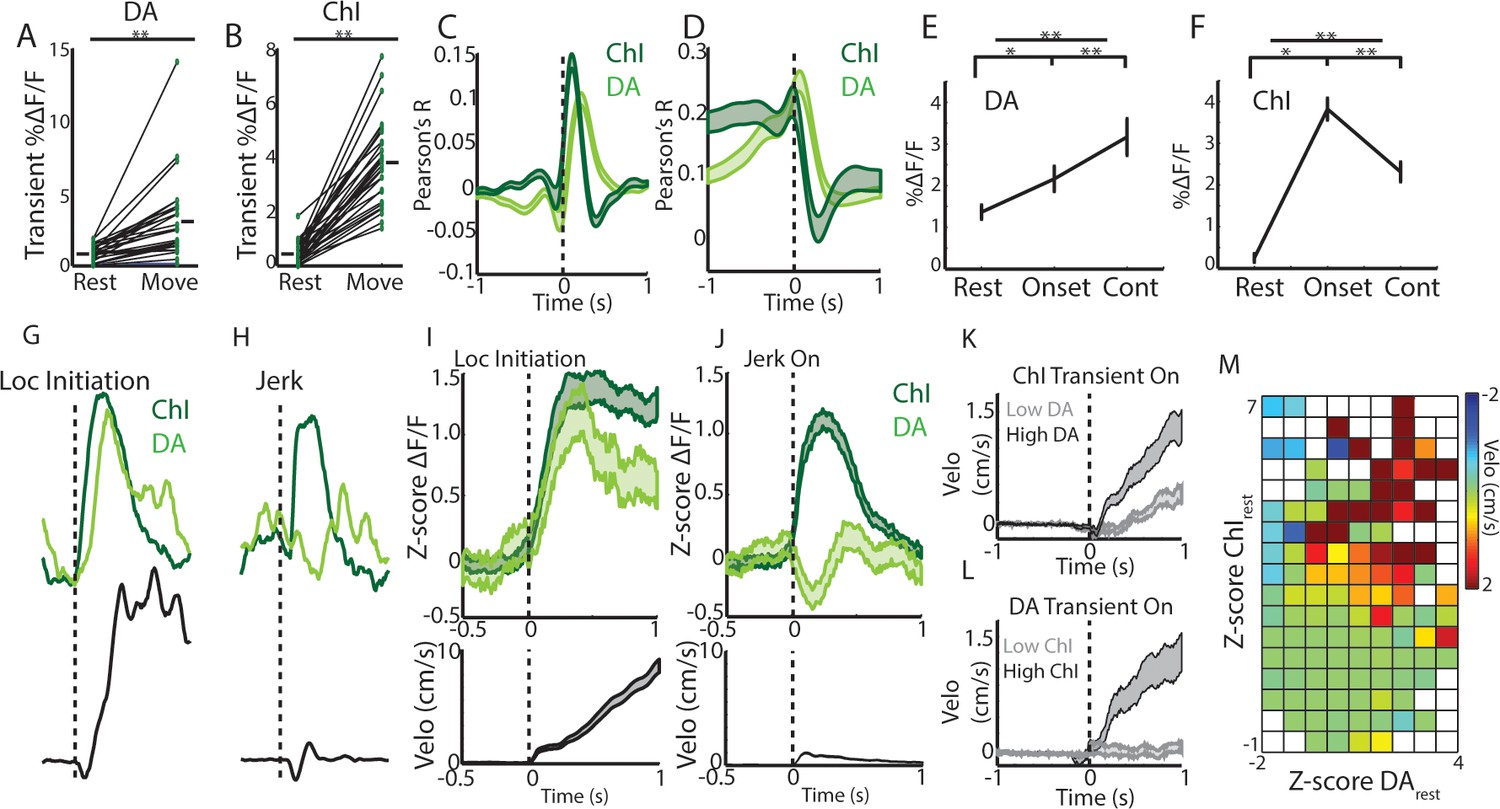
(A) Mean transient DF/F for all dorsal striatum DA axon terminal recordings (n = 25 recordings, eight mice) recorded simultaneously with ChIs during movement and rest periods. (B) Mean transient DF/F for ChI populations recorded simultaneously with DA terminals. (C) Mean cross-correlations between DF/F and acceleration for all simultaneously recorded DA terminals and ChIs. (D) Mean cross-correlations between DF/F and velocity for all simultaneously recorded DA terminals and ChIs. (E) Mean DA terminal DF/F during all rest, onset, and continuous locomotion periods. (F) Mean ChI population DF/F during all rest, onset, and continuous locomotion periods. (G) DF/F from simultaneously recorded ChIs and DA terminals aligned on a representative locomotion initiation. (H) DF/F from simultaneously recorded ChIs and DA terminals aligned on a representative jerk onset. (I) Mean z-score normalized DF/F for all simultaneous DA terminal and ChI recordings (top) aligned on locomotion initiations (velo, bottom; n = 94 initiations, eight mice). (J) Mean z-score normalized DF/F for all simultaneous DA terminal and ChI recordings (top) aligned on jerk onsets (velo, bottom; n = 292 jerks, eight mice). (K) Velocity triggered on the onsets of ChI population transients occurring at rest which were associated with high (n = 525 transients, top quartile) and low (bottom quartile) DA terminal signals (see Figure 6—figure supplement 1 for associated DF/F traces). (L) Same as K, for onsets of DA terminal transients (n = 319 for top and bottom quartile of associated ChI DF/F). (M) Z-score normalized ChI and DA terminal population DF/F for each significant transient event occurring at rest and the mean change in velocity in a 1 s period post transient onset for each combination of DA and ChI values. Shaded regions and error bars represent ±SEM. **p<1×10⁻⁸; Wilcoxon Rank-Sum test.
Figure 6—figure supplement 1
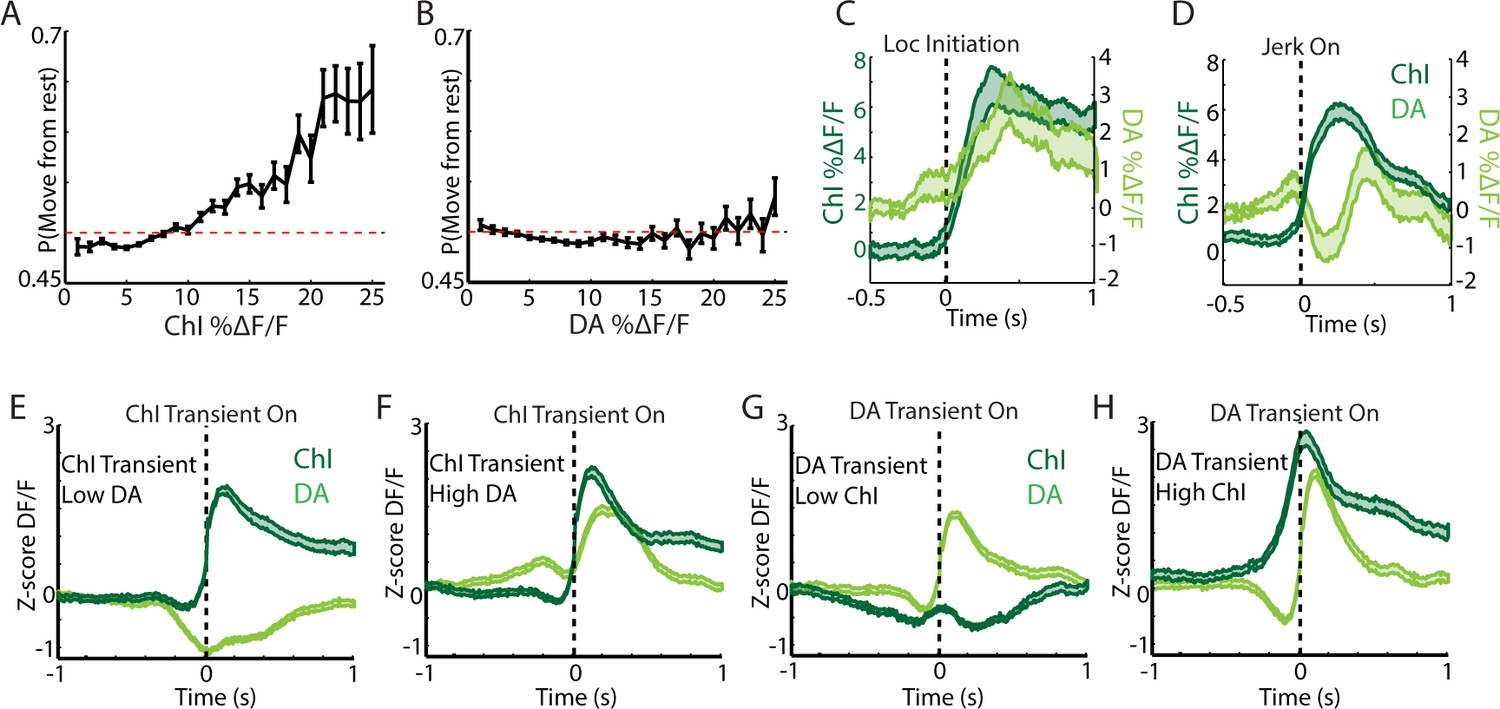
DA terminal and ChI signals at rest are associated with distinct aspects of transitions to movement.
(A) Binned mean population ChI DF/F for each rest bin vs the probability of transitioning to movement in a 0.5 s window after that bin. (B) Same as A for DA terminal DF/F. (C) Mean non Z-score normalized DF/F (pre event baseline corrected) for all simultaneous DA terminal and ChI recordings aligned on locomotion initiations (n = 94 initiations, eight mice). Compare to normalized plots in Figure 6I. (D) Mean non Z-score normalized DF/F for all simultaneous DA terminal and ChI recordings aligned on jerk onsets (n = 292 jerks, eight mice). Compare to normalized plots in Figure 6J. (E) Mean DF/F for ChIs and DA terminals aligned on the onsets of ChI transients associated with low DA (bottom quartile). Signals correspond to periods included in Figure 6K (n = 525 transients). (F) Same as E but for periods with high (top quartile) DA signal. (G) Mean DF/F for ChIs and DA terminals aligned on the onsets of DA transients associated with low ChI signal (bottom quartile). Signals correspond to periods included in Figure 6L (n = 319 transients). (H) Same as G but for periods with high (top quartile) ChI signal.
Figure 7 with 1 supplement
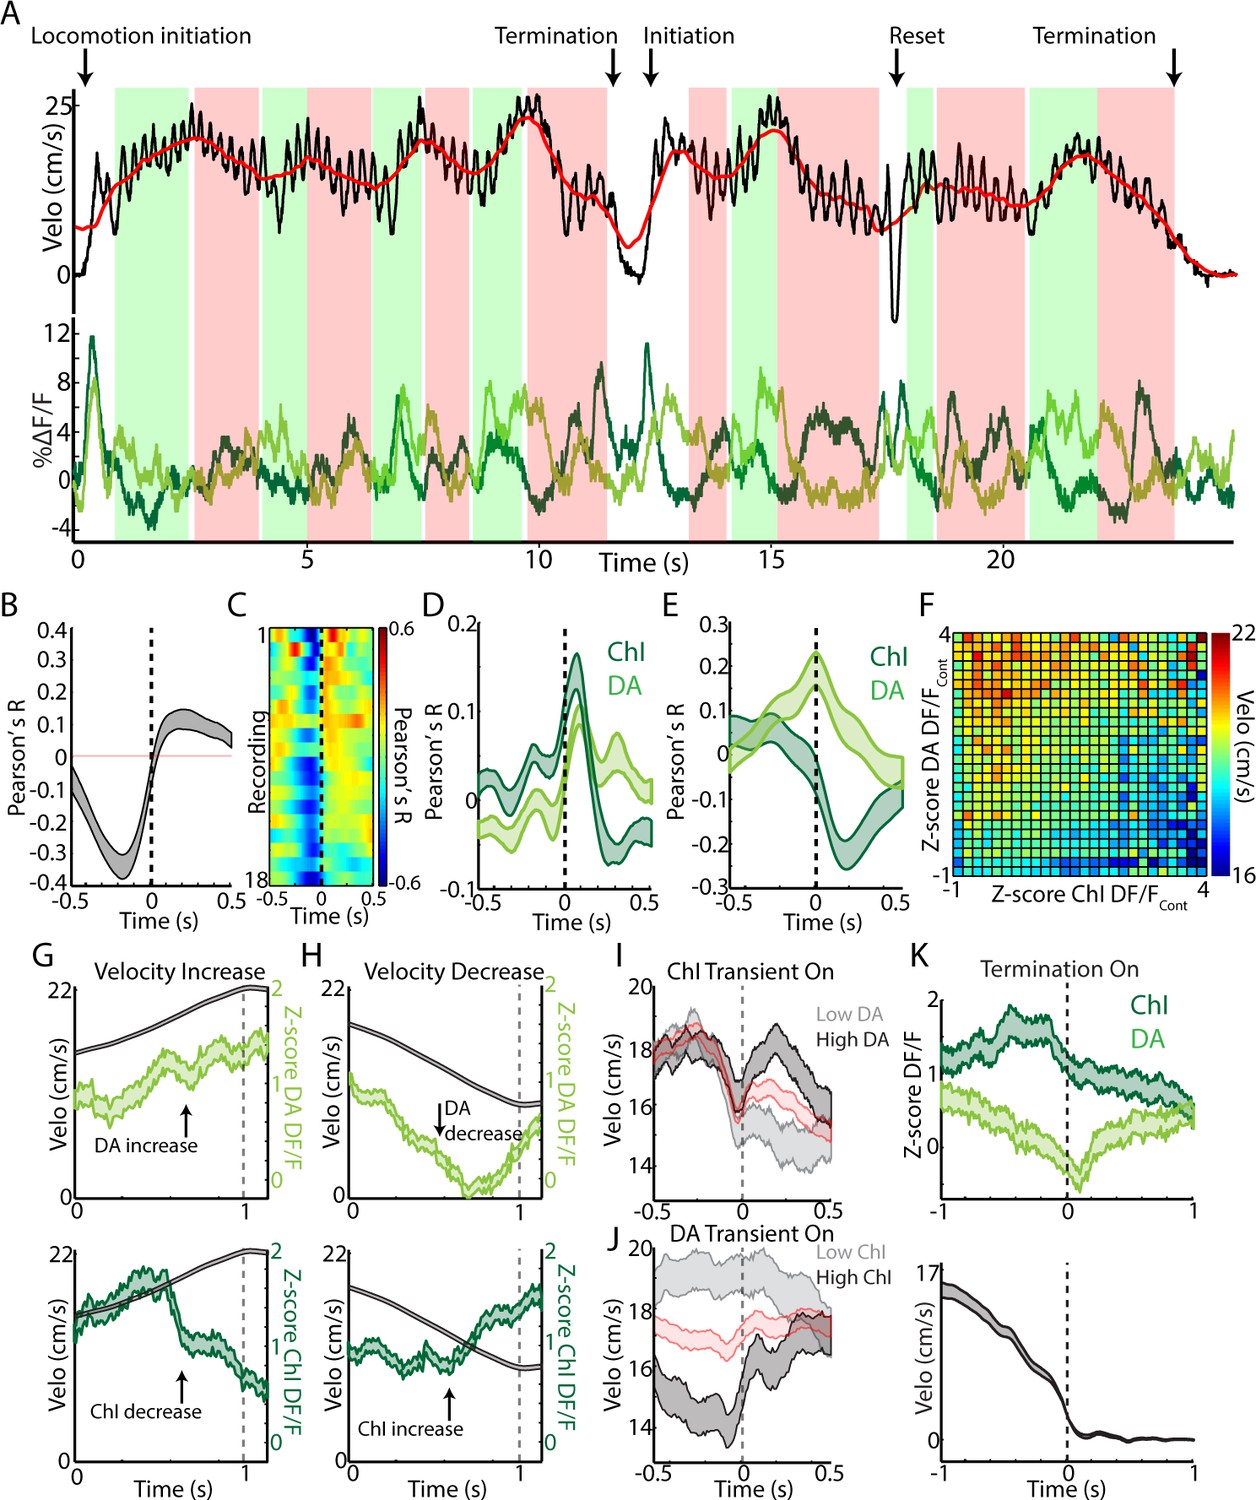
Changes in velocity during continuous locomotion are associated with divergent DA and ChI population signals.
(A) Velocity (top) and simultaneously recorded ChI and DA terminal population signals (bottom) during a representative period of continuous locomotion. Red line indicates smoothed velocity showing fluctuations in running velocity superimposed on rapid cyclic accelerations. Green shaded regions indicate velocity increases, red decreases. (B) Mean cross correlation between DA terminals and ChIs during continuous locomotion (n = 18 recordings, eight mice). (C) Cross correlation between DA and ChIs for each recording, sorted by peak correlation magnitude. (D) Mean cross correlation between ChI and DA populations and acceleration during continuous locomotion. (E) Mean cross correlation between ChI and DA populations and velocity during continuous locomotion. (F) Z-score normalized ChI and DA terminal DF/F and the associated mean velocity in the same time bins for each combination of DA and ChI values during continuous locomotion. (G) Mean velocity (black) and DA (top) and ChI (bottom) DF/F aligned on the peak of velocity increases during continuous locomotion (n = 451). (H) Same as G aligned on the trough of velocity decreases during continuous locomotion (n = 724). (I) Mean velocity aligned on the onsets of significant population ChI transients during continuous locomotion associated with high (top quartile, n = 155) or low (bottom quartile, n = 155) mean DA signal. Red trace is mean across all (n = 610 transients). See Figure 7—figure supplement 1 for DF/F traces. (J) Same as I for DA population transients (n = 426) associated with high (n = 106 transients) and low (n = 106) ChI signal. (K) Mean ChI and DA DF/F (top) and velocity (bottom) aligned on terminations of continuous locomotion to rest (n = 83, eight mice). Shaded regions and error bars represent ±SEM.
Figure 7—figure supplement 1
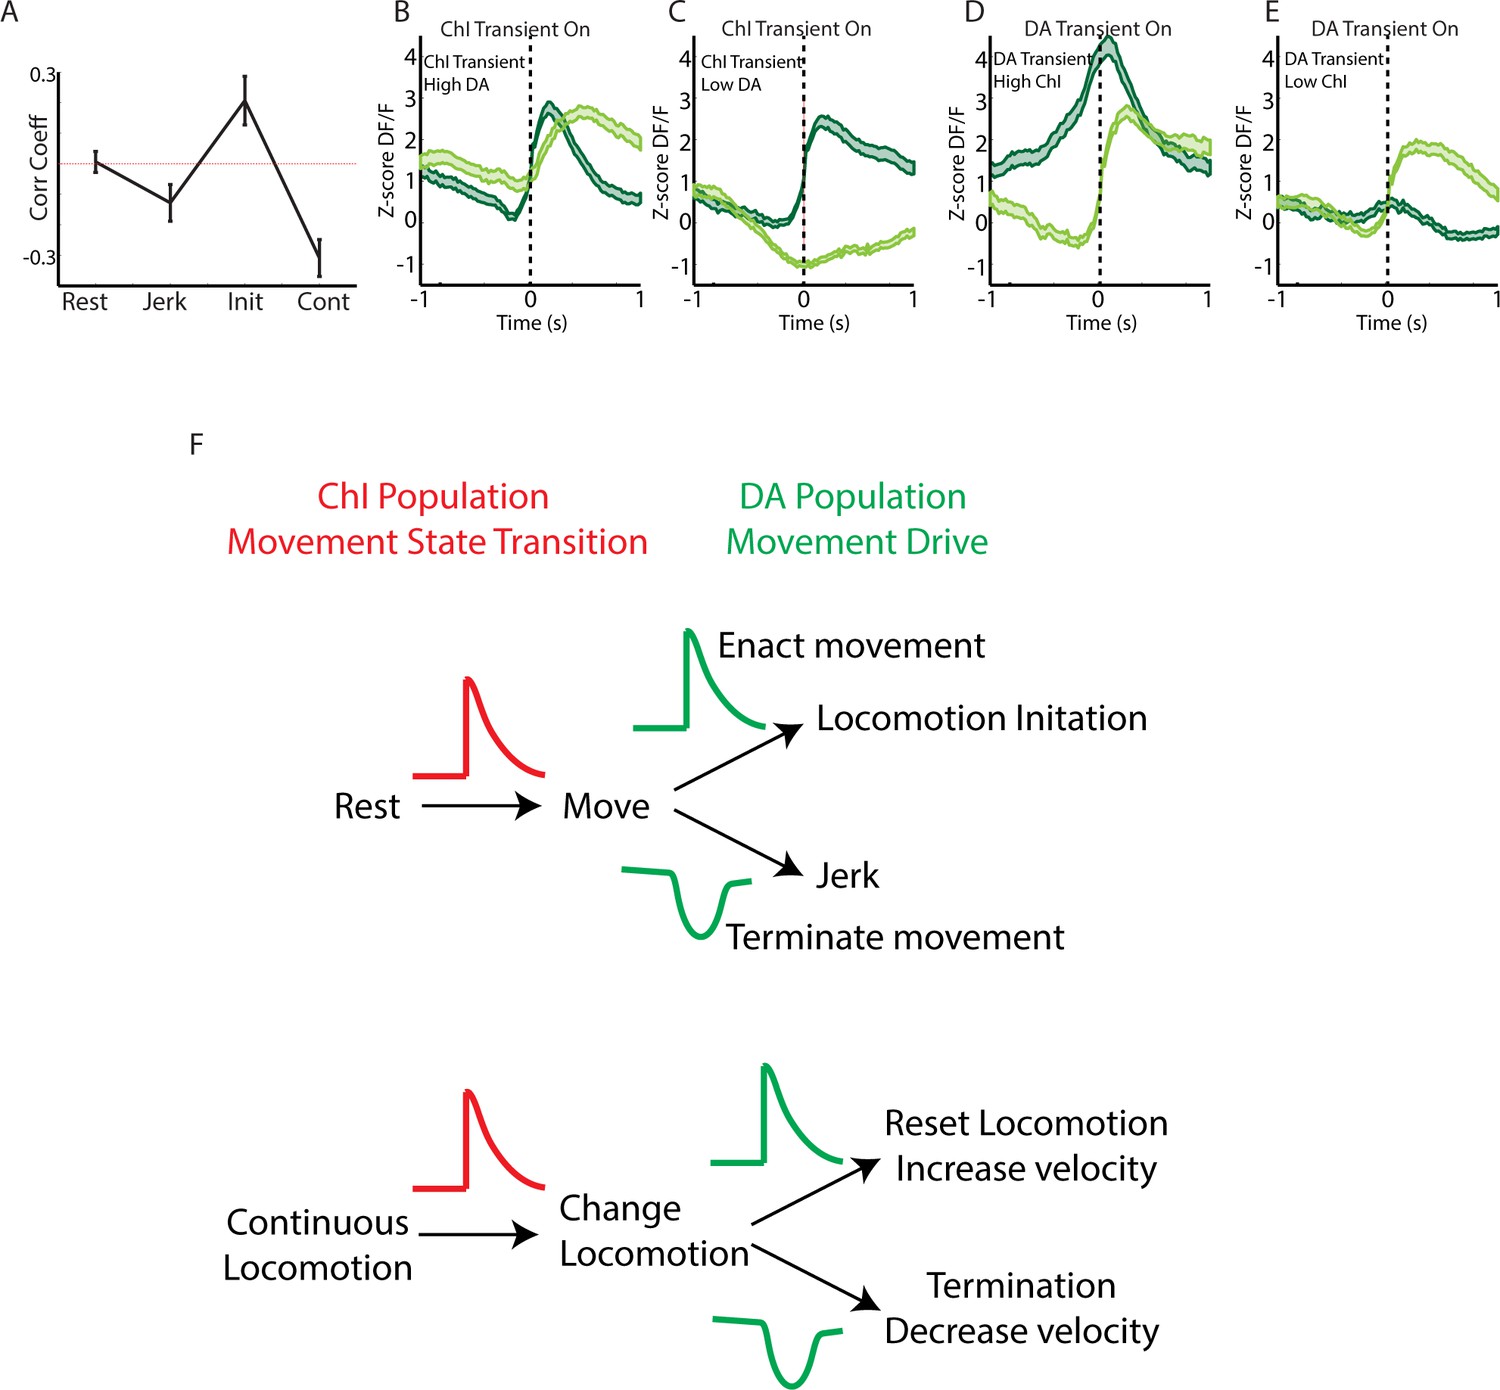
Summary of co-varying DA and ChI signals during spontaneous movement.
(A) Mean positive or negative cross correlation peak between simultaneously recorded DA and ChI population signals during rest (n = 31 recordings, eight mice), jerks (n = 31), locomotion initiation (n = 15), and continuous locomotion (n = 18). (B) Mean DF/F for ChIs and DA terminals aligned on the onsets of ChI transients associated with high mean DA (top quartile) during continuous locomotion. Signals correspond to periods included in Figure 7I (n = 155 transients). (C) Same as B, but for periods with low DA (bottom quartile). (D) Mean DF/F for ChIs and DA terminals aligned on the onsets of DA transients associated with high mean ChI signal (top quartile) during continuous locomotion. Signals correspond to periods included in Figure 7J (n = 106 transients). (E) Same as D but for periods with low mean DA (bottom quartile). (F) Conceptual model for ChI and DA population signaling in spontaneous movement control. Widespread synchronous signals are expressed across networks of ChI cells at movement state transitions. Following the ChI signal, DA populations either increase signaling to enact and drive the subsequent action (locomotion initiation or speed increase) or decrease signaling at movement cancellations (jerks) or terminations. After transitions to high velocity locomotion, ChI populations desynchronize and the summed population signal decreases as DA terminal signals increase.
Additional files
-
Transparent reporting form
- https://doi.org/10.7554/eLife.44903.016
Download links
A two-part list of links to download the article, or parts of the article, in various formats.
Downloads (link to download the article as PDF)
Open citations (links to open the citations from this article in various online reference manager services)
Cite this article (links to download the citations from this article in formats compatible with various reference manager tools)
Coordination of rapid cholinergic and dopaminergic signaling in striatum during spontaneous movement
eLife 8:e44903.
https://doi.org/10.7554/eLife.44903


