The genomes of polyextremophilic cyanidiales contain 1% horizontally transferred genes with diverse adaptive functions
- Heinrich Heine University, Germany
- Rutgers University, United States
- Arizona State University, United States
Figures
Figure 1
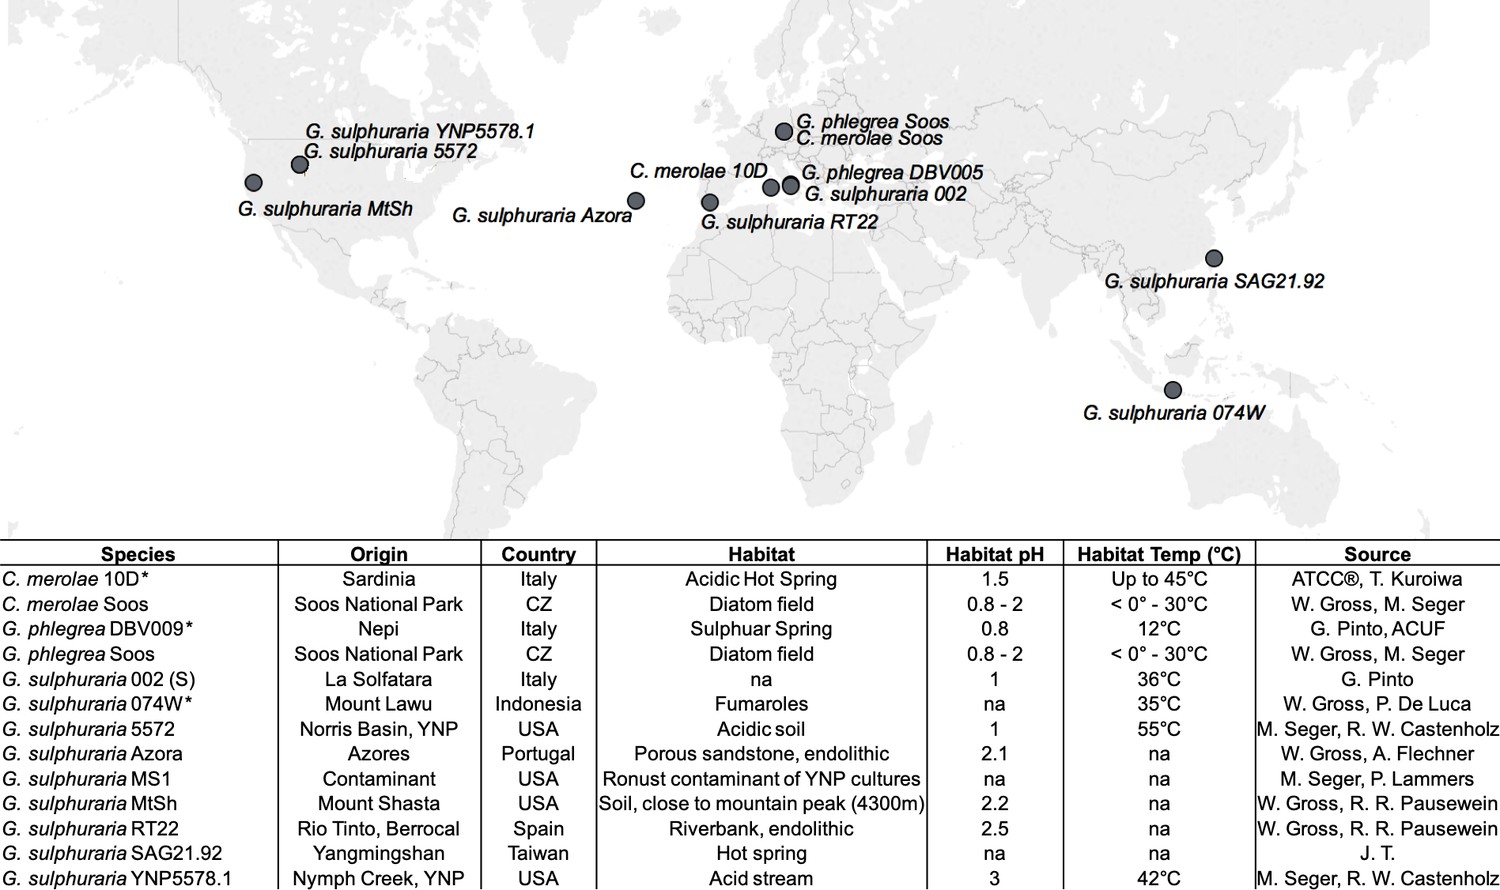
Geographic origin and habitat description of the analyzed Cyanidiales strains.
Available reference genomes are marked with an asterisk (*), whereas ‘na’ indicates missing information.
Figure 2

Species tree of the 13 analyzed extremophilic Cyanidiales genomes using mesophilic red (Porphyra umbilicalis, Porphyridium purpureum) and green algae (Ostreococcus tauri, Chlamydomonas reinhardtii) as outgroups.
IQTREE was used to infer a single maximum-likelihood phylogeny based on orthogroups containing single-copy representative proteins from at least 12 of the 17 taxa (13 Cyanidiales + 4 Others). Each orthogroup alignment represented one partition with unlinked models of protein evolution chosen by IQTREE. Consensus tree branch support was determined by 2000 rapid bootstraps. All nodes in this tree had 100% bootstrap support, and are therefore not shown. Divergence time estimates are taken from Yang et al. (2016). Similarity is derived from the average one-way best blast hit protein identity (minimum protein identity threshold = 30%). The minimal protein identity between two strains was 65.4%, measured between g. sulphuraria SAG21.92, which represent the second most distant sampling locations (12,350 km). Similar lineage boundaries were obtained for the C. merolae samples (66.4% protein identity), which are separated by only 1150 km.
Figure 3
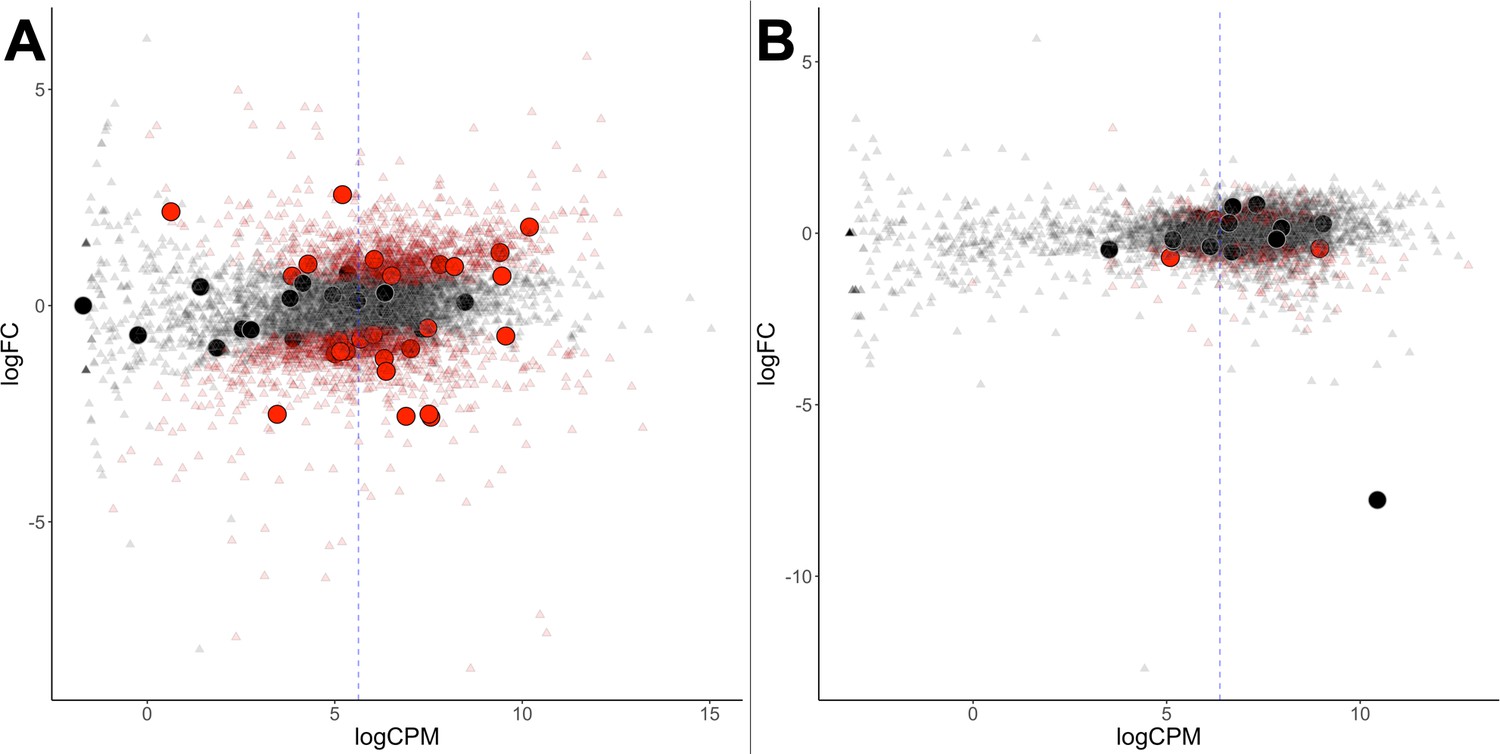
Differential gene expression of G. sulphuraria 074W.
(A) and C. merolae 10D (B), here measured as log fold change (logFC) vs transcription rate (logCPM). Differentially expressed genes are colored red (quasi-likelihood (QL) F-test, Benjamini-Hochberg, p <= 0.01). HGT candidates are shown as large circles. The blue dashes indicate the average logCPM of the dataset. Although HGT candidates are not significantly more or less expressed than native genes, they react significantly stronger to temperature changes in G. sulphuraria 074W (‘more red than black dots'). This is not the case in high treated C. merolae 10D.
Figure 4
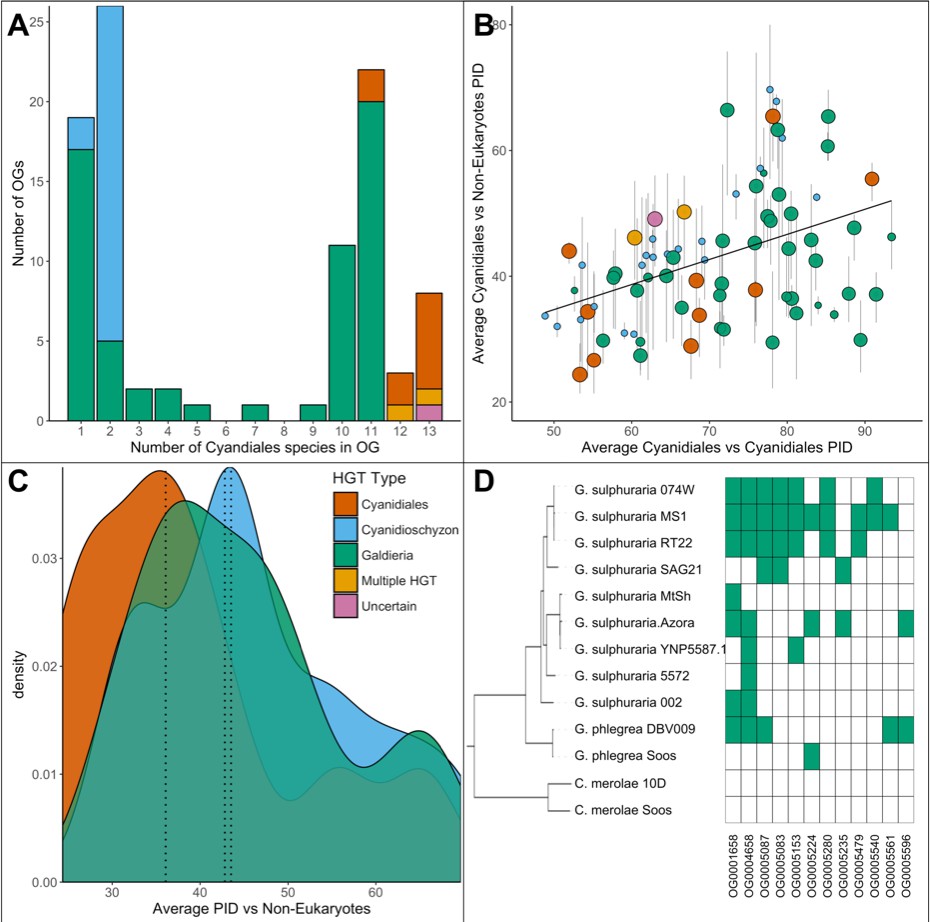
Comparative analysis of the 96 OGs potentially derived from HGT.
(A) OG count vs. the number of Cyanidiales species contained in an OG (=OG size). Only genes from the sequenced genomes were considered (13 species). A total of 60 OGs are exclusive to the Galdieria lineage (11 species), 23 OGs are exclusive to the Cyanidioschyzon lineage (two species), and 13 OGs are shared by both lineages. A total of 46/96 HGT events seem to be affected by later gene erosion/partial fixation. (B) OG-wise PID between HGT candidates vs. their potential non-eukaryotic donors. Point size represents the number of sequenced species contained in each OG. Because only two genomes of Cyanidioschyzon were sequenced, the maximum point size for this lineage is 2. The whiskers span minimum and maximum shared PID of each OG. The PID within Cyanidiales HGTs vs. PID between Cyanidiales HGTs and their potential non-eukaryotic donors is positively correlated (Kendall's tau coefficient, p=0.000747), showing evolutionary constraints that are gene function dependent, rather than time-dependent. (C) Density curve of average PID towards potential non-eukaryotic donors. The area under each curve is equal to 1. The average PID of HGT candidates found in both lineages (‘ancient HGT’, left dotted line) is ~5% lower than the average PID of HGT candidates exclusive to Galdieria or Cyandioschyzon (‘recent HGT’, right dotted lines). This difference is not significant (pairwise Wilcoxon rank-sum test, Benjamini-Hochberg, p>0.05). (D) Presence/Absence pattern (green/white) of Cyanidiales species in HGT OGs. Some patterns strictly follow the branching structure of the species tree. They represent either recent HGTs that affect a monophyletic subset of the Galdieria lineage, or are the last eukaryotic remnants of an ancient gene that was eroded through differential loss. In other cases, the presence/absence pattern of Galdieria species is random and conflicts with the Galdieria lineage phylogeny. HGT would assume either multiple independent acquisitions of the same HGT candidate, or a partial fixation of the HGT candidate in the lineage, while still allowing for gene erosion. According to DL, these are the last existing paralogs of an ancient gene, whose erosion within the eukaryotic kingdom is nearly complete.
Figure 5 with 96 supplements
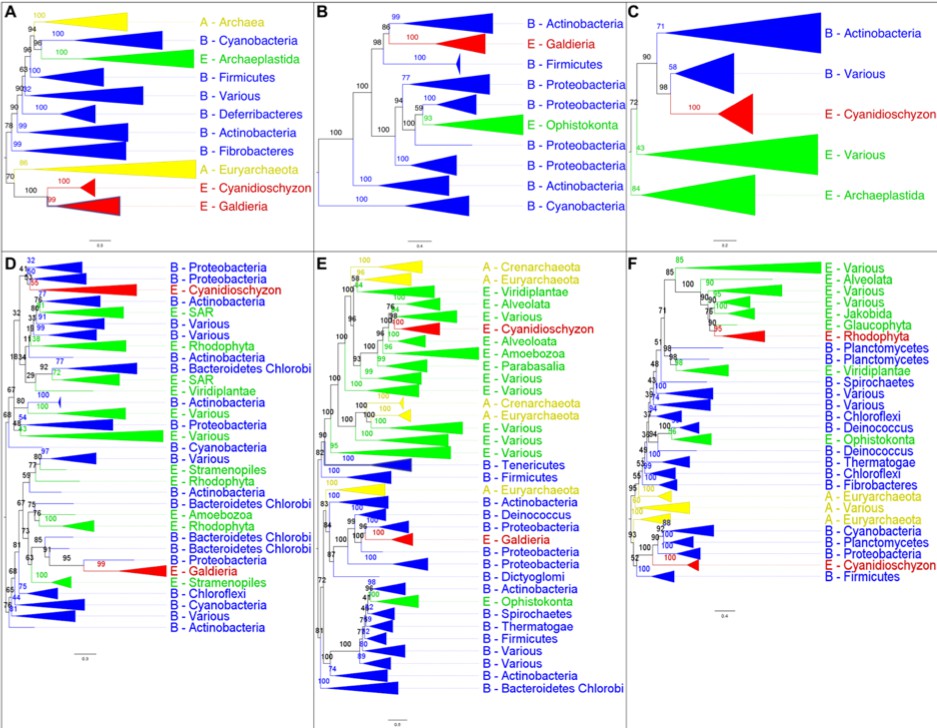
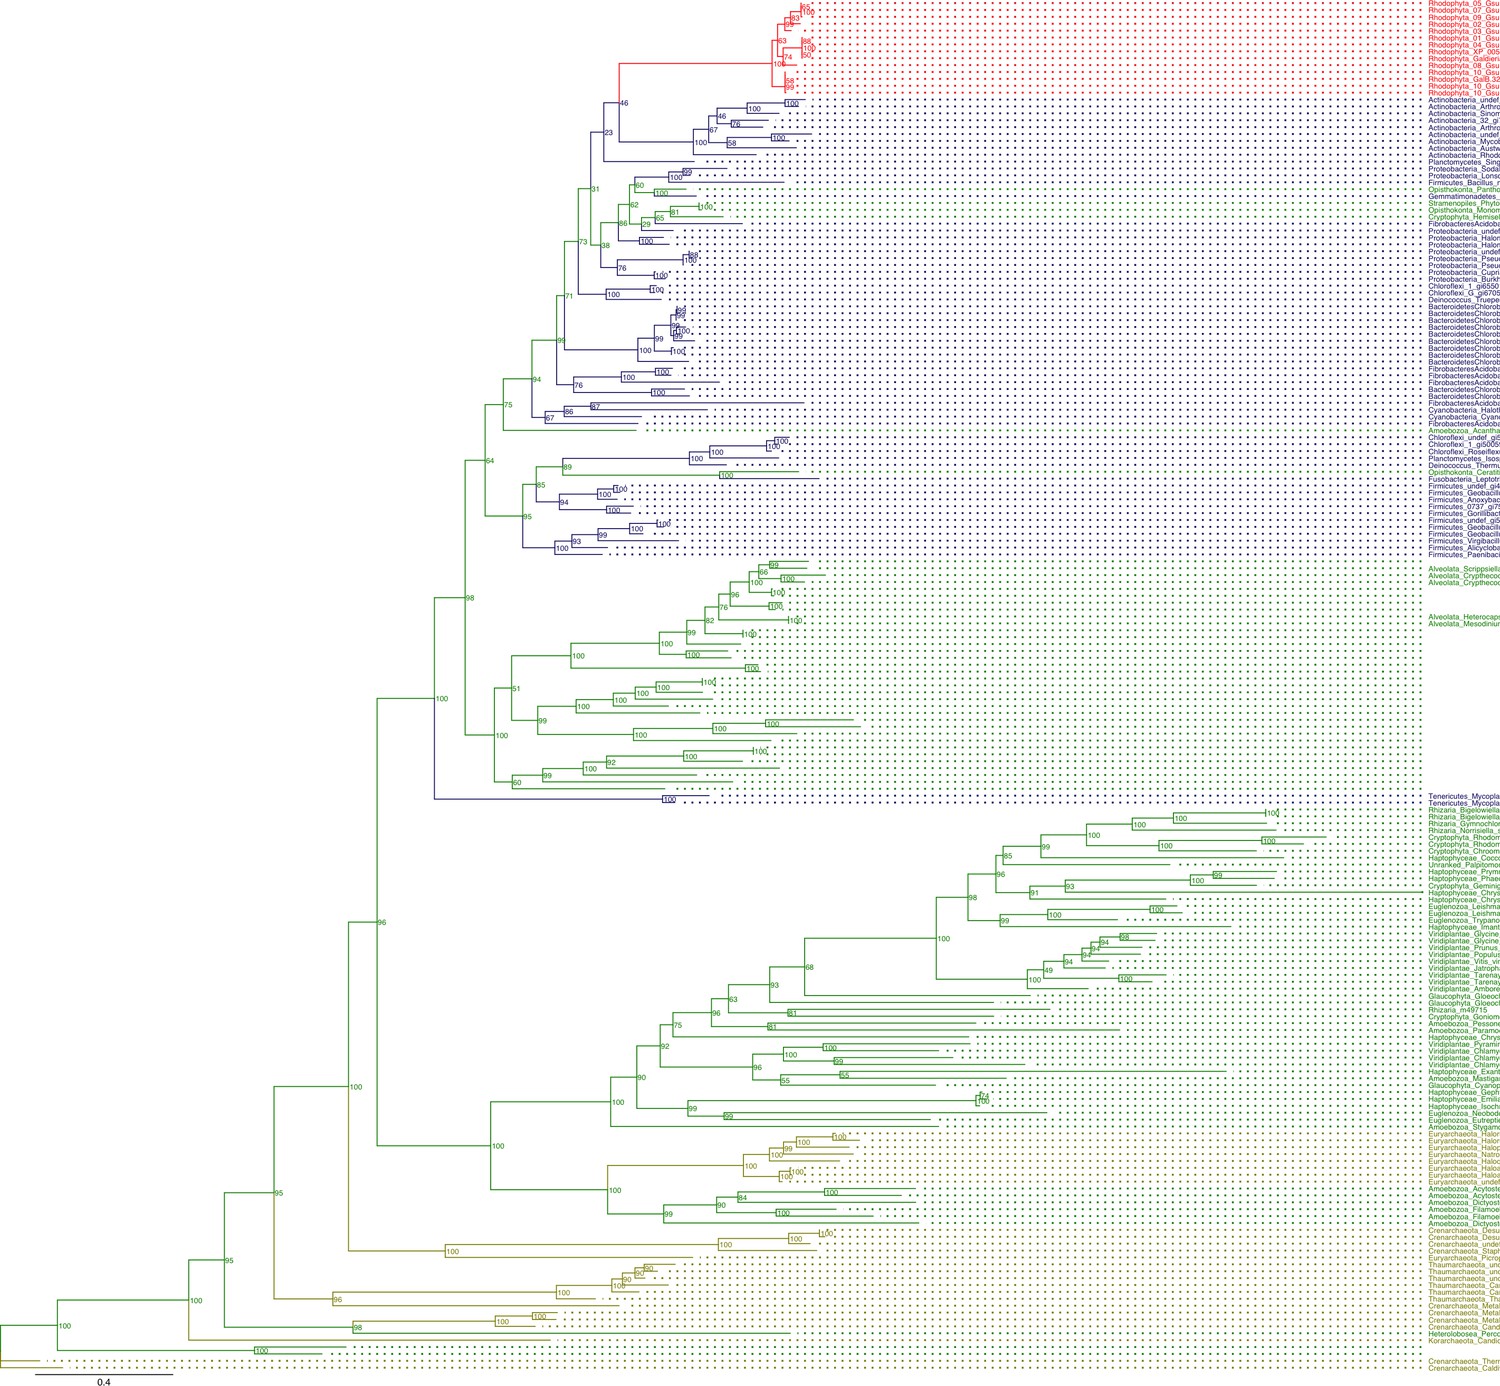
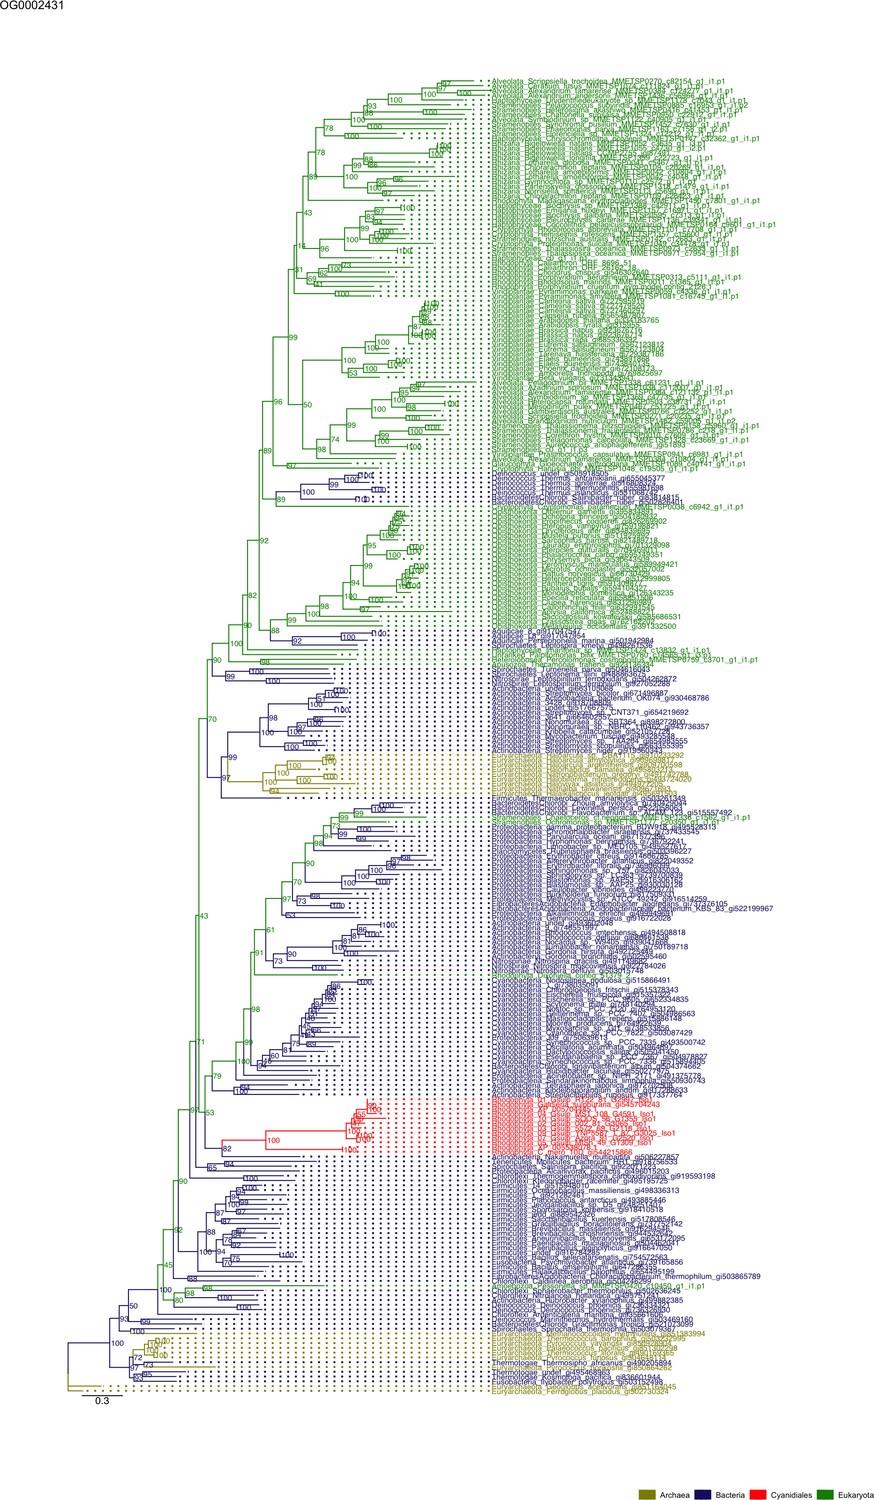
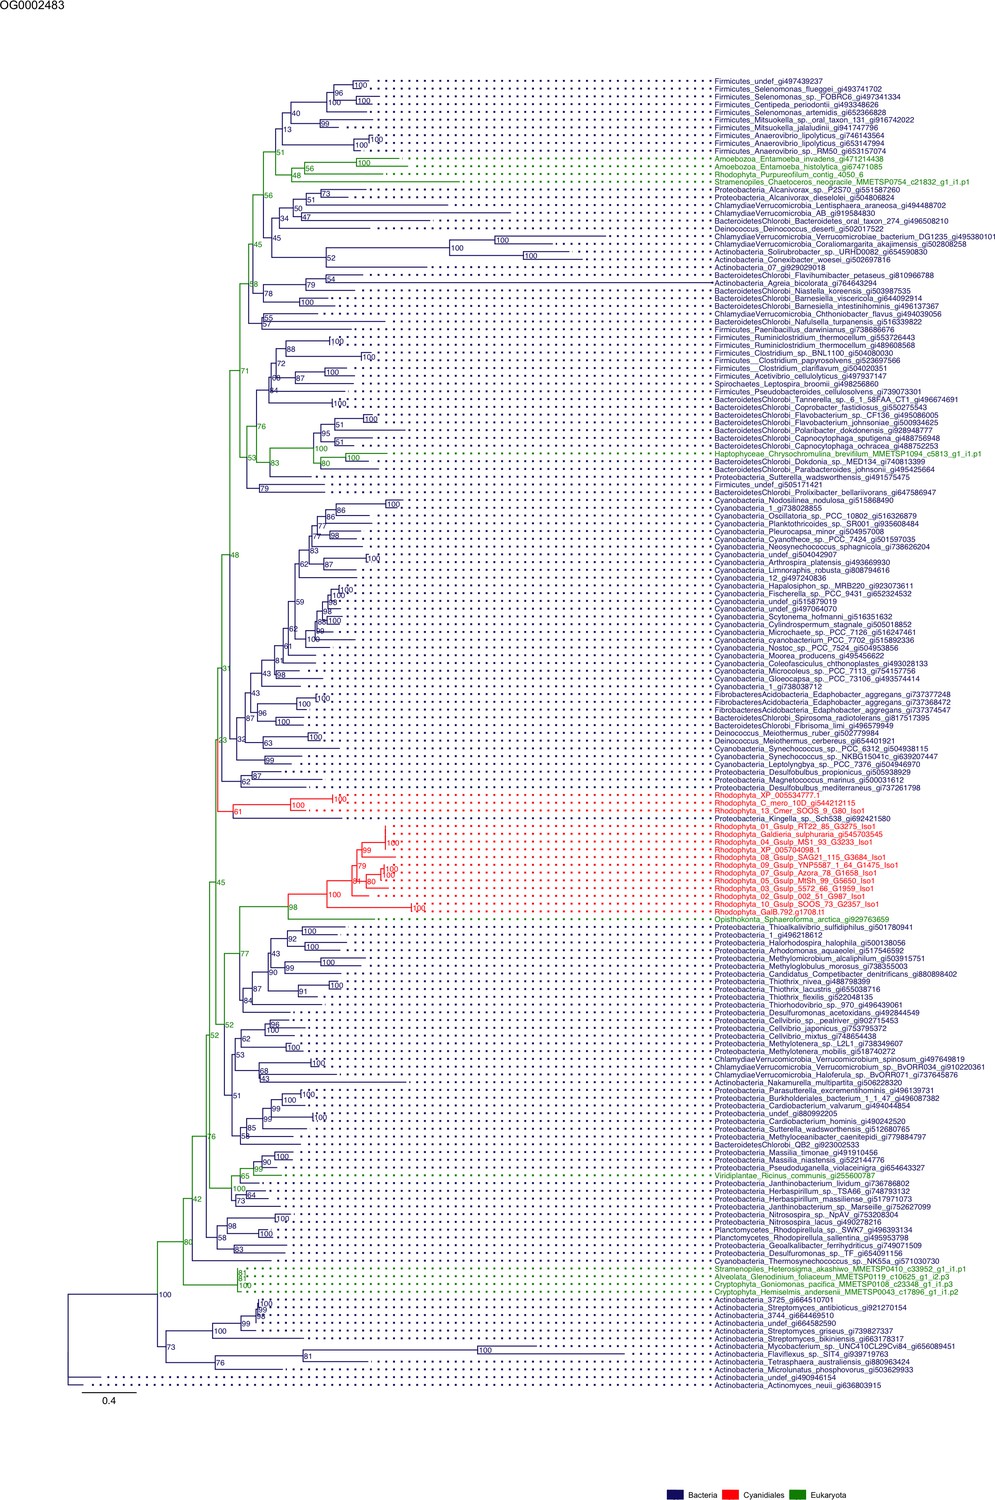
The analysis of OGs containing HGT candidates revealed different patterns of HGT acquisition.
Some OGs contain genes that are shared by all Cyanidiales, whereas others are unique to the Galdieria or Cyanidioschyzon lineage. In some cases, HGT appears to have replaced the eukaryotic genes in one lineage, whereas the other lineage maintained the eukaryotic ortholog. Here, some examples of OG phylogenies are shown, which were simplified for ease of presentation. The first letter of the tip labels indicates the kingdom. A = Archaea (yellow), B = Bacteria (blue), E = Eukaryota (green). Branches containing Cyanidiales sequences are highlited in red. (A) Example of an ancient HGT that occurred before Galdieria and Cyanidioschyzon split into separate lineages. As such, both lineages are monophyletic (e.g., OG0001476). (B) HGT candidates are unique to the Galdieria lineage (e.g. OG0001760). (C) HGT candidates are unique to the Cyanidioschyzon lineage (e.g. OG0005738). (D) Galdieria and Cyanidioschyzon HGT candidates are derived from different HGT events and share monophyly with different non-eukaryotic organisms (e.g., OG0003085). (E) Galdieria HGT candidates cluster with non-eukaryotes, whereas the Cyanidioschyzon lineage clusters with eukaryotes (e.g., OG0001542). (F) Cyanidioschyzon HGT candidates cluster with non-eukaryotes, whereas the Galdieria lineage clusters with eukaryotes (e.g., OG0006136).
Figure 5—figure supplement 1
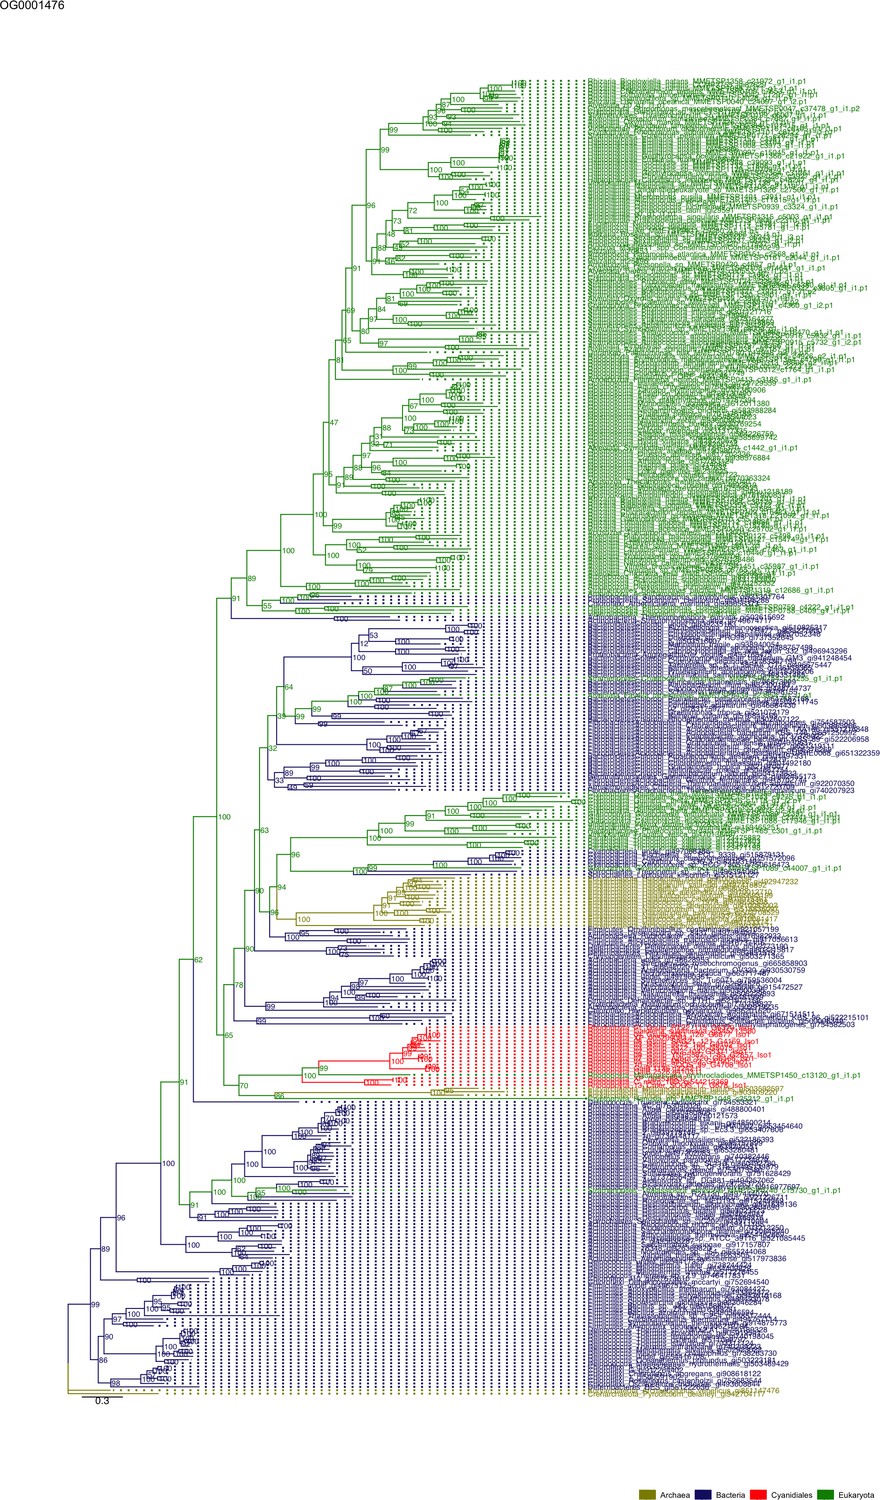
Sequence tree of orthogroup OG0001476.
The tree is based on amino acid sequences. Archaea (yellow), Bacteria (blue), Cyanidiales (red), Eukaryotes including other red algae (green). Branches containing Cyanidiales sequences are highlited in red.
Figure 5—figure supplement 2
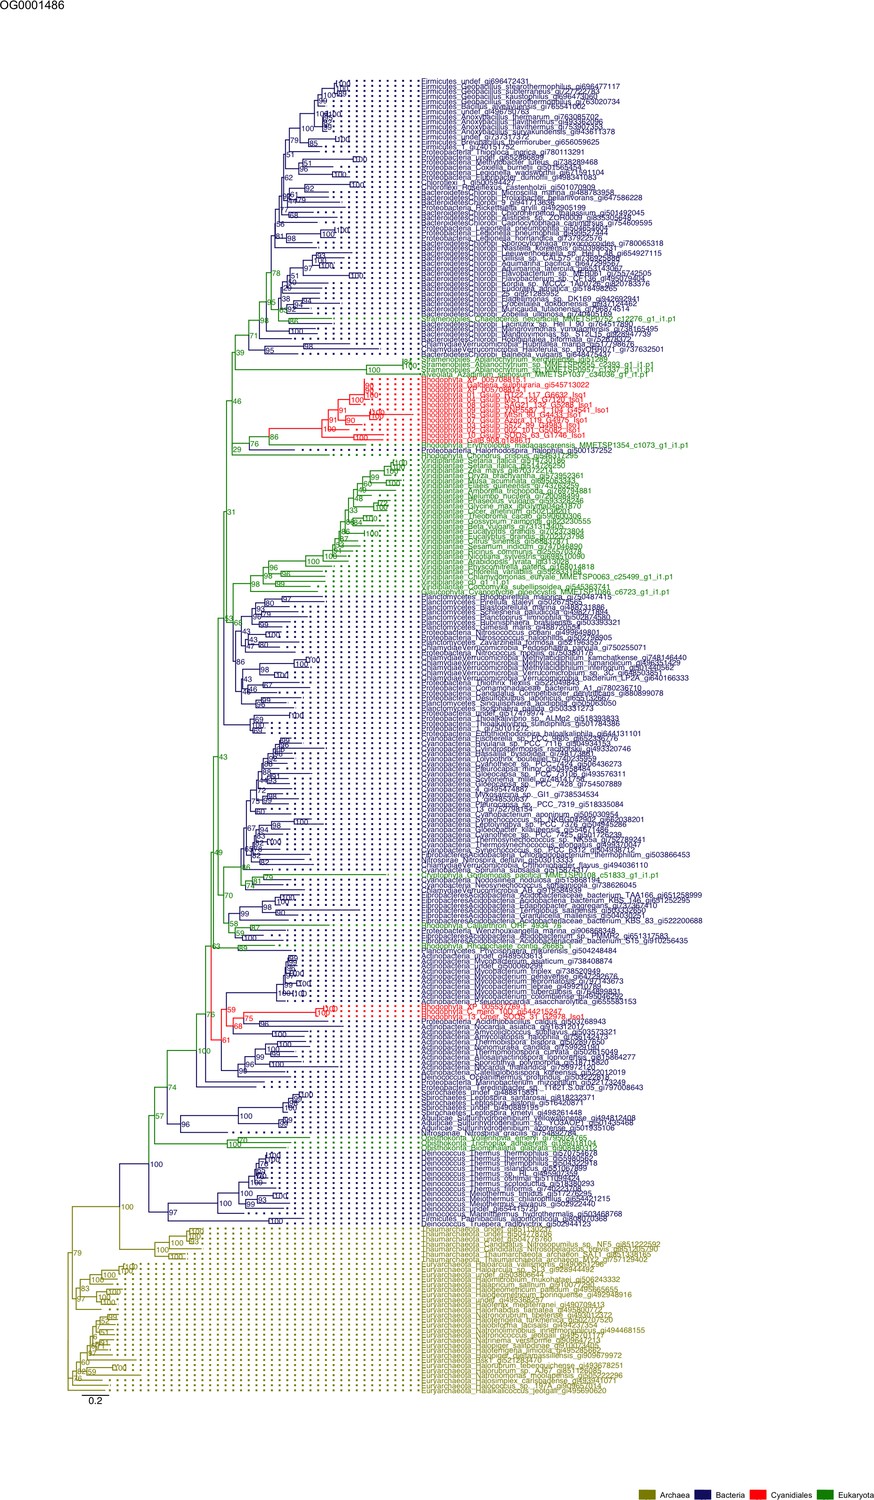
Sequence tree of orthogroup OG0001486.
The tree is based on amino acid sequences. Archaea (yellow), Bacteria (blue), Cyanidiales (red), Eukaryotes including other red algae (green). Branches containing Cyanidiales sequences are highlited in red.
Figure 5—figure supplement 3

Sequence tree of orthogroup OG0001509.
The tree is based on amino acid sequences. Archaea (yellow), Bacteria (blue), Cyanidiales (red), Eukaryotes including other red algae (green). Branches containing Cyanidiales sequences are highlited in red.
Figure 5—figure supplement 4
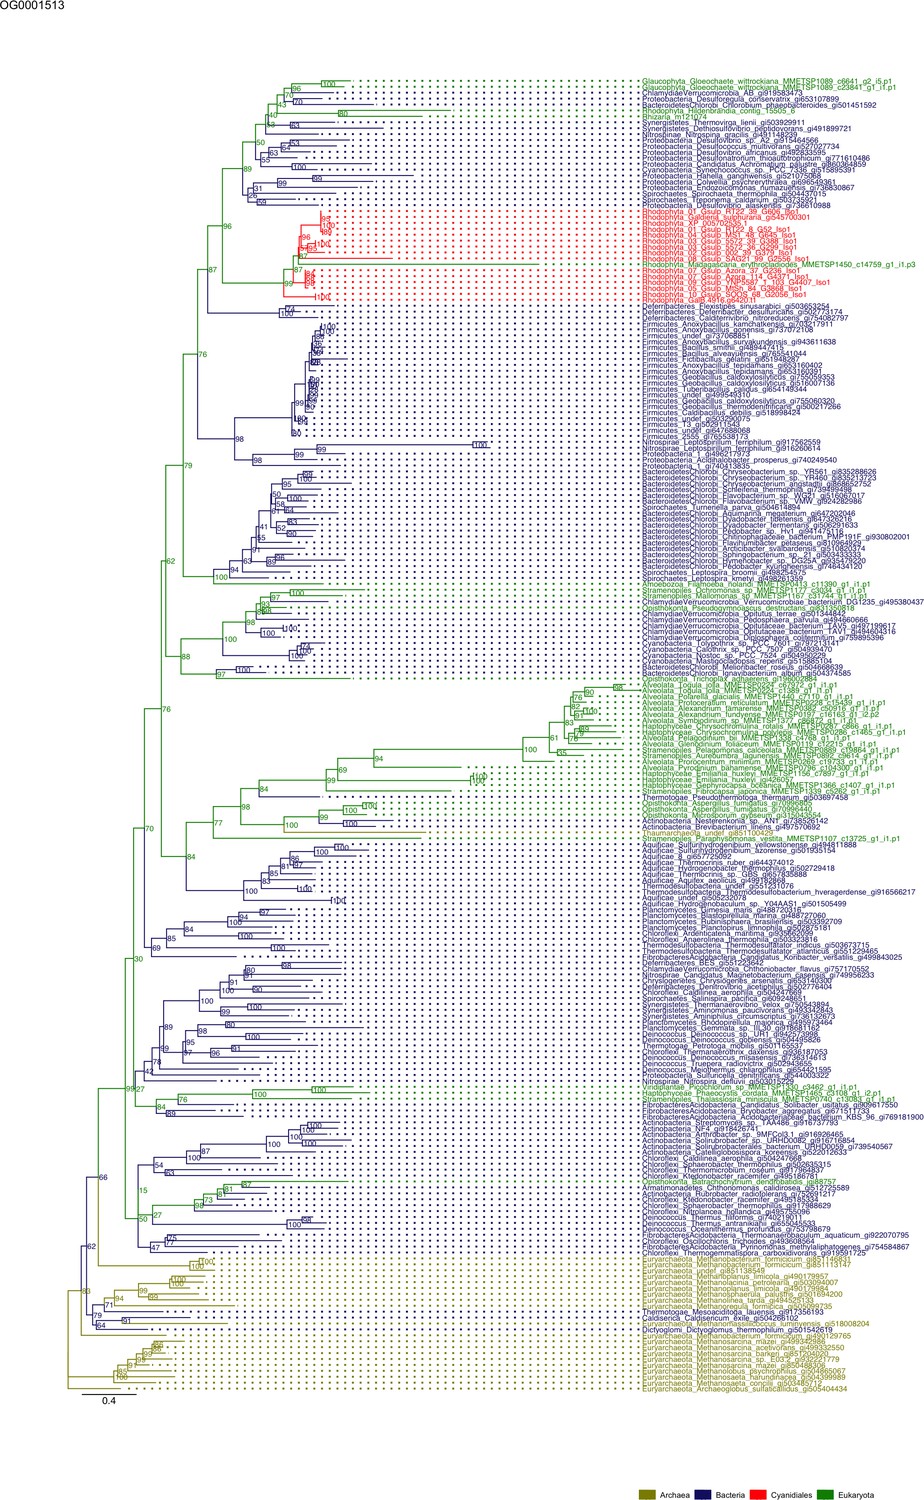
Sequence tree of orthogroup OG0001513.
The tree is based on amino acid sequences. Archaea (yellow), Bacteria (blue), Cyanidiales (red), Eukaryotes including other red algae (green). Branches containing Cyanidiales sequences are highlited in red.
Figure 5—figure supplement 5
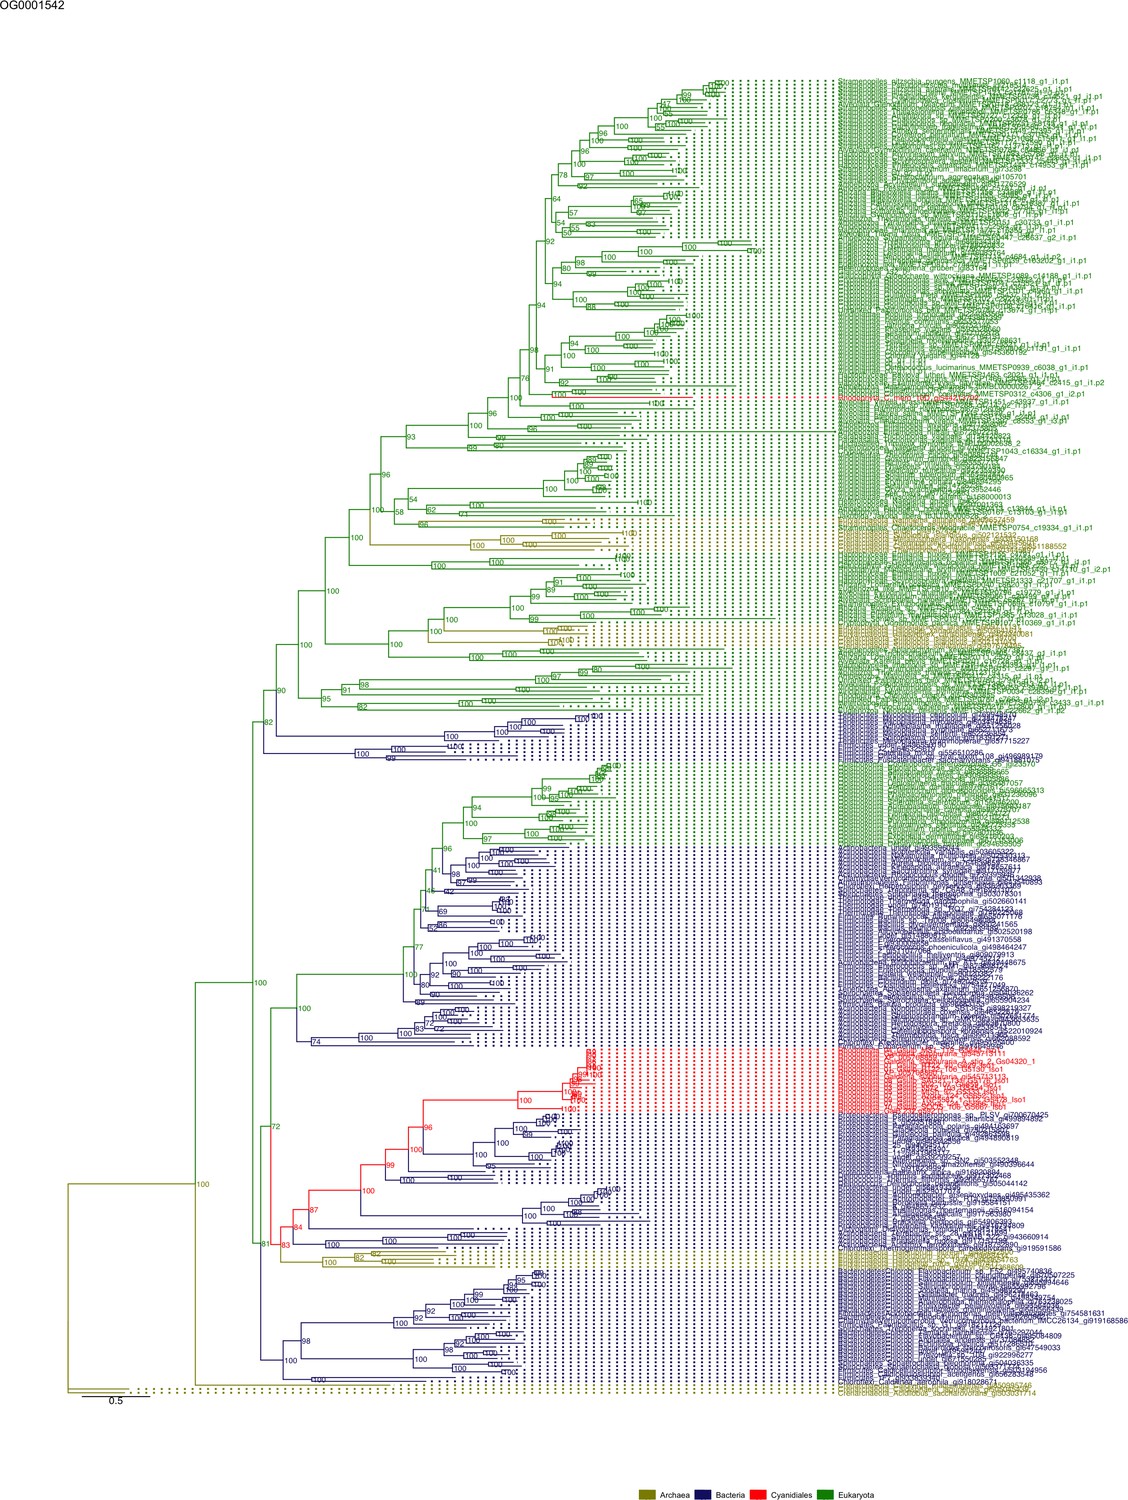
Sequence tree of orthogroup OG0001542.
The tree is based on amino acid sequences. Archaea (yellow), Bacteria (blue), Cyanidiales (red), Eukaryotes including other red algae (green). Branches containing Cyanidiales sequences are highlited in red.
Figure 5—figure supplement 6
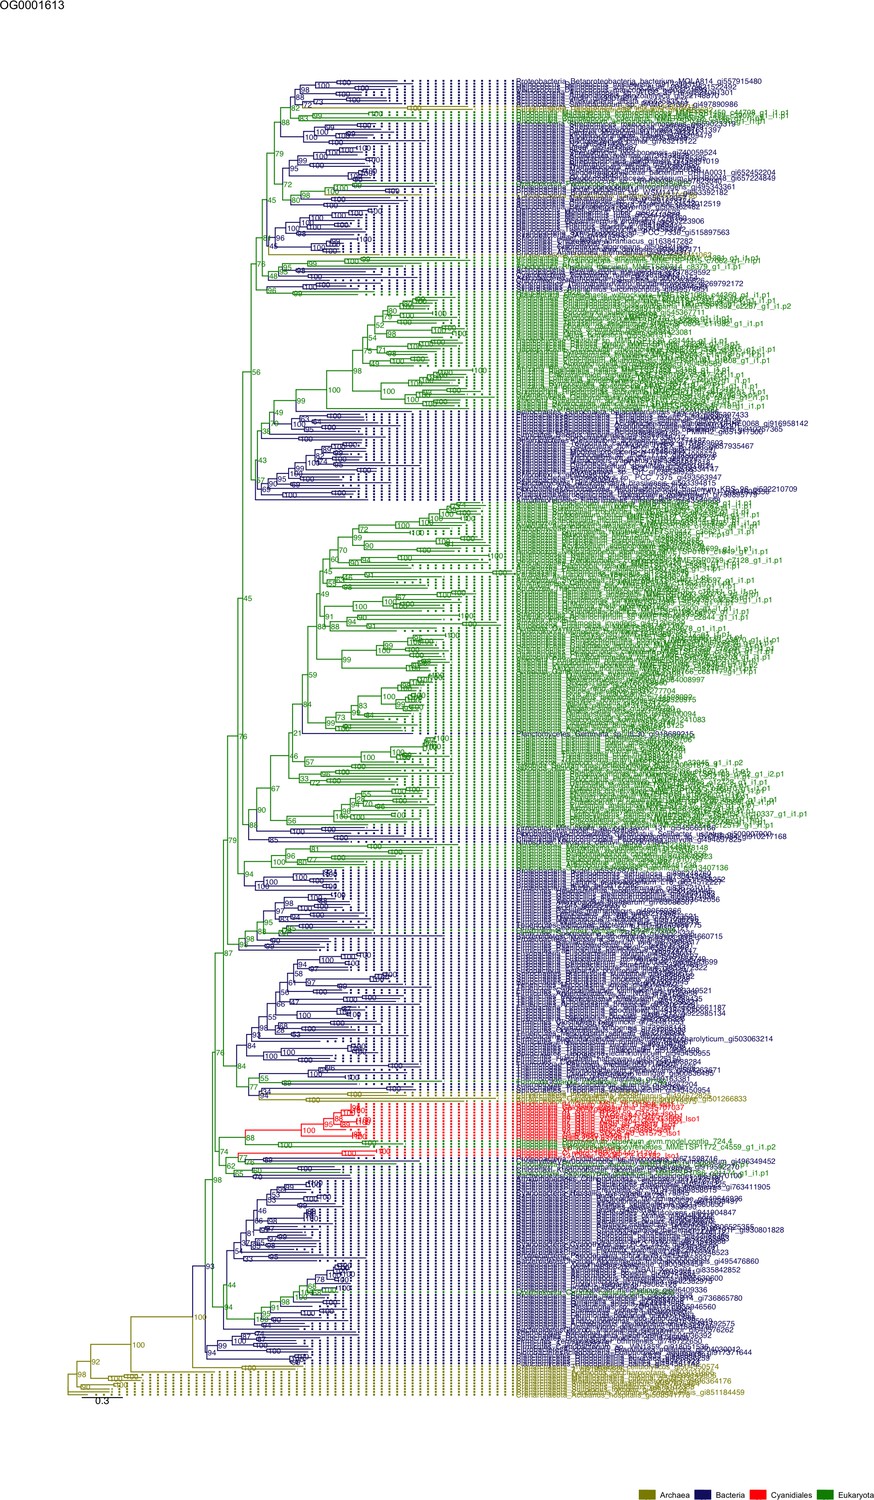
Sequence tree of orthogroup OG0001613.
The tree is based on amino acid sequences. Archaea (yellow), Bacteria (blue), Cyanidiales (red), Eukaryotes including other red algae (green). Branches containing Cyanidiales sequences are highlited in red.
Figure 5—figure supplement 7
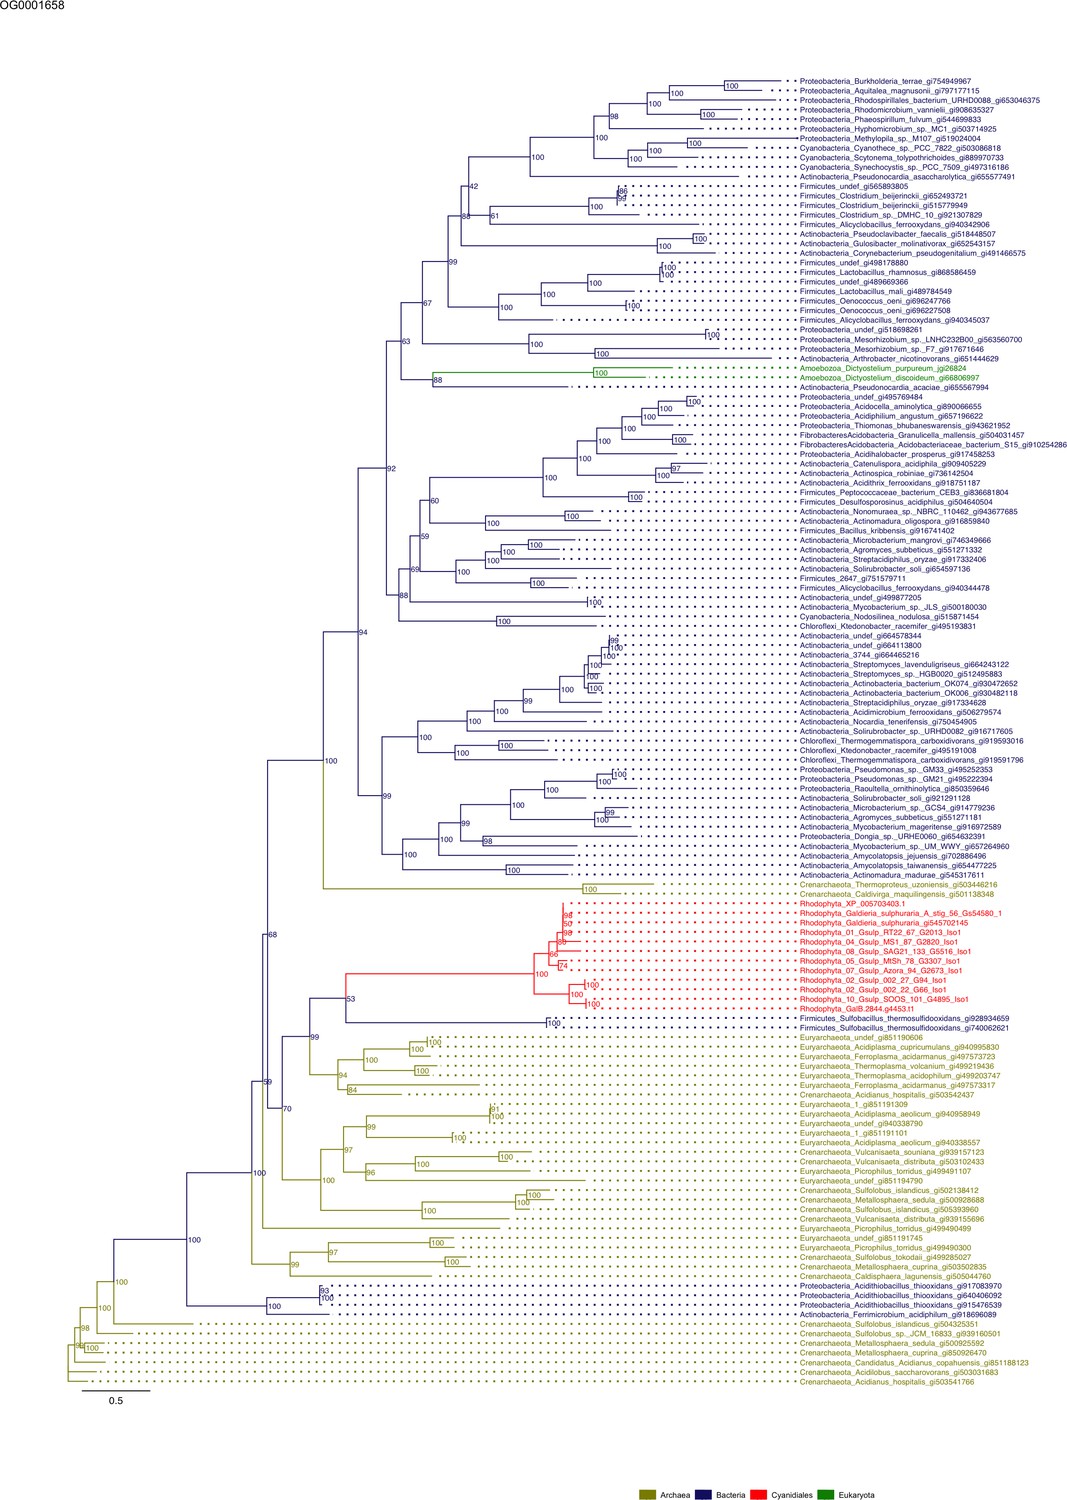
Sequence tree of orthogroup OG0001658.
The tree is based on amino acid sequences. Archaea (yellow), Bacteria (blue), Cyanidiales (red), Eukaryotes including other red algae (green). Branches containing Cyanidiales sequences are highlited in red.
Figure 5—figure supplement 8
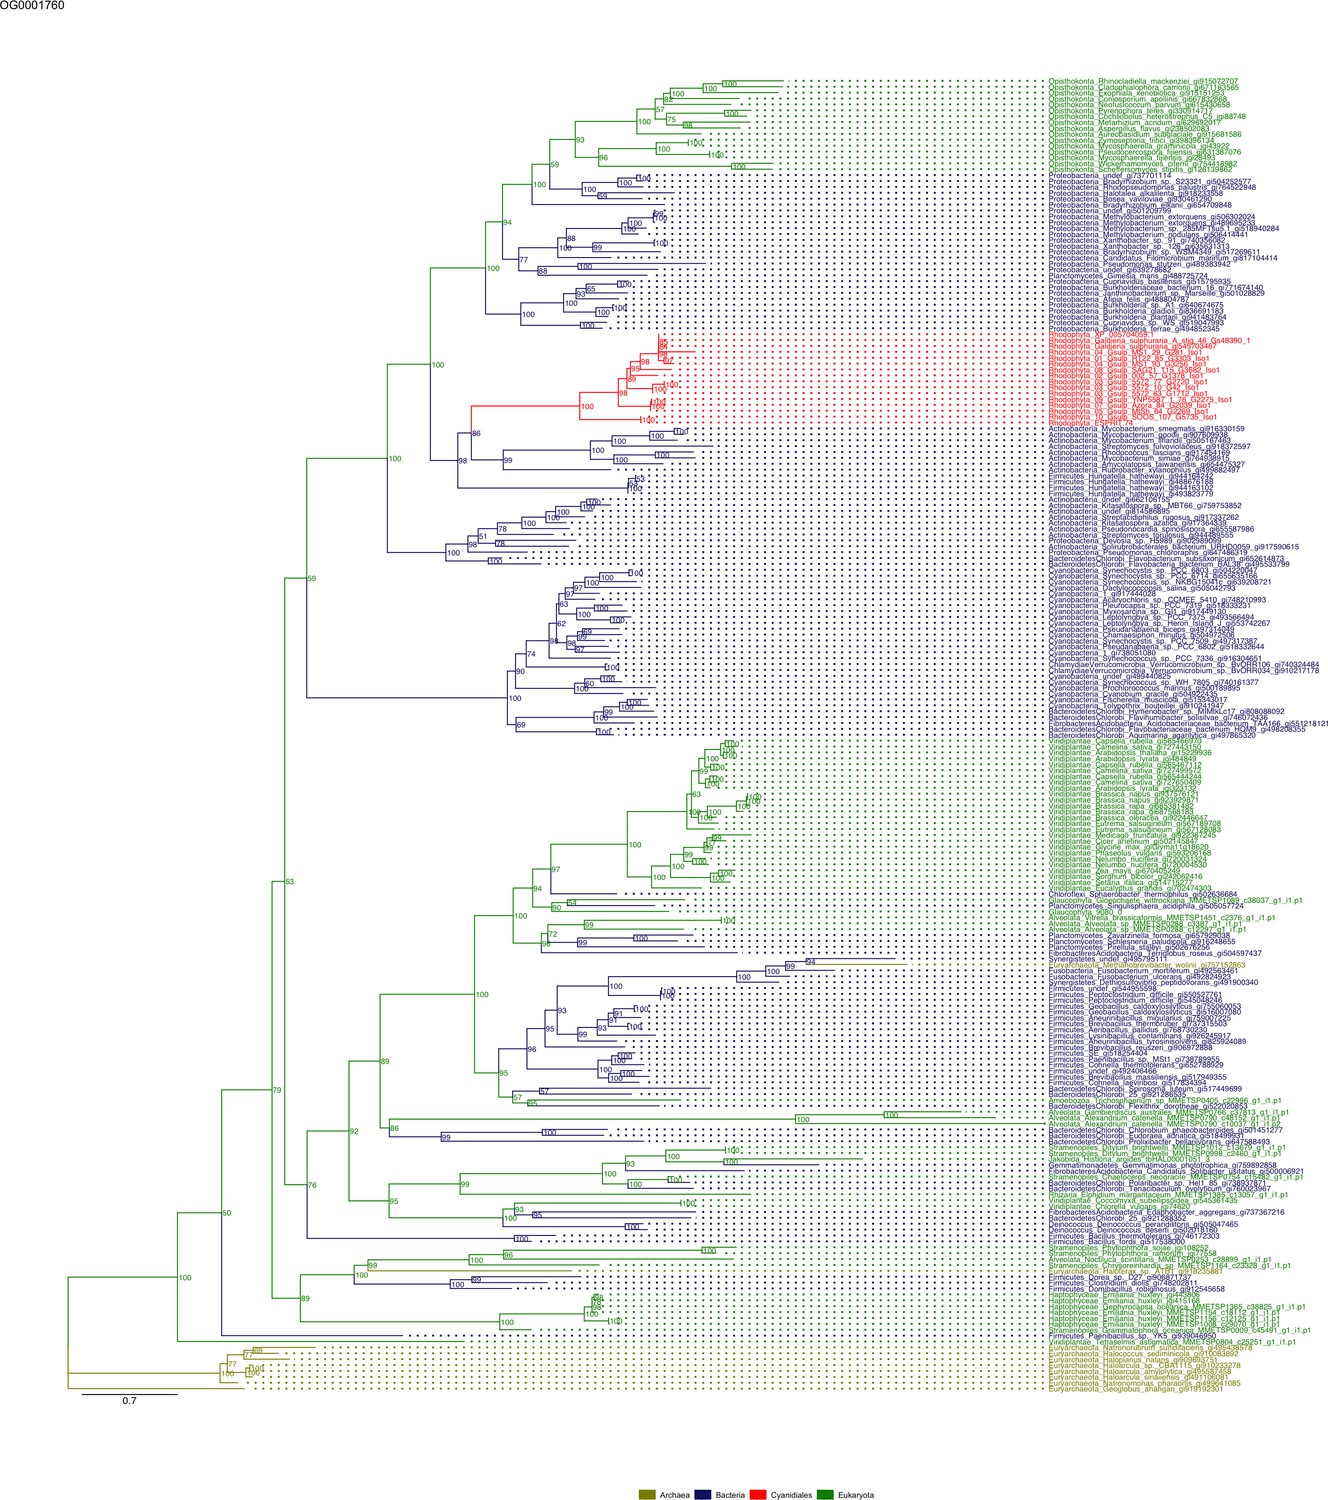
Sequence tree of orthogroup OG0001760.
The tree is based on amino acid sequences. Archaea (yellow), Bacteria (blue), Cyanidiales (red), Eukaryotes including other red algae (green). Branches containing Cyanidiales sequences are highlited in red.
Figure 5—figure supplement 9
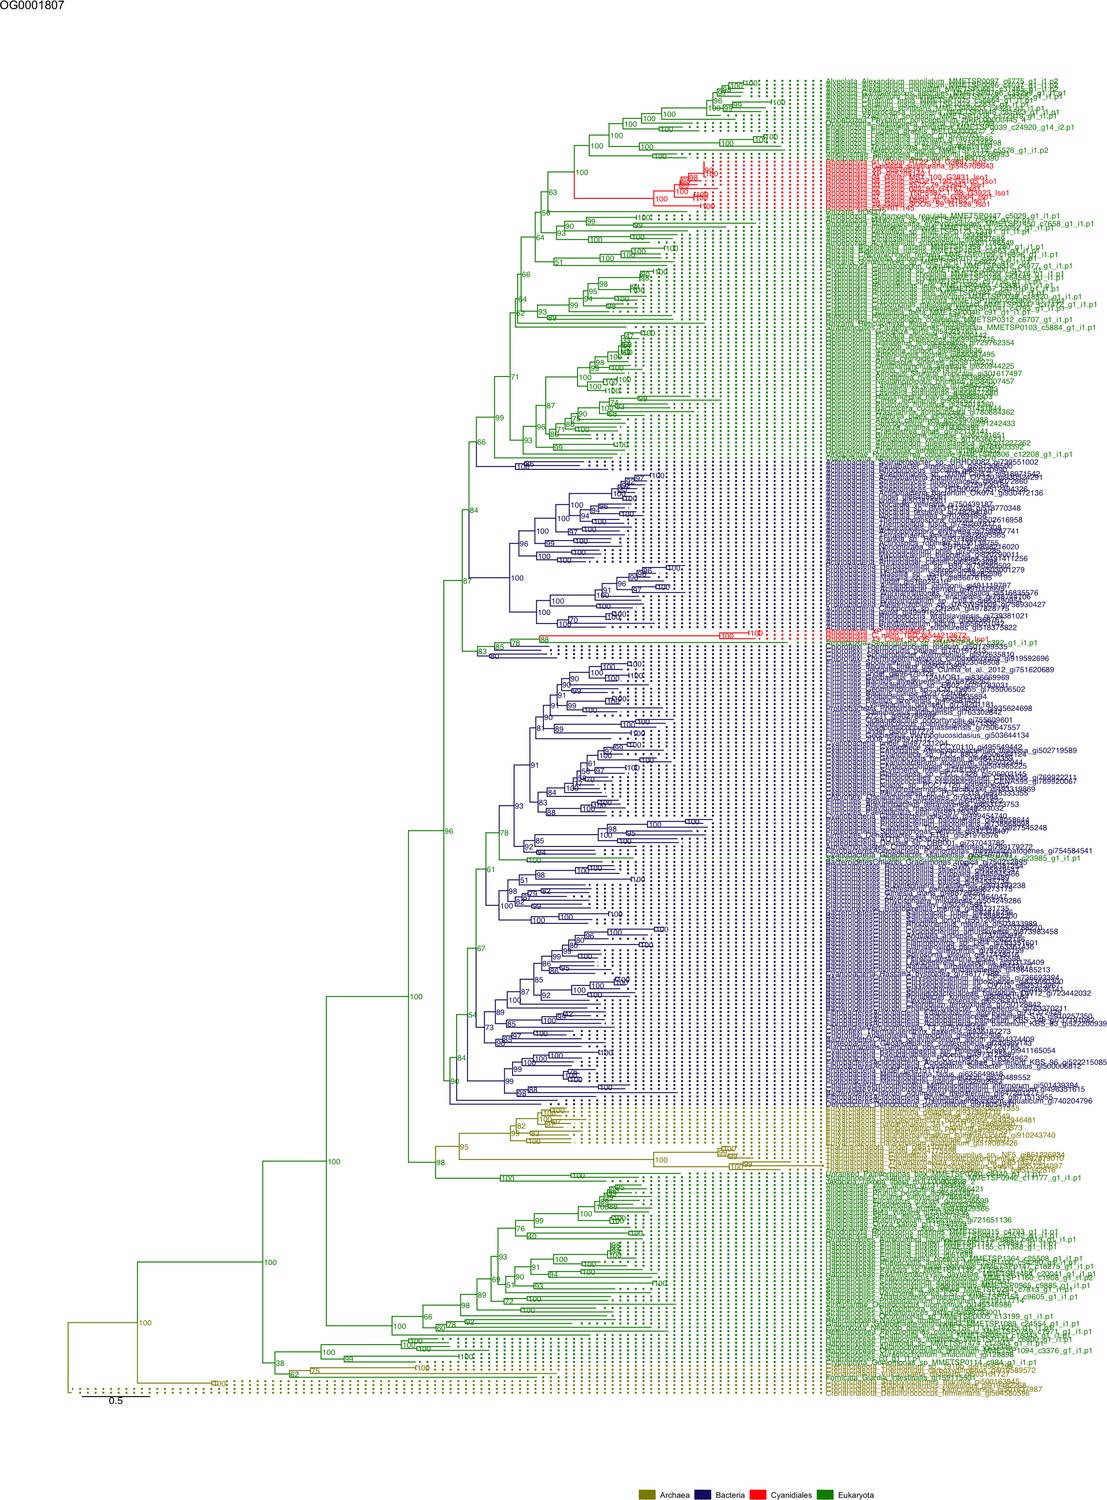
Sequence tree of orthogroup OG0001807.
The tree is based on amino acid sequences. Archaea (yellow), Bacteria (blue), Cyanidiales (red), Eukaryotes including other red algae (green). Branches containing Cyanidiales sequences are highlited in red.
Figure 5—figure supplement 10
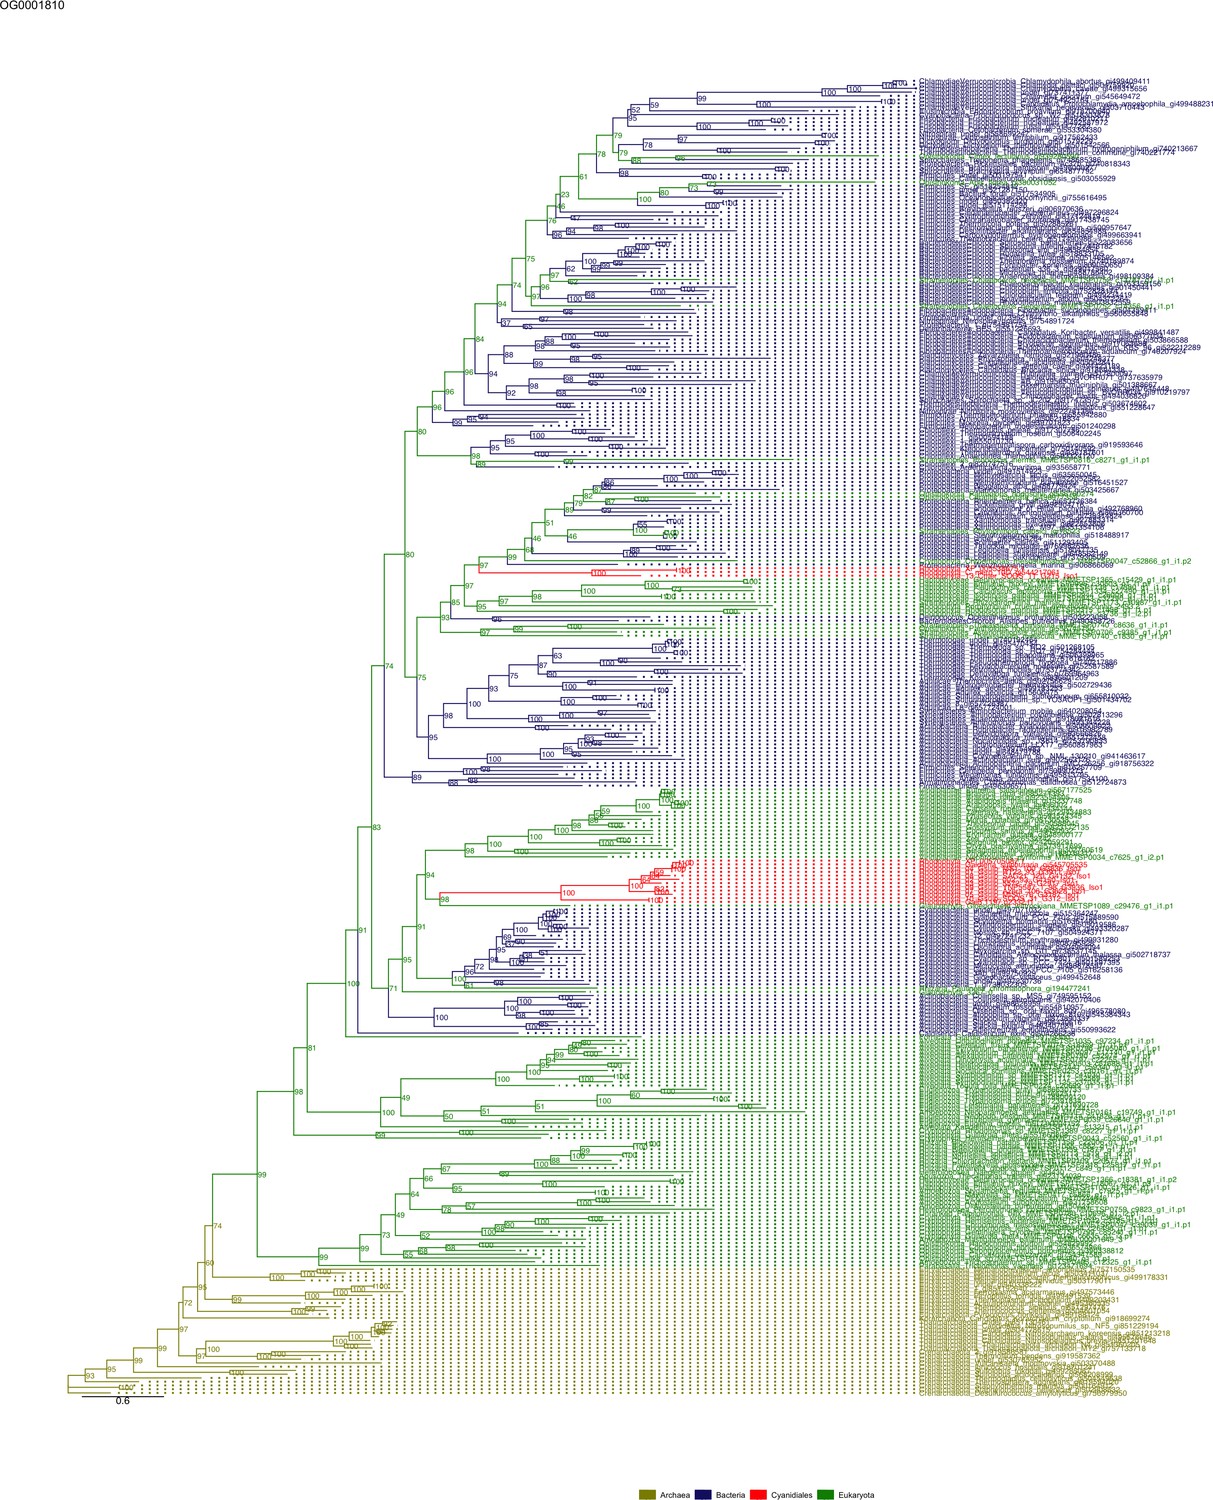
Sequence tree of orthogroup OG0001810.
The tree is based on amino acid sequences. Archaea (yellow), Bacteria (blue), Cyanidiales (red), Eukaryotes including other red algae (green). Branches containing Cyanidiales sequences are highlited in red.
Figure 5—figure supplement 11

Sequence tree of orthogroup OG0001929.
The tree is based on amino acid sequences. Archaea (yellow), Bacteria (blue), Cyanidiales (red), Eukaryotes including other red algae (green). Branches containing Cyanidiales sequences are highlited in red.
Figure 5—figure supplement 12
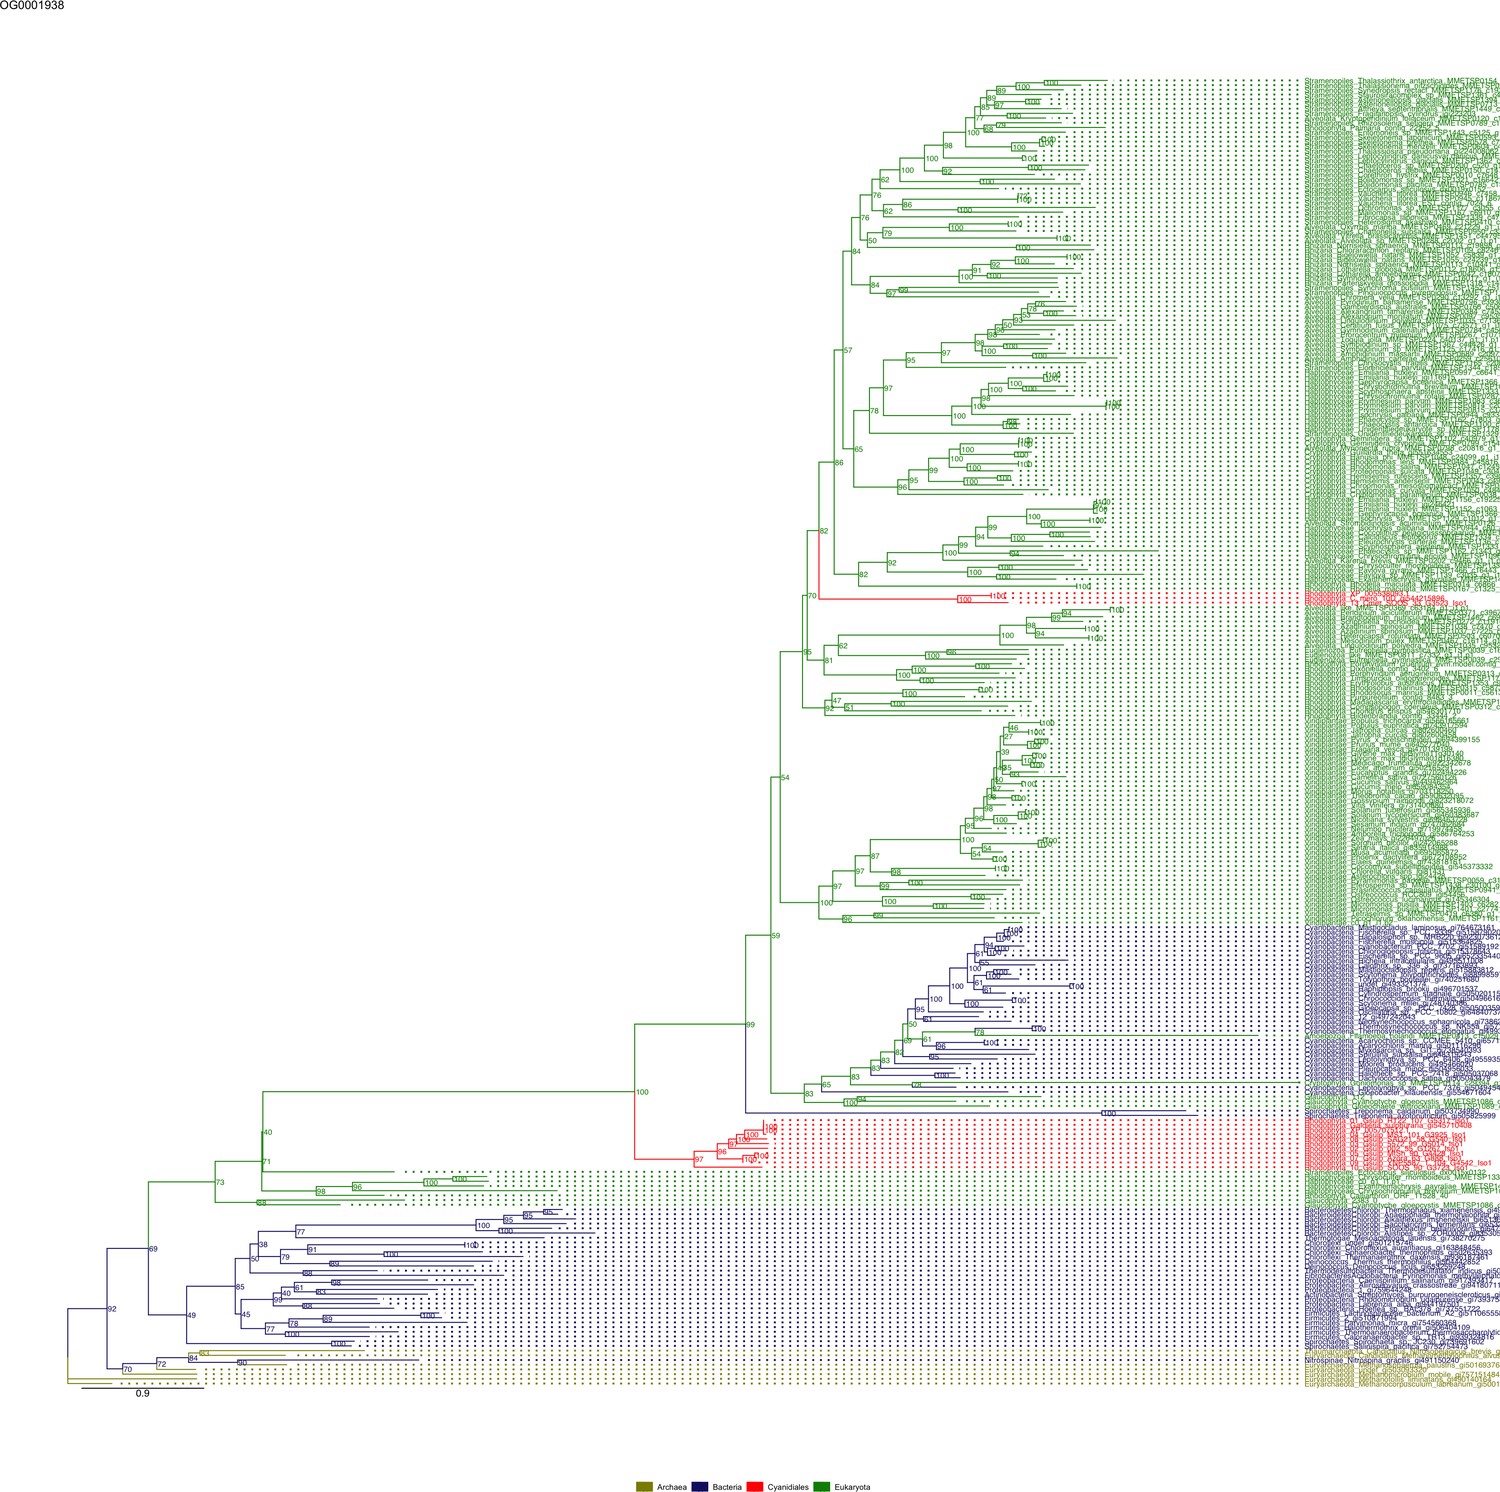
Sequence tree of orthogroup OG0001938.
The tree is based on amino acid sequences. Archaea (yellow), Bacteria (blue), Cyanidiales (red), Eukaryotes including other red algae (green). Branches containing Cyanidiales sequences are highlited in red.
Figure 5—figure supplement 13
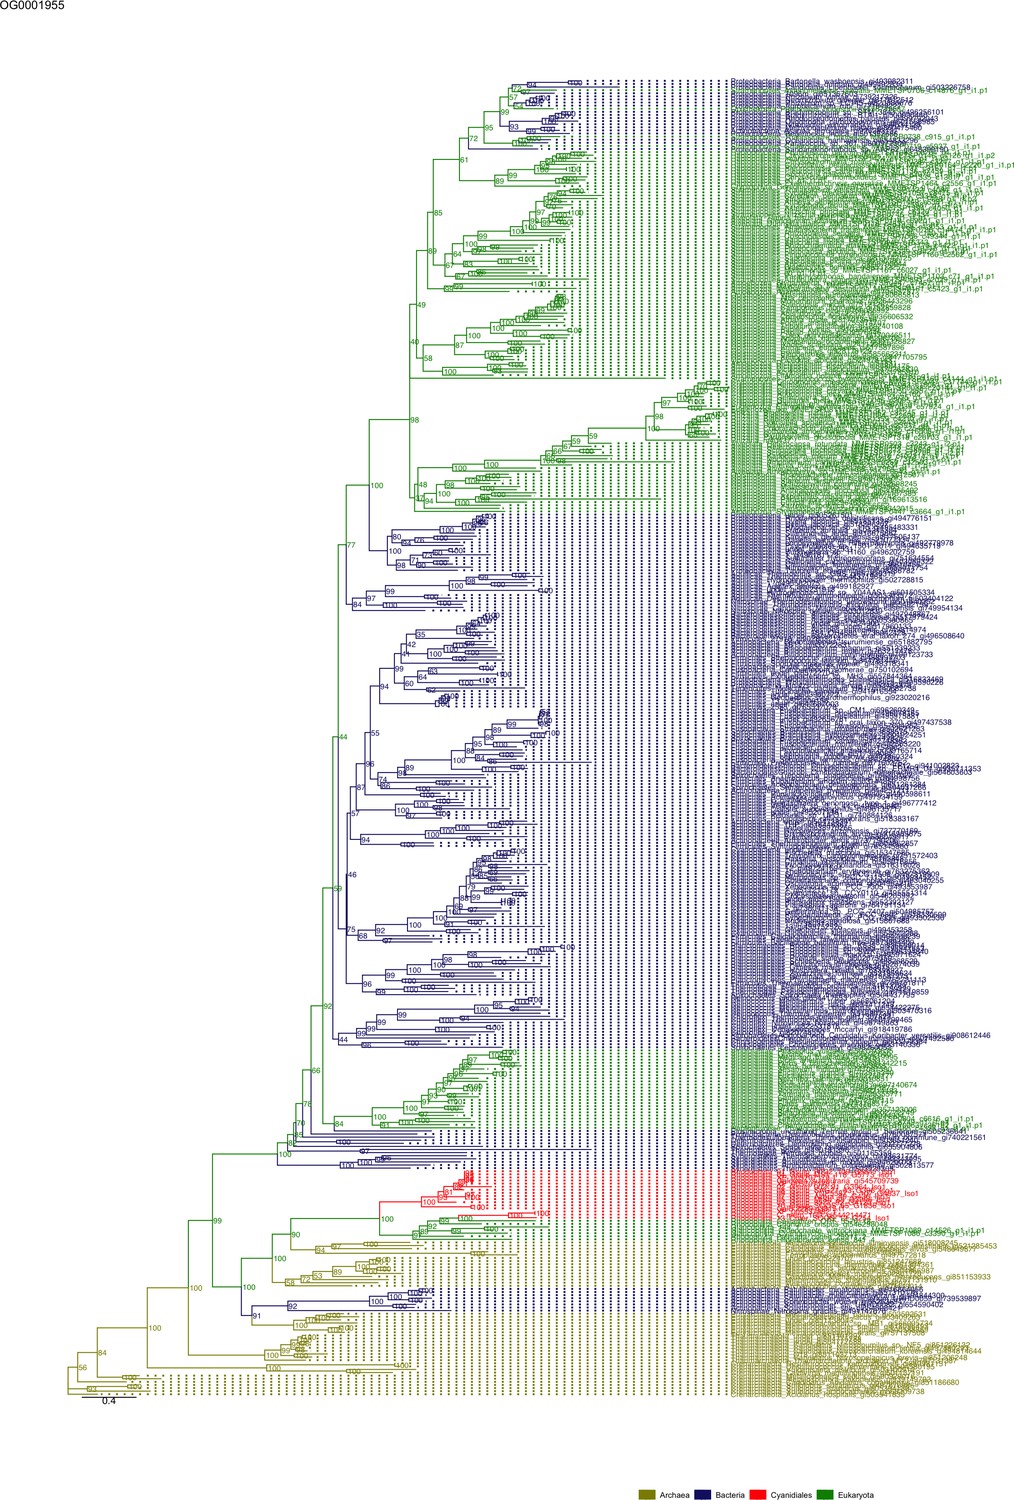
Sequence tree of orthogroup OG0001955.
The tree is based on amino acid sequences. Archaea (yellow), Bacteria (blue), Cyanidiales (red), Eukaryotes including other red algae (green). Branches containing Cyanidiales sequences are highlited in red.
Figure 5—figure supplement 14
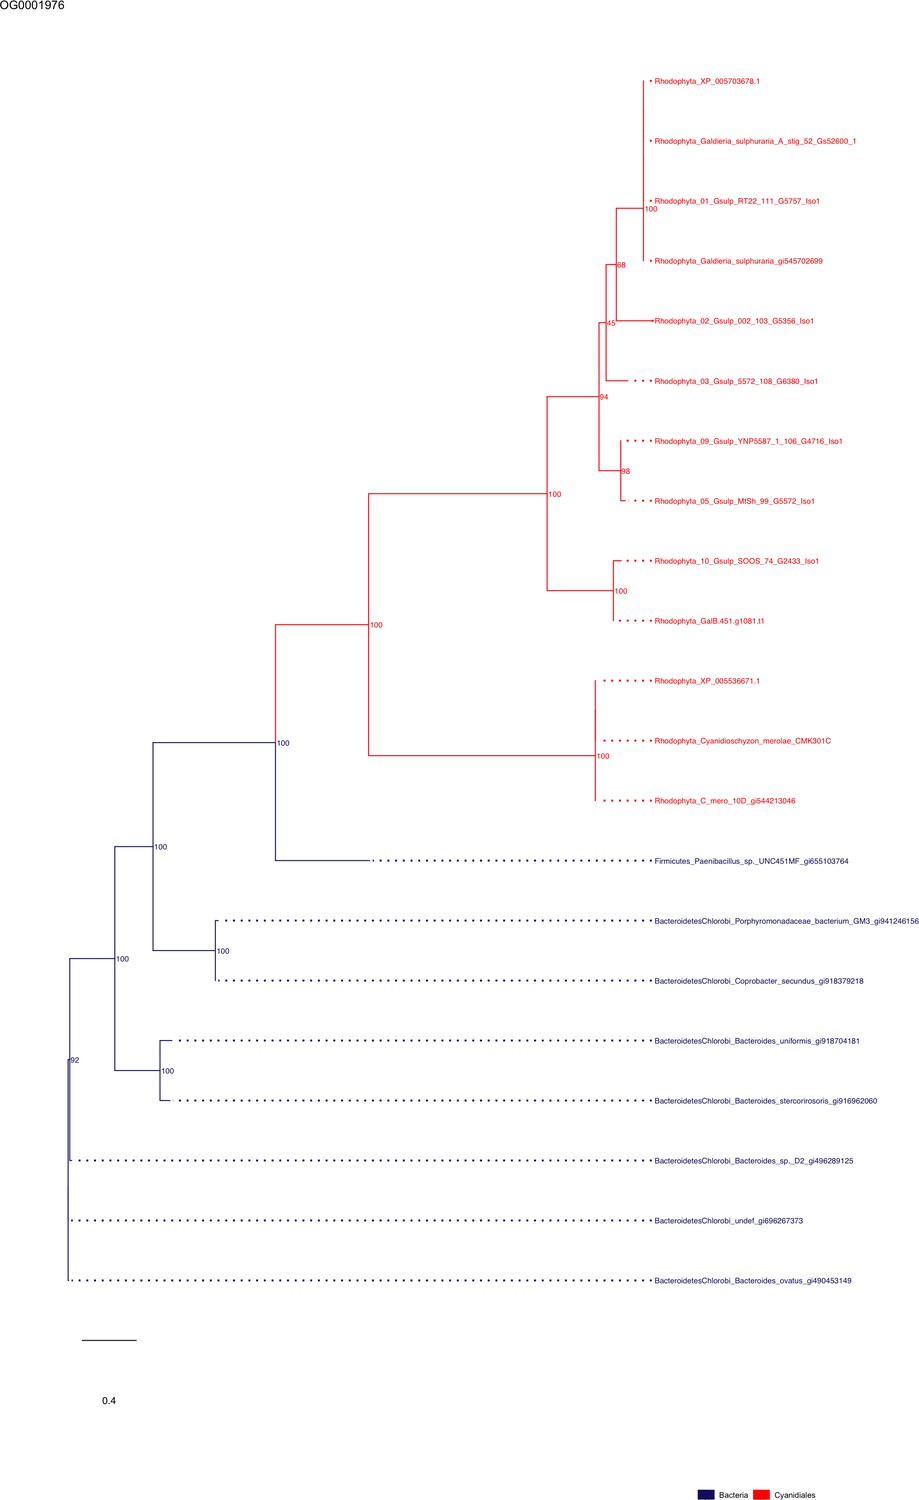
Sequence tree of orthogroup OG0001976.
The tree is based on amino acid sequences. Archaea (yellow), Bacteria (blue), Cyanidiales (red), Eukaryotes including other red algae (green). Branches containing Cyanidiales sequences are highlited in red.
Figure 5—figure supplement 15
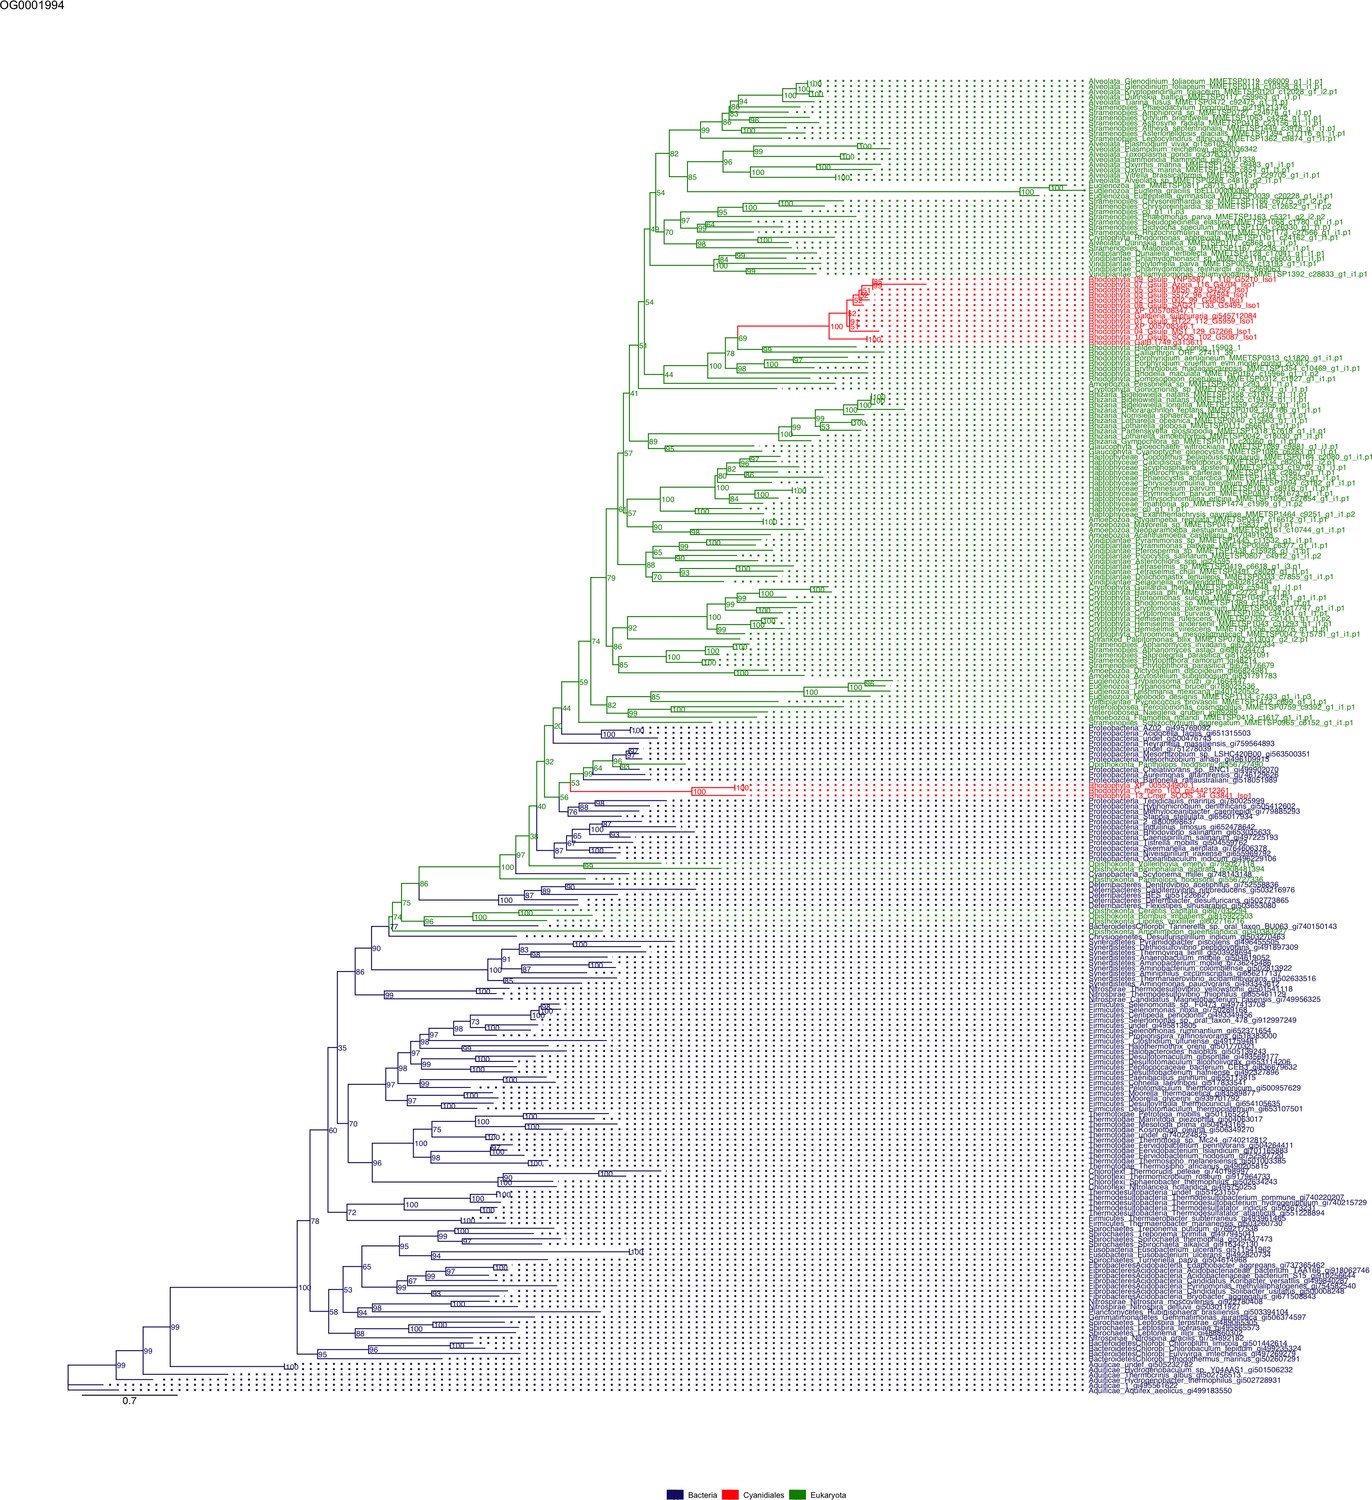
Sequence tree of orthogroup OG0001994.
The tree is based on amino acid sequences. Archaea (yellow), Bacteria (blue), Cyanidiales (red), Eukaryotes including other red algae (green). Branches containing Cyanidiales sequences are highlited in red.
Figure 5—figure supplement 16
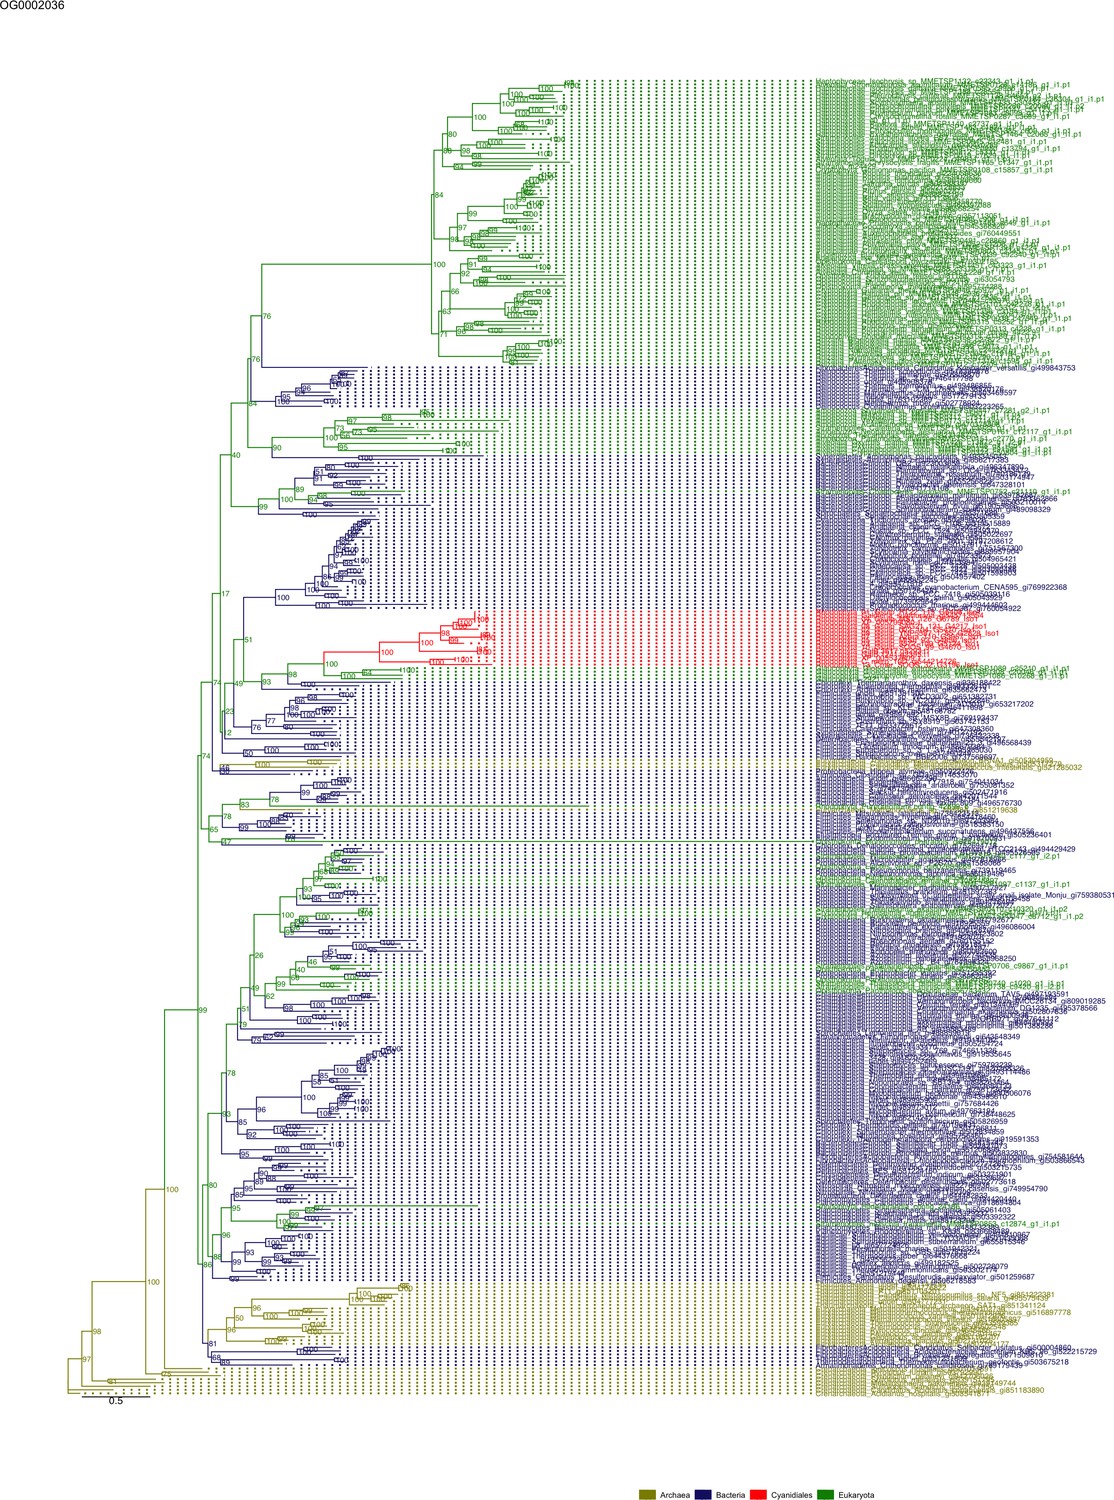
Sequence tree of orthogroup OG0002036.
The tree is based on amino acid sequences. Archaea (yellow), Bacteria (blue), Cyanidiales (red), Eukaryotes including other red algae (green). Branches containing Cyanidiales sequences are highlited in red.
Figure 5—figure supplement 17
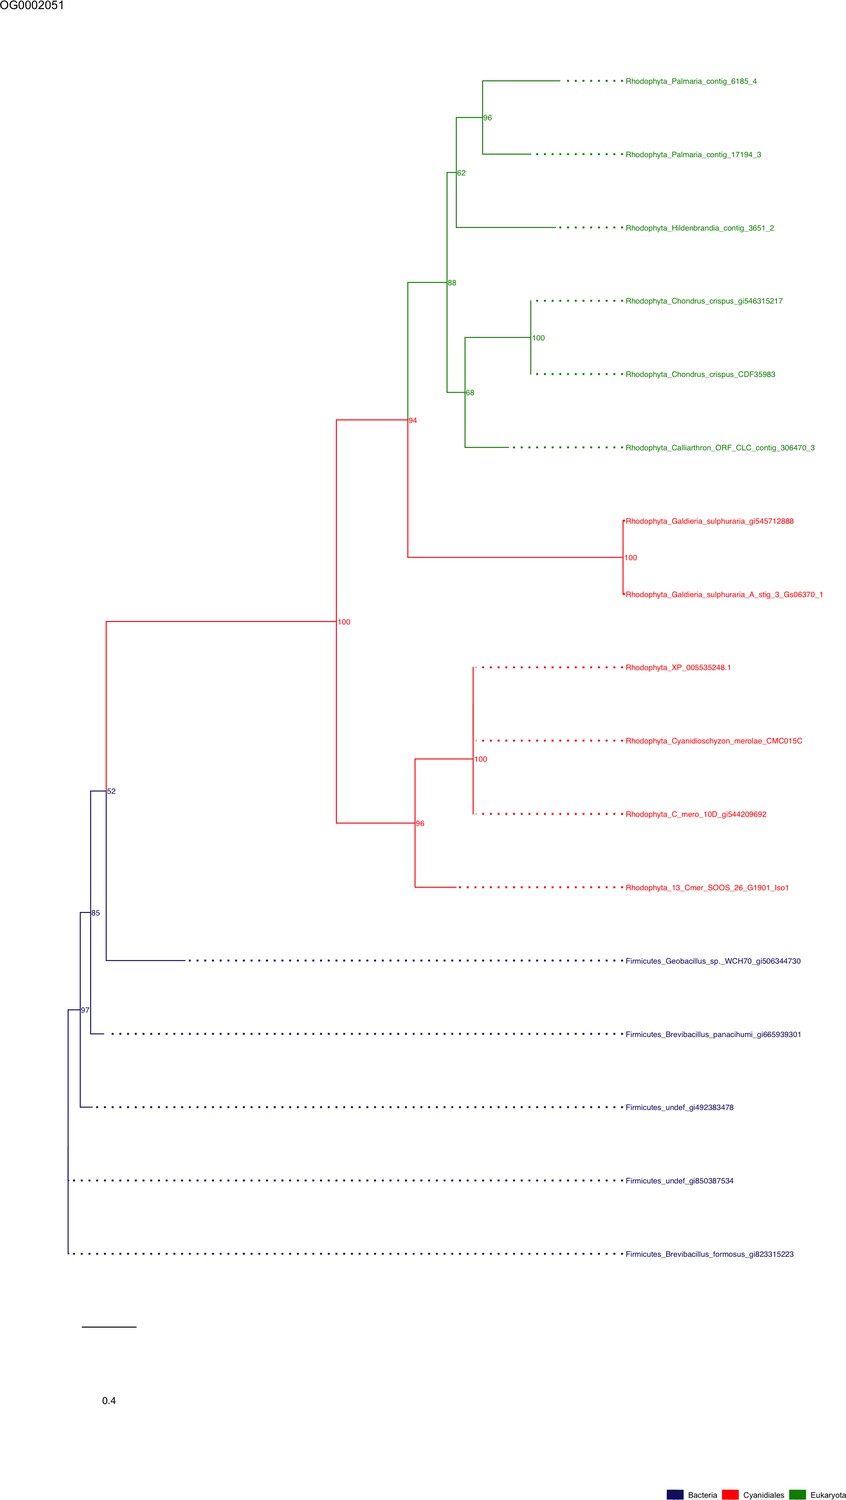
Sequence tree of orthogroup OG0002051.
The tree is based on amino acid sequences. Archaea (yellow), Bacteria (blue), Cyanidiales (red), Eukaryotes including other red algae (green). Branches containing Cyanidiales sequences are highlited in red.
Figure 5—figure supplement 18
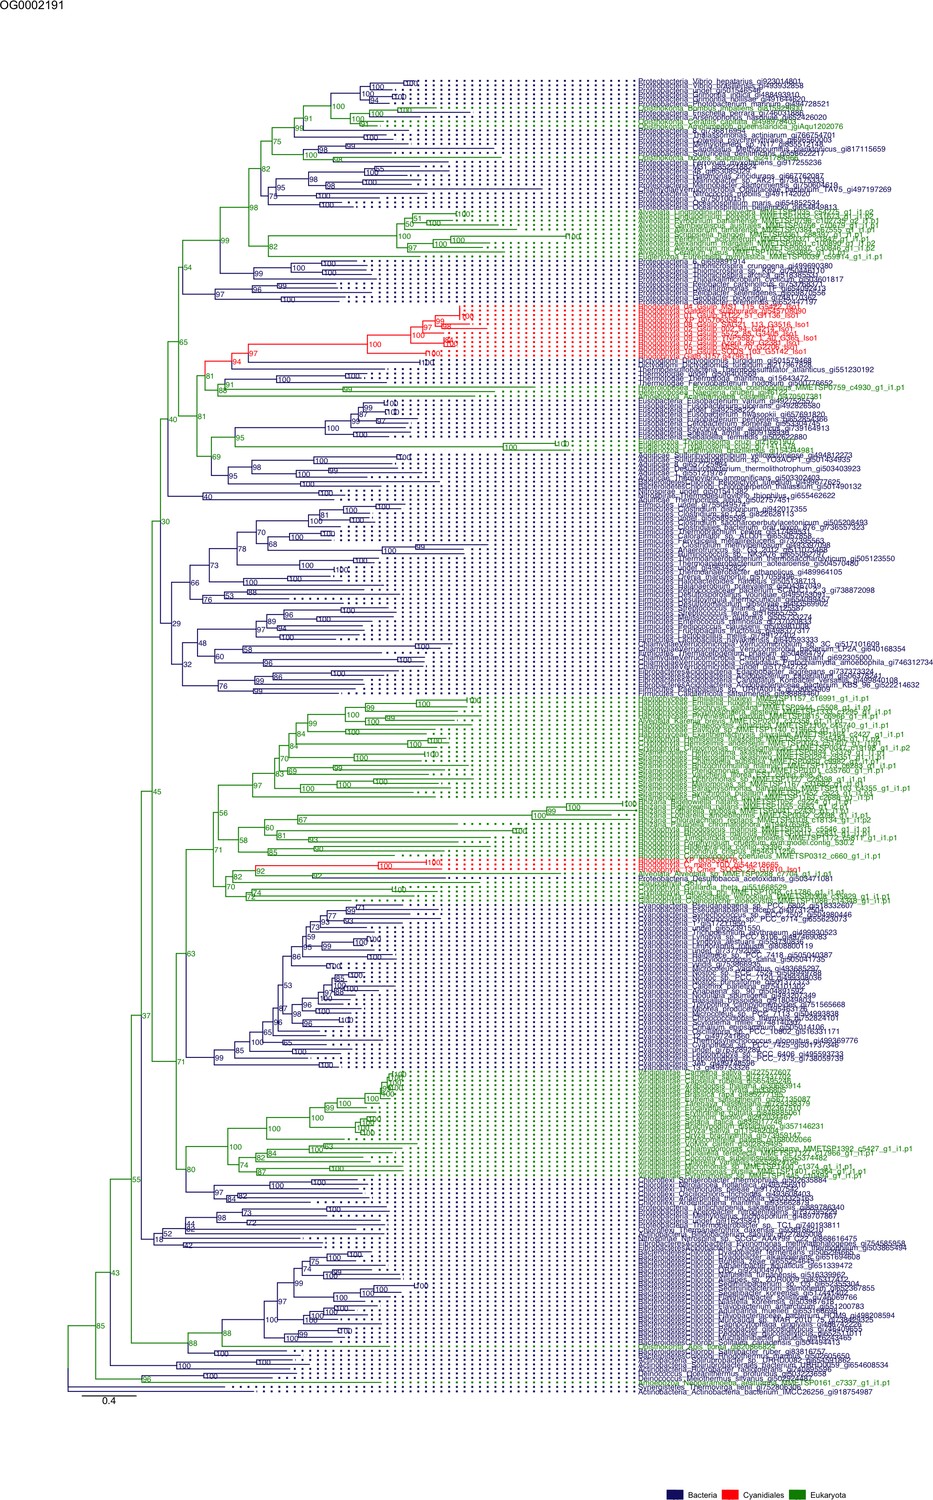
Sequence tree of orthogroup OG0002191.
The tree is based on amino acid sequences. Archaea (yellow), Bacteria (blue), Cyanidiales (red), Eukaryotes including other red algae (green). Branches containing Cyanidiales sequences are highlited in red.
Figure 5—figure supplement 19
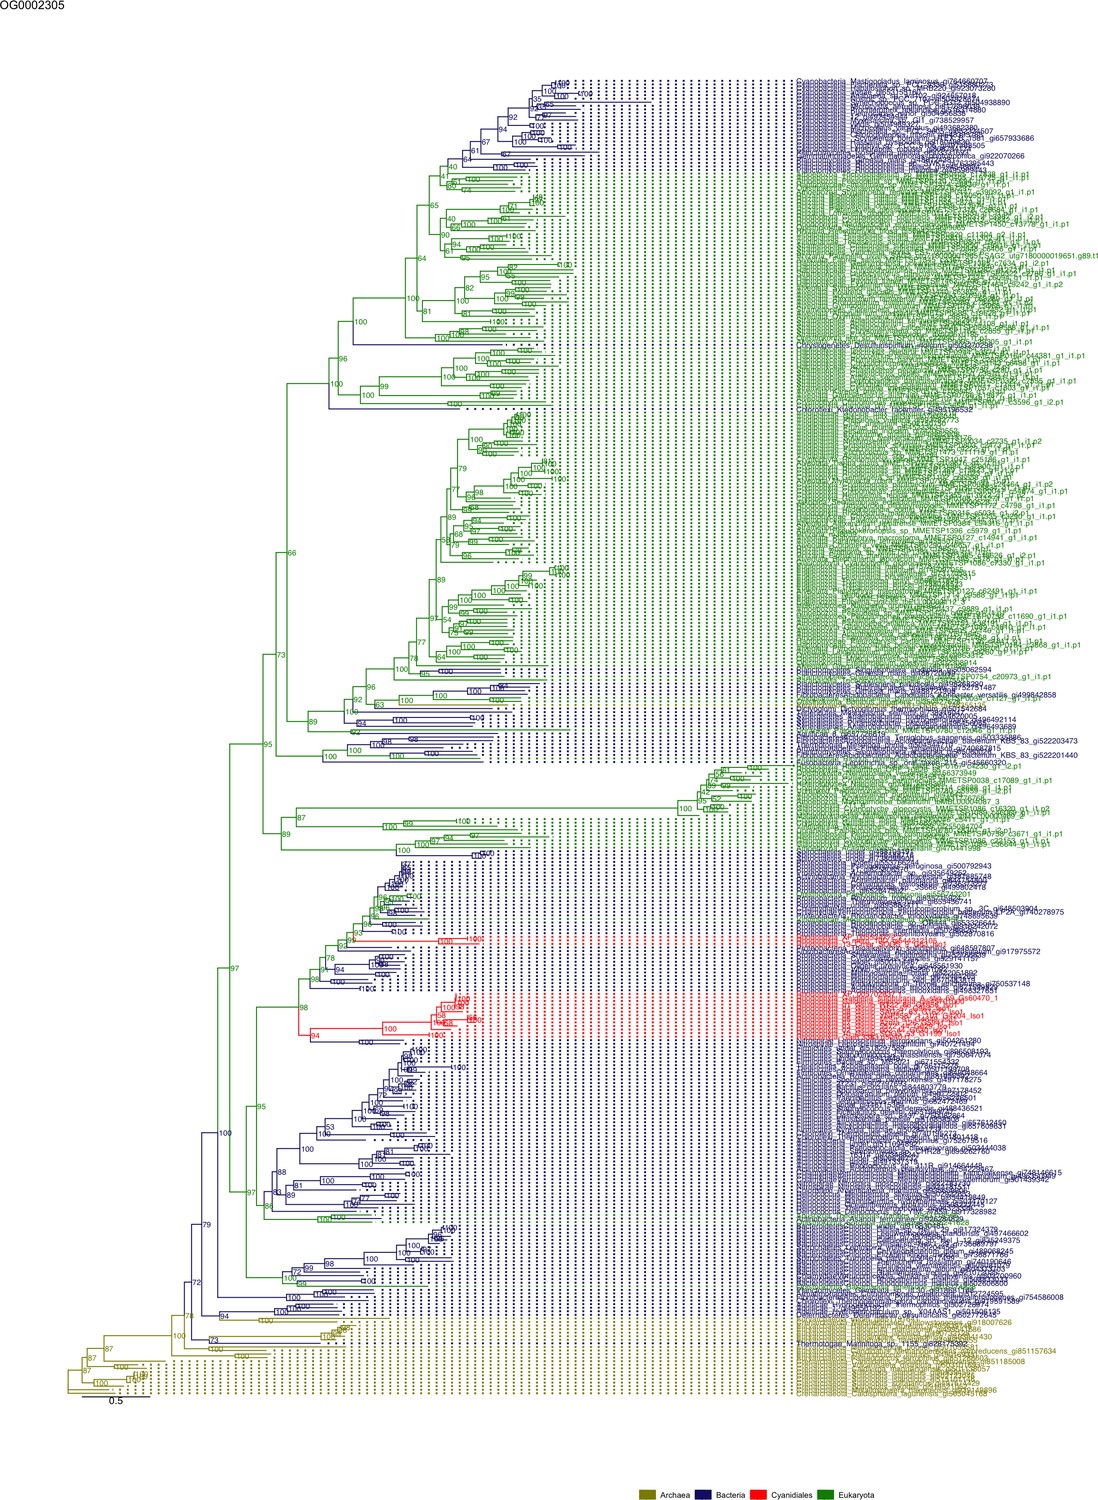
Sequence tree of orthogroup OG0002305.
The tree is based on amino acid sequences. Archaea (yellow), Bacteria (blue), Cyanidiales (red), Eukaryotes including other red algae (green). Branches containing Cyanidiales sequences are highlited in red.
Figure 5—figure supplement 20
Sequence tree of orthogroup OG0002337.
The tree is based on amino acid sequences. Archaea (yellow), Bacteria (blue), Cyanidiales (red), Eukaryotes including other red algae (green). Branches containing Cyanidiales sequences are highlited in red.
Figure 5—figure supplement 21
Sequence tree of orthogroup OG0002431.
The tree is based on amino acid sequences. Archaea (yellow), Bacteria (blue), Cyanidiales (red), Eukaryotes including other red algae (green). Branches containing Cyanidiales sequences are highlited in red.
Figure 5—figure supplement 22
Sequence tree of orthogroup OG0002483.
The tree is based on amino acid sequences. Archaea (yellow), Bacteria (blue), Cyanidiales (red), Eukaryotes including other red algae (green). Branches containing Cyanidiales sequences are highlited in red.
Figure 5—figure supplement 23
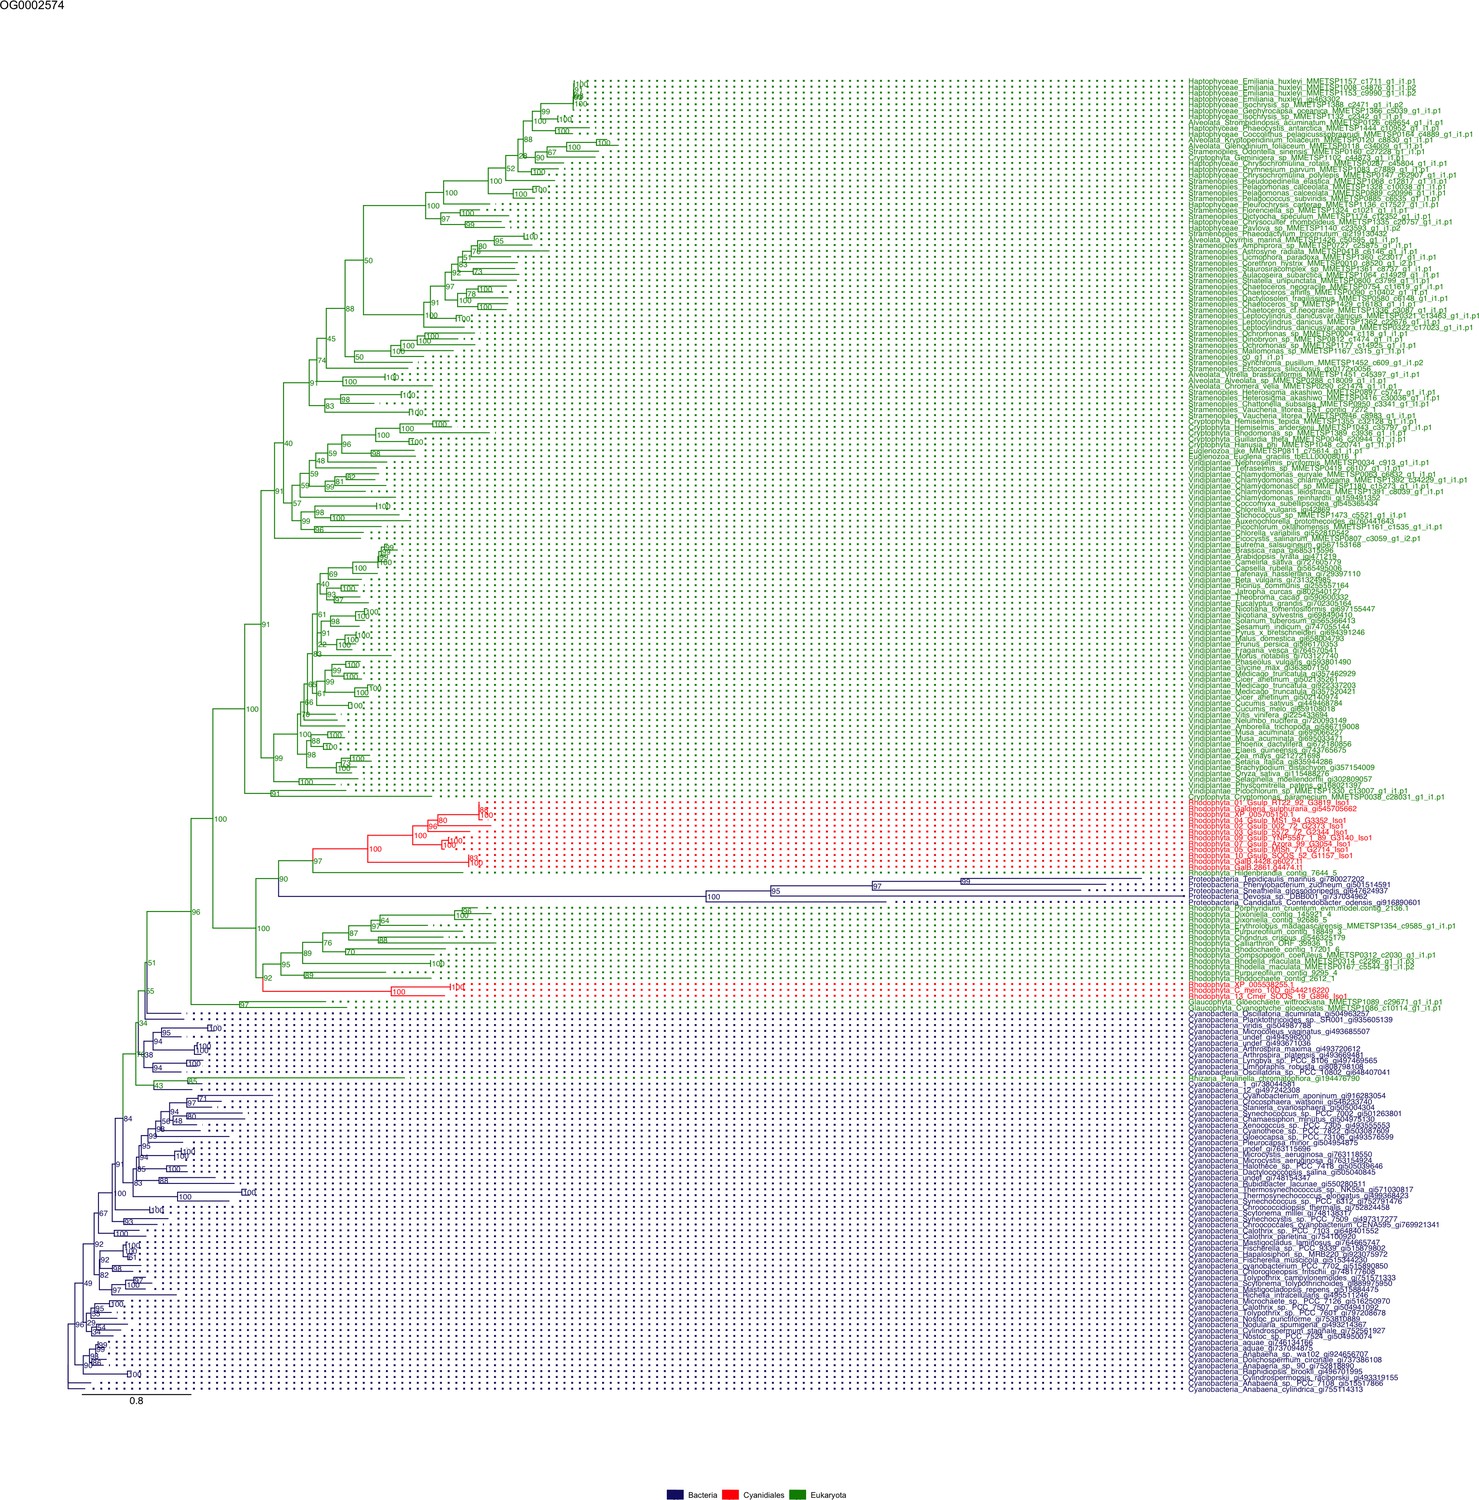
Sequence tree of orthogroup OG0002574.
The tree is based on amino acid sequences. Archaea (yellow), Bacteria (blue), Cyanidiales (red), Eukaryotes including other red algae (green). Branches containing Cyanidiales sequences are highlited in red.
Figure 5—figure supplement 24
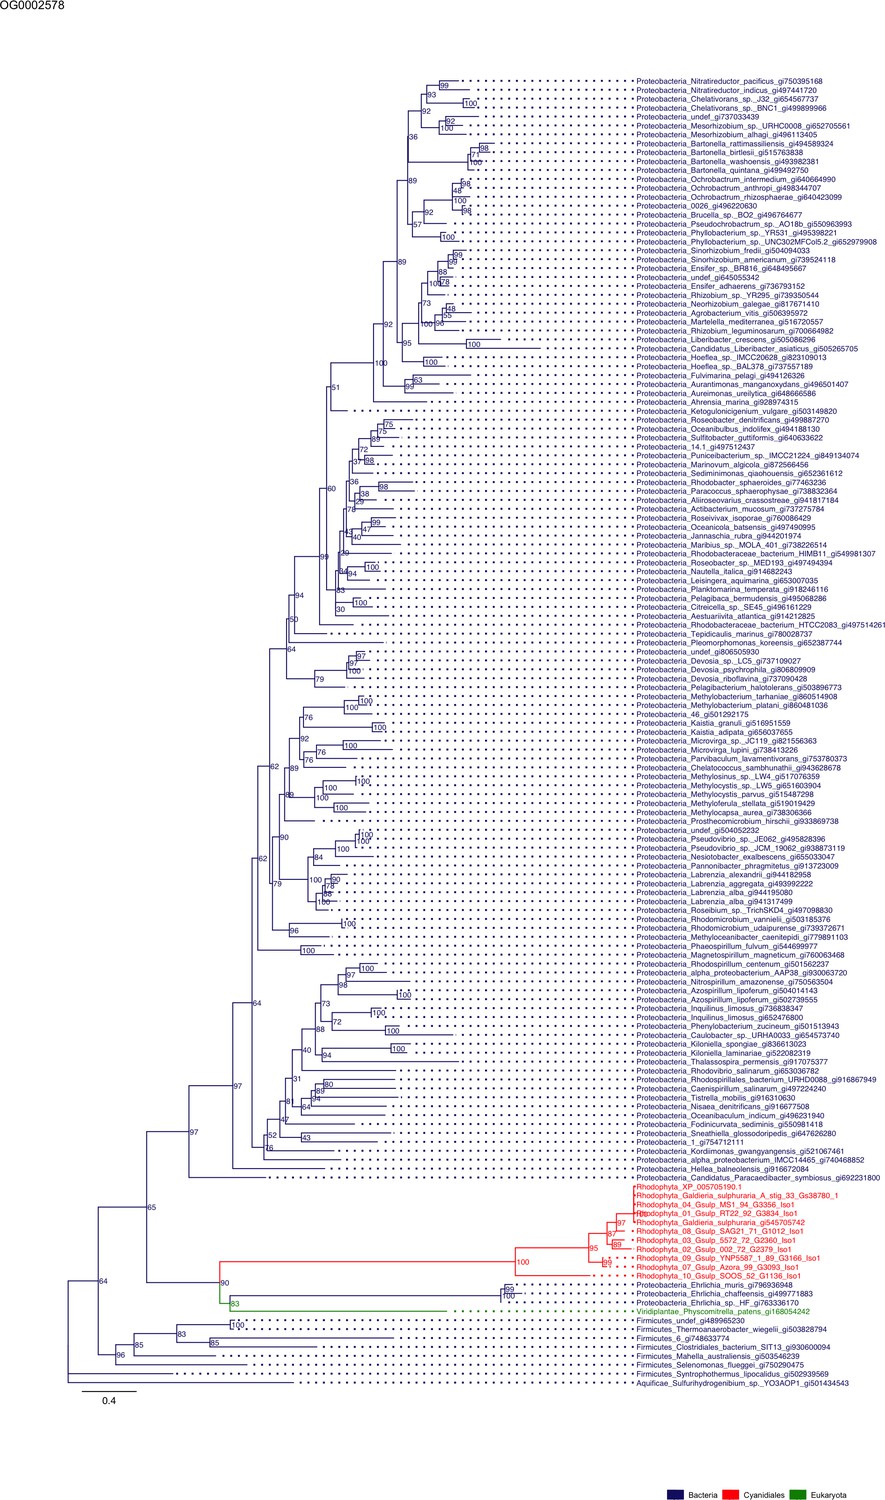
Sequence tree of orthogroup OG0002578.
The tree is based on amino acid sequences. Archaea (yellow), Bacteria (blue), Cyanidiales (red), Eukaryotes including other red algae (green). Branches containing Cyanidiales sequences are highlited in red.
Figure 5—figure supplement 25
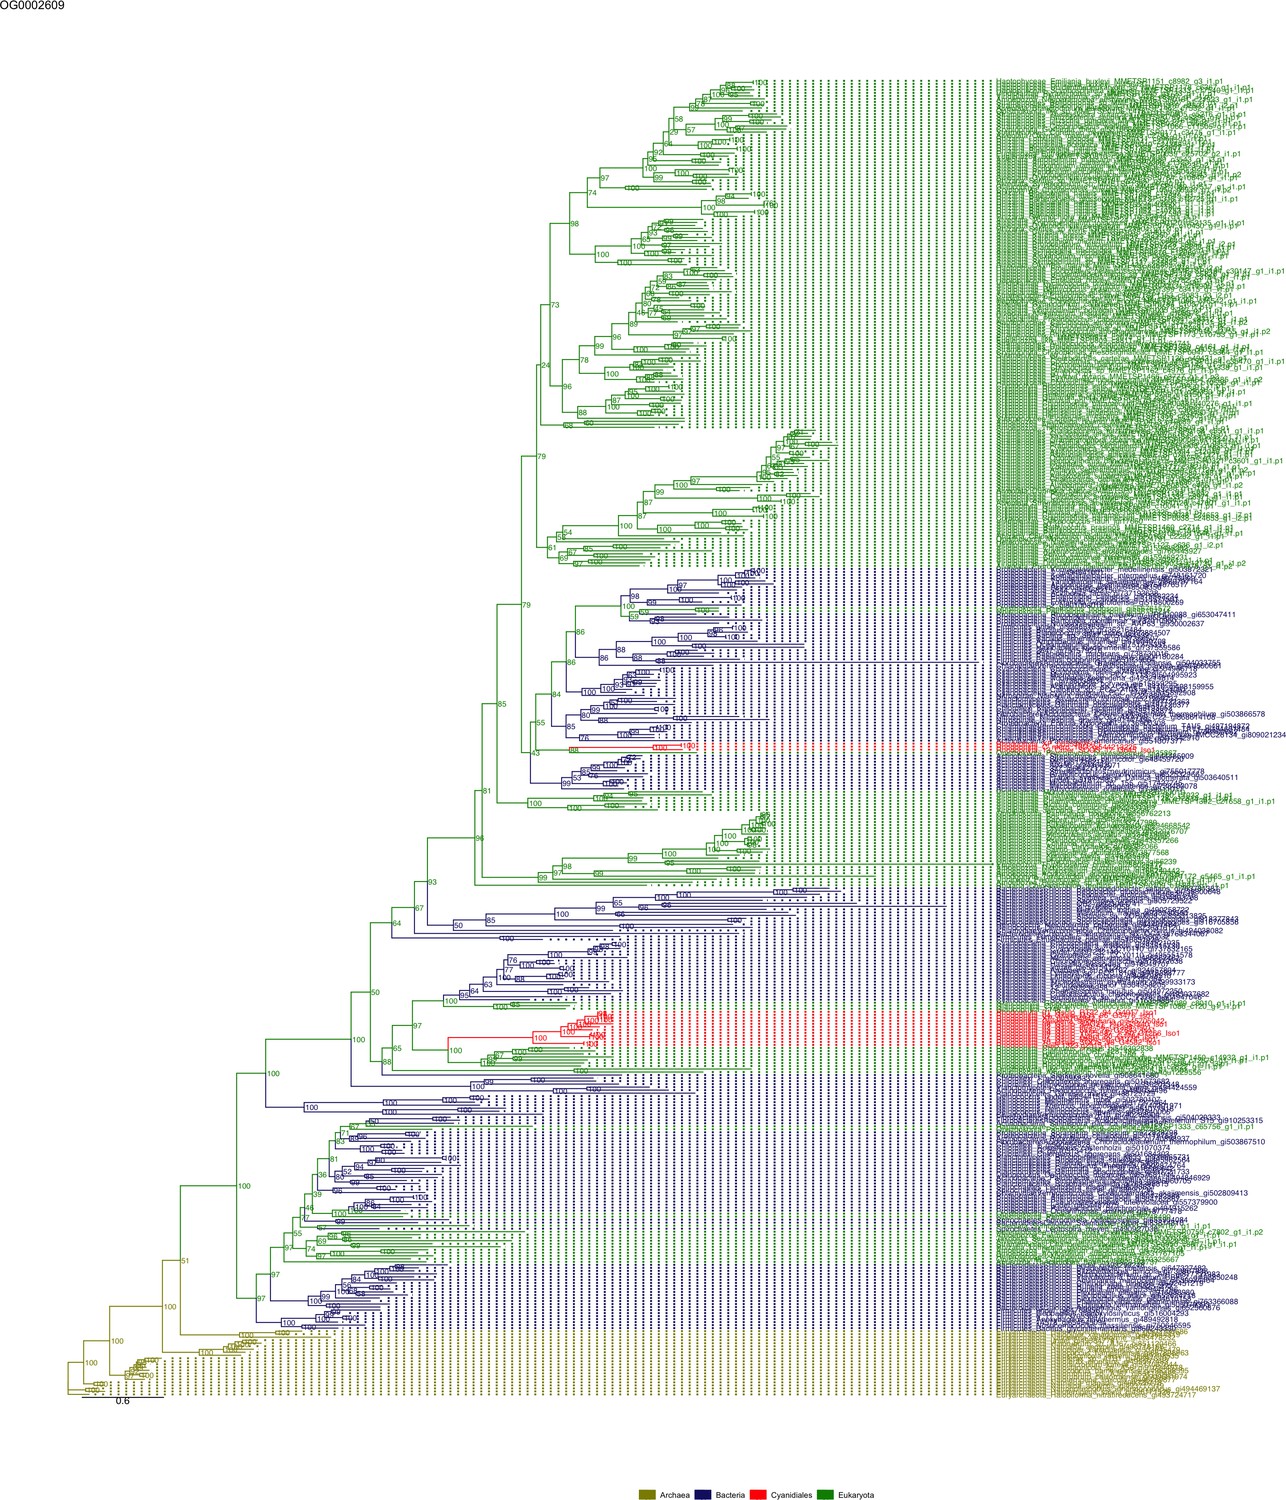
Sequence tree of orthogroup OG0002609.
The tree is based on amino acid sequences. Archaea (yellow), Bacteria (blue), Cyanidiales (red), Eukaryotes including other red algae (green). Branches containing Cyanidiales sequences are highlited in red.
Figure 5—figure supplement 26
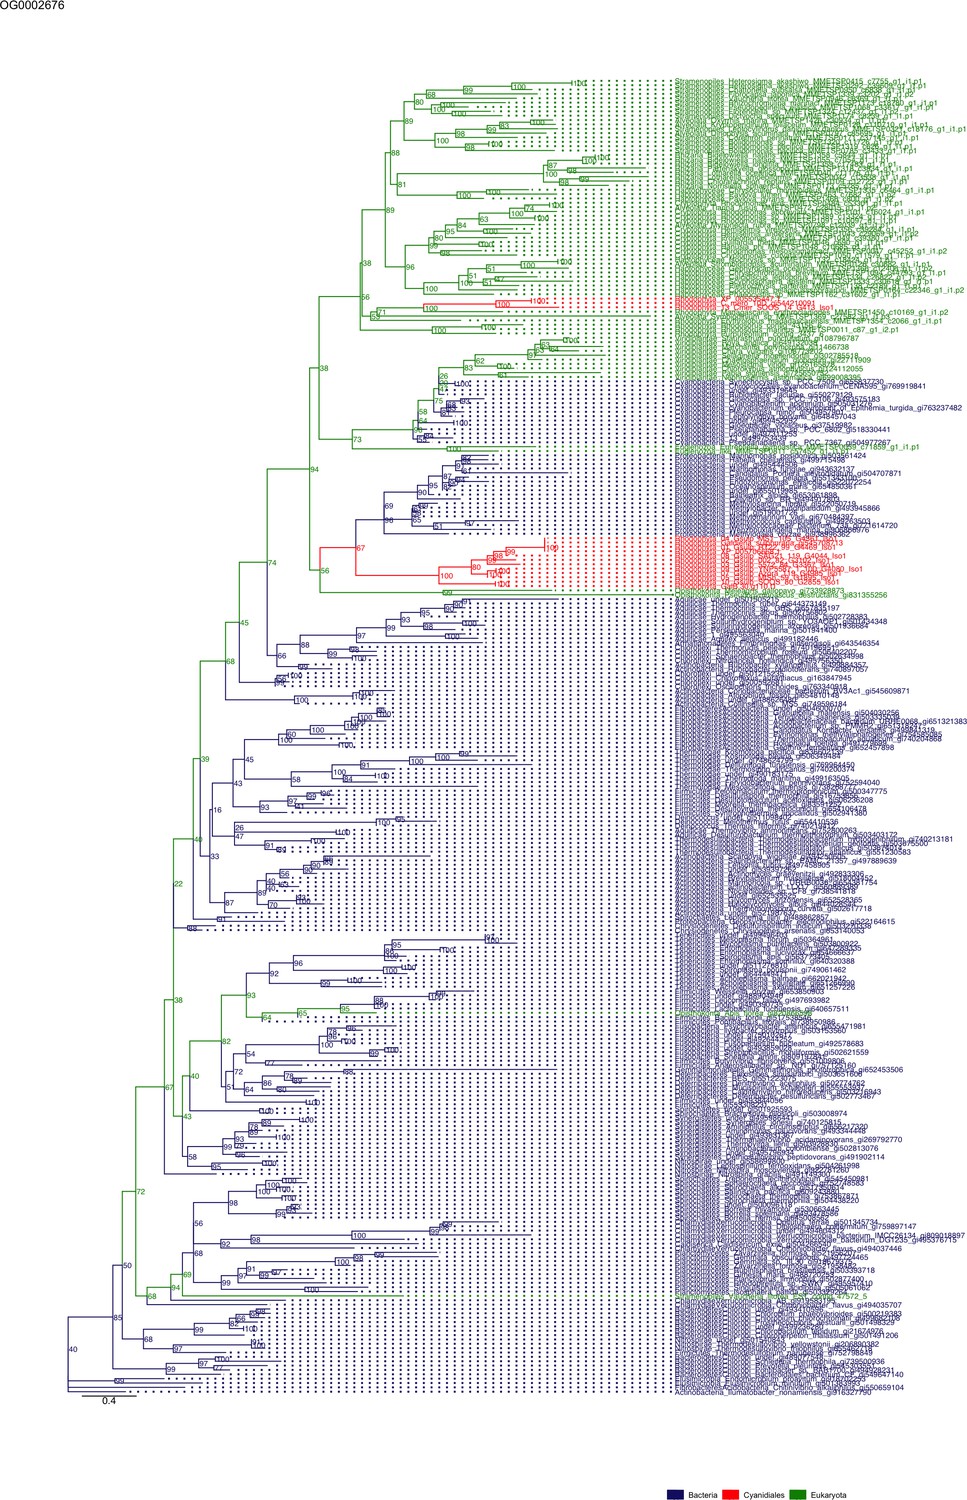
Sequence tree of orthogroup OG0002676.
The tree is based on amino acid sequences. Archaea (yellow), Bacteria (blue), Cyanidiales (red), Eukaryotes including other red algae (green). Branches containing Cyanidiales sequences are highlited in red.
Figure 5—figure supplement 27
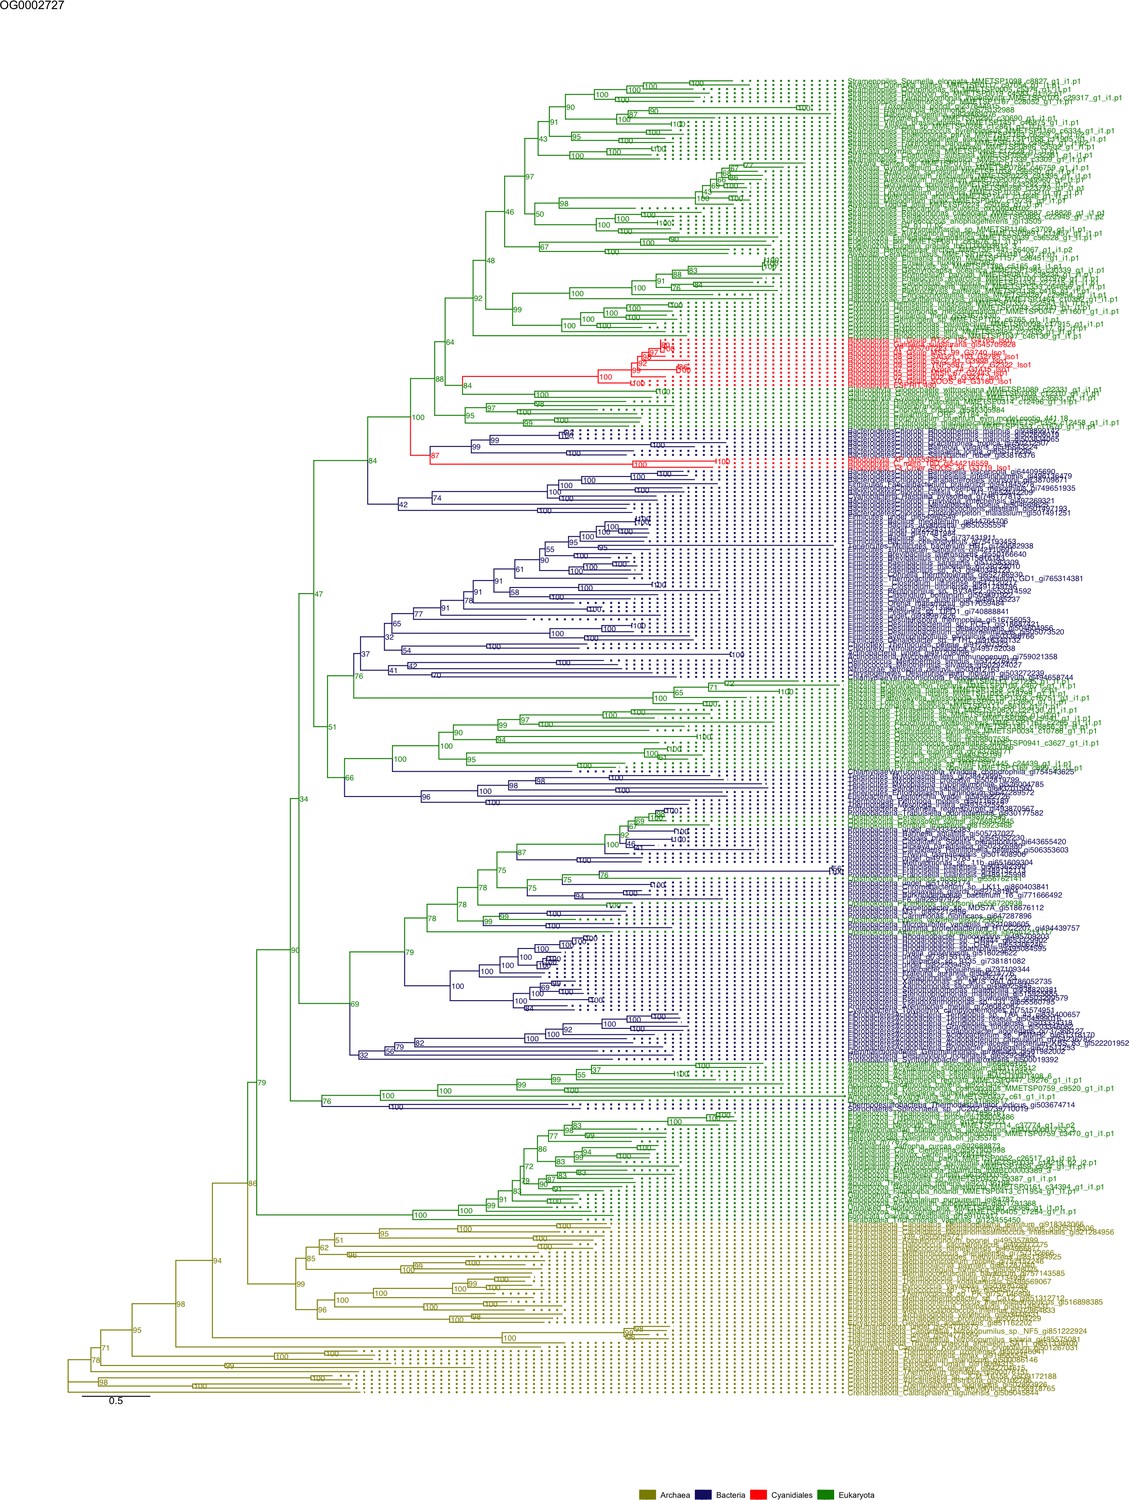
Sequence tree of orthogroup OG0002727.
The tree is based on amino acid sequences. Archaea (yellow), Bacteria (blue), Cyanidiales (red), Eukaryotes including other red algae (green). Branches containing Cyanidiales sequences are highlited in red.
Figure 5—figure supplement 28

Sequence tree of orthogroup OG0002785.
The tree is based on amino acid sequences. Archaea (yellow), Bacteria (blue), Cyanidiales (red), Eukaryotes including other red algae (green). Branches containing Cyanidiales sequences are highlited in red.
Figure 5—figure supplement 29
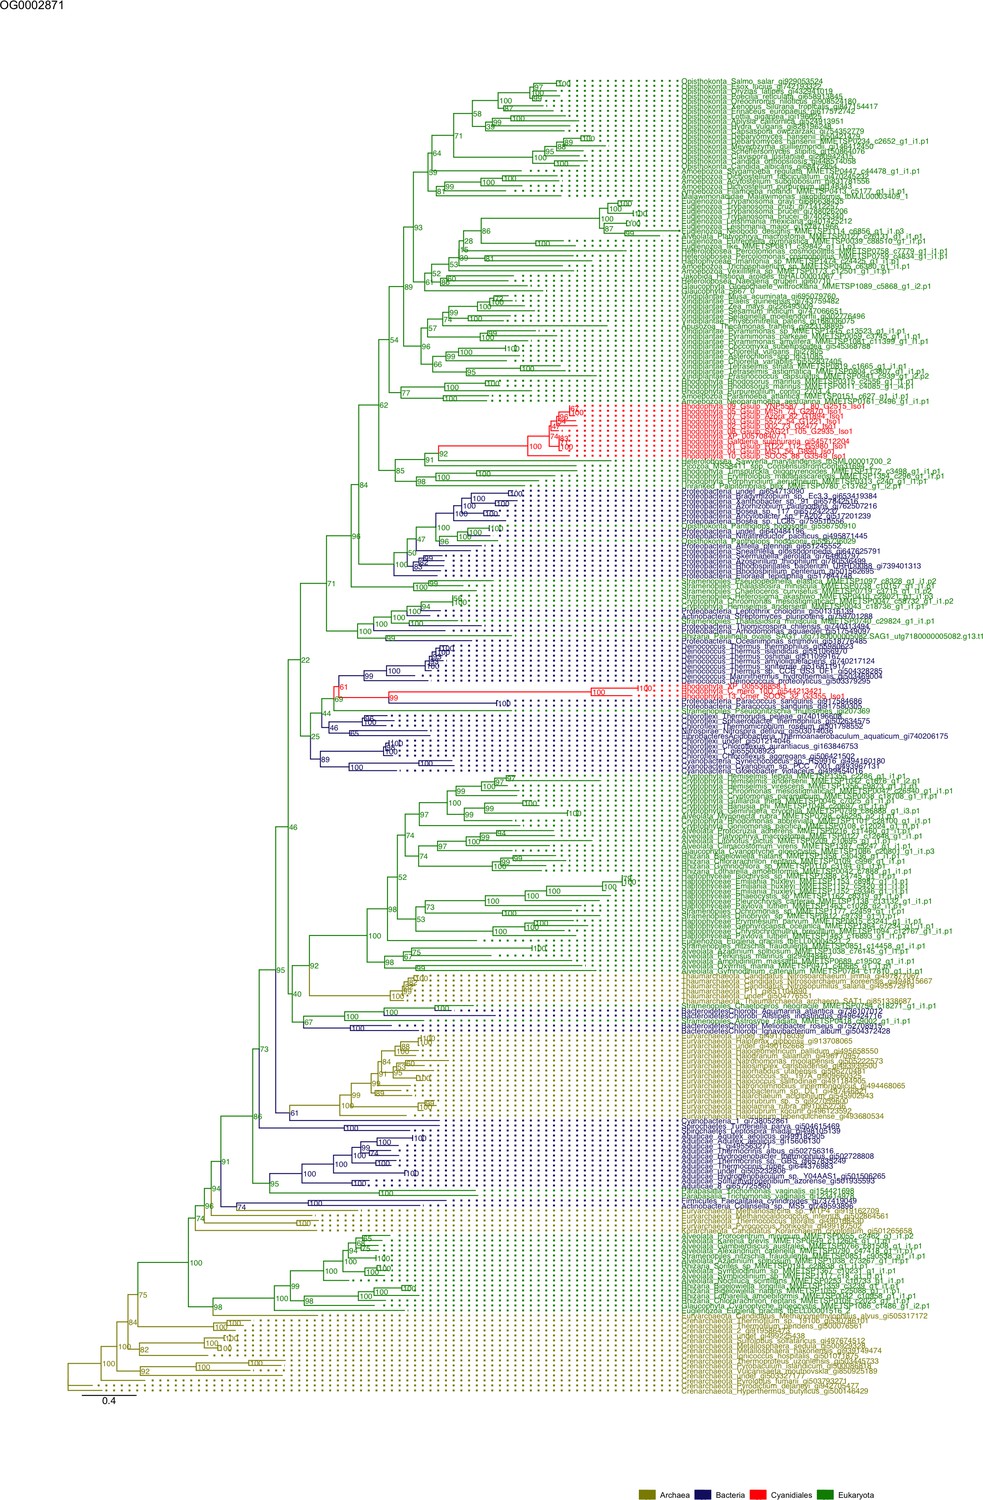
Sequence tree of orthogroup OG0002871.
The tree is based on amino acid sequences. Archaea (yellow), Bacteria (blue), Cyanidiales (red), Eukaryotes including other red algae (green). Branches containing Cyanidiales sequences are highlited in red.
Figure 5—figure supplement 30
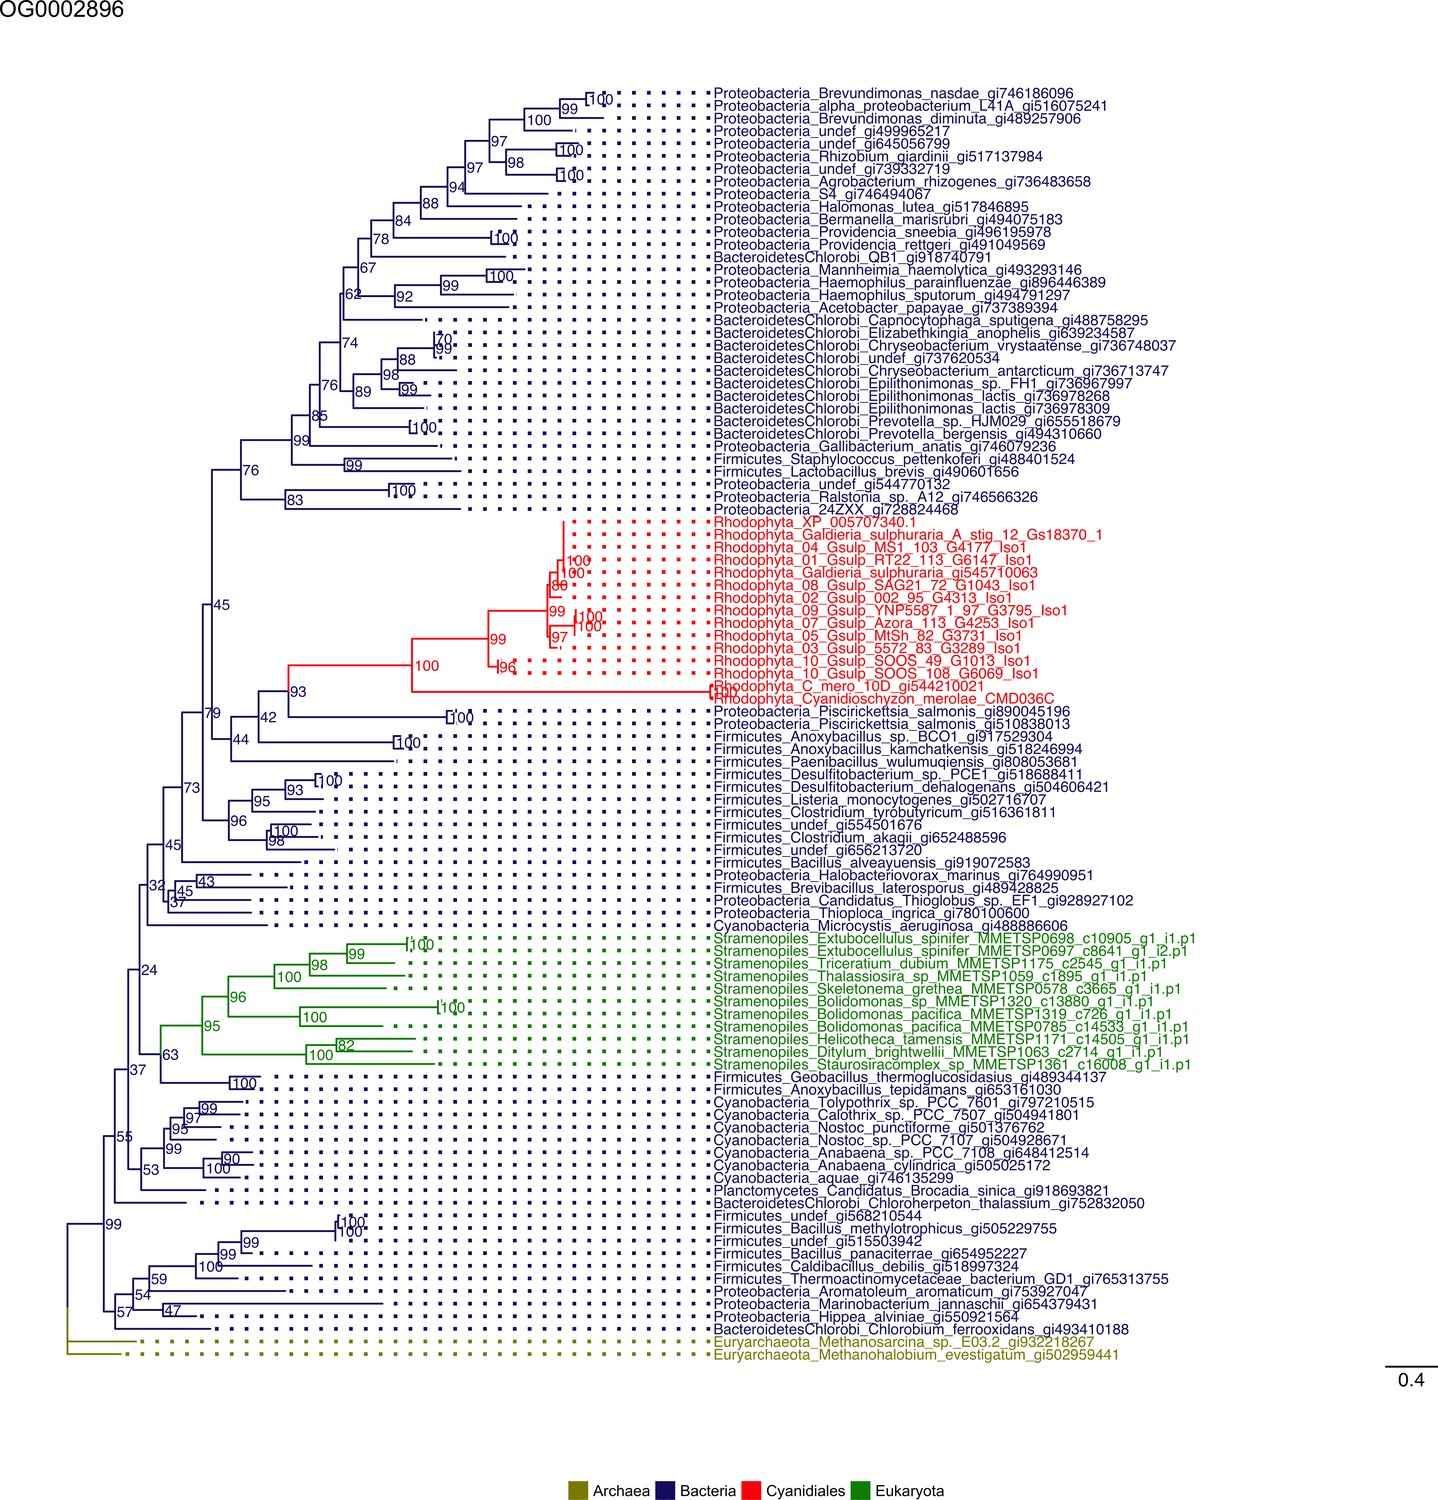
Sequence tree of orthogroup OG0002896.
The tree is based on amino acid sequences. Archaea (yellow), Bacteria (blue), Cyanidiales (red), Eukaryotes including other red algae (green). Branches containing Cyanidiales sequences are highlited in red.
Figure 5—figure supplement 31
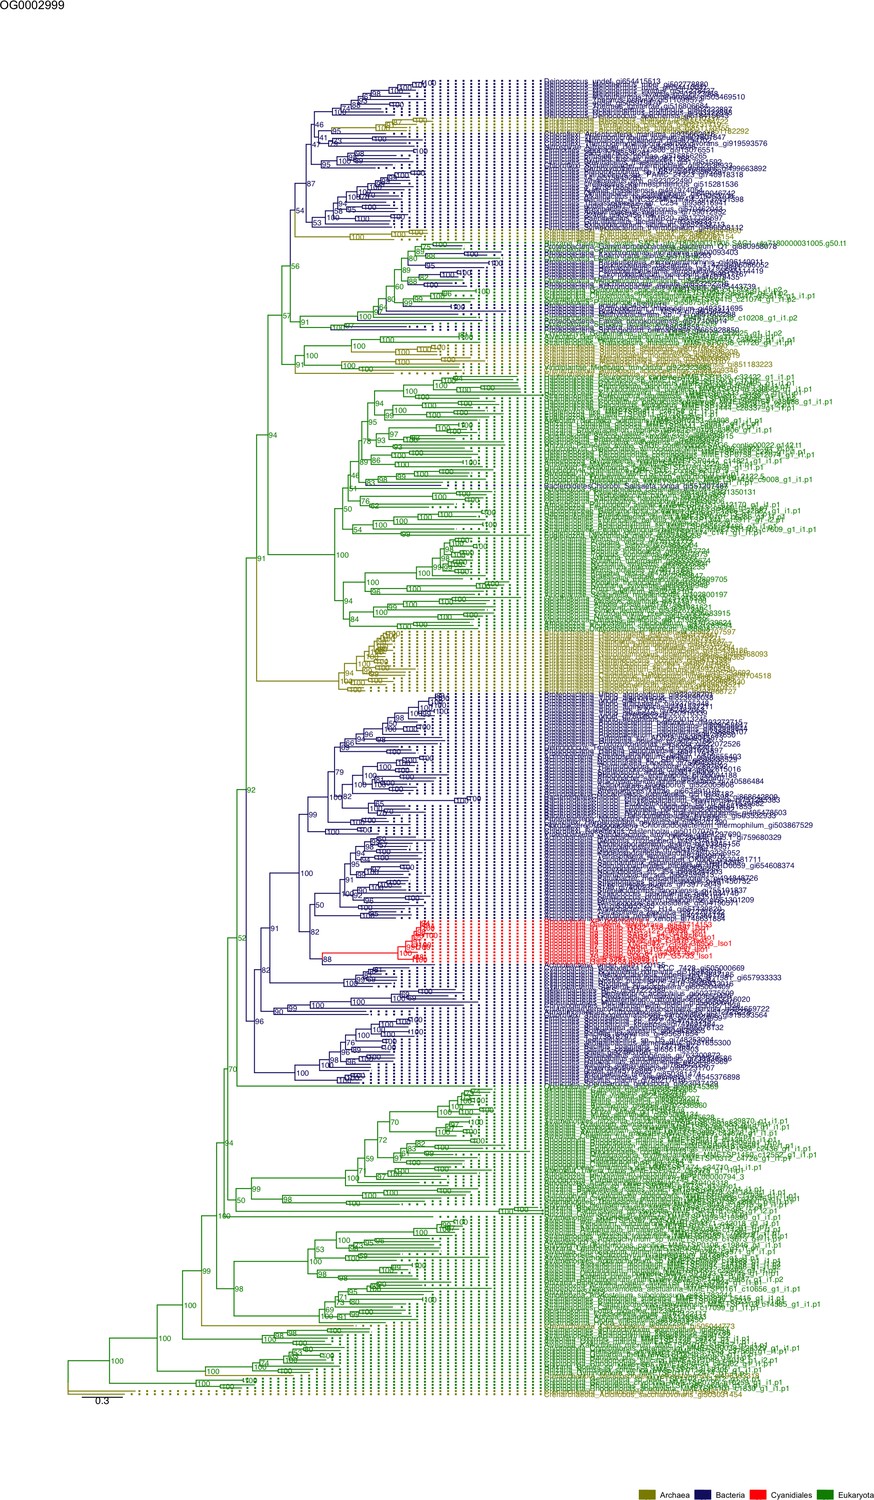
Sequence tree of orthogroup OG0002999.
The tree is based on amino acid sequences. Archaea (yellow), Bacteria (blue), Cyanidiales (red), Eukaryotes including other red algae (green). Branches containing Cyanidiales sequences are highlited in red.
Figure 5—figure supplement 32
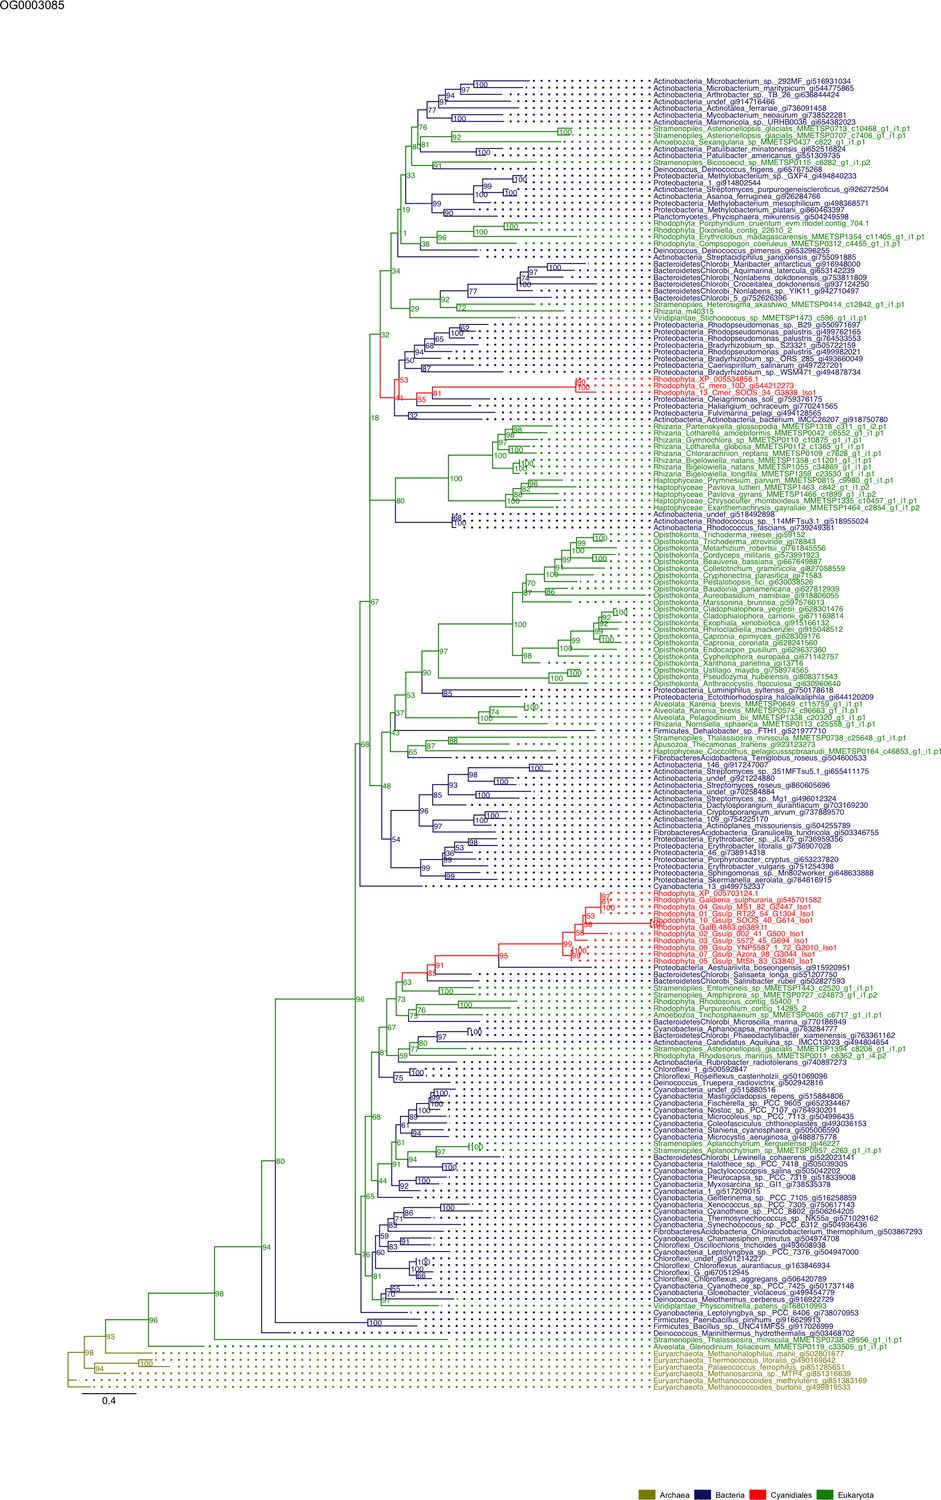
Sequence tree of orthogroup OG0003085.
The tree is based on amino acid sequences. Archaea (yellow), Bacteria (blue), Cyanidiales (red), Eukaryotes including other red algae (green). Branches containing Cyanidiales sequences are highlited in red.
Figure 5—figure supplement 33
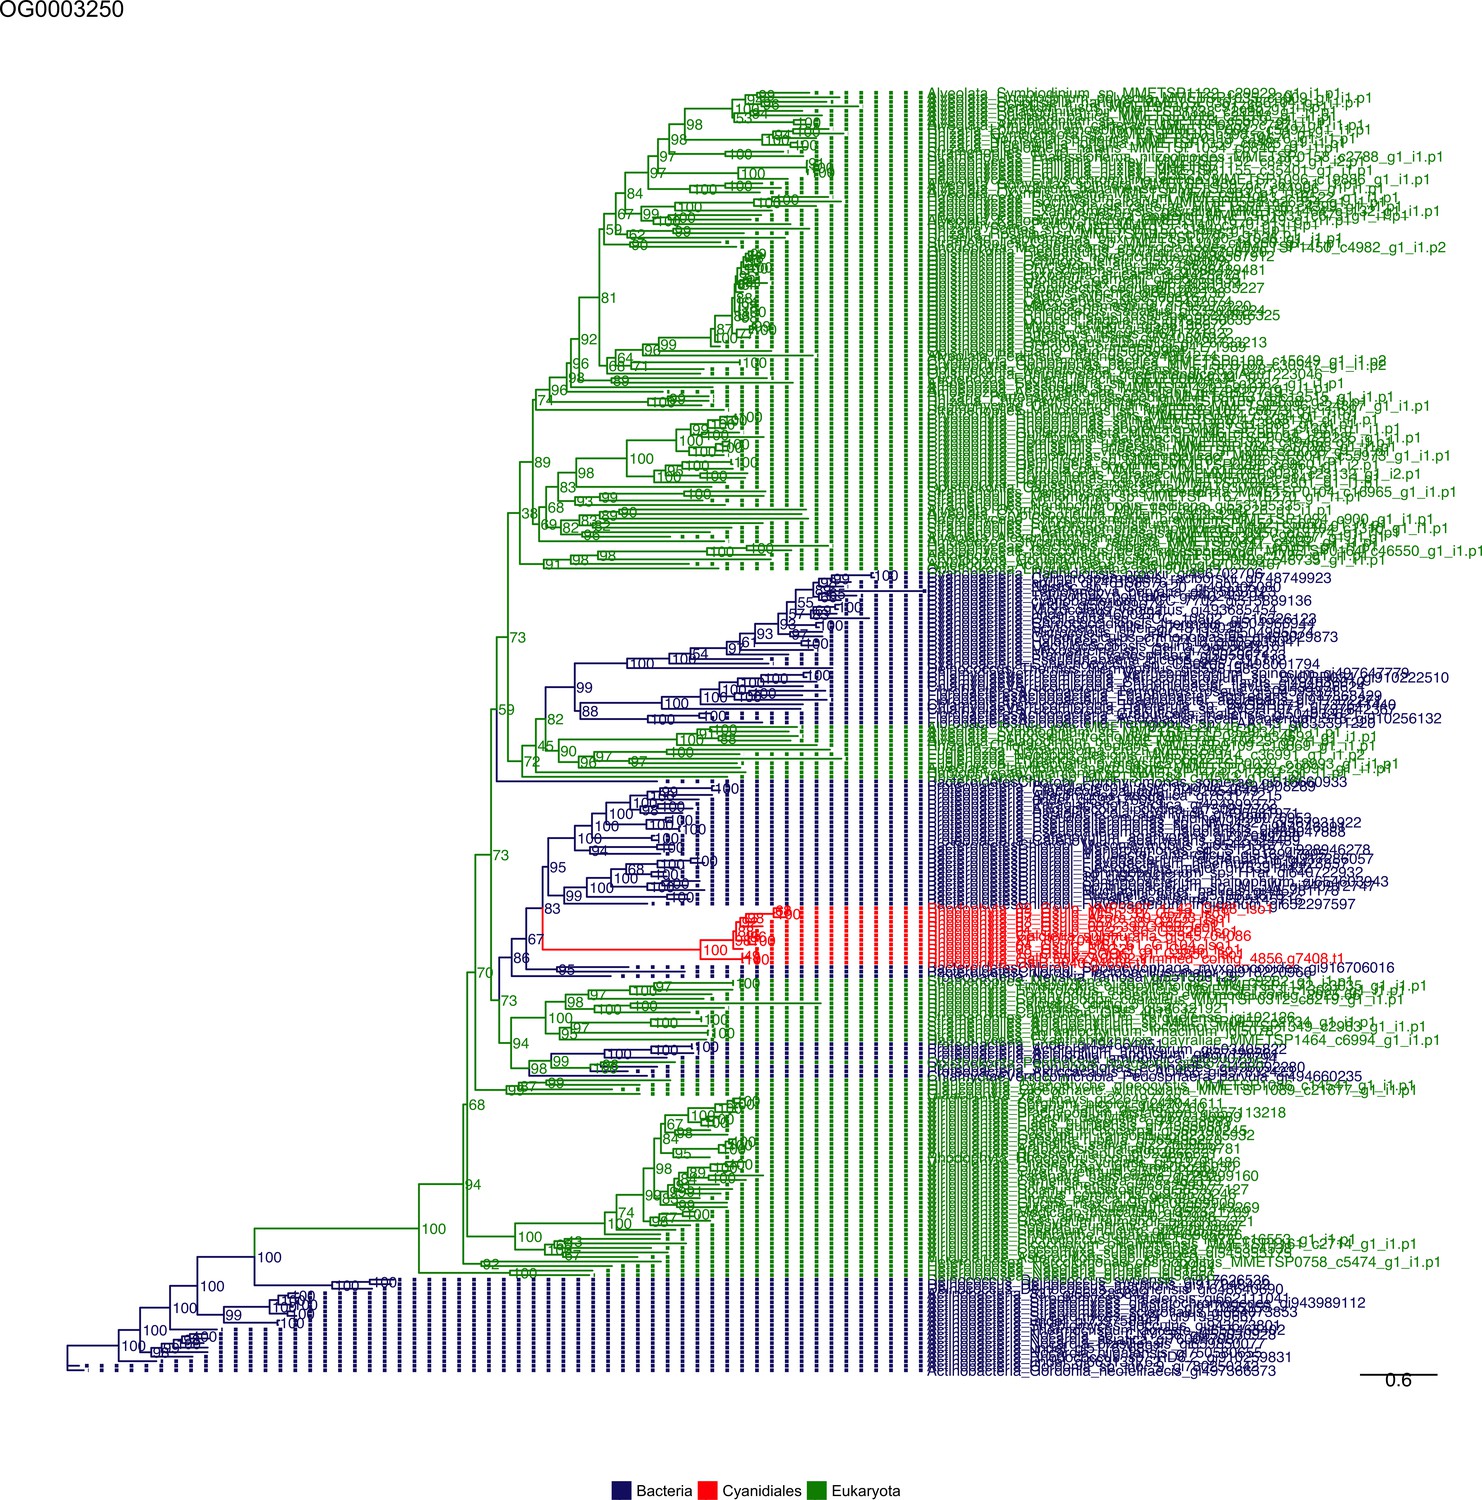
Sequence tree of orthogroup OG0003250.
The tree is based on amino acid sequences. Archaea (yellow), Bacteria (blue), Cyanidiales (red), Eukaryotes including other red algae (green). Branches containing Cyanidiales sequences are highlited in red.
Figure 5—figure supplement 34
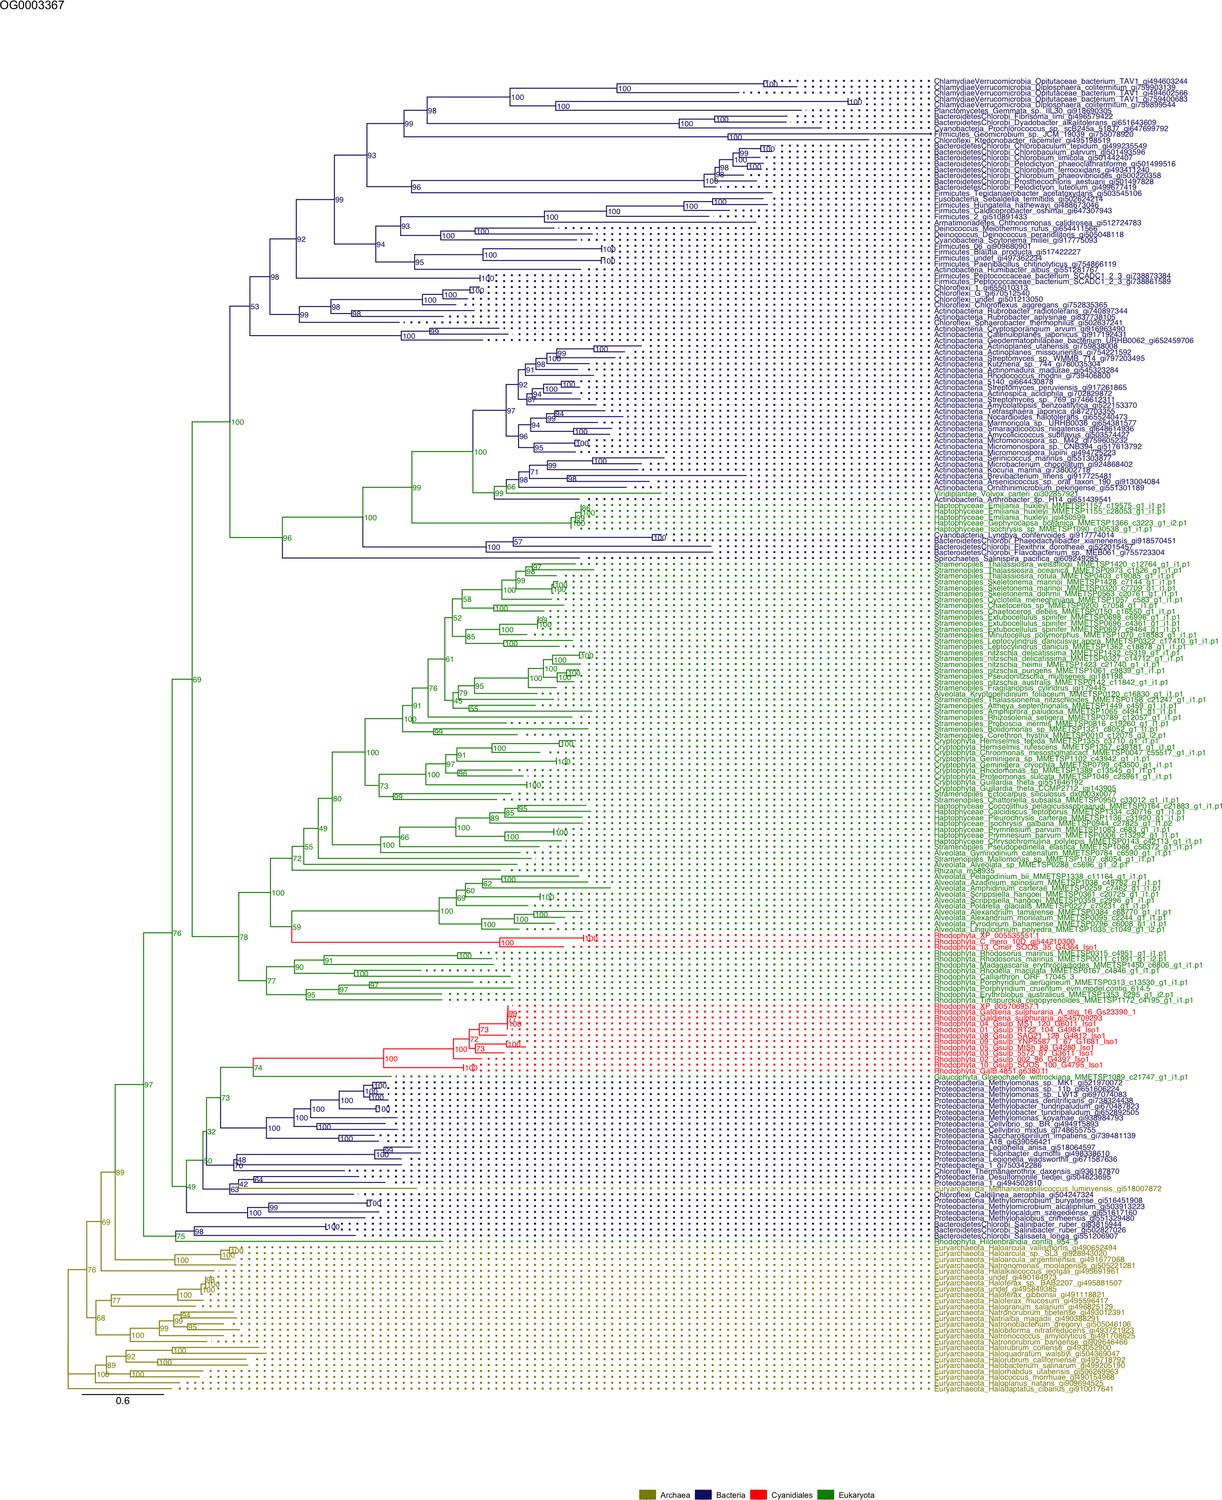
Sequence tree of orthogroup OG0003367.
The tree is based on amino acid sequences. Archaea (yellow), Bacteria (blue), Cyanidiales (red), Eukaryotes including other red algae (green). Branches containing Cyanidiales sequences are highlited in red.
Figure 5—figure supplement 35
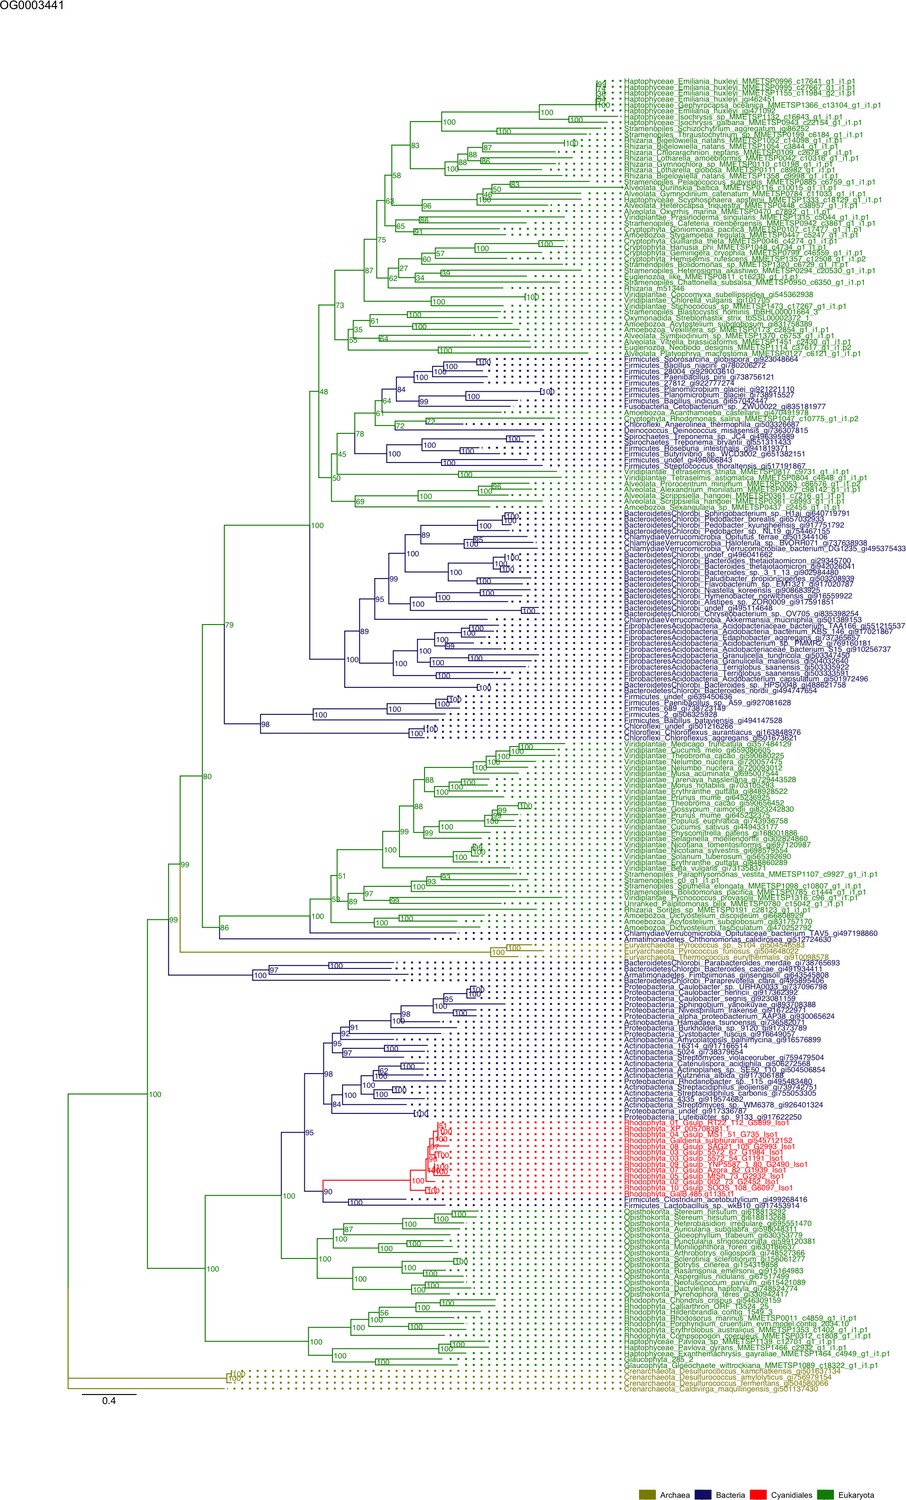
Sequence tree of orthogroup OG0003441.
The tree is based on amino acid sequences. Archaea (yellow), Bacteria (blue), Cyanidiales (red), Eukaryotes including other red algae (green). Branches containing Cyanidiales sequences are highlited in red.
Figure 5—figure supplement 36
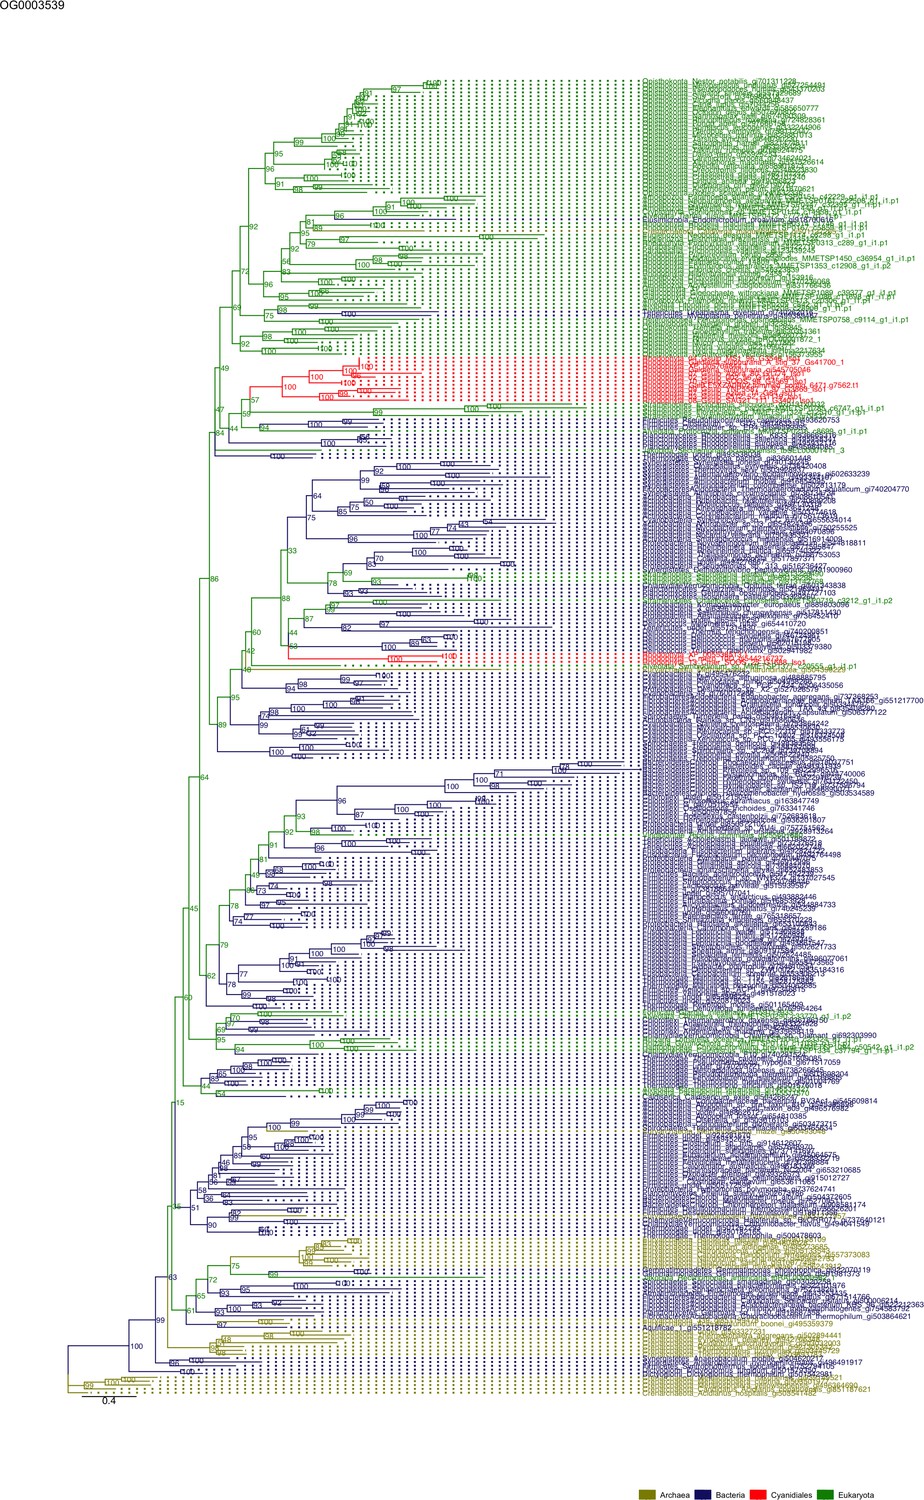
Sequence tree of orthogroup OG0003539.
The tree is based on amino acid sequences. Archaea (yellow), Bacteria (blue), Cyanidiales (red), Eukaryotes including other red algae (green). Branches containing Cyanidiales sequences are highlited in red.
Figure 5—figure supplement 37
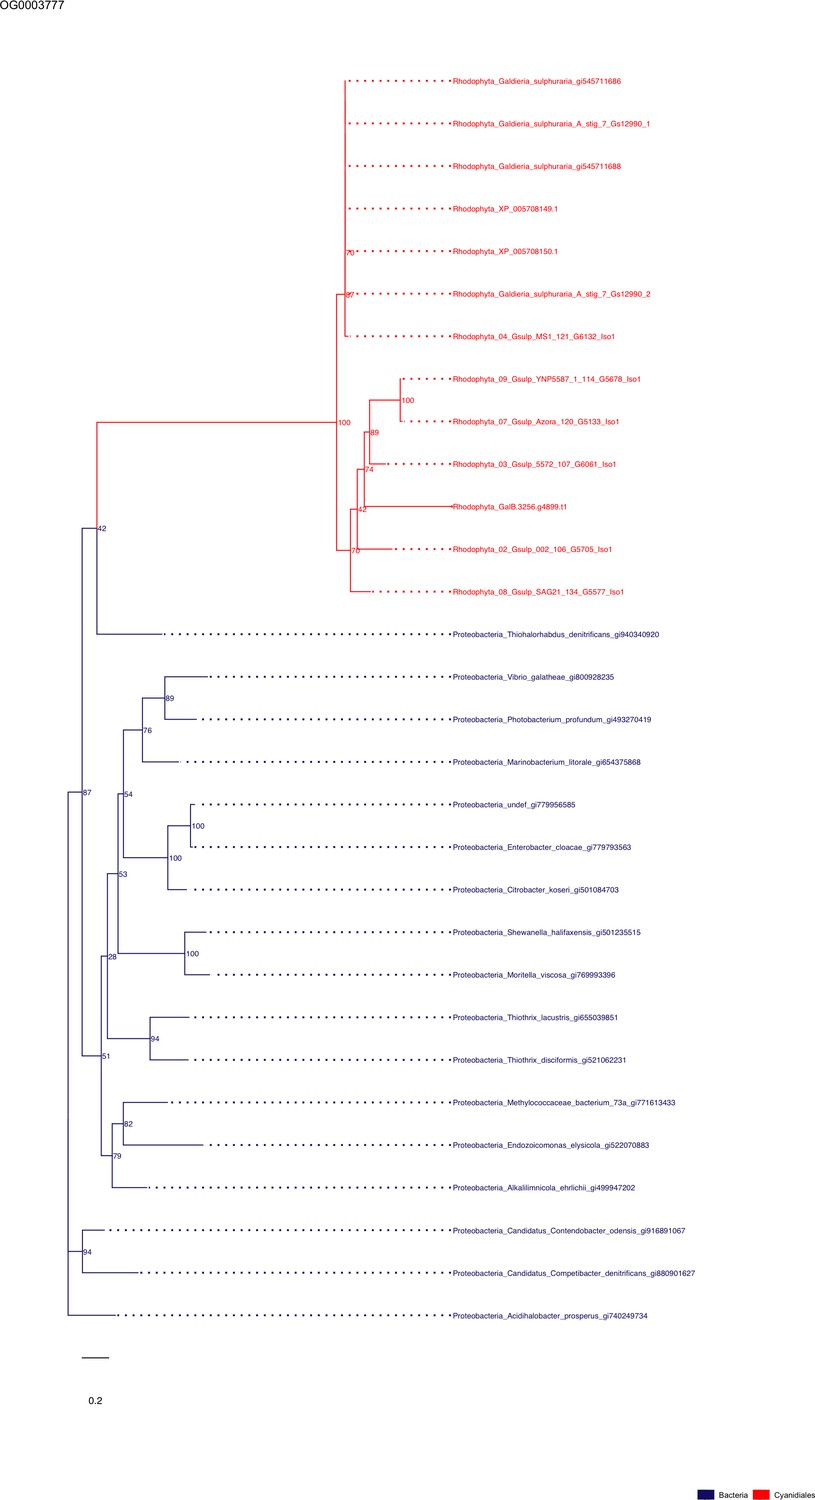
Sequence tree of orthogroup OG0003777.
The tree is based on amino acid sequences. Archaea (yellow), Bacteria (blue), Cyanidiales (red), Eukaryotes including other red algae (green). Branches containing Cyanidiales sequences are highlited in red.
Figure 5—figure supplement 38
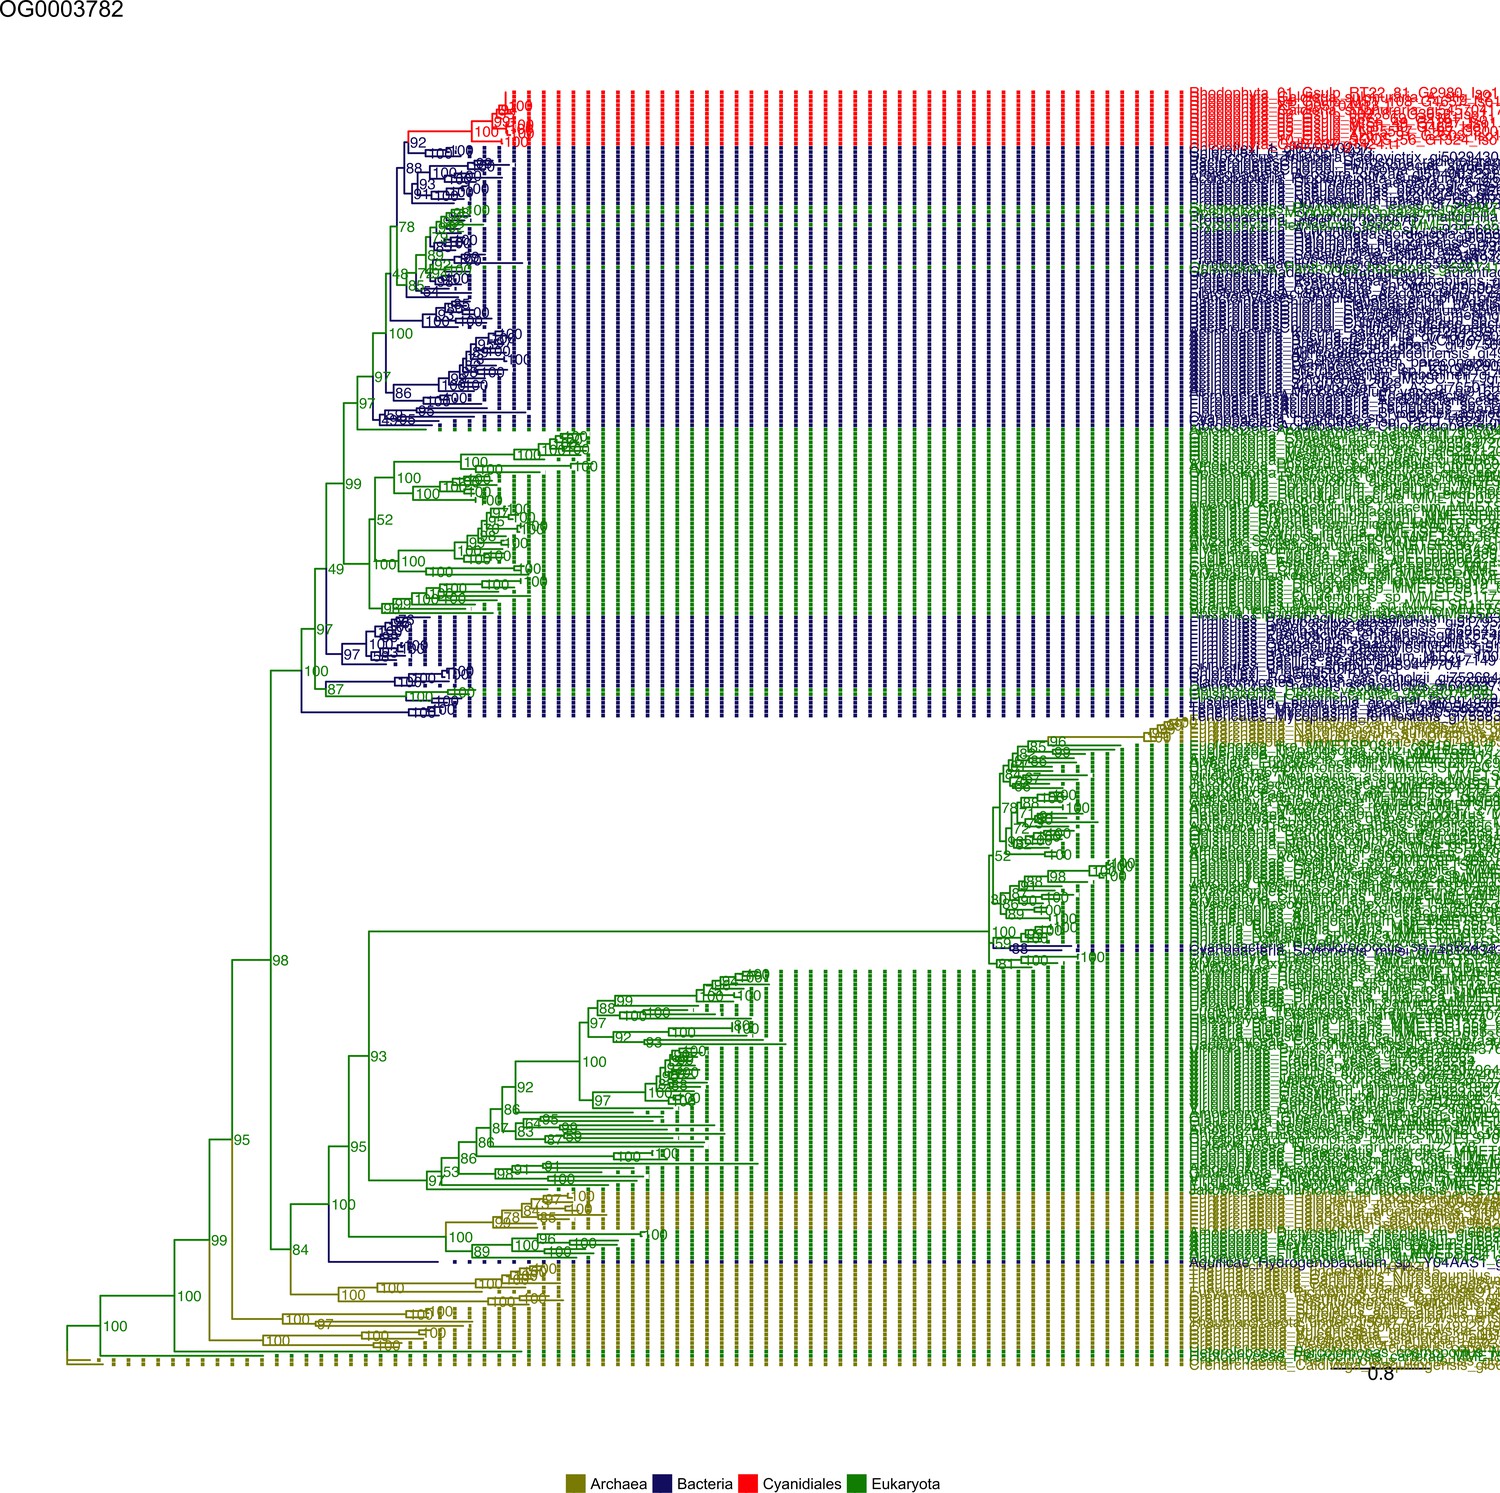
Sequence tree of orthogroup OG0003782.
The tree is based on amino acid sequences. Archaea (yellow), Bacteria (blue), Cyanidiales (red), Eukaryotes including other red algae (green). Branches containing Cyanidiales sequences are highlited in red.
Figure 5—figure supplement 39
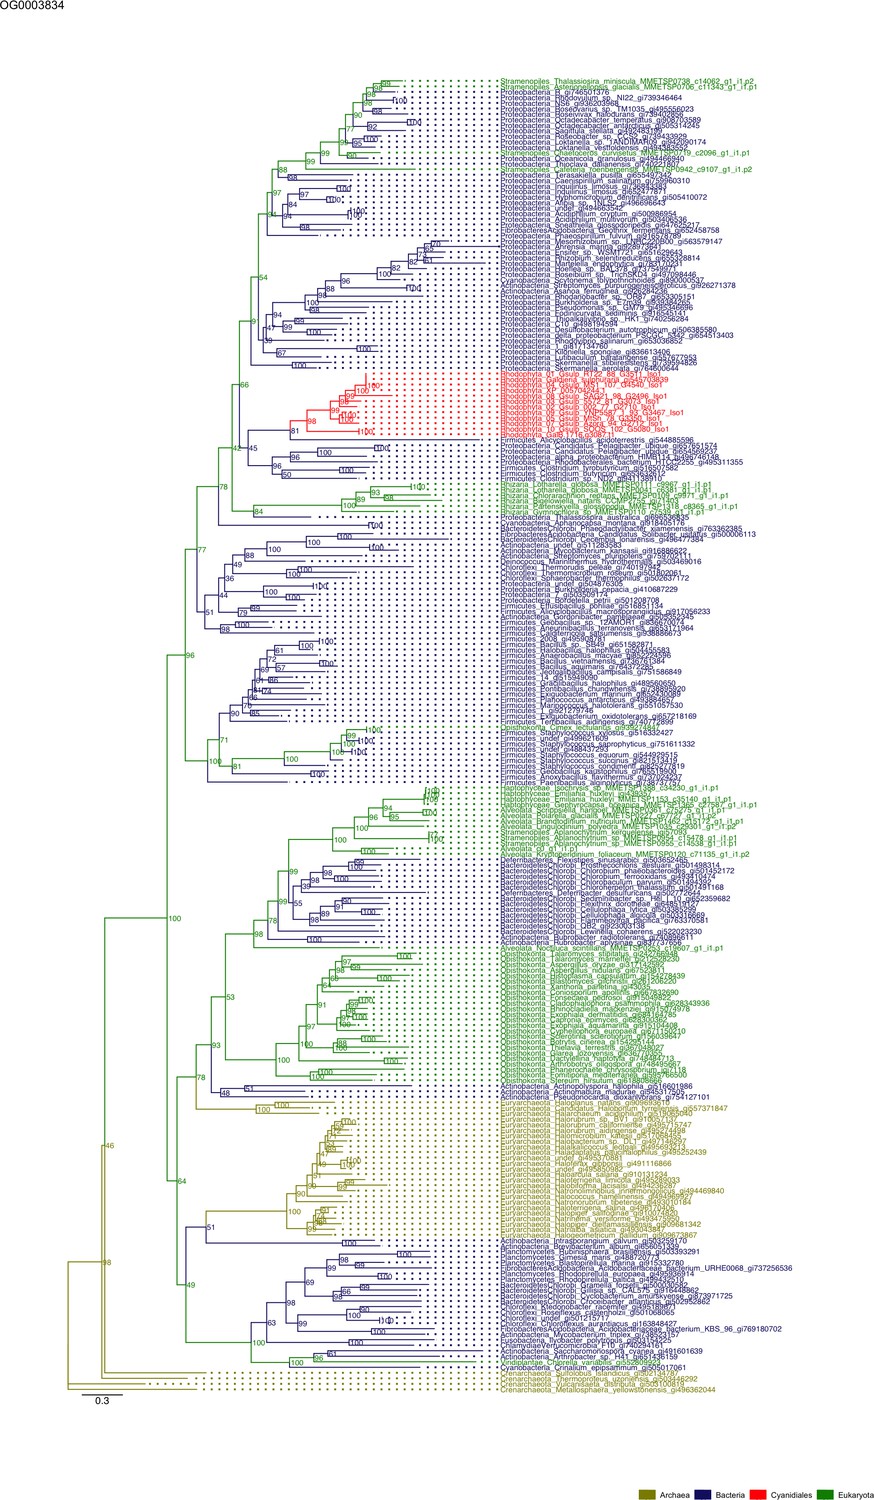
Sequence tree of orthogroup OG0003834.
The tree is based on amino acid sequences. Archaea (yellow), Bacteria (blue), Cyanidiales (red), Eukaryotes including other red algae (green). Branches containing Cyanidiales sequences are highlited in red.
Figure 5—figure supplement 40
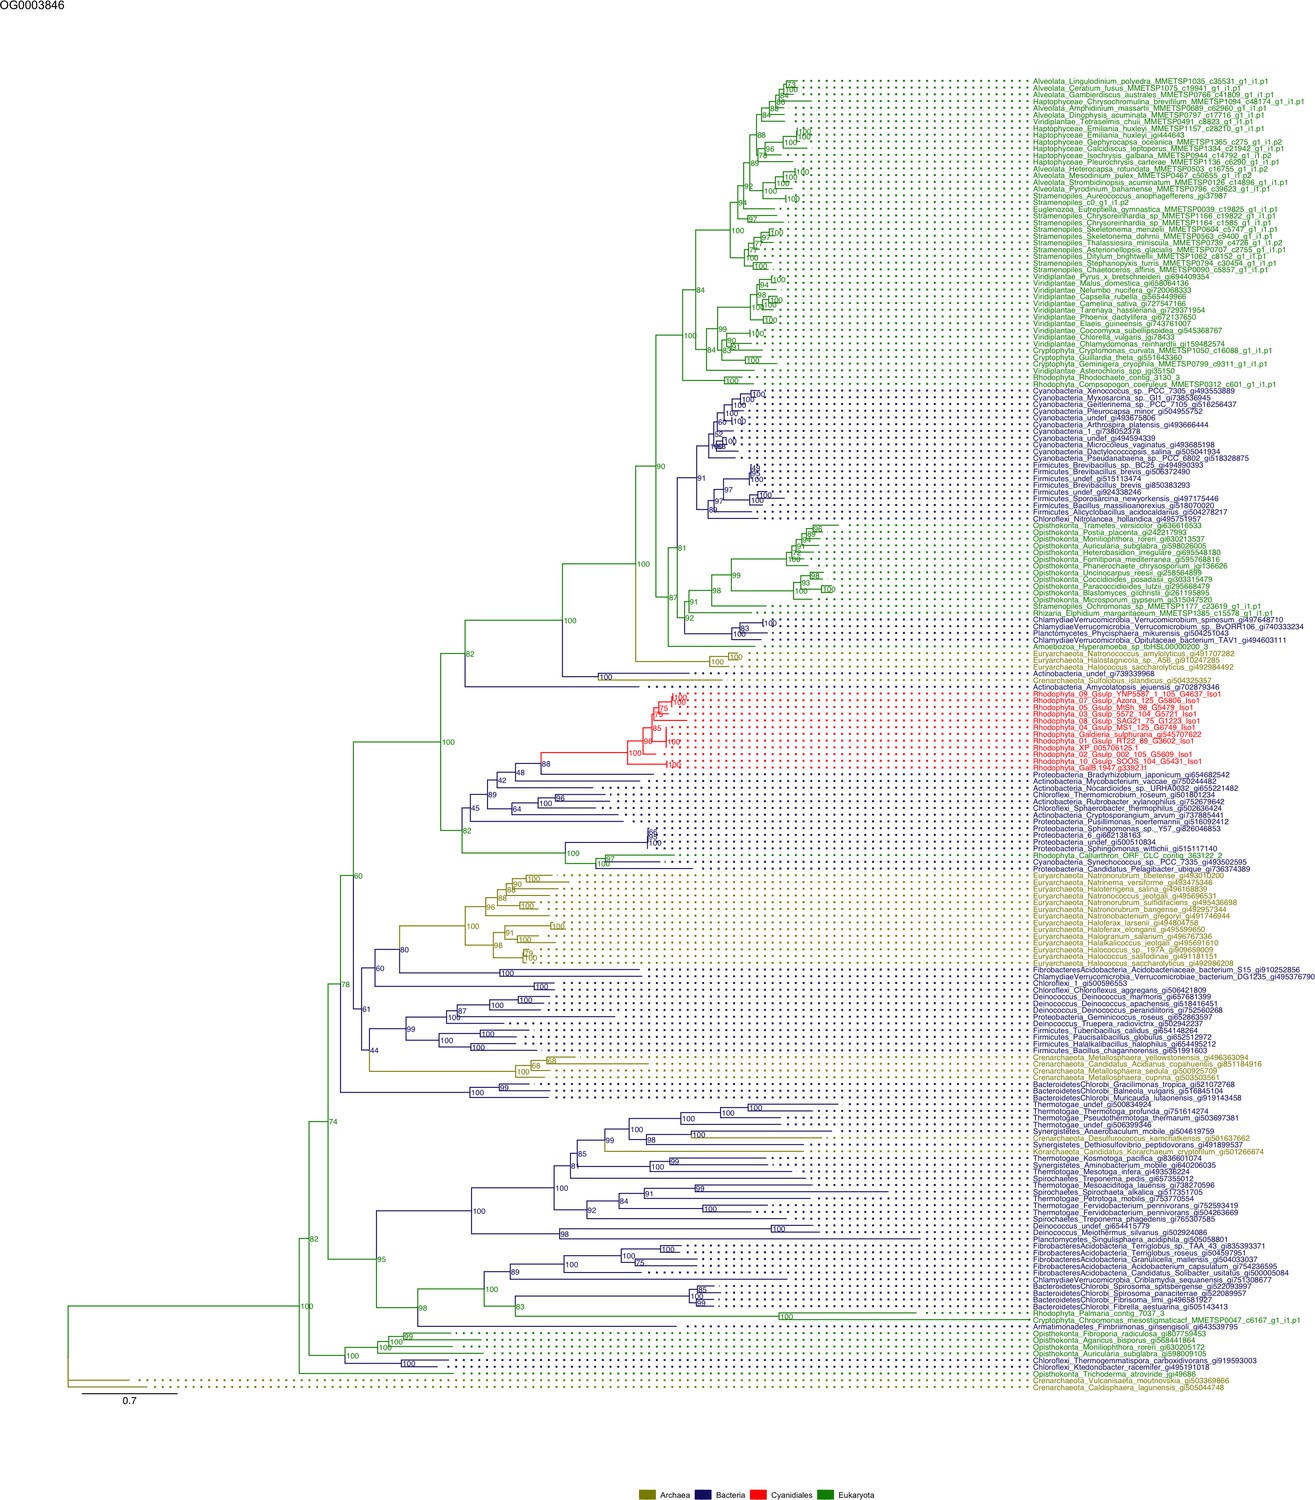
Sequence tree of orthogroup OG0003846.
The tree is based on amino acid sequences. Archaea (yellow), Bacteria (blue), Cyanidiales (red), Eukaryotes including other red algae (green). Branches containing Cyanidiales sequences are highlited in red.
Figure 5—figure supplement 41
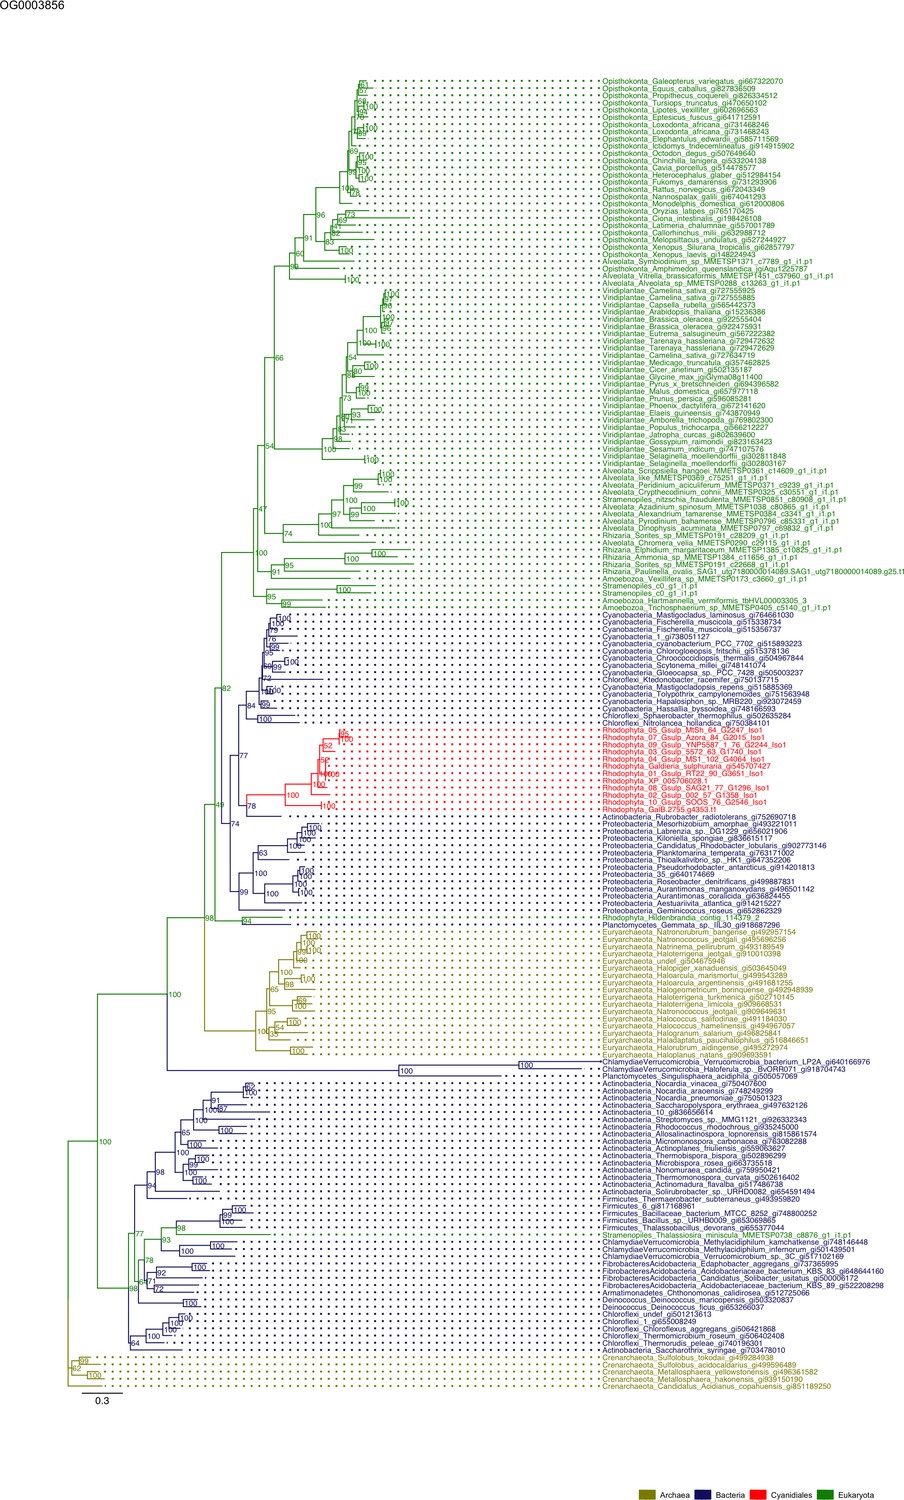
Sequence tree of orthogroup OG0003856.
The tree is based on amino acid sequences. Archaea (yellow), Bacteria (blue), Cyanidiales (red), Eukaryotes including other red algae (green). Branches containing Cyanidiales sequences are highlited in red.
Figure 5—figure supplement 42
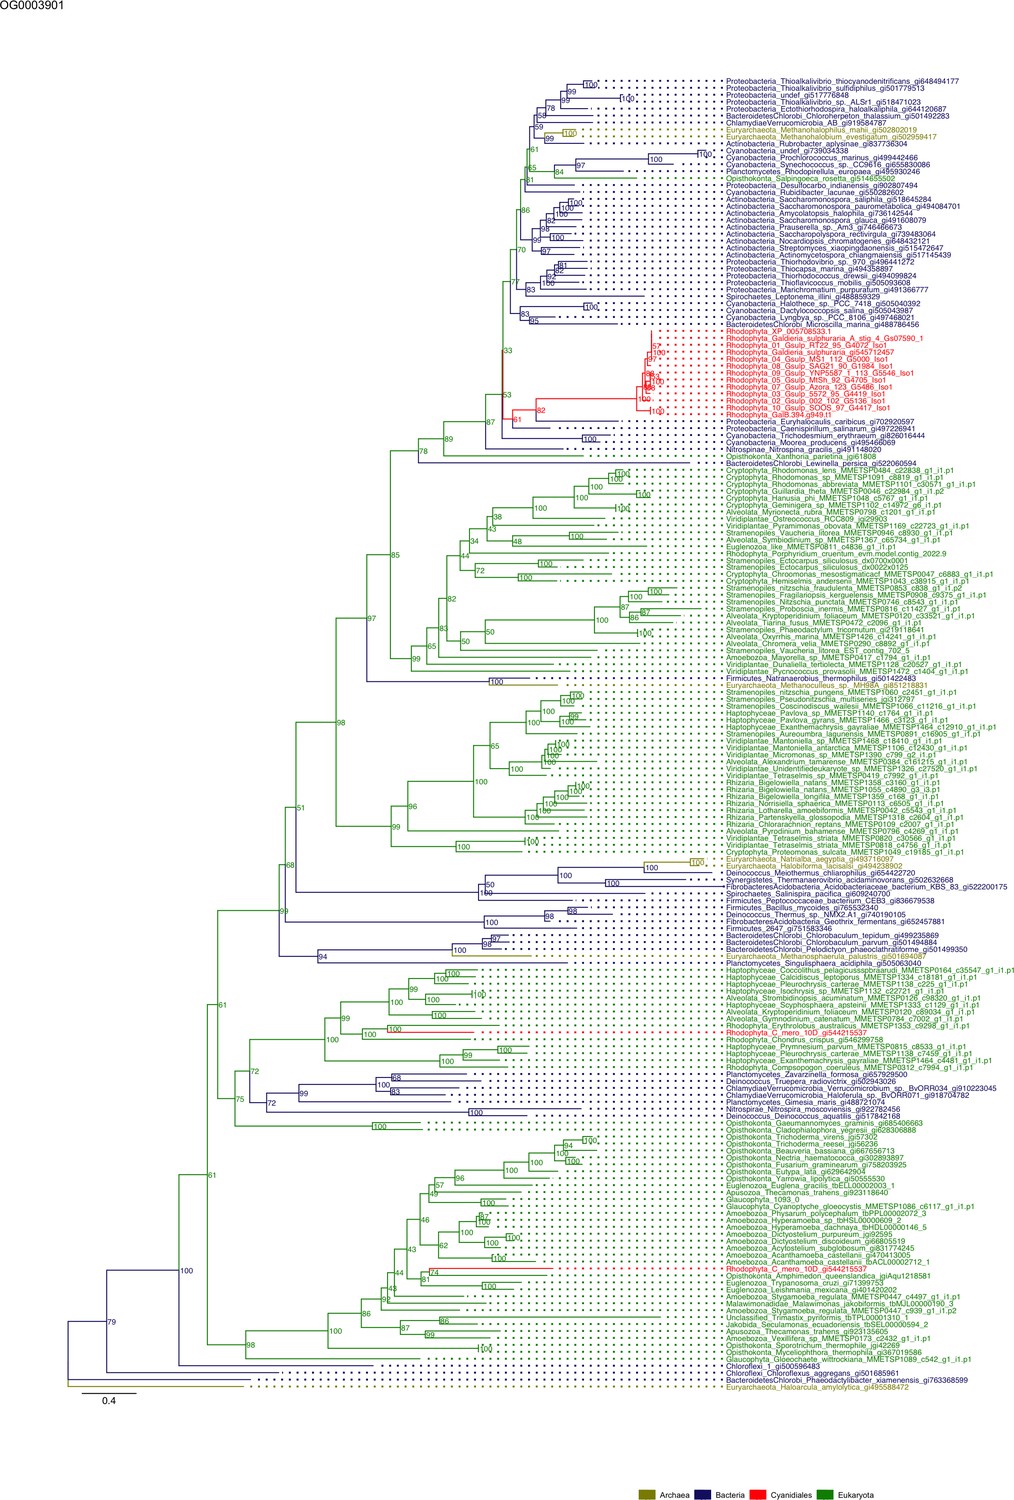
Sequence tree of orthogroup OG0003901.
The tree is based on amino acid sequences. Archaea (yellow), Bacteria (blue), Cyanidiales (red), Eukaryotes including other red algae (green). Branches containing Cyanidiales sequences are highlited in red.
Figure 5—figure supplement 43
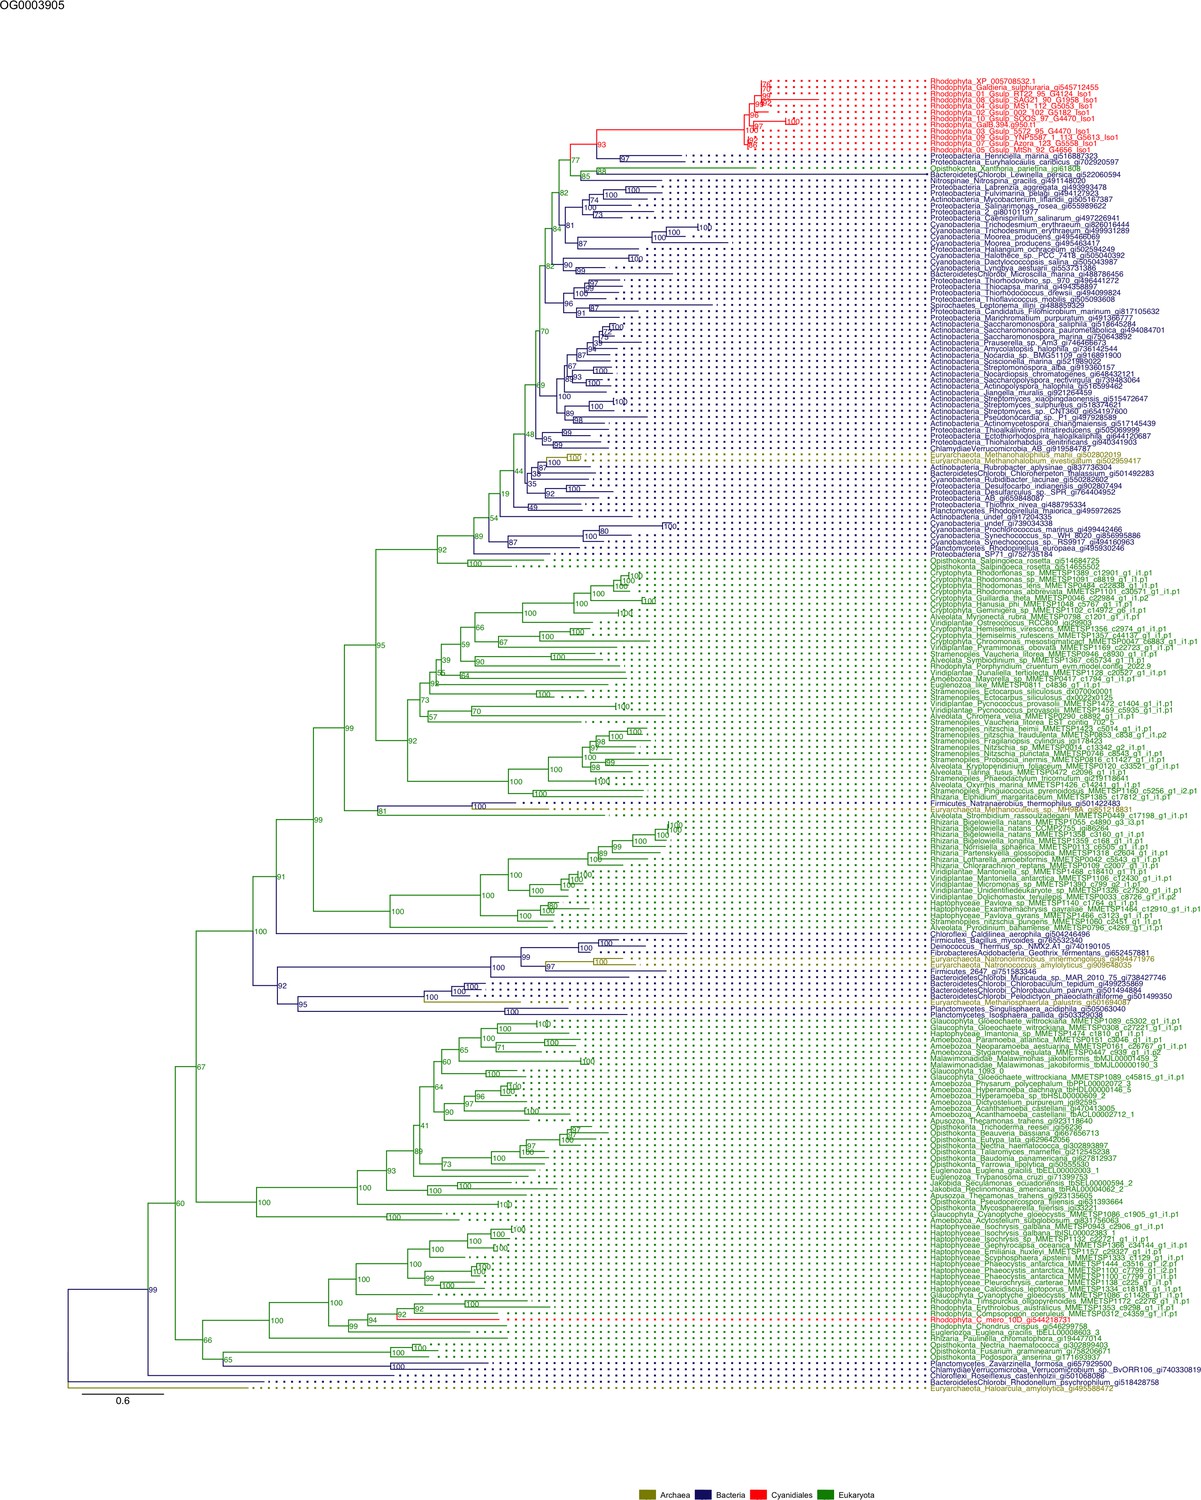
Sequence tree of orthogroup OG0003905.
The tree is based on amino acid sequences. Archaea (yellow), Bacteria (blue), Cyanidiales (red), Eukaryotes including other red algae (green). Branches containing Cyanidiales sequences are highlited in red.
Figure 5—figure supplement 44
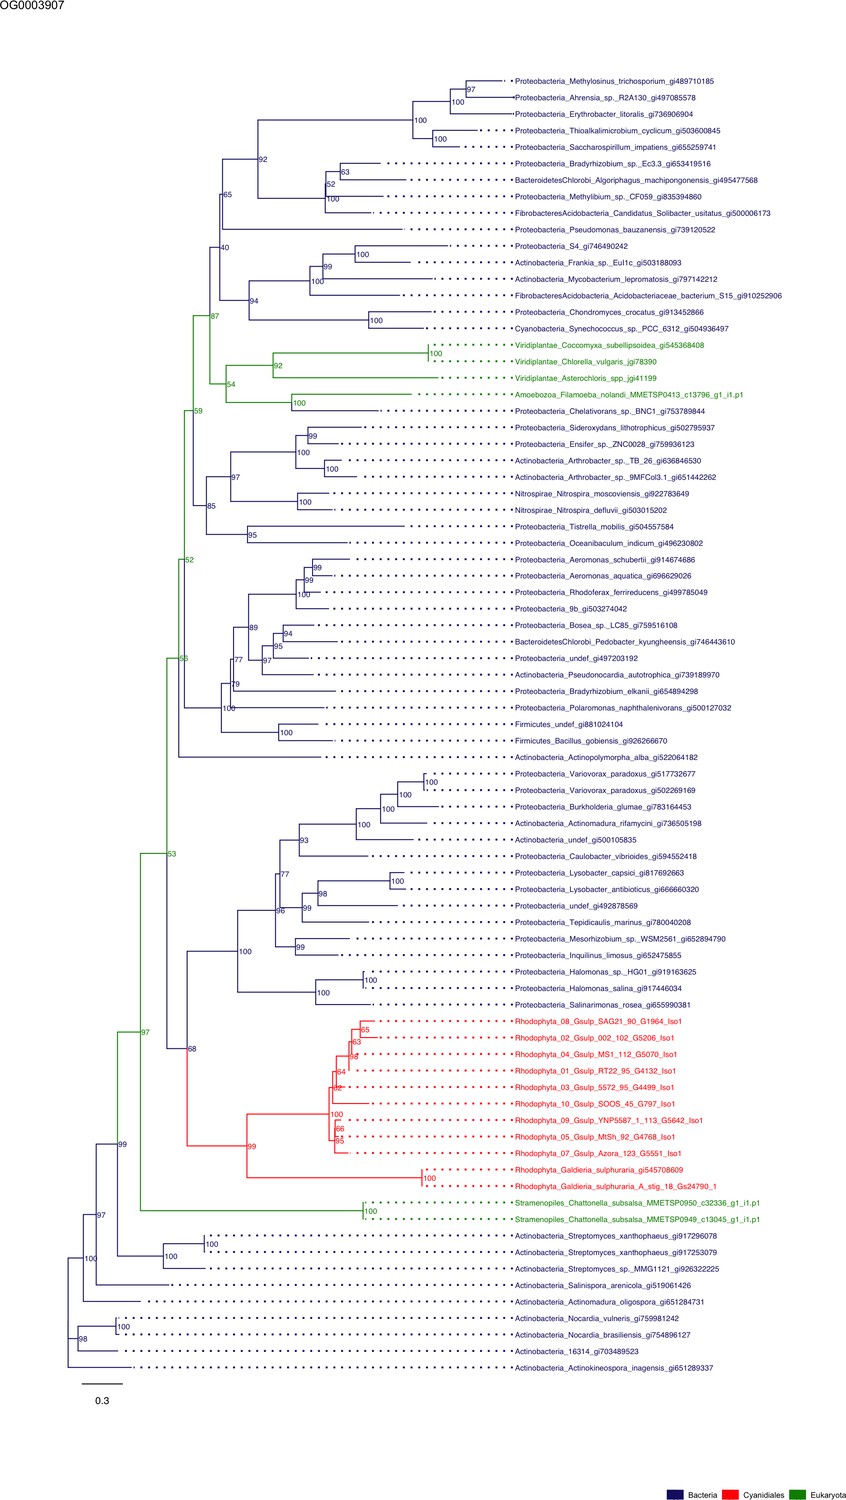
Sequence tree of orthogroup OG0003907.
The tree is based on amino acid sequences. Archaea (yellow), Bacteria (blue), Cyanidiales (red), Eukaryotes including other red algae (green). Branches containing Cyanidiales sequences are highlited in red.
Figure 5—figure supplement 45
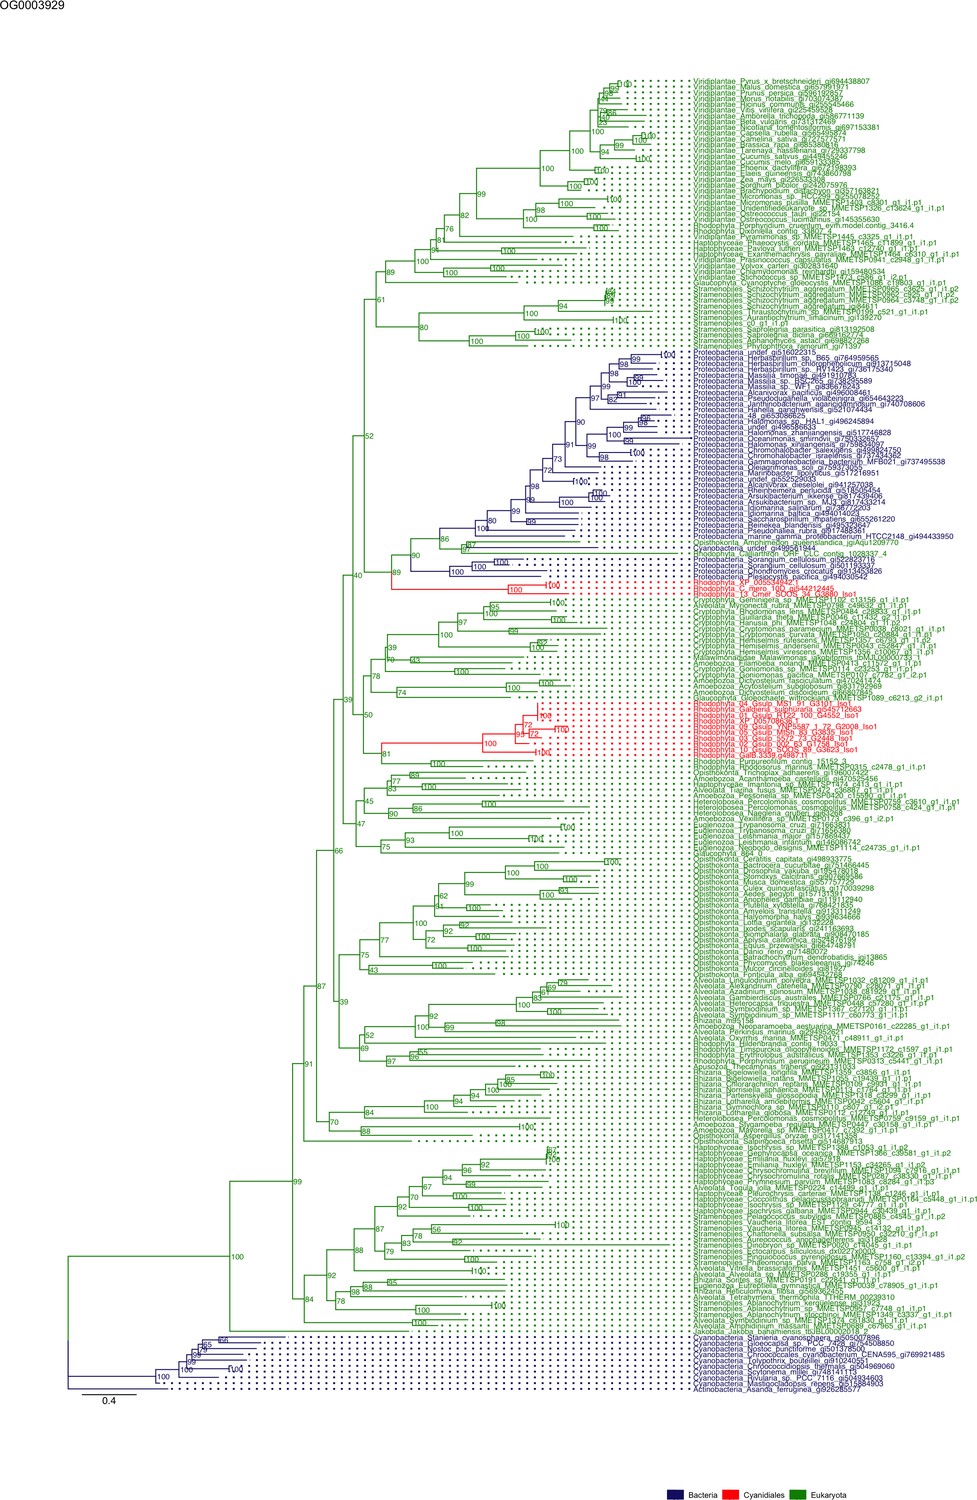
Sequence tree of orthogroup OG0003929.
The tree is based on amino acid sequences. Archaea (yellow), Bacteria (blue), Cyanidiales (red), Eukaryotes including other red algae (green). Branches containing Cyanidiales sequences are highlited in red.
Figure 5—figure supplement 46
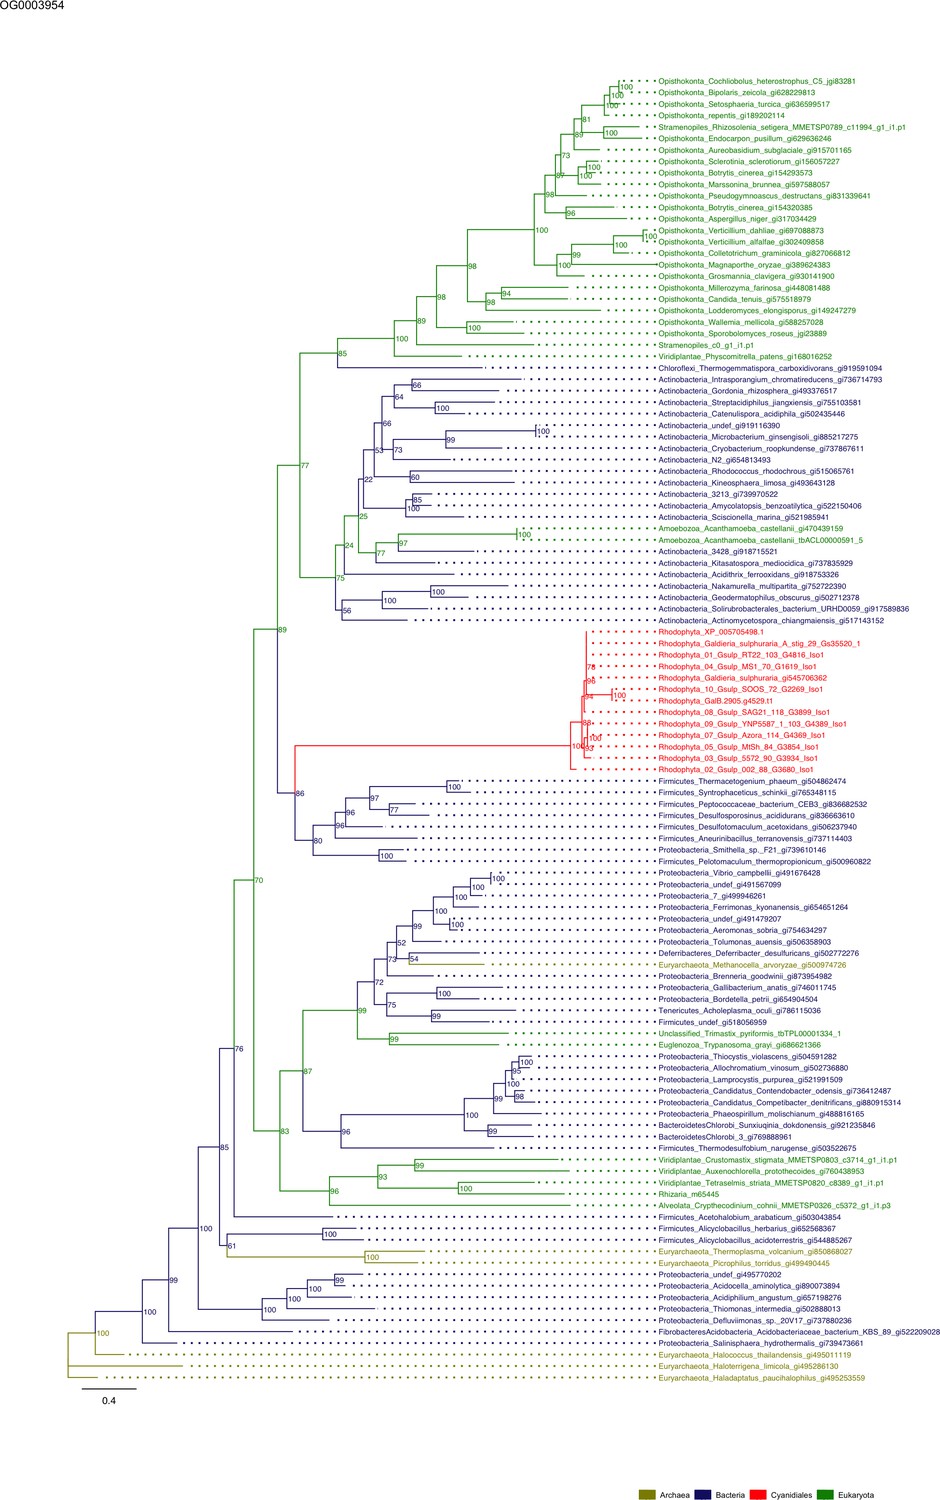
Sequence tree of orthogroup OG0003954.
The tree is based on amino acid sequences. Archaea (yellow), Bacteria (blue), Cyanidiales (red), Eukaryotes including other red algae (green). Branches containing Cyanidiales sequences are highlited in red.
Figure 5—figure supplement 47
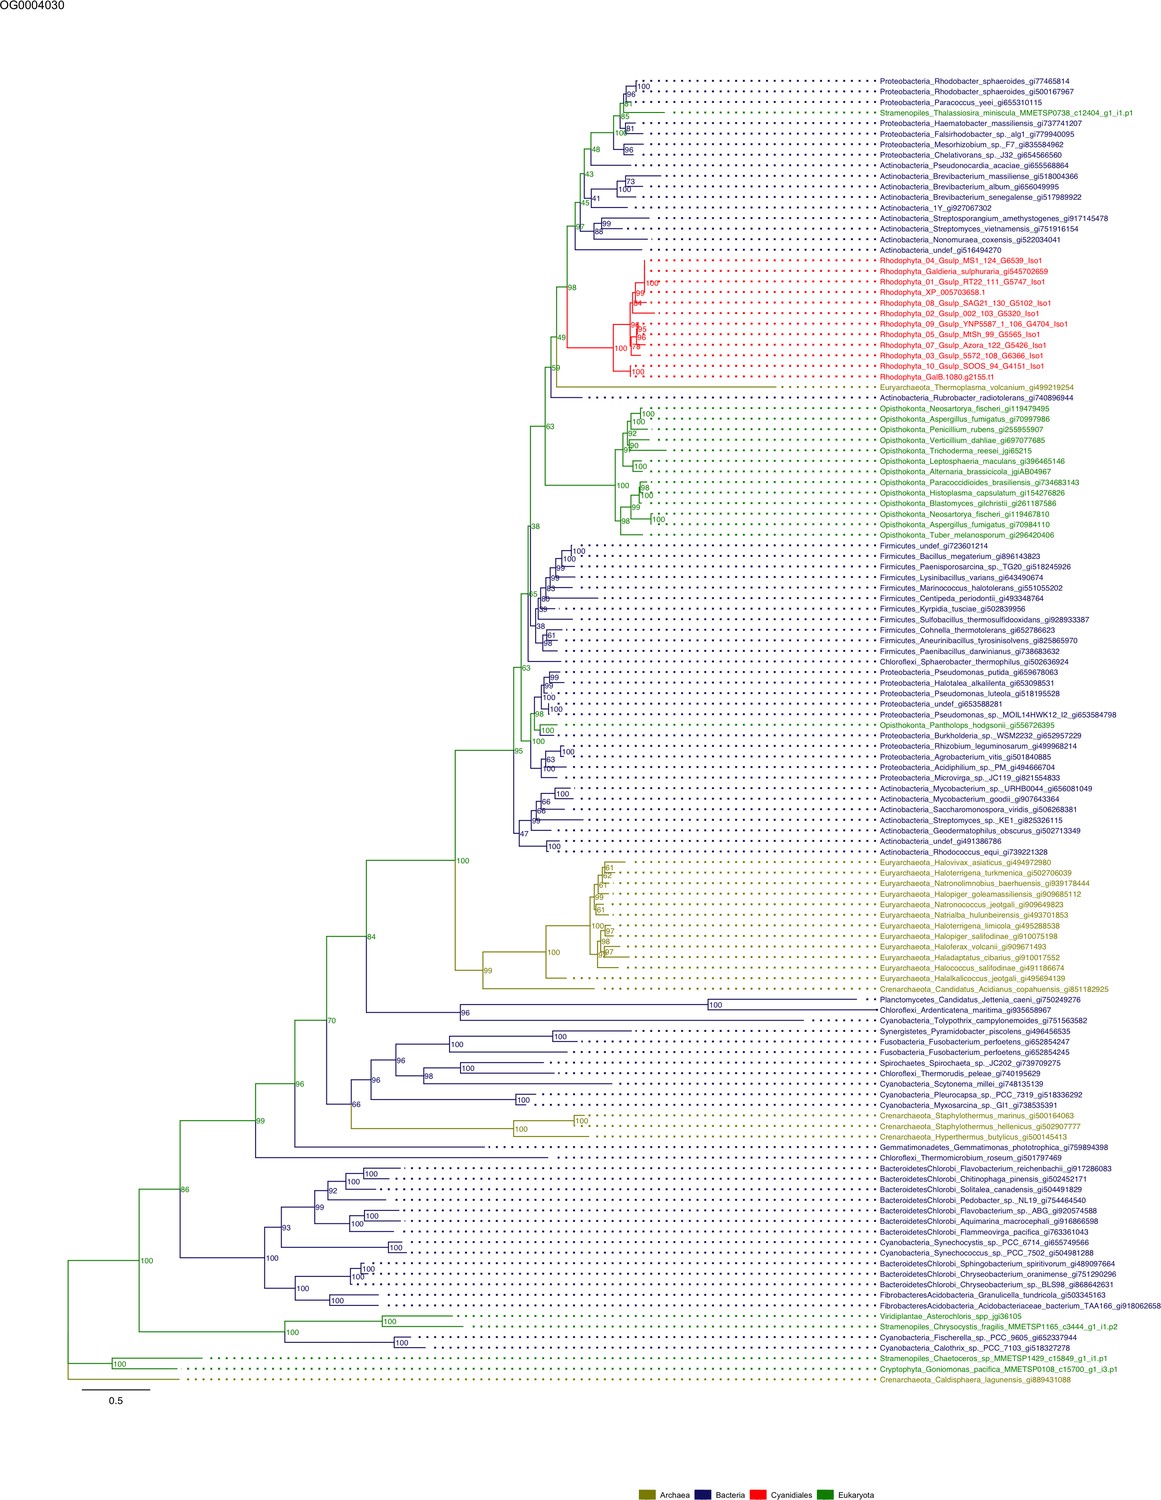
Sequence tree of orthogroup OG0004030.
The tree is based on amino acid sequences. Archaea (yellow), Bacteria (blue), Cyanidiales (red), Eukaryotes including other red algae (green). Branches containing Cyanidiales sequences are highlited in red.
Figure 5—figure supplement 48
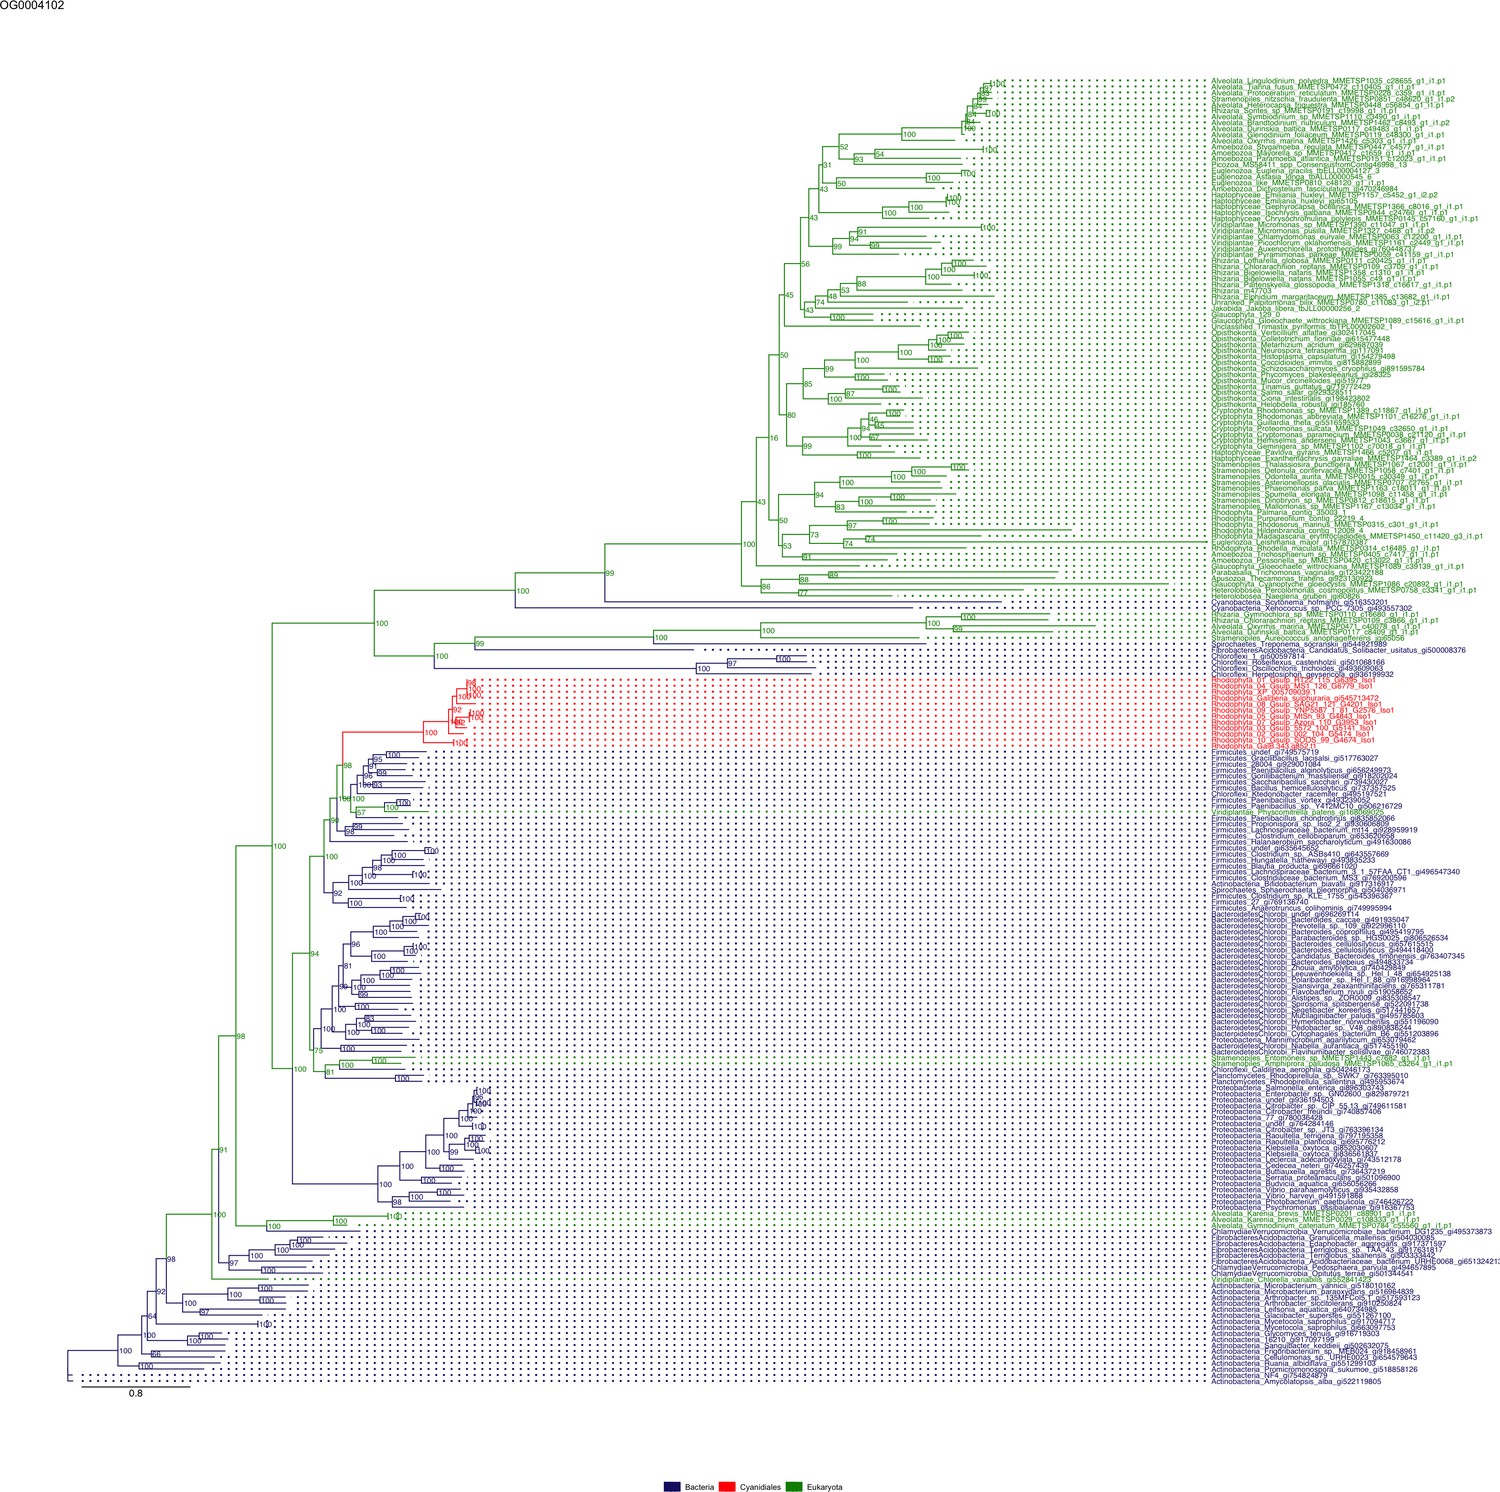
Sequence tree of orthogroup OG0004102.
The tree is based on amino acid sequences. Archaea (yellow), Bacteria (blue), Cyanidiales (red), Eukaryotes including other red algae (green). Branches containing Cyanidiales sequences are highlited in red.
Figure 5—figure supplement 49
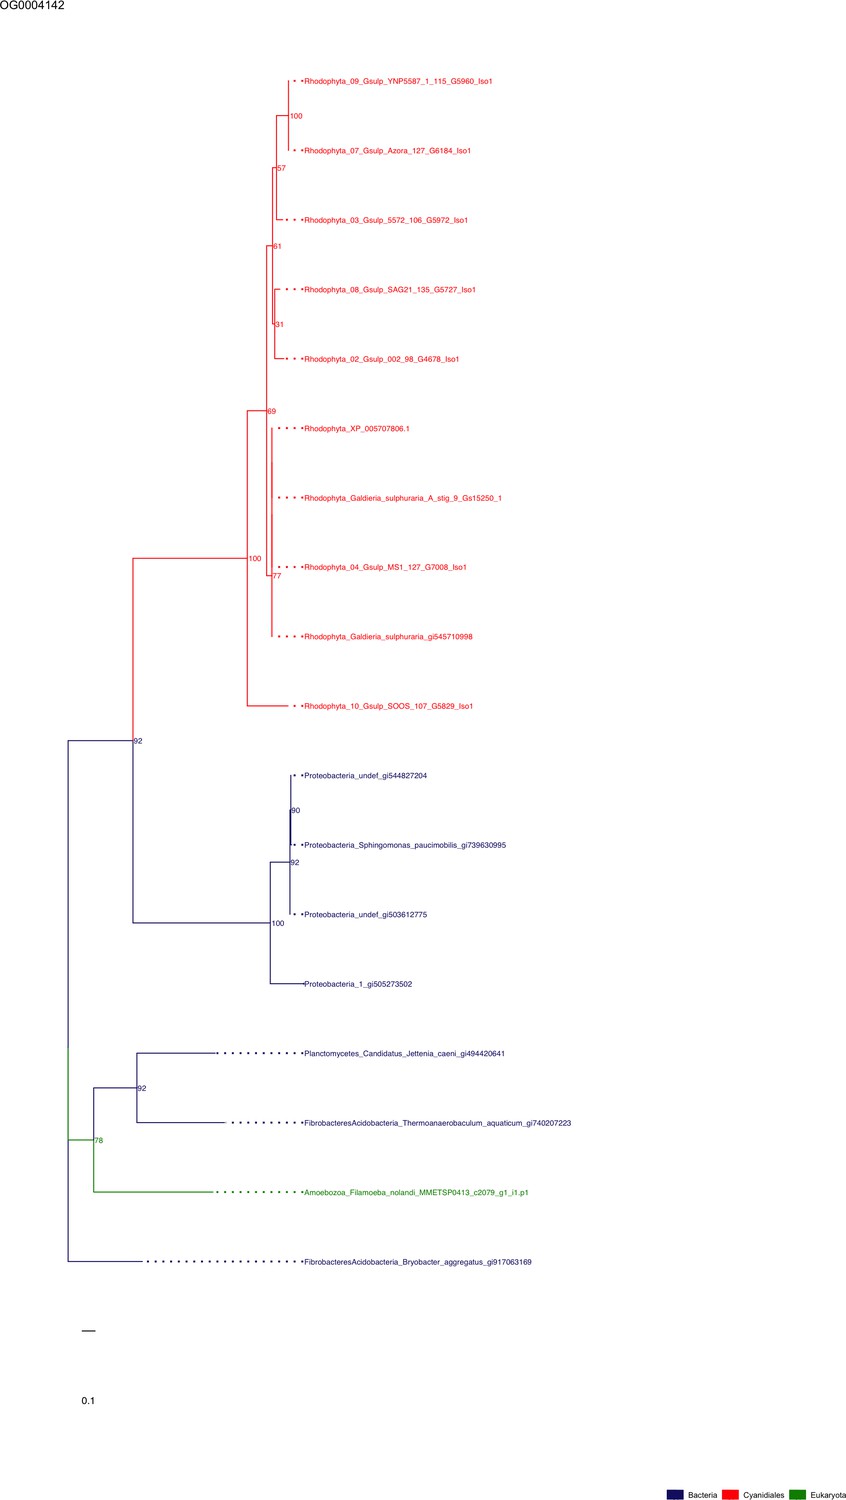
Sequence tree of orthogroup OG0004142.
The tree is based on amino acid sequences. Archaea (yellow), Bacteria (blue), Cyanidiales (red), Eukaryotes including other red algae (green). Branches containing Cyanidiales sequences are highlited in red.
Figure 5—figure supplement 50
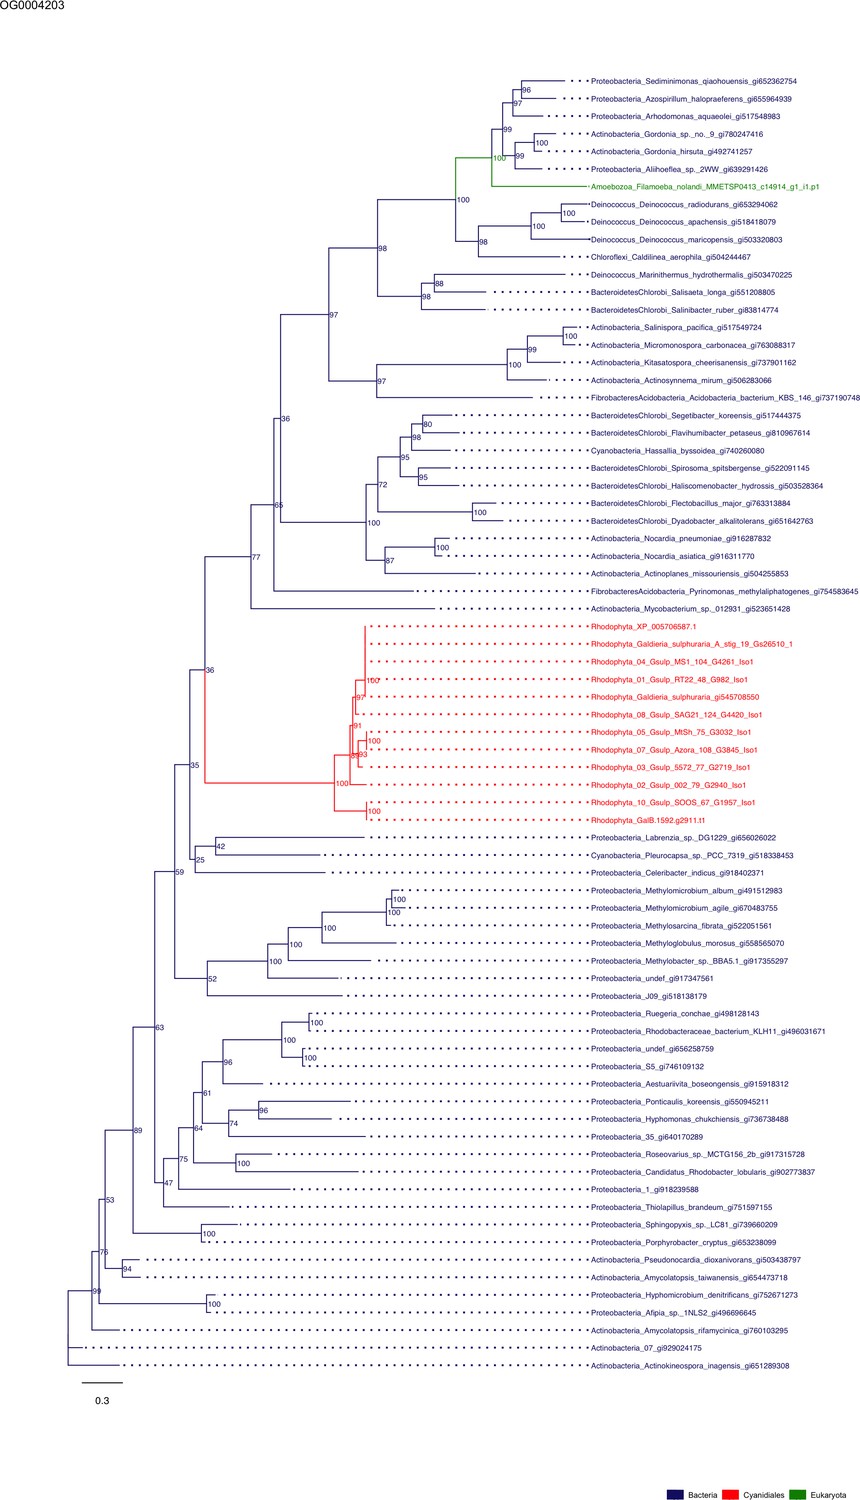
Sequence tree of orthogroup OG0004203.
The tree is based on amino acid sequences. Archaea (yellow), Bacteria (blue), Cyanidiales (red), Eukaryotes including other red algae (green). Branches containing Cyanidiales sequences are highlited in red.
Figure 5—figure supplement 51

Sequence tree of orthogroup OG0004258.
The tree is based on amino acid sequences. Archaea (yellow), Bacteria (blue), Cyanidiales (red), Eukaryotes including other red algae (green). Branches containing Cyanidiales sequences are highlited in red.
Figure 5—figure supplement 52
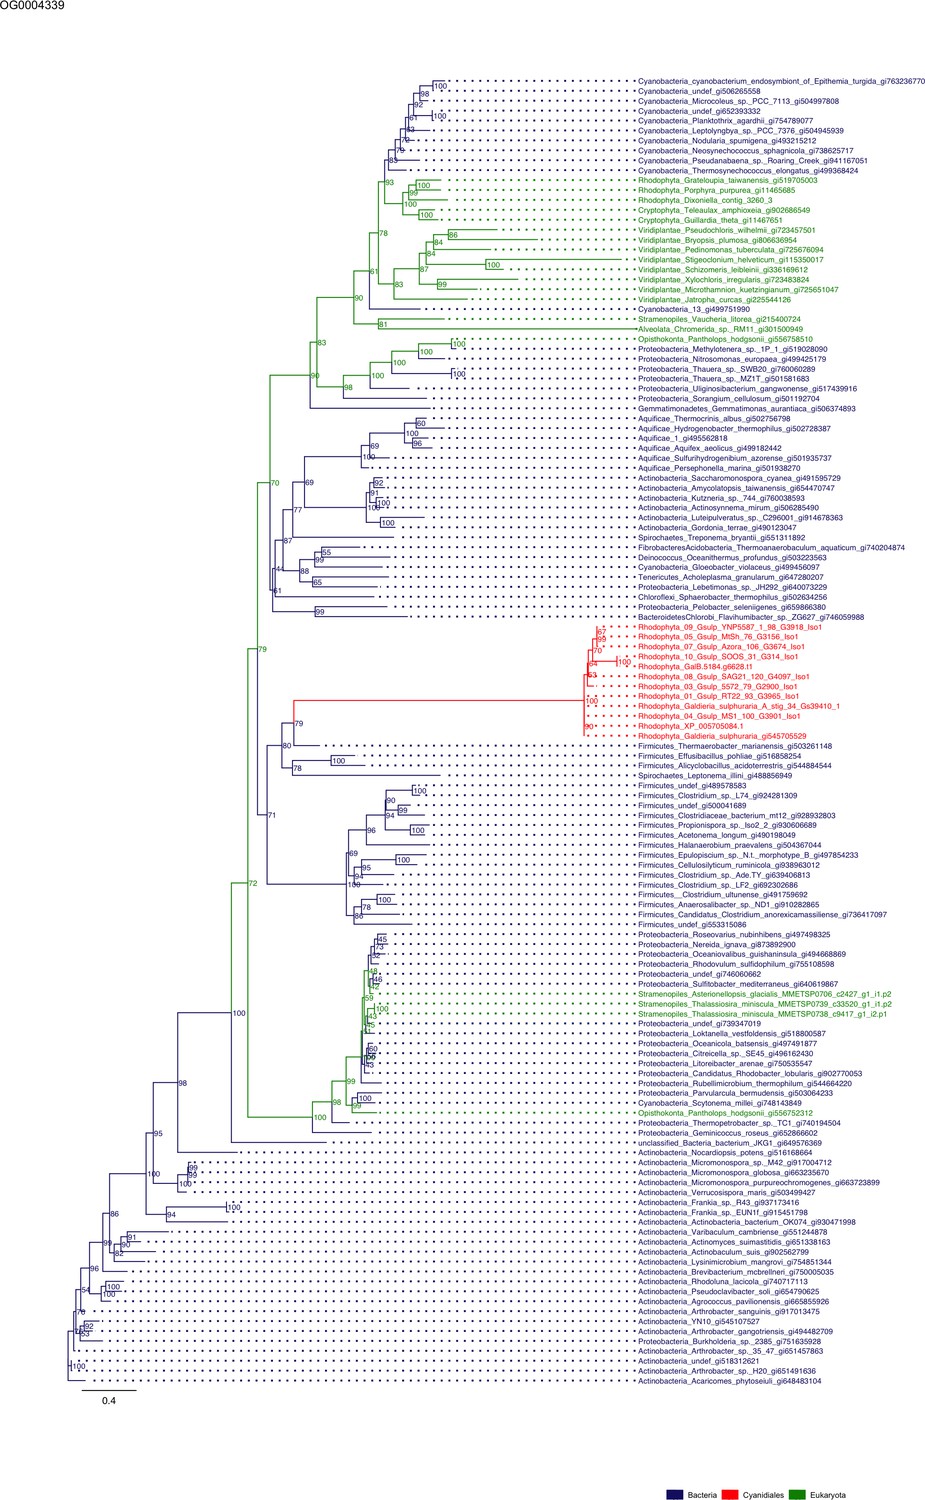
Sequence tree of orthogroup OG0004339.
The tree is based on amino acid sequences. Archaea (yellow), Bacteria (blue), Cyanidiales (red), Eukaryotes including other red algae (green). Branches containing Cyanidiales sequences are highlited in red.
Figure 5—figure supplement 53
Sequence tree of orthogroup OG0004392.
The tree is based on amino acid sequences. Archaea (yellow), Bacteria (blue), Cyanidiales (red), Eukaryotes including other red algae (green). Branches containing Cyanidiales sequences are highlited in red.
Figure 5—figure supplement 54
Sequence tree of orthogroup OG0004405.
The tree is based on amino acid sequences. Archaea (yellow), Bacteria (blue), Cyanidiales (red), Eukaryotes including other red algae (green). Branches containing Cyanidiales sequences are highlited in red.
Figure 5—figure supplement 55
Sequence tree of orthogroup OG0004486.
The tree is based on amino acid sequences. Archaea (yellow), Bacteria (blue), Cyanidiales (red), Eukaryotes including other red algae (green). Branches containing Cyanidiales sequences are highlited in red.
Figure 5—figure supplement 56
Sequence tree of orthogroup OG0004658.
The tree is based on amino acid sequences. Archaea (yellow), Bacteria (blue), Cyanidiales (red), Eukaryotes including other red algae (green). Branches containing Cyanidiales sequences are highlited in red.
Figure 5—figure supplement 57
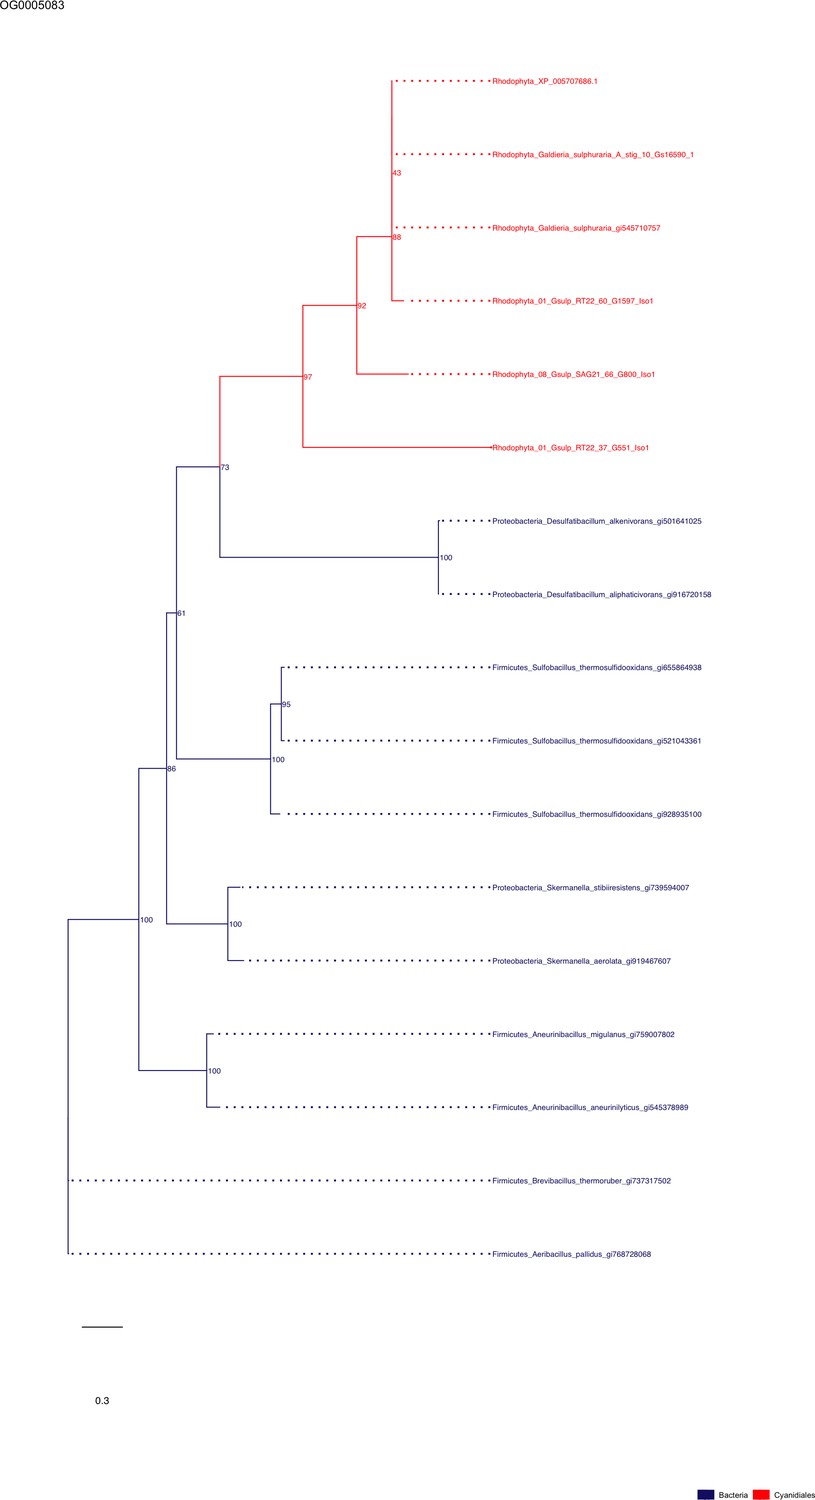
Sequence tree of orthogroup OG0005083.
The tree is based on amino acid sequences. Archaea (yellow), Bacteria (blue), Cyanidiales (red), Eukaryotes including other red algae (green). Branches containing Cyanidiales sequences are highlited in red.
Figure 5—figure supplement 58
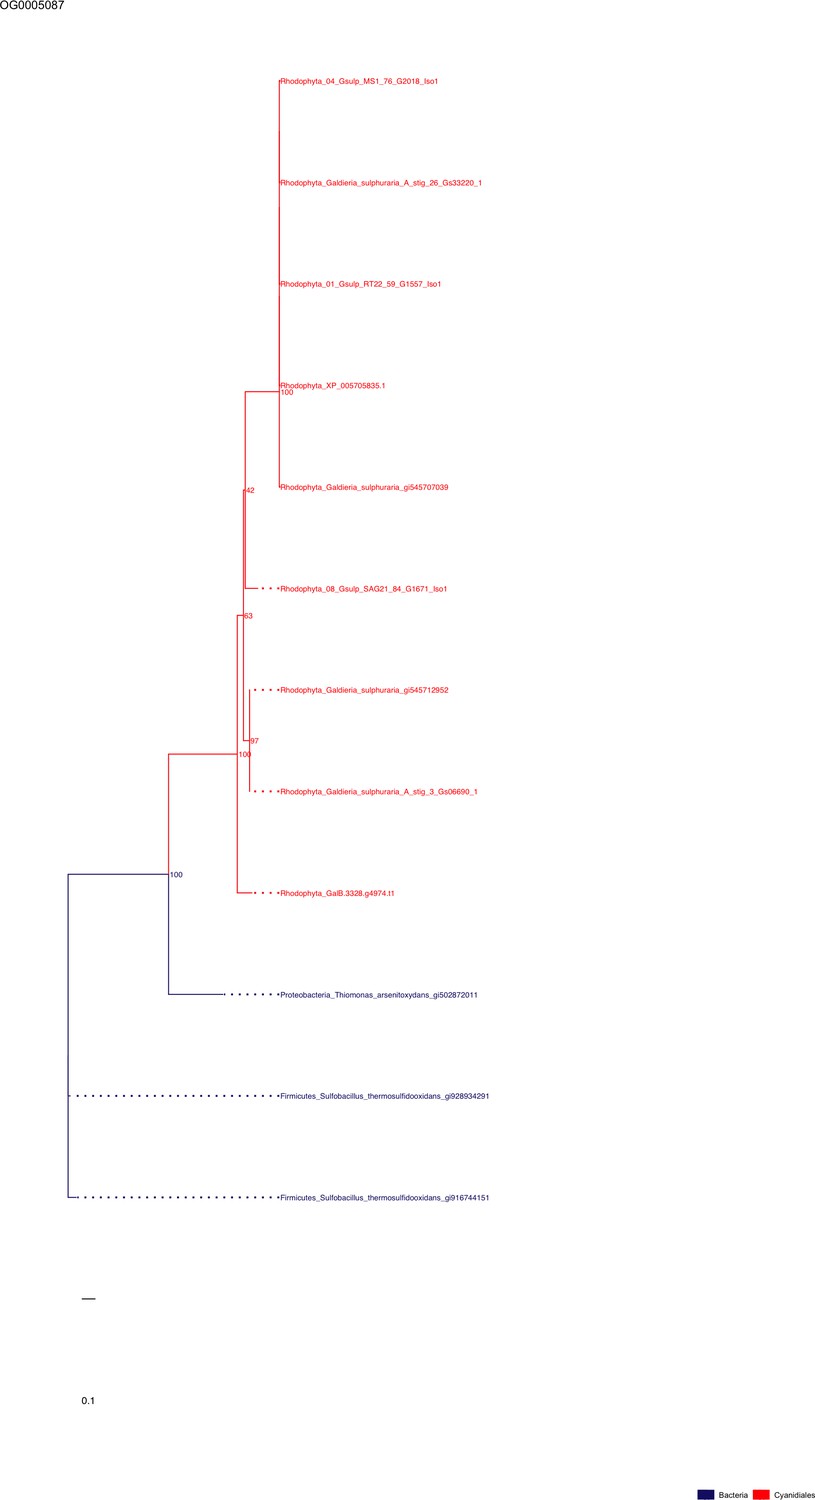
Sequence tree of orthogroup OG0005087.
The tree is based on amino acid sequences. Archaea (yellow), Bacteria (blue), Cyanidiales (red), Eukaryotes including other red algae (green). Branches containing Cyanidiales sequences are highlited in red.
Figure 5—figure supplement 59

Sequence tree of orthogroup OG0005153.
The tree is based on amino acid sequences. Archaea (yellow), Bacteria (blue), Cyanidiales (red), Eukaryotes including other red algae (green). Branches containing Cyanidiales sequences are highlited in red.
Figure 5—figure supplement 60
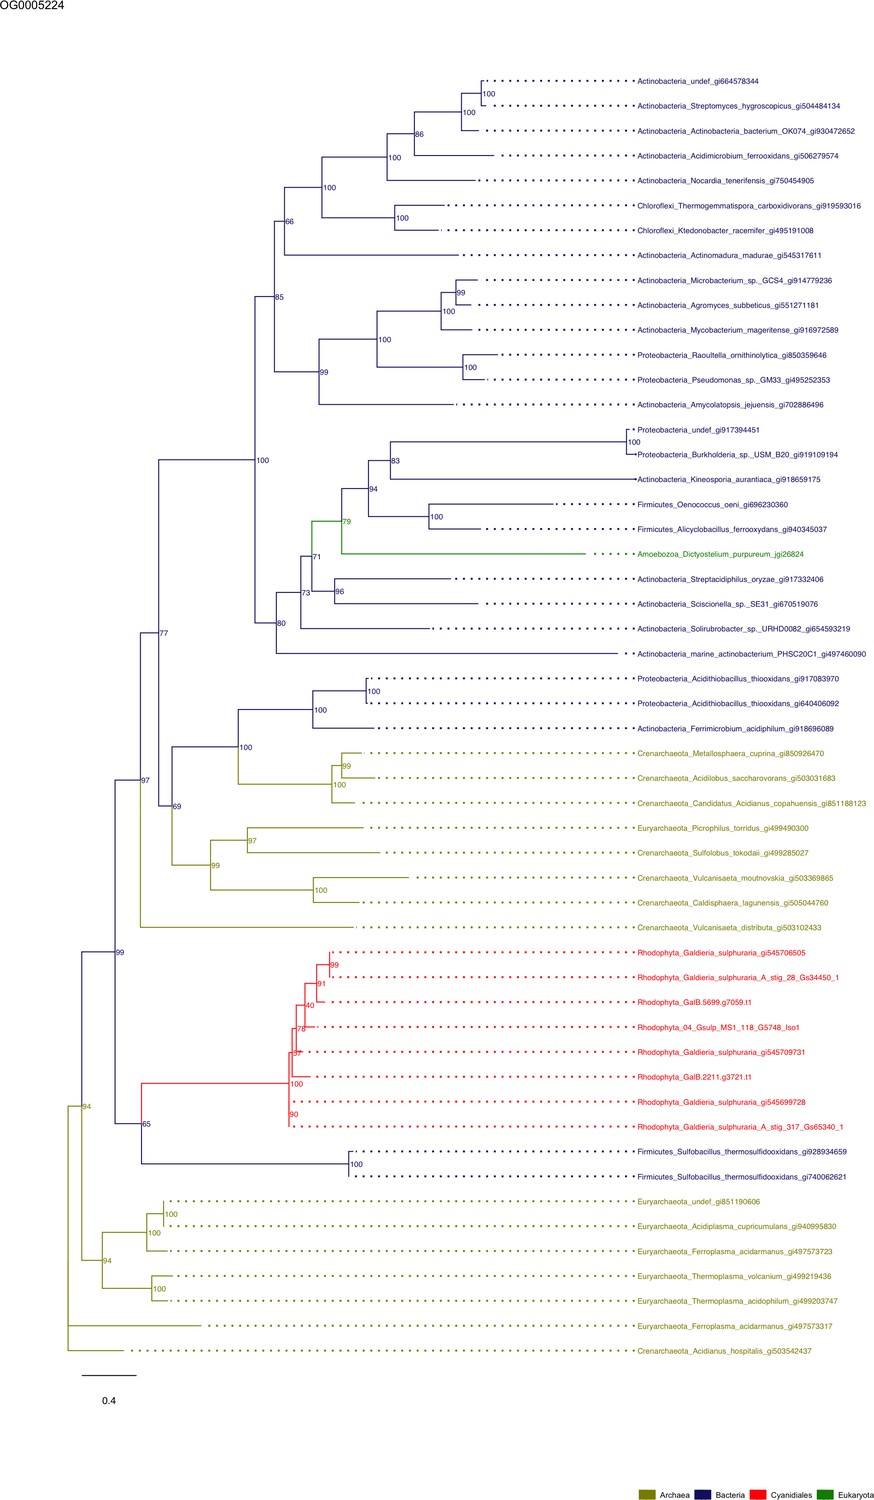
Sequence tree of orthogroup OG0005224.
The tree is based on amino acid sequences. Archaea (yellow), Bacteria (blue), Cyanidiales (red), Eukaryotes including other red algae (green). Branches containing Cyanidiales sequences are highlited in red.
Figure 5—figure supplement 61
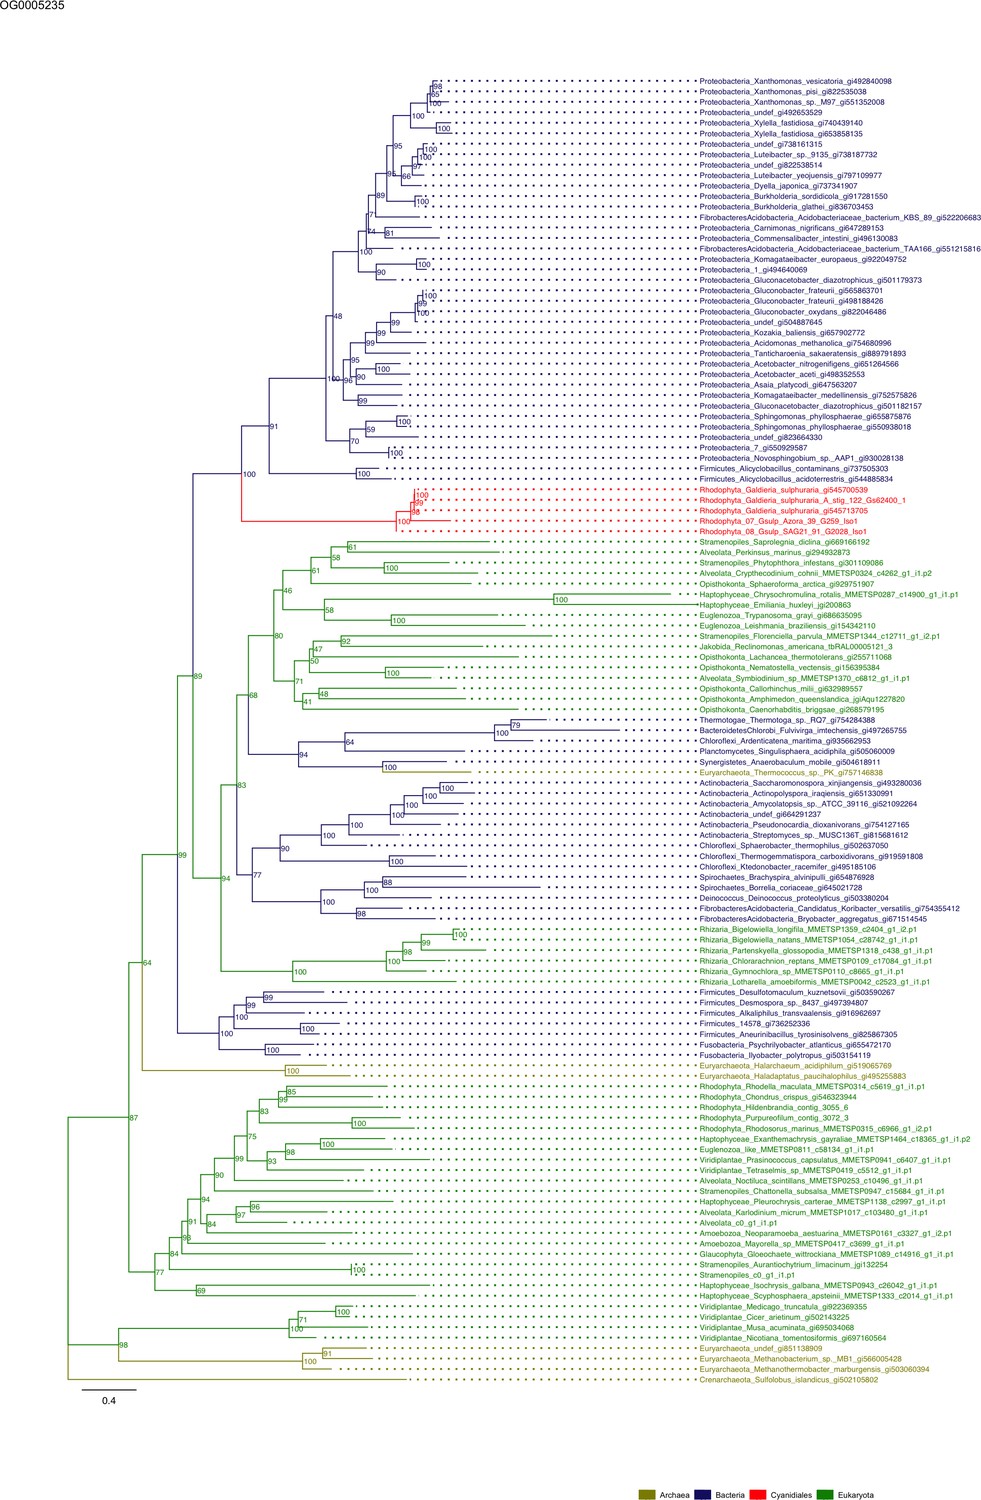
Sequence tree of orthogroup OG0005235.
The tree is based on amino acid sequences. Archaea (yellow), Bacteria (blue), Cyanidiales (red), Eukaryotes including other red algae (green). Branches containing Cyanidiales sequences are highlited in red.
Figure 5—figure supplement 62
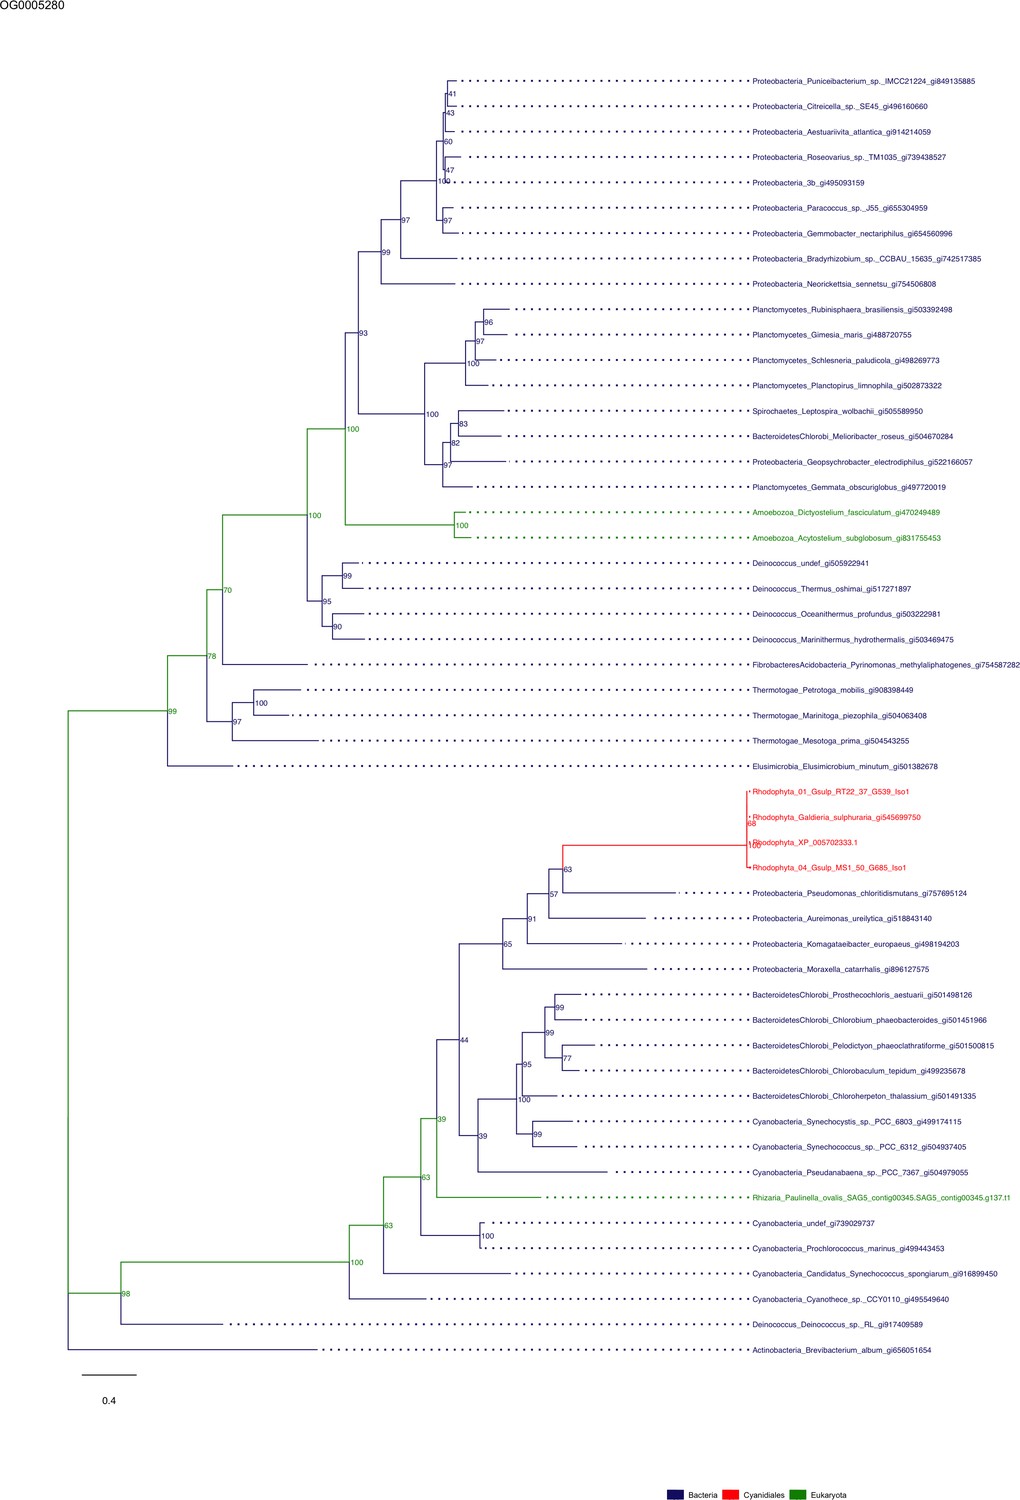
Sequence tree of orthogroup OG0005280.
The tree is based on amino acid sequences. Archaea (yellow), Bacteria (blue), Cyanidiales (red), Eukaryotes including other red algae (green). Branches containing Cyanidiales sequences are highlited in red.
Figure 5—figure supplement 63
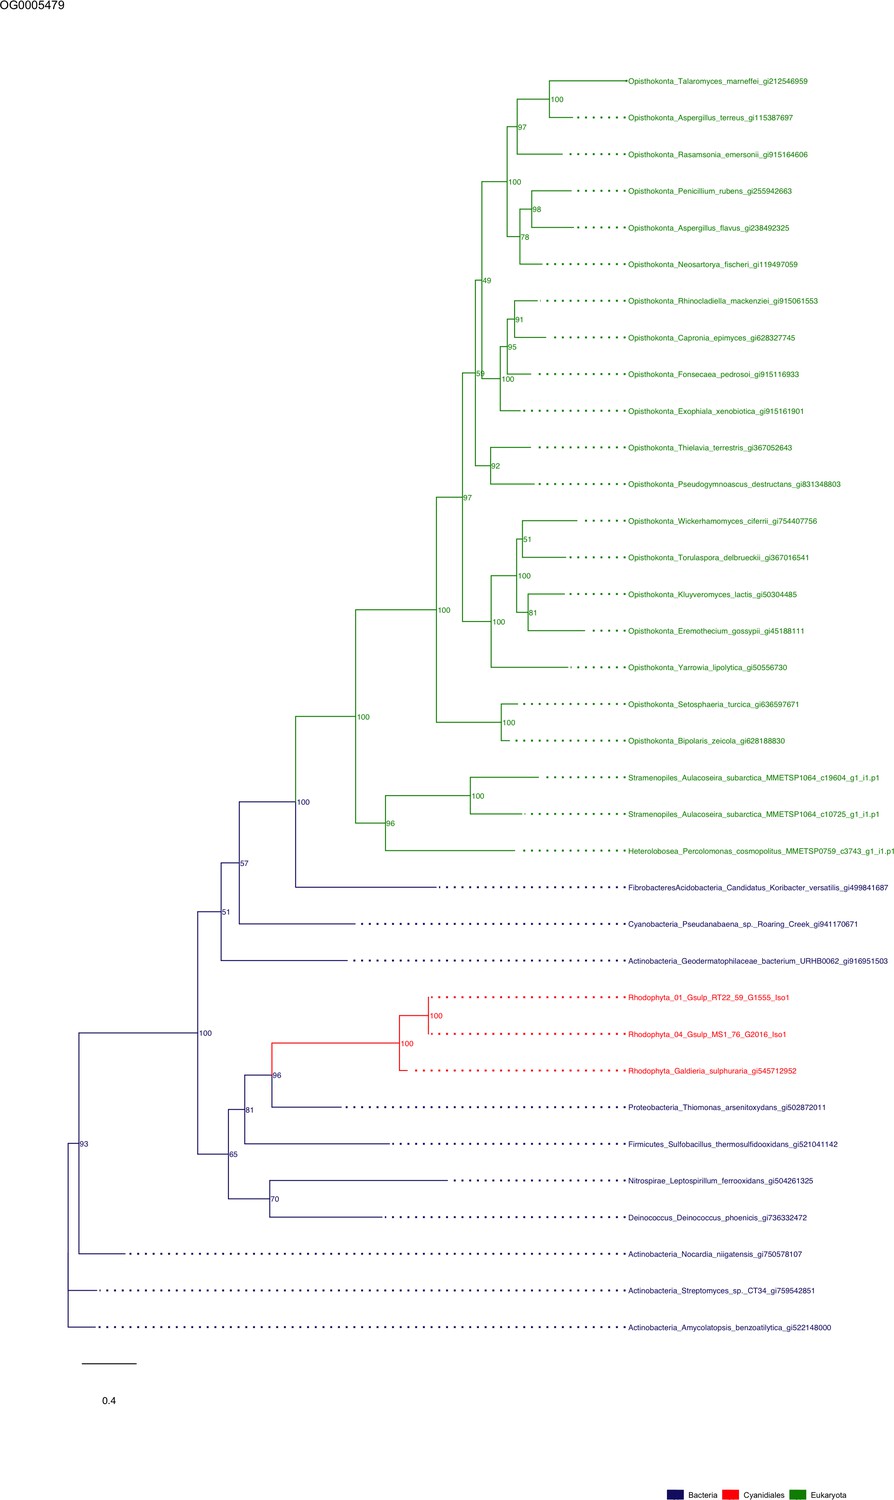
Sequence tree of orthogroup OG0005479.
The tree is based on amino acid sequences. Archaea (yellow), Bacteria (blue), Cyanidiales (red), Eukaryotes including other red algae (green). Branches containing Cyanidiales sequences are highlited in red.
Figure 5—figure supplement 64
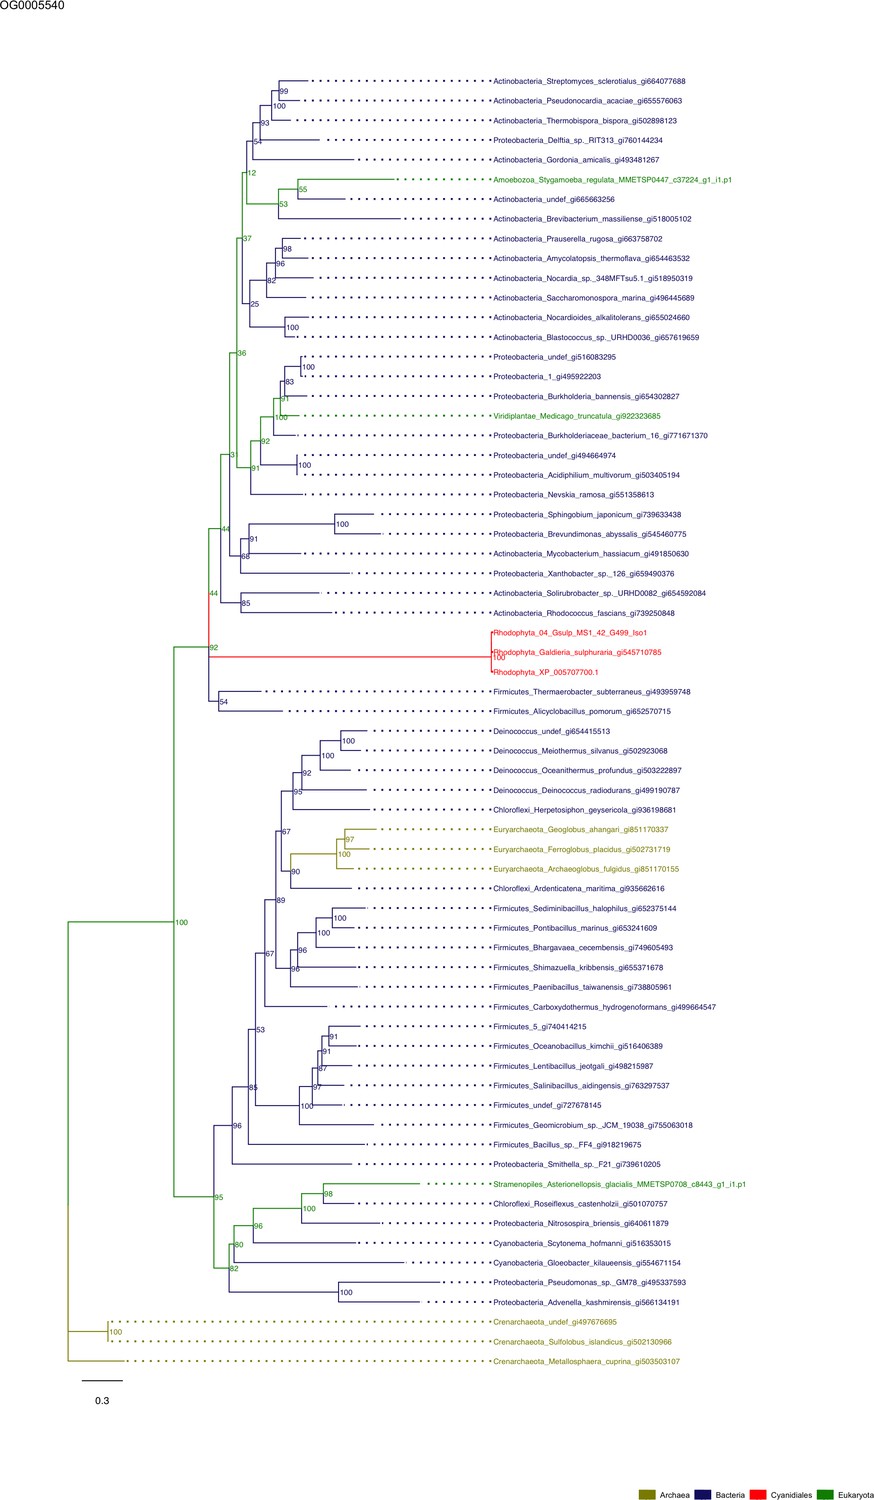
Sequence tree of orthogroup OG0005540.
The tree is based on amino acid sequences. Archaea (yellow), Bacteria (blue), Cyanidiales (red), Eukaryotes including other red algae (green). Branches containing Cyanidiales sequences are highlited in red.
Figure 5—figure supplement 65
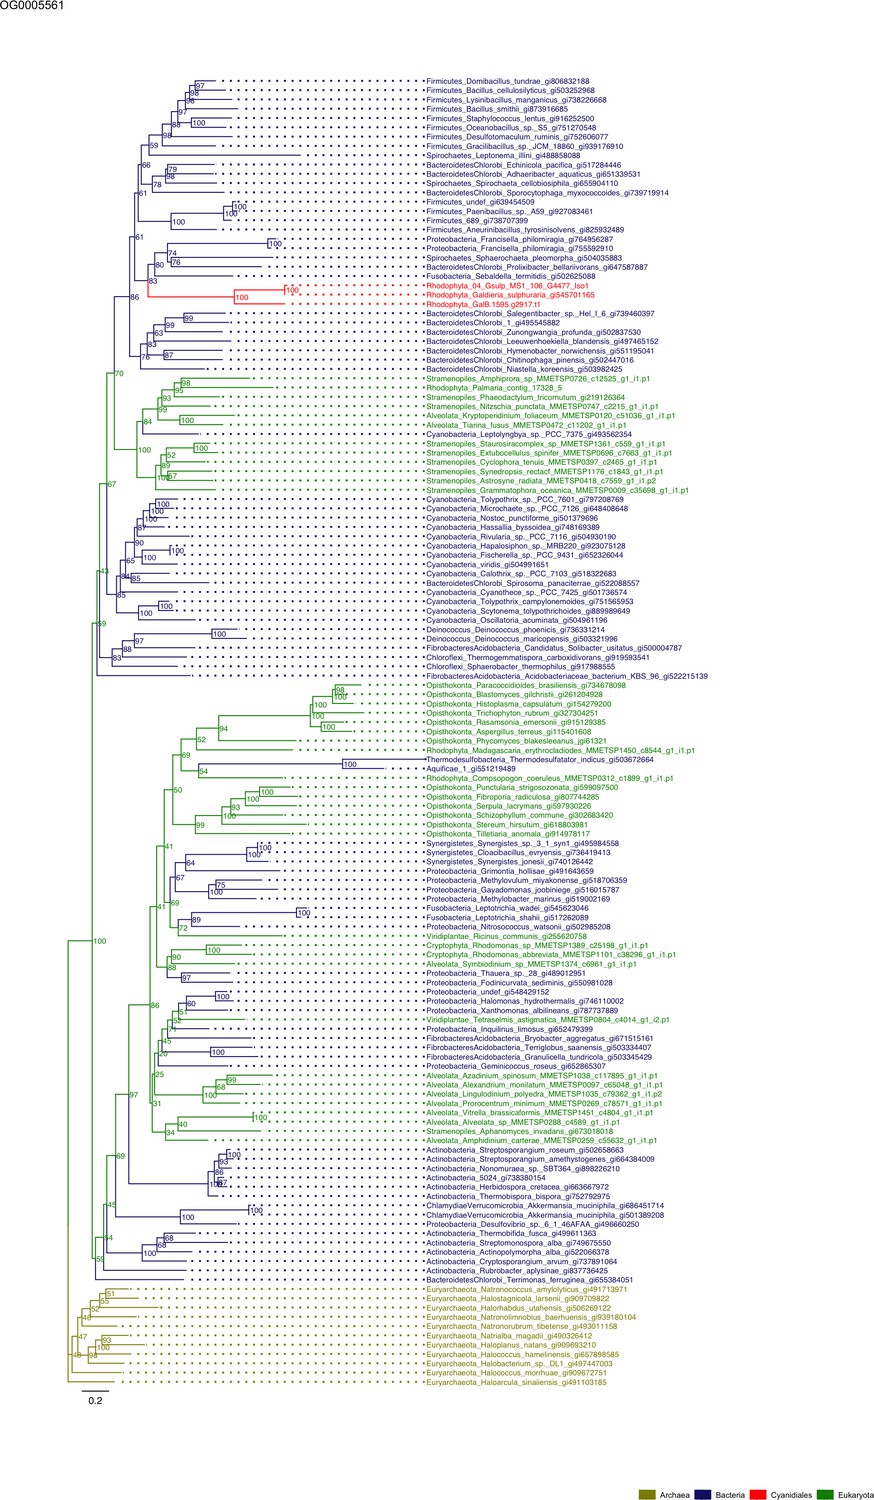
Sequence tree of orthogroup OG0005561.
The tree is based on amino acid sequences. Archaea (yellow), Bacteria (blue), Cyanidiales (red), Eukaryotes including other red algae (green). Branches containing Cyanidiales sequences are highlited in red.
Figure 5—figure supplement 66
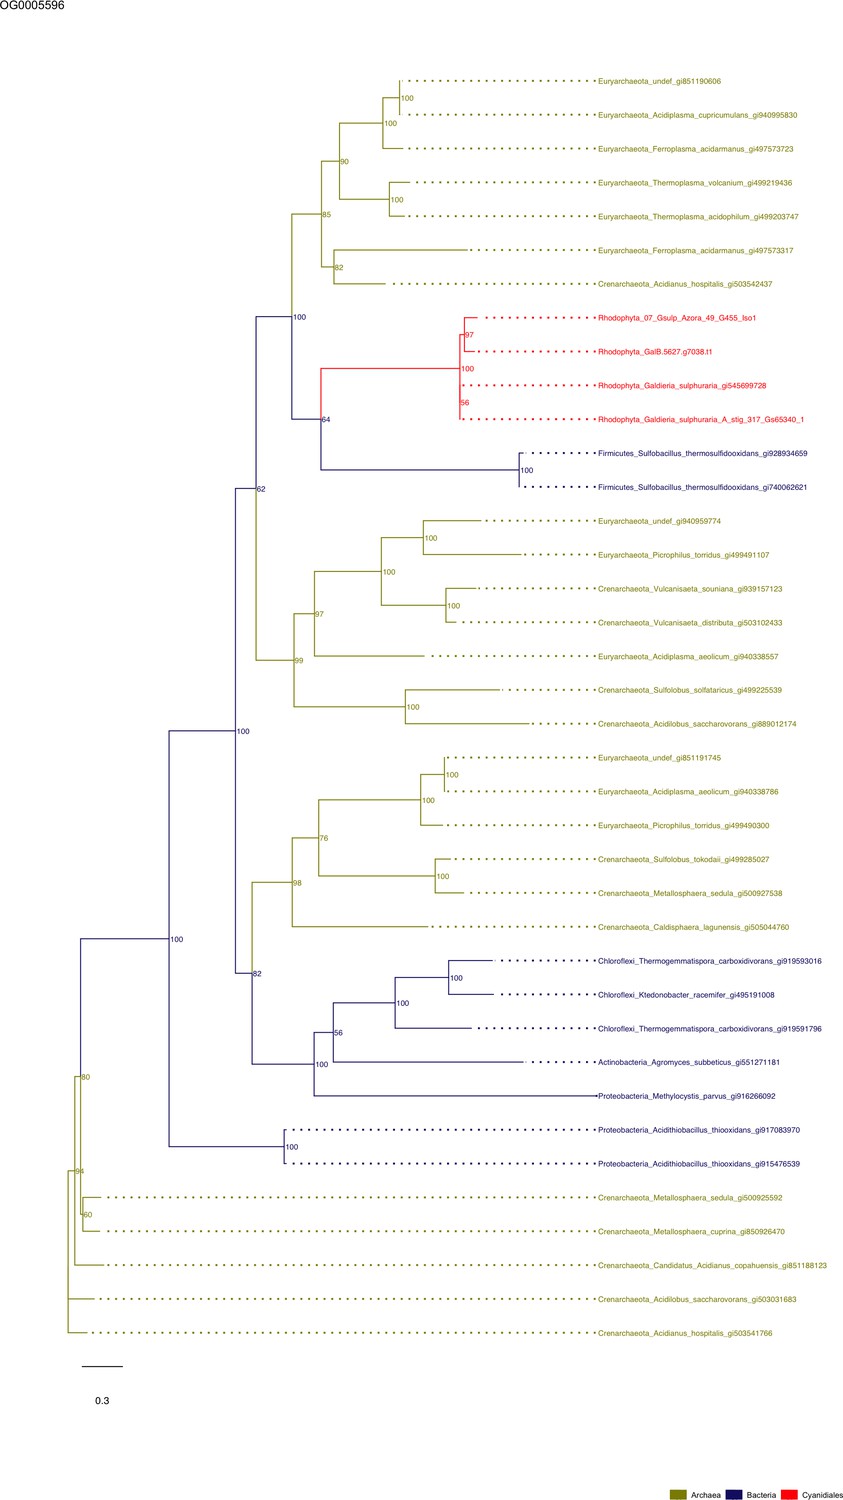
Sequence tree of orthogroup OG0005596.
The tree is based on amino acid sequences. Archaea (yellow), Bacteria (blue), Cyanidiales (red), Eukaryotes including other red algae (green). Branches containing Cyanidiales sequences are highlited in red.
Figure 5—figure supplement 67
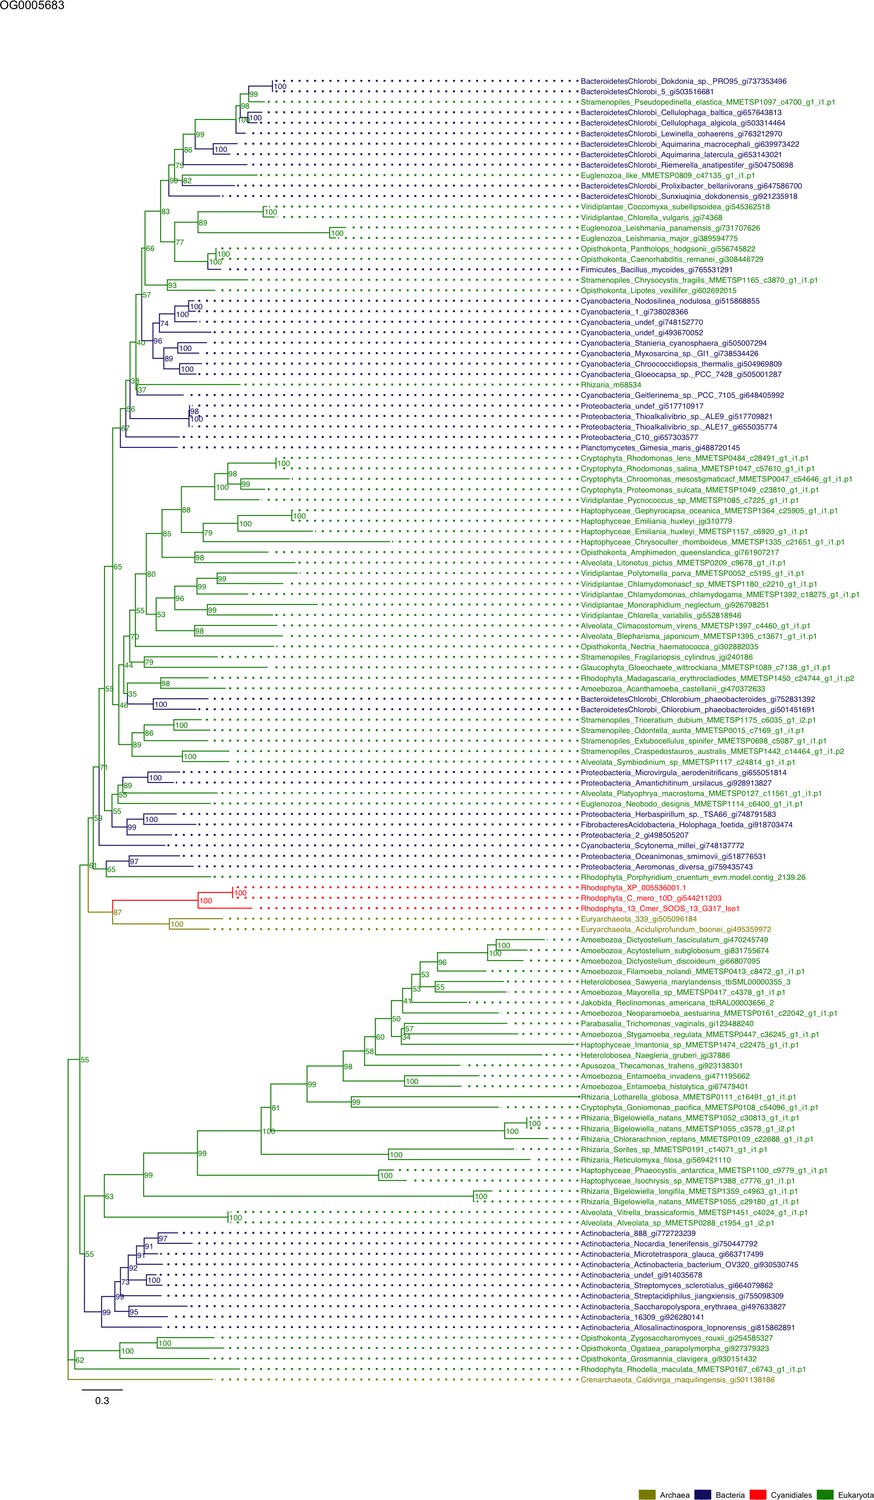
Sequence tree of orthogroup OG0005683.
The tree is based on amino acid sequences. Archaea (yellow), Bacteria (blue), Cyanidiales (red), Eukaryotes including other red algae (green). Branches containing Cyanidiales sequences are highlited in red.
Figure 5—figure supplement 68
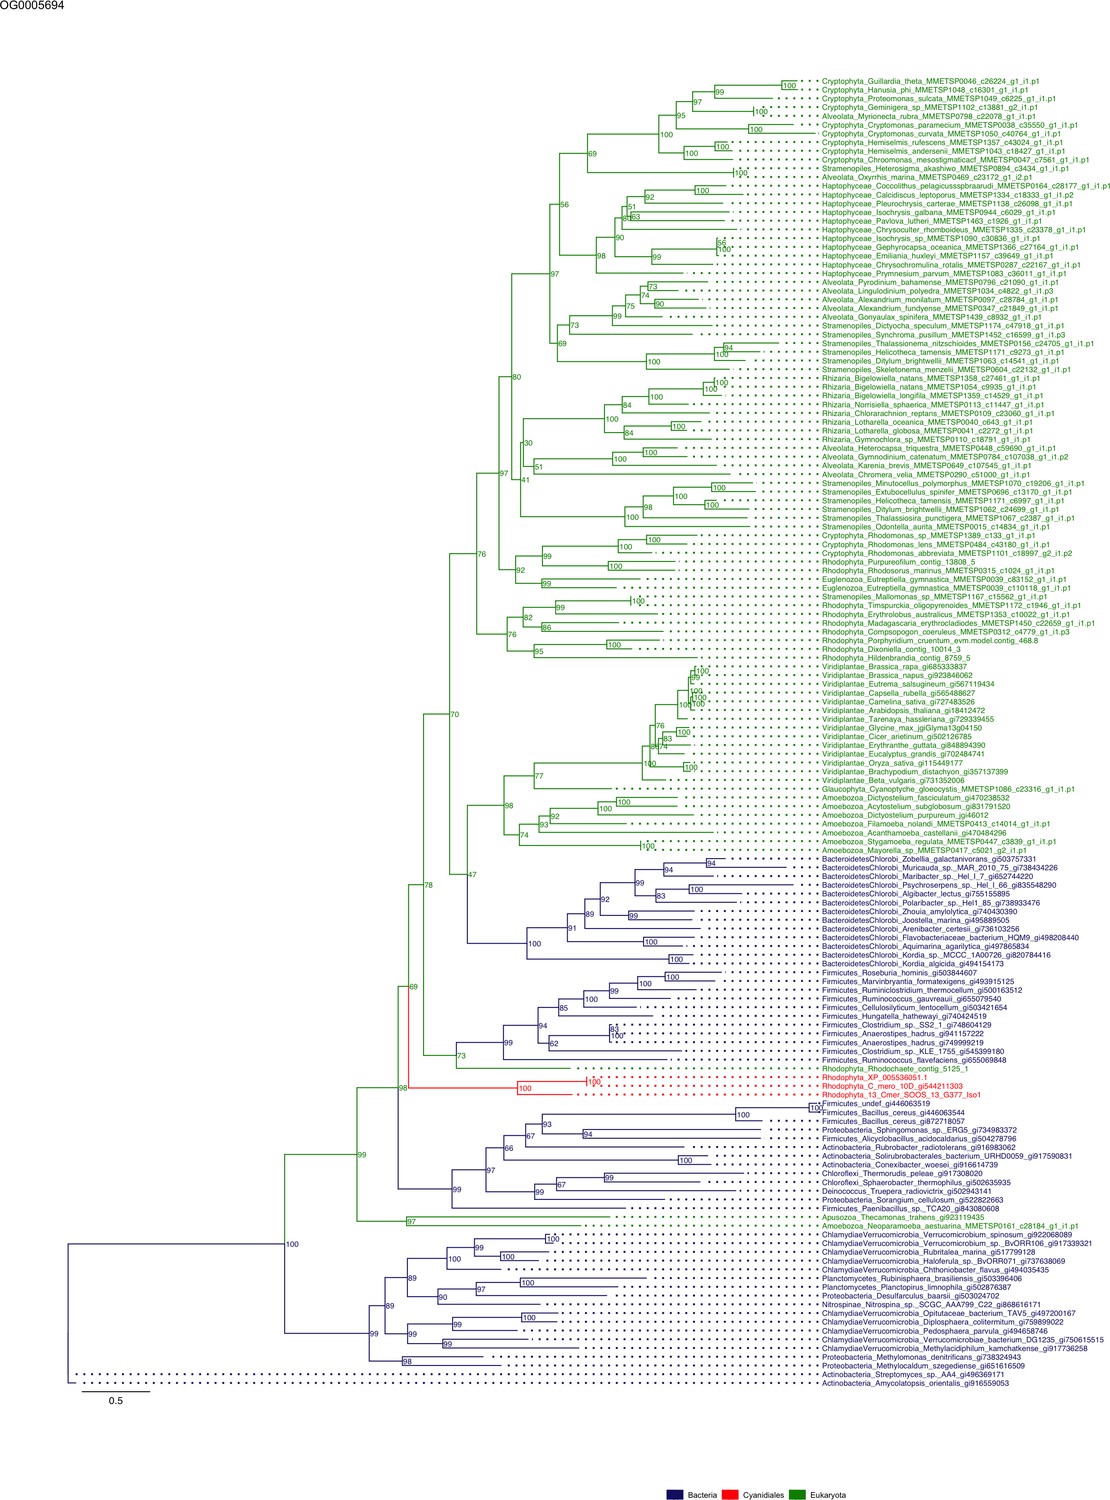
Sequence tree of orthogroup OG0005694.
The tree is based on amino acid sequences. Archaea (yellow), Bacteria (blue), Cyanidiales (red), Eukaryotes including other red algae (green). Branches containing Cyanidiales sequences are highlited in red.
Figure 5—figure supplement 69
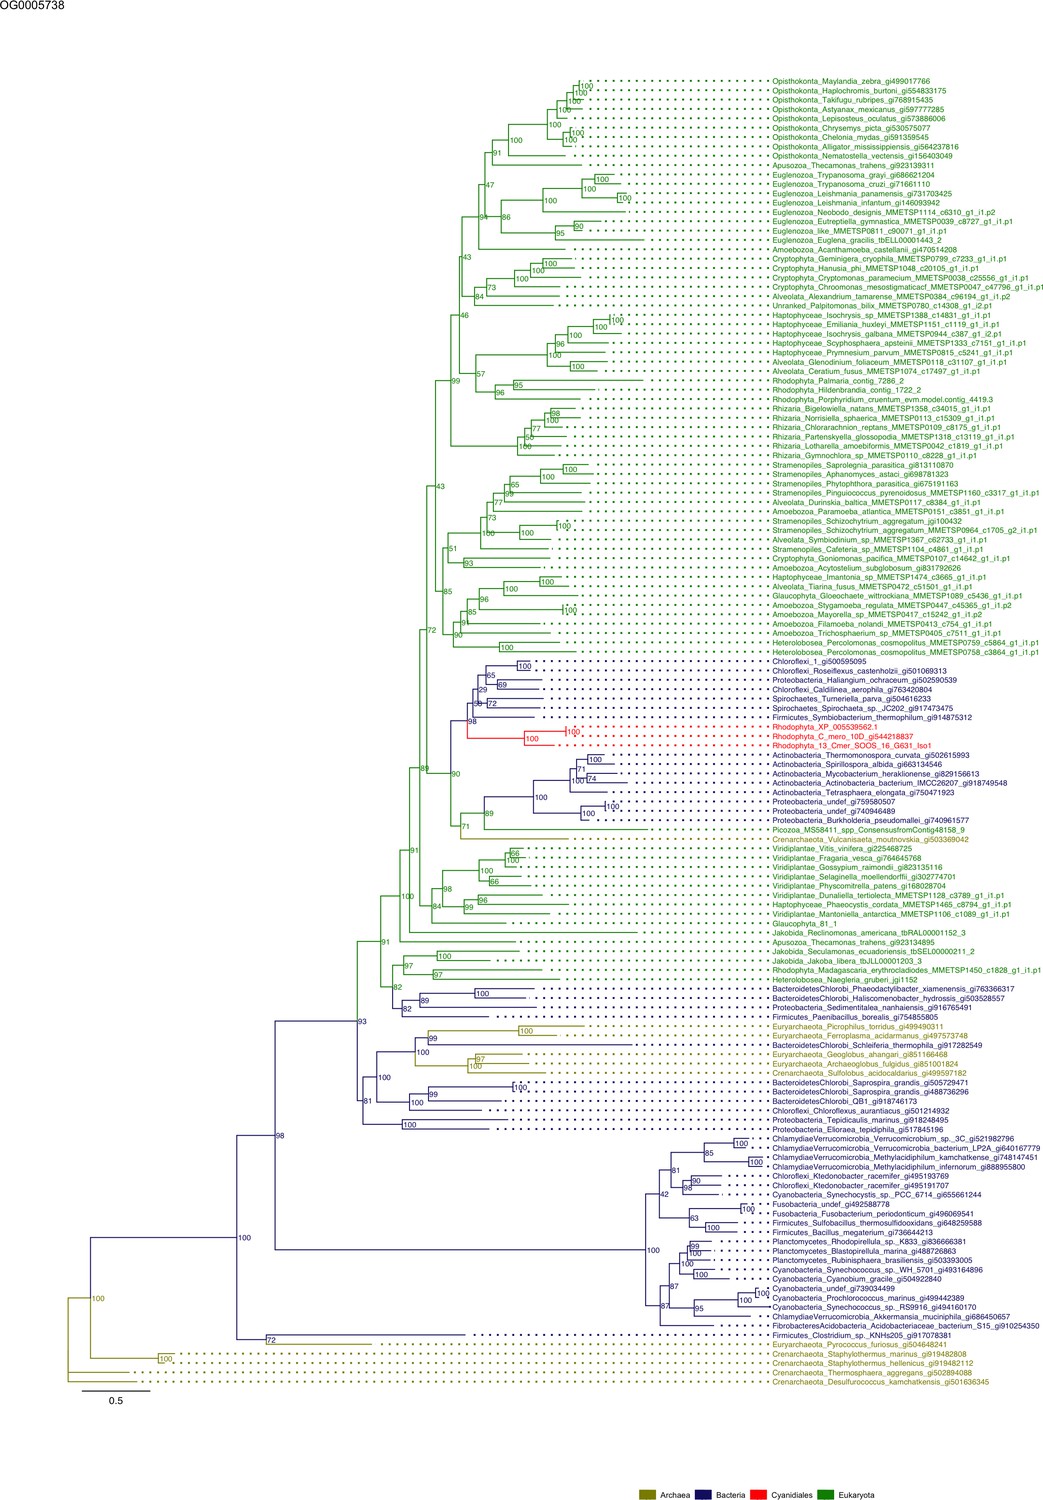
Sequence tree of orthogroup OG0005738.
The tree is based on amino acid sequences. Archaea (yellow), Bacteria (blue), Cyanidiales (red), Eukaryotes including other red algae (green). Branches containing Cyanidiales sequences are highlited in red.
Figure 5—figure supplement 70
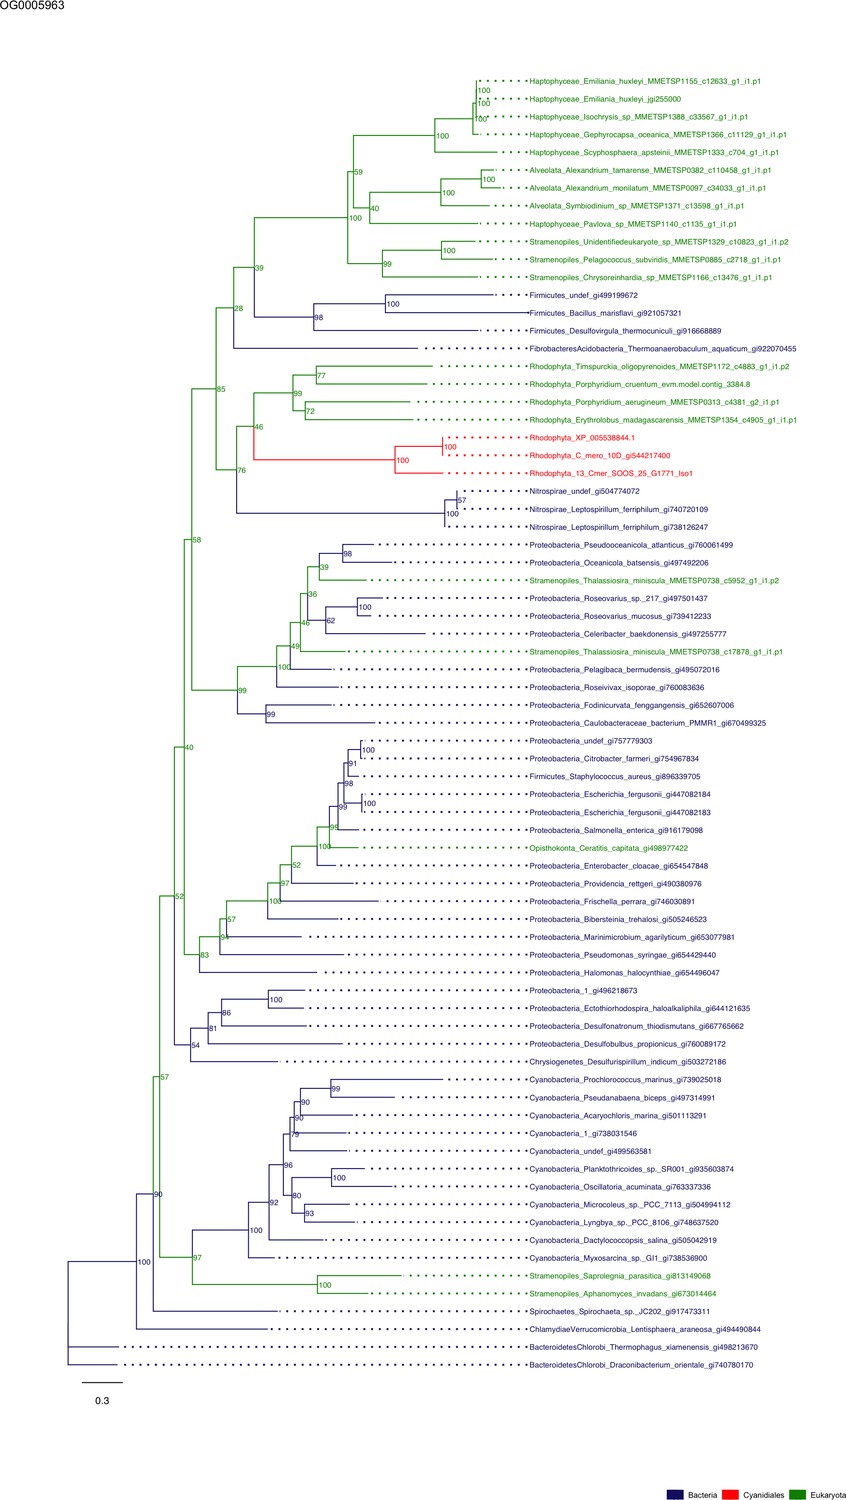
Sequence tree of orthogroup OG0005963.
The tree is based on amino acid sequences. Archaea (yellow), Bacteria (blue), Cyanidiales (red), Eukaryotes including other red algae (green). Branches containing Cyanidiales sequences are highlited in red.
Figure 5—figure supplement 71
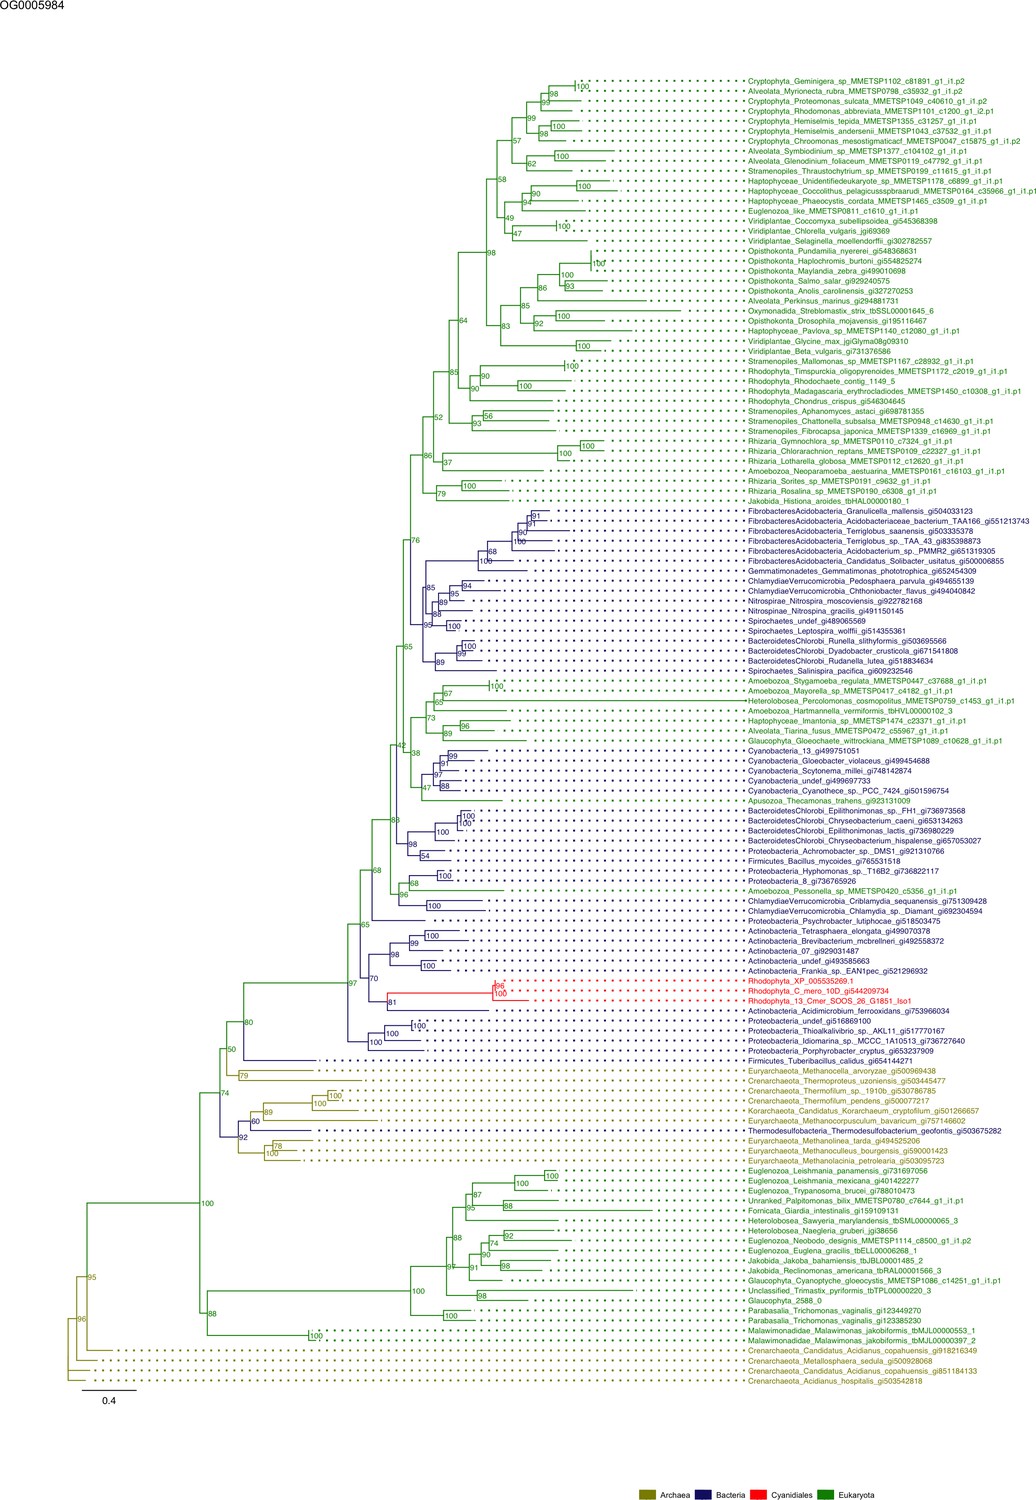
Sequence tree of orthogroup OG0005984.
The tree is based on amino acid sequences. Archaea (yellow), Bacteria (blue), Cyanidiales (red), Eukaryotes including other red algae (green). Branches containing Cyanidiales sequences are highlited in red.
Figure 5—figure supplement 72

Sequence tree of orthogroup OG0006136.
The tree is based on amino acid sequences. Archaea (yellow), Bacteria (blue), Cyanidiales (red), Eukaryotes including other red algae (green). Branches containing Cyanidiales sequences are highlited in red.
Figure 5—figure supplement 73
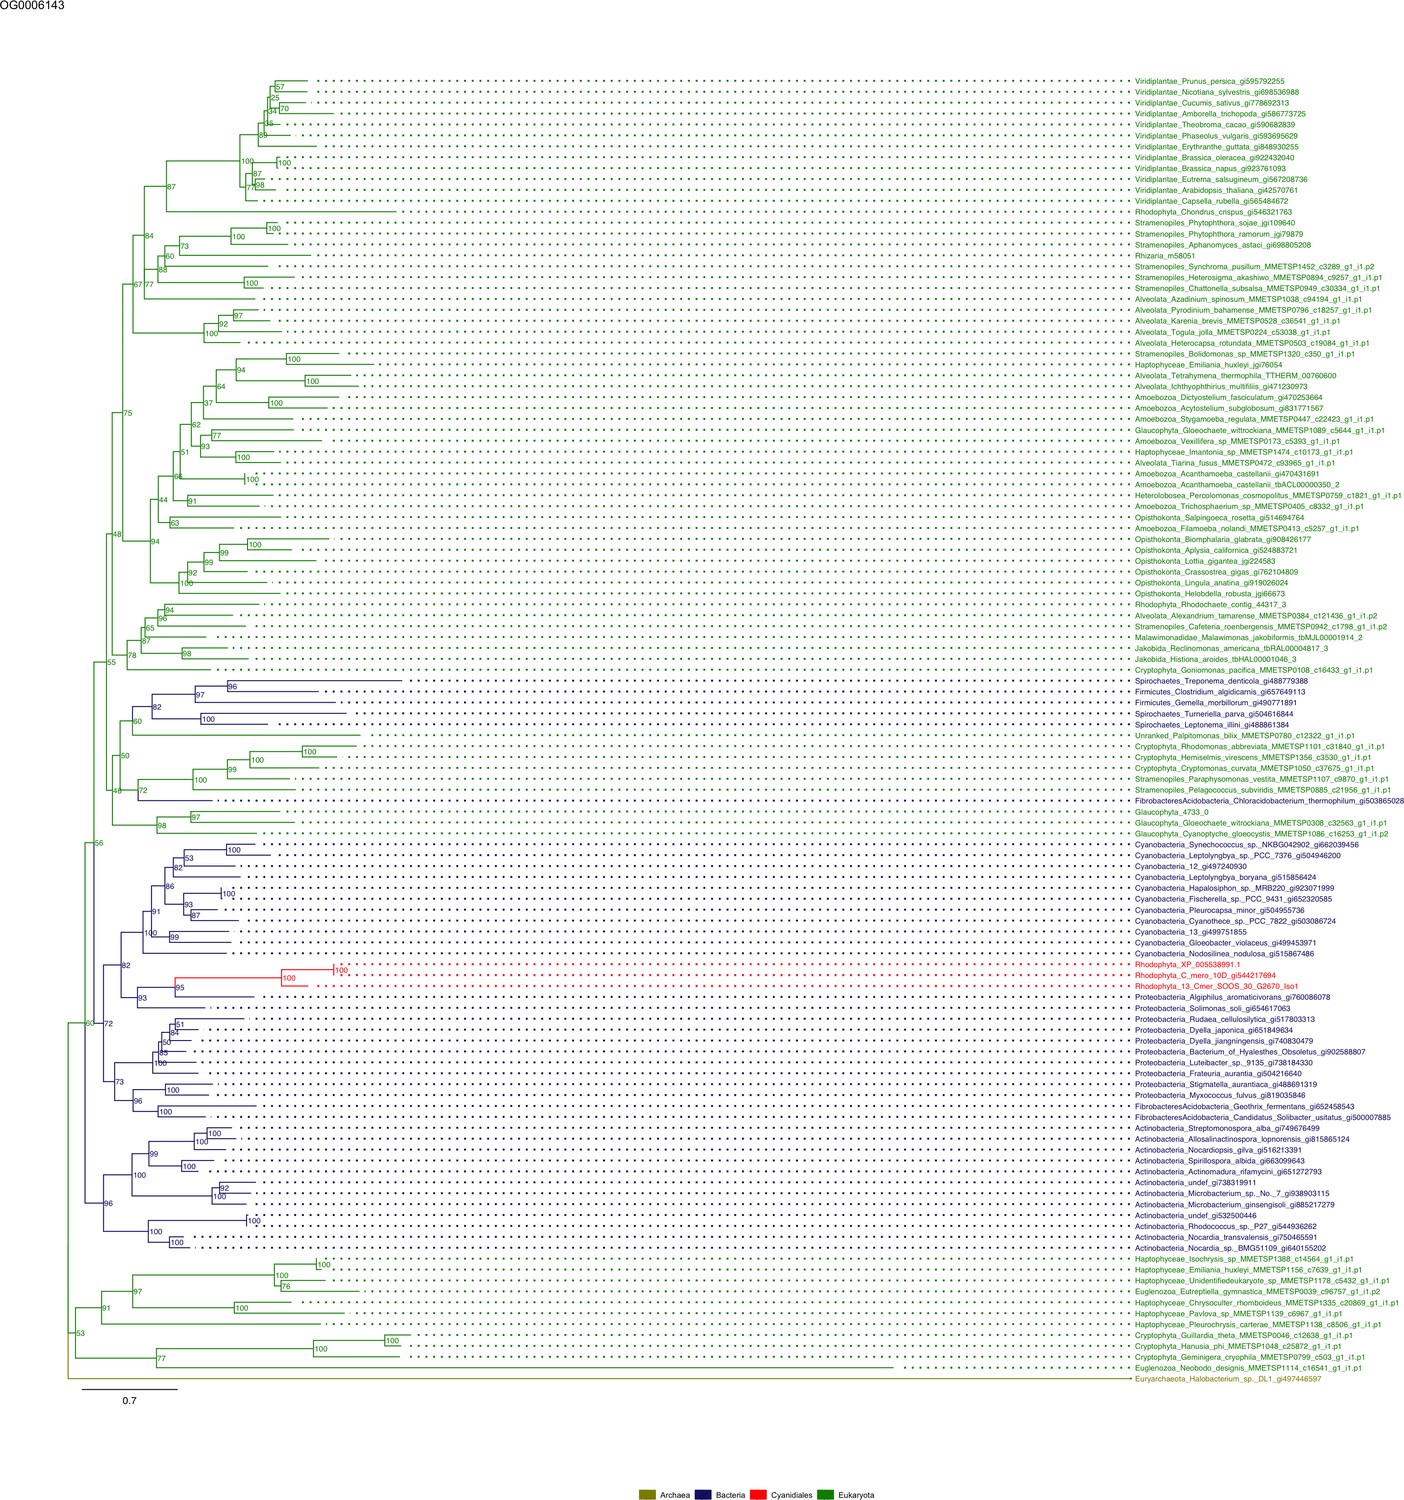
Sequence tree of orthogroup OG0006143.
The tree is based on amino acid sequences. Archaea (yellow), Bacteria (blue), Cyanidiales (red), Eukaryotes including other red algae (green). Branches containing Cyanidiales sequences are highlited in red.
Figure 5—figure supplement 74

Sequence tree of orthogroup OG0006191.
The tree is based on amino acid sequences. Archaea (yellow), Bacteria (blue), Cyanidiales (red), Eukaryotes including other red algae (green). Branches containing Cyanidiales sequences are highlited in red.
Figure 5—figure supplement 75
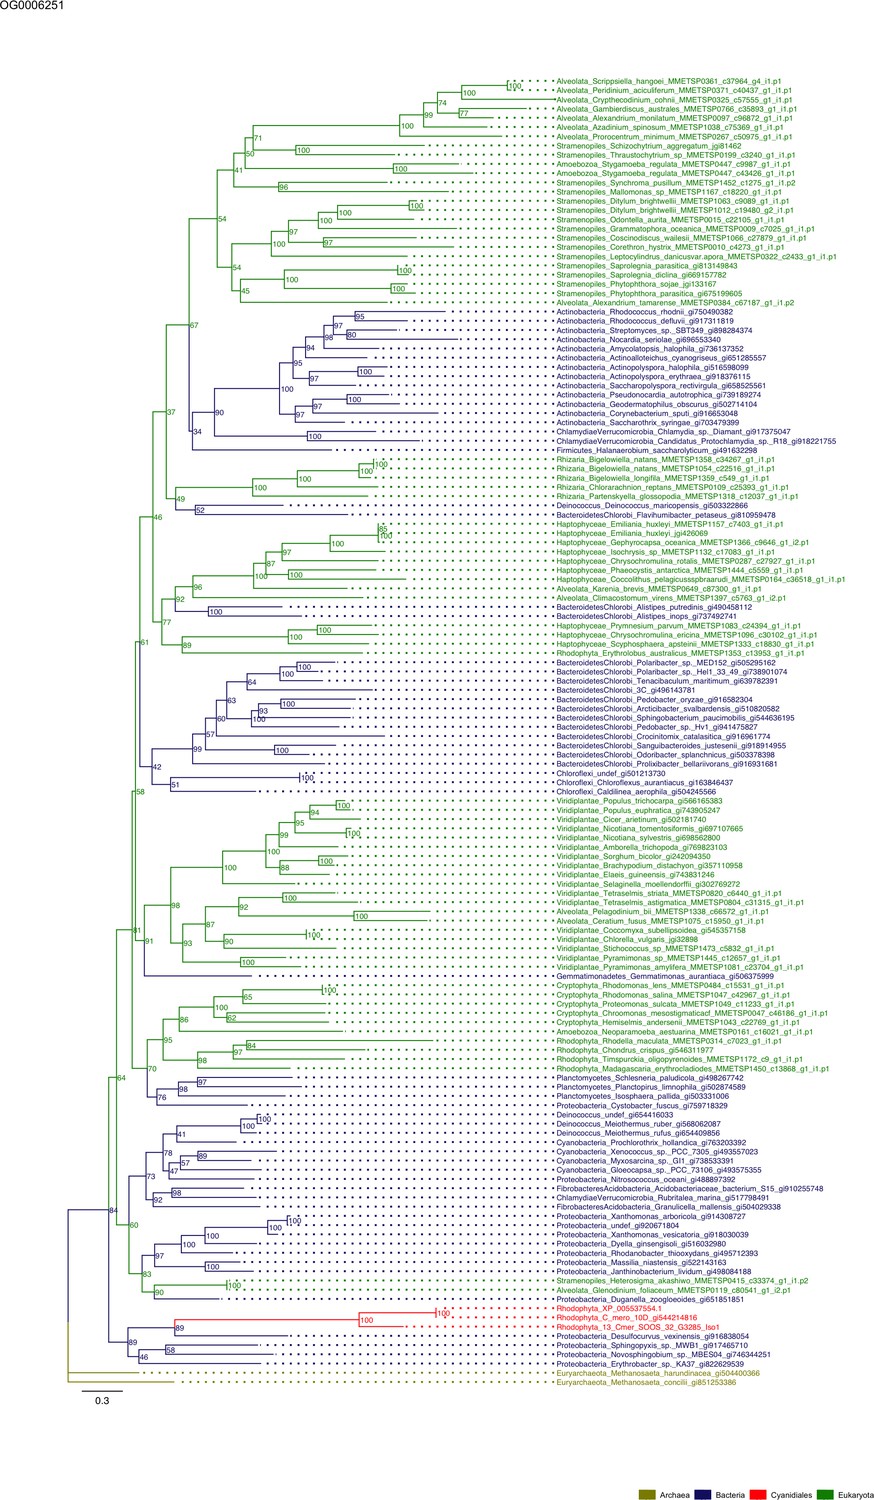
Sequence tree of orthogroup OG0006251.
The tree is based on amino acid sequences. Archaea (yellow), Bacteria (blue), Cyanidiales (red), Eukaryotes including other red algae (green). Branches containing Cyanidiales sequences are highlited in red.
Figure 5—figure supplement 76
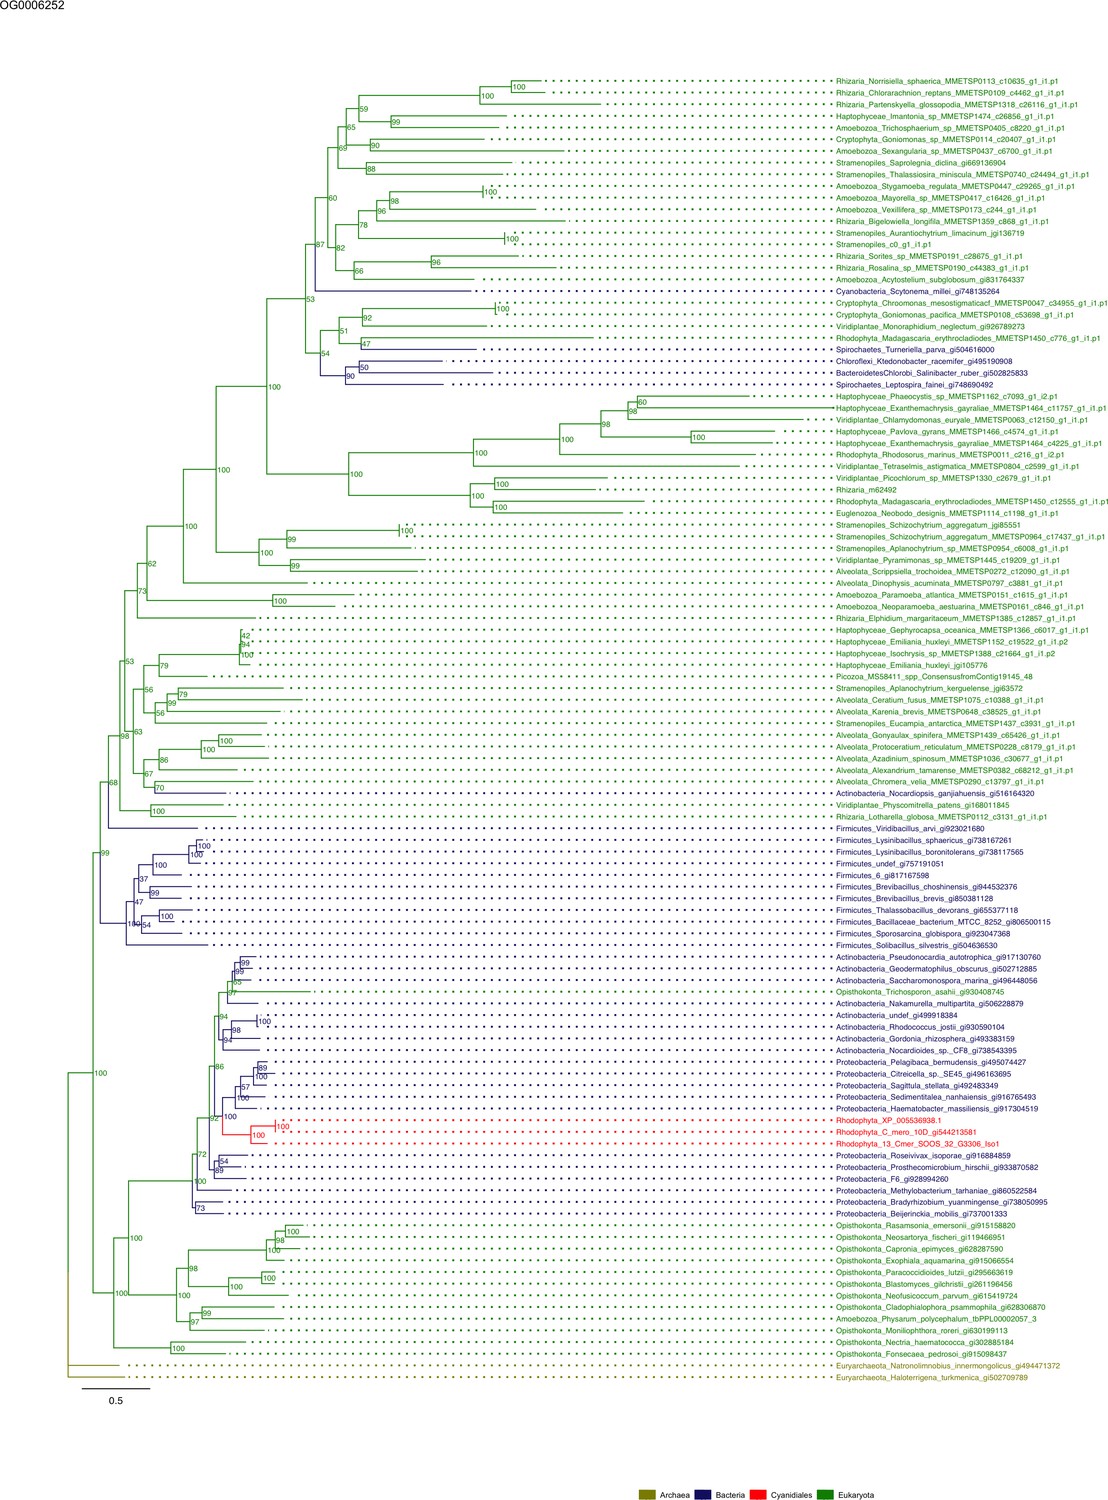
Sequence tree of orthogroup OG0006252.
The tree is based on amino acid sequences. Archaea (yellow), Bacteria (blue), Cyanidiales (red), Eukaryotes including other red algae (green). Branches containing Cyanidiales sequences are highlited in red.
Figure 5—figure supplement 77
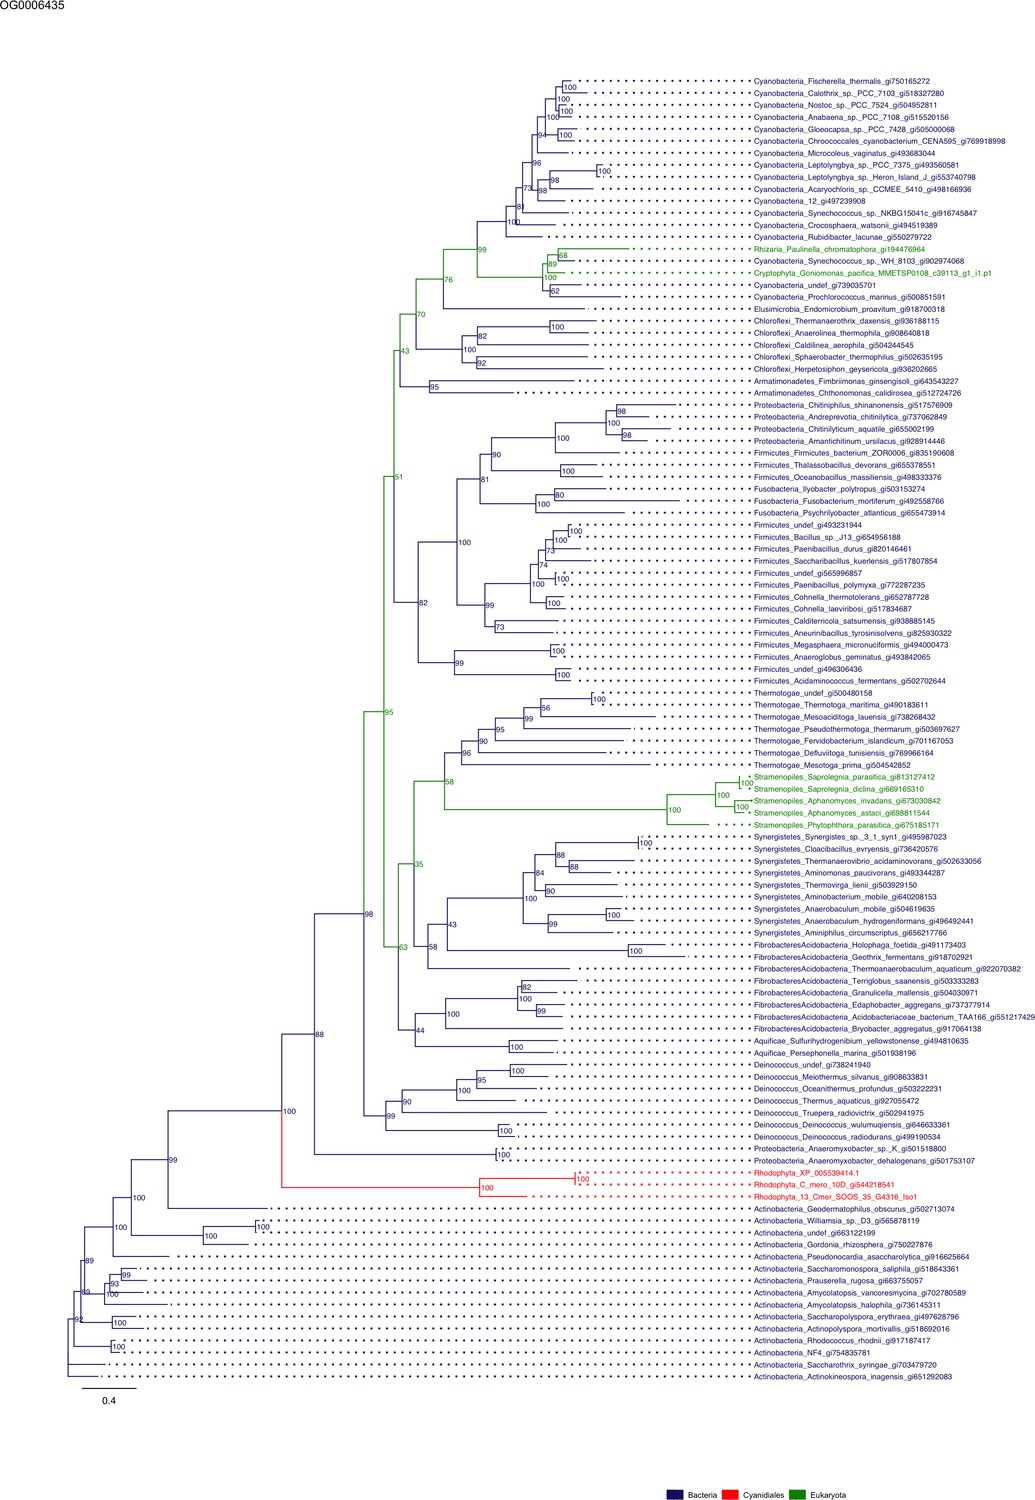
Sequence tree of orthogroup OG0006435.
The tree is based on amino acid sequences. Archaea (yellow), Bacteria (blue), Cyanidiales (red), Eukaryotes including other red algae (green). Branches containing Cyanidiales sequences are highlited in red.
Figure 5—figure supplement 78
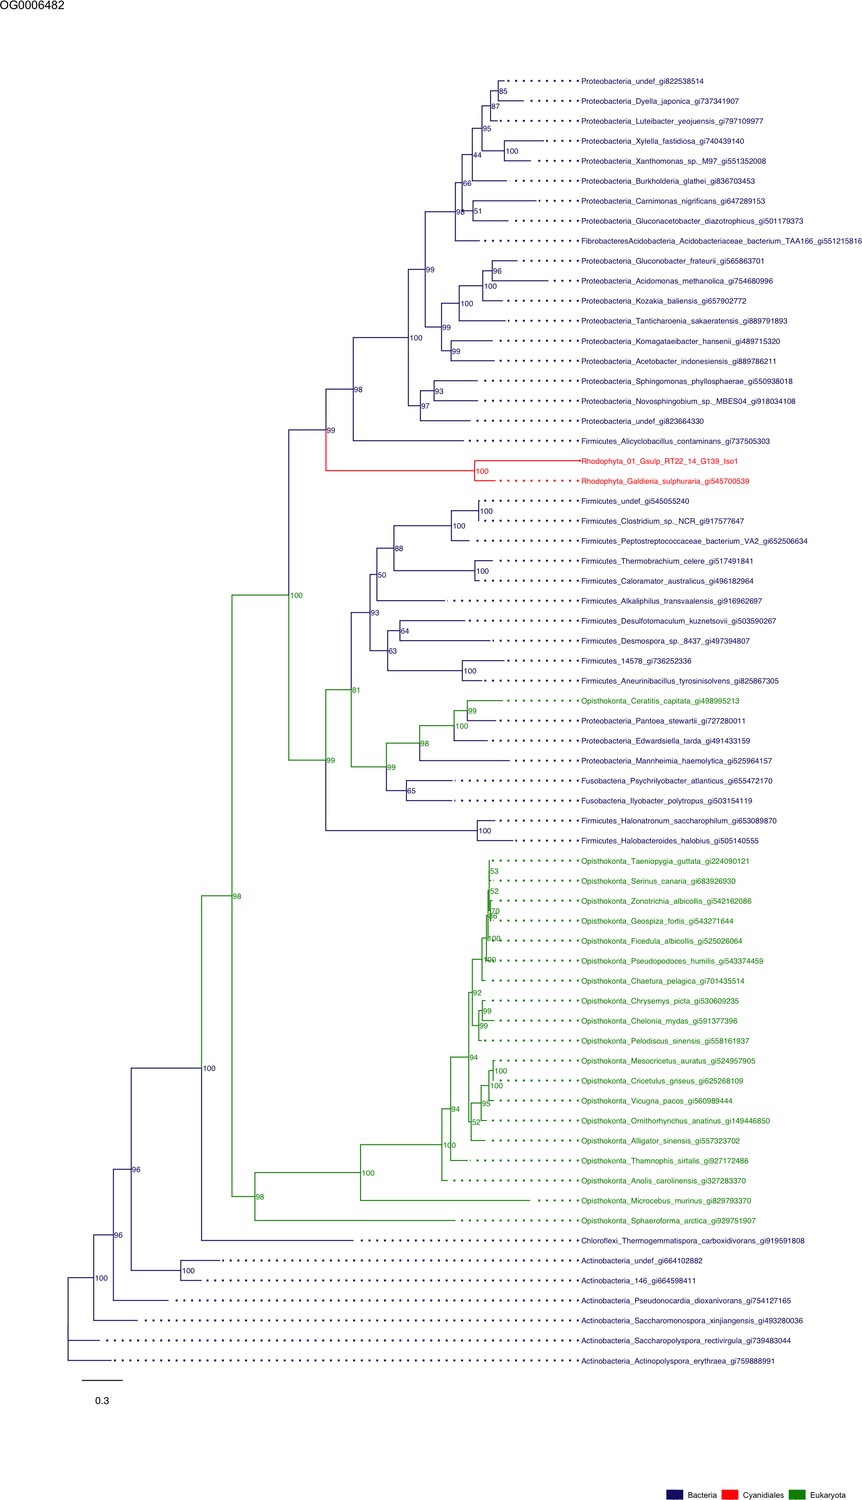
Sequence tree of orthogroup OG0006482.
The tree is based on amino acid sequences. Archaea (yellow), Bacteria (blue), Cyanidiales (red), Eukaryotes including other red algae (green). Branches containing Cyanidiales sequences are highlited in red.
Figure 5—figure supplement 79
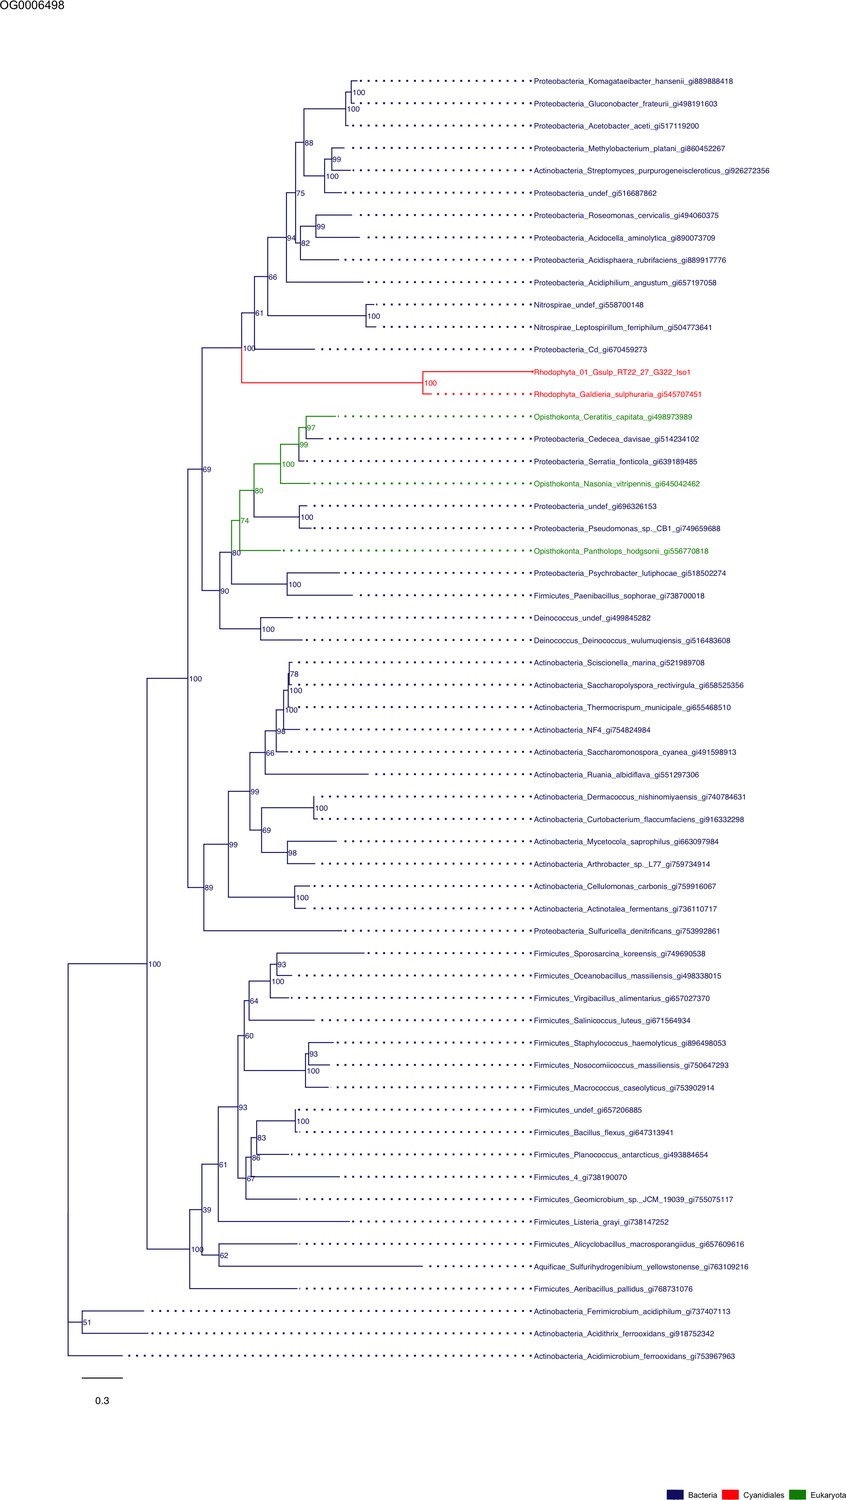
Sequence tree of orthogroup OG0006498.
The tree is based on amino acid sequences. Archaea (yellow), Bacteria (blue), Cyanidiales (red), Eukaryotes including other red algae (green). Branches containing Cyanidiales sequences are highlited in red.
Figure 5—figure supplement 80

Sequence tree of orthogroup OG0006623.
The tree is based on amino acid sequences. Archaea (yellow), Bacteria (blue), Cyanidiales (red), Eukaryotes including other red algae (green). Branches containing Cyanidiales sequences are highlited in red.
Figure 5—figure supplement 81
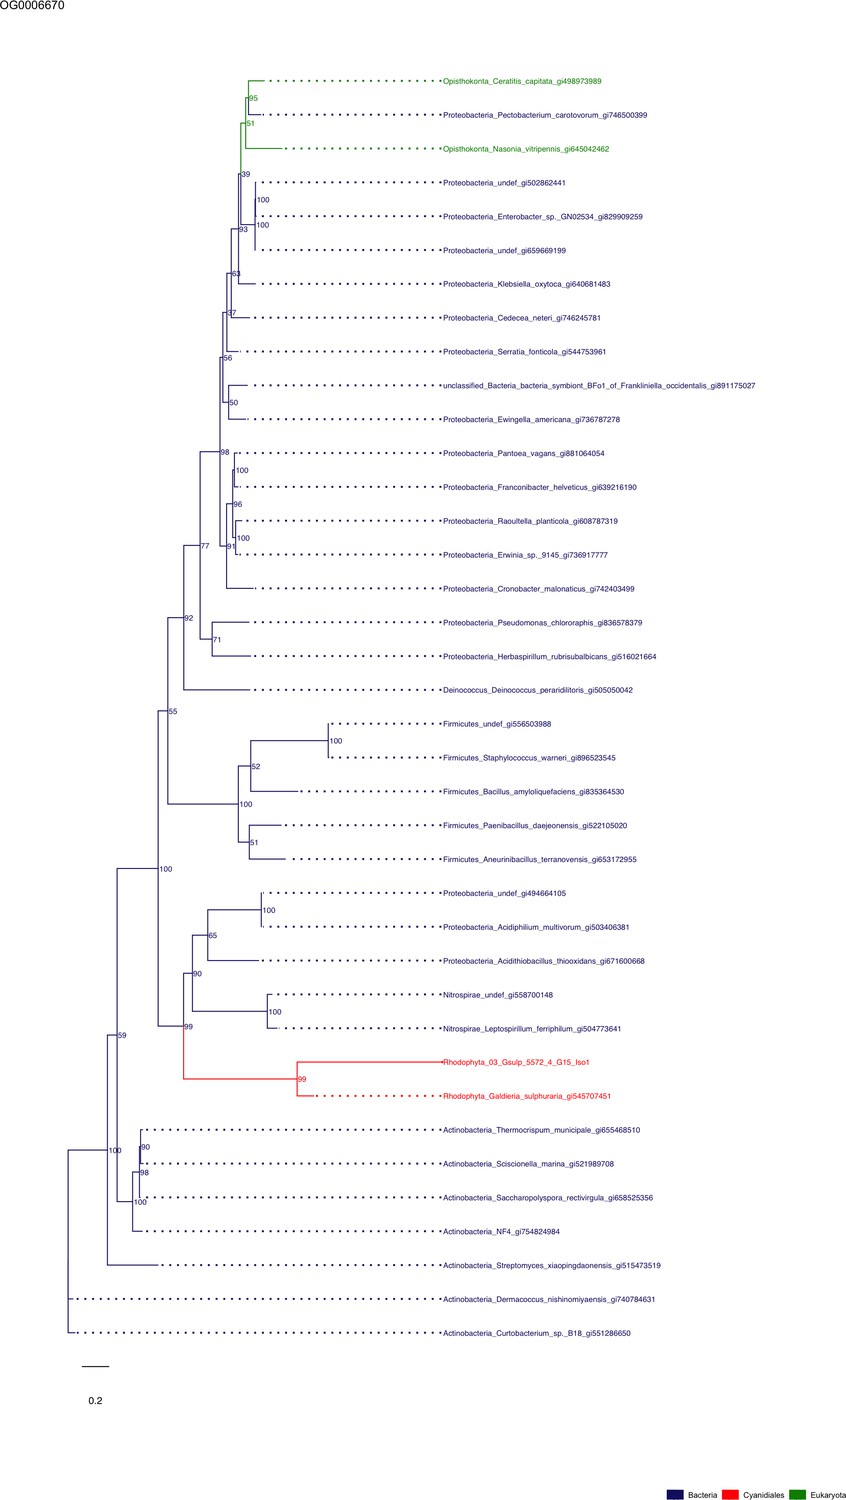
Sequence tree of orthogroup OG0006670.
The tree is based on amino acid sequences. Archaea (yellow), Bacteria (blue), Cyanidiales (red), Eukaryotes including other red algae (green). Branches containing Cyanidiales sequences are highlited in red.
Figure 5—figure supplement 82

Sequence tree of orthogroup OG0007051.
The tree is based on amino acid sequences. Archaea (yellow), Bacteria (blue), Cyanidiales (red), Eukaryotes including other red algae (green). Branches containing Cyanidiales sequences are highlited in red.
Figure 5—figure supplement 83
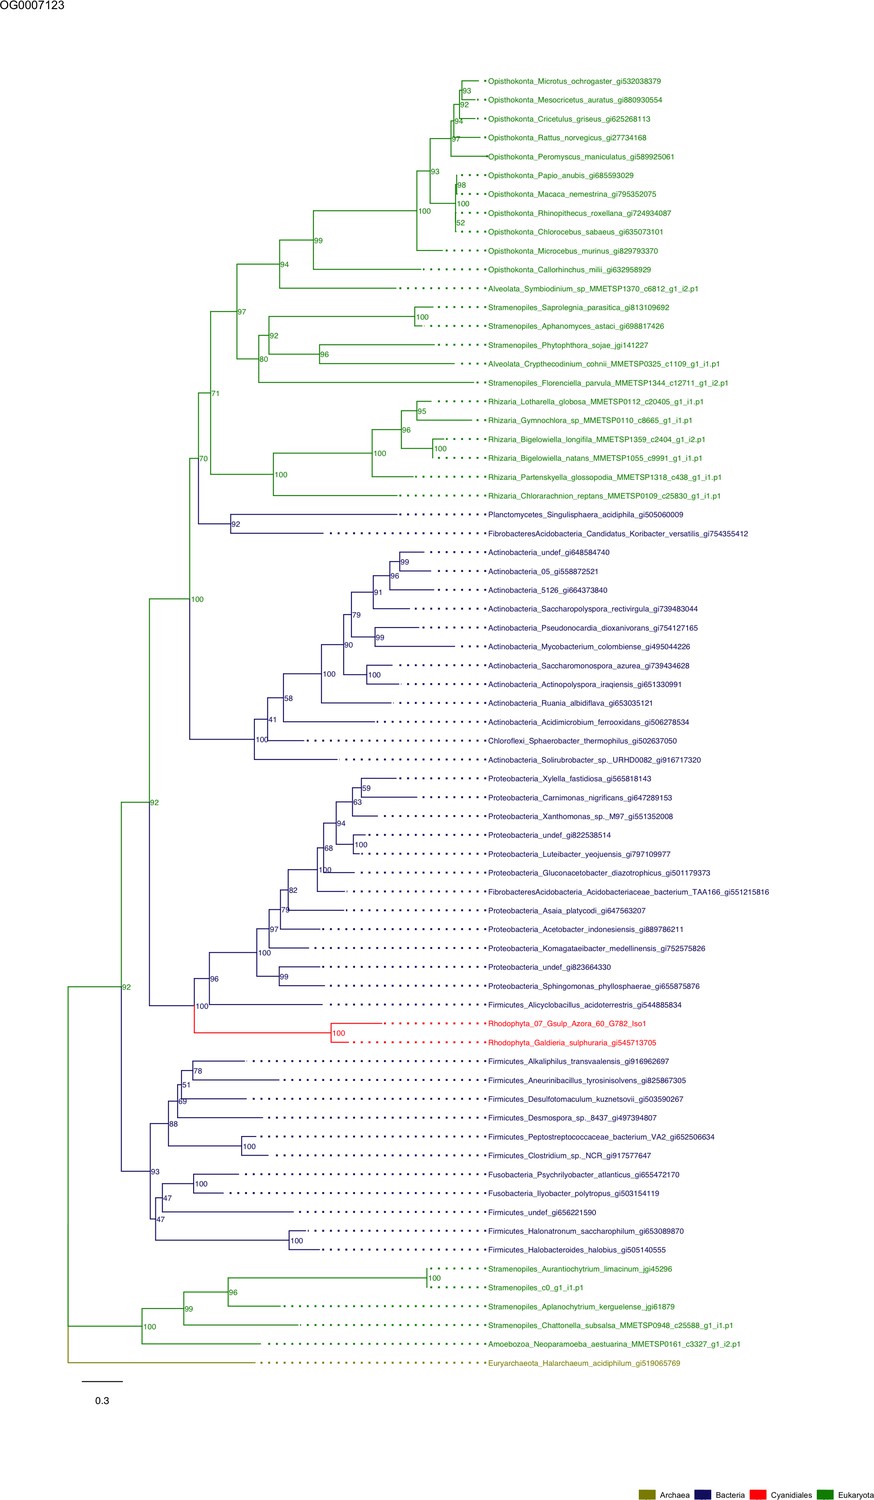
Sequence tree of orthogroup OG0007123.
The tree is based on amino acid sequences. Archaea (yellow), Bacteria (blue), Cyanidiales (red), Eukaryotes including other red algae (green). Branches containing Cyanidiales sequences are highlited in red.
Figure 5—figure supplement 84
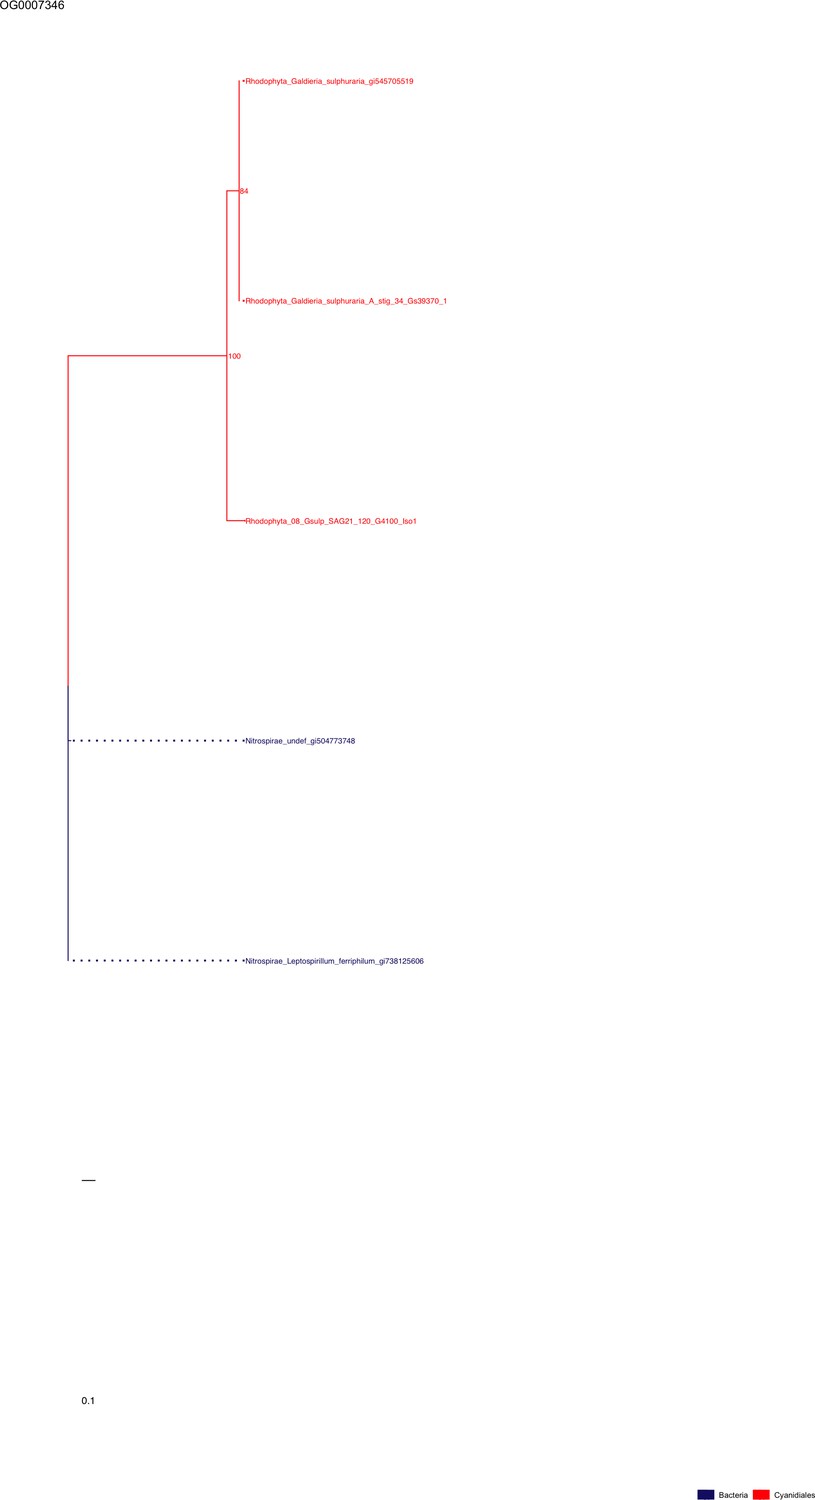
Sequence tree of orthogroup OG0007346.
The tree is based on amino acid sequences. Archaea (yellow), Bacteria (blue), Cyanidiales (red), Eukaryotes including other red algae (green). Branches containing Cyanidiales sequences are highlited in red.
Figure 5—figure supplement 85
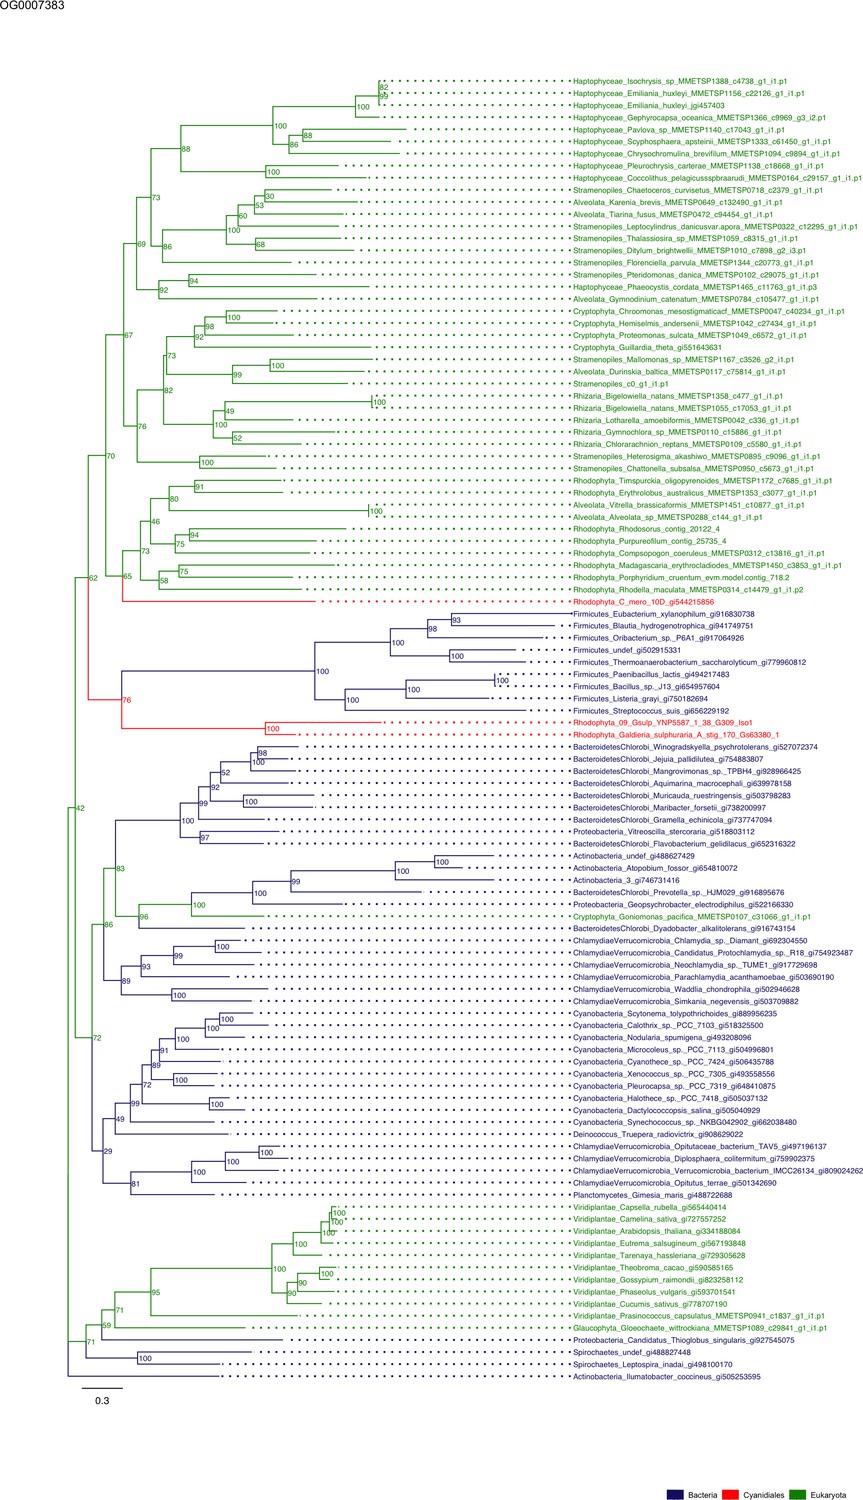
Sequence tree of orthogroup OG0007383.
The tree is based on amino acid sequences. Archaea (yellow), Bacteria (blue), Cyanidiales (red), Eukaryotes including other red algae (green). Branches containing Cyanidiales sequences are highlited in red.
Figure 5—figure supplement 86

Sequence tree of orthogroup OG0007550.
The tree is based on amino acid sequences. Archaea (yellow), Bacteria (blue), Cyanidiales (red), Eukaryotes including other red algae (green). Branches containing Cyanidiales sequences are highlited in red.
Figure 5—figure supplement 87
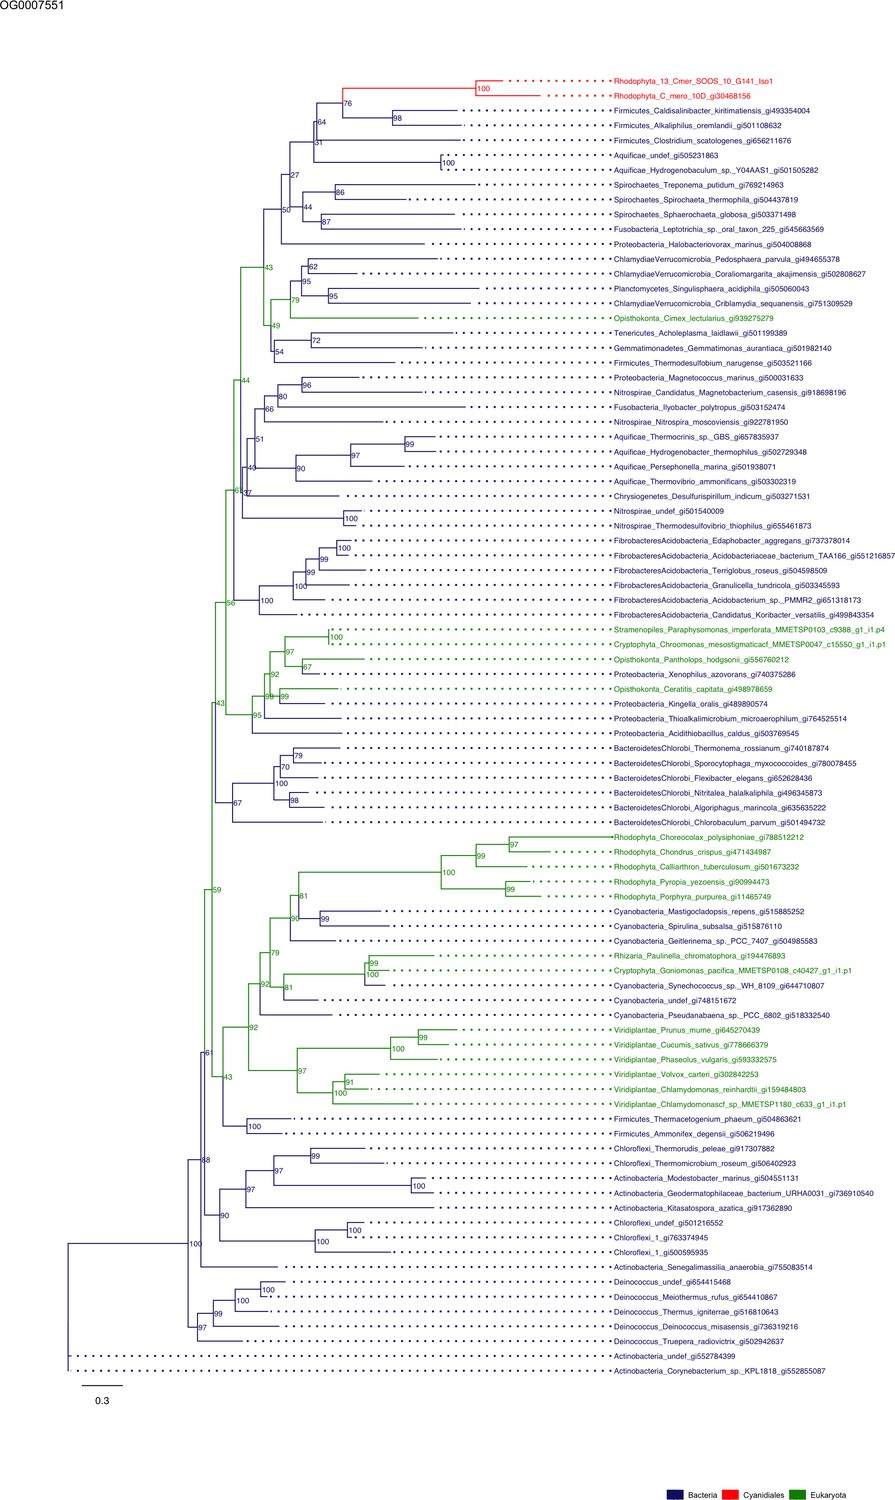
Sequence tree of orthogroup OG0007551.
The tree is based on amino acid sequences. Archaea (yellow), Bacteria (blue), Cyanidiales (red), Eukaryotes including other red algae (green). Branches containing Cyanidiales sequences are highlited in red.
Figure 5—figure supplement 88
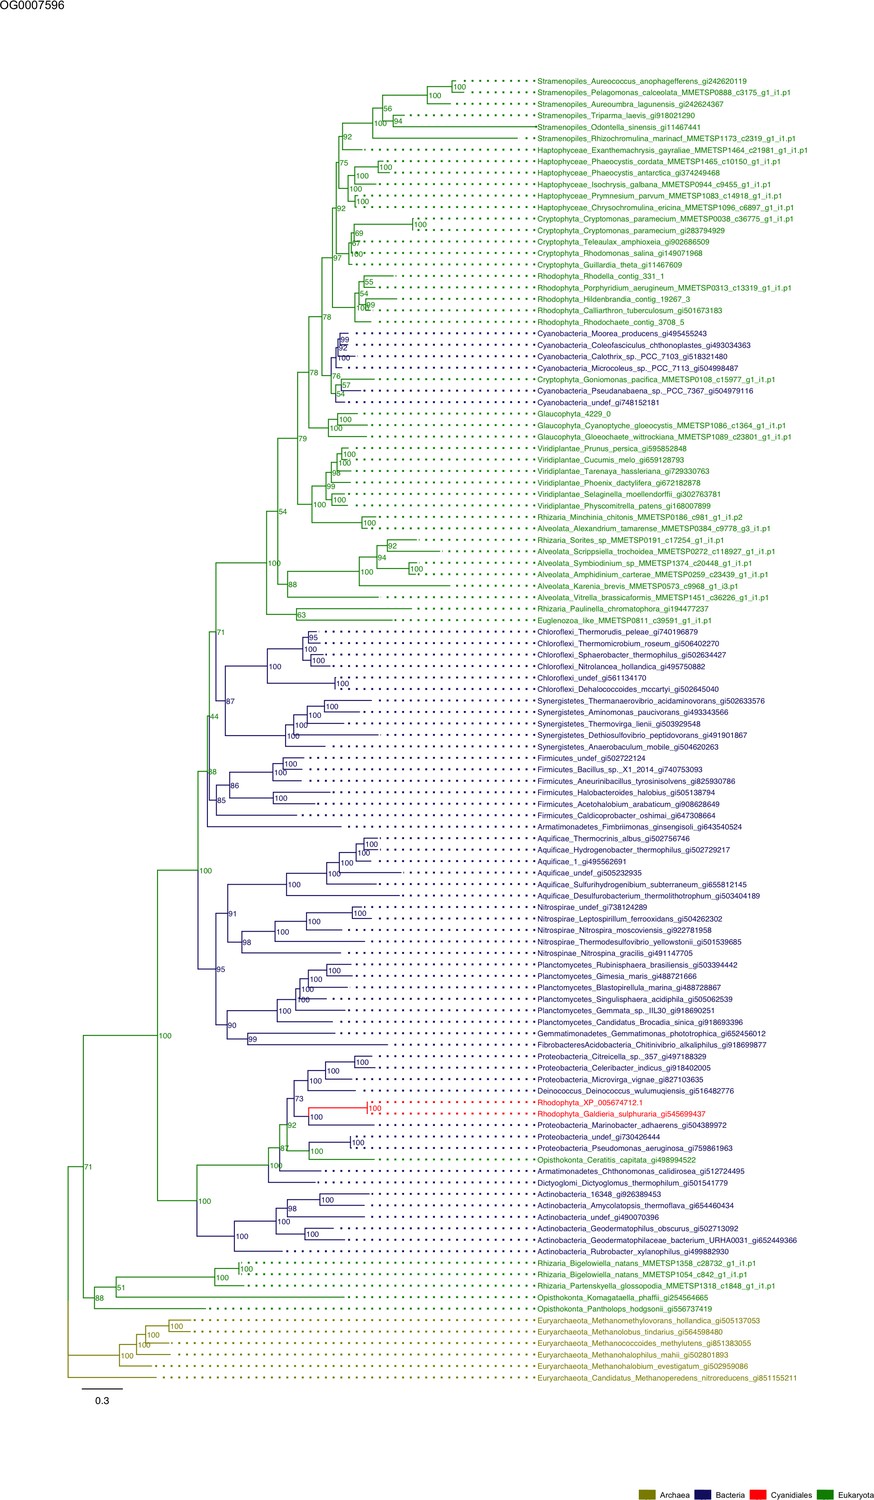
Sequence tree of orthogroup OG0007596.
The tree is based on amino acid sequences. Archaea (yellow), Bacteria (blue), Cyanidiales (red), Eukaryotes including other red algae (green). Branches containing Cyanidiales sequences are highlited in red.
Figure 5—figure supplement 89
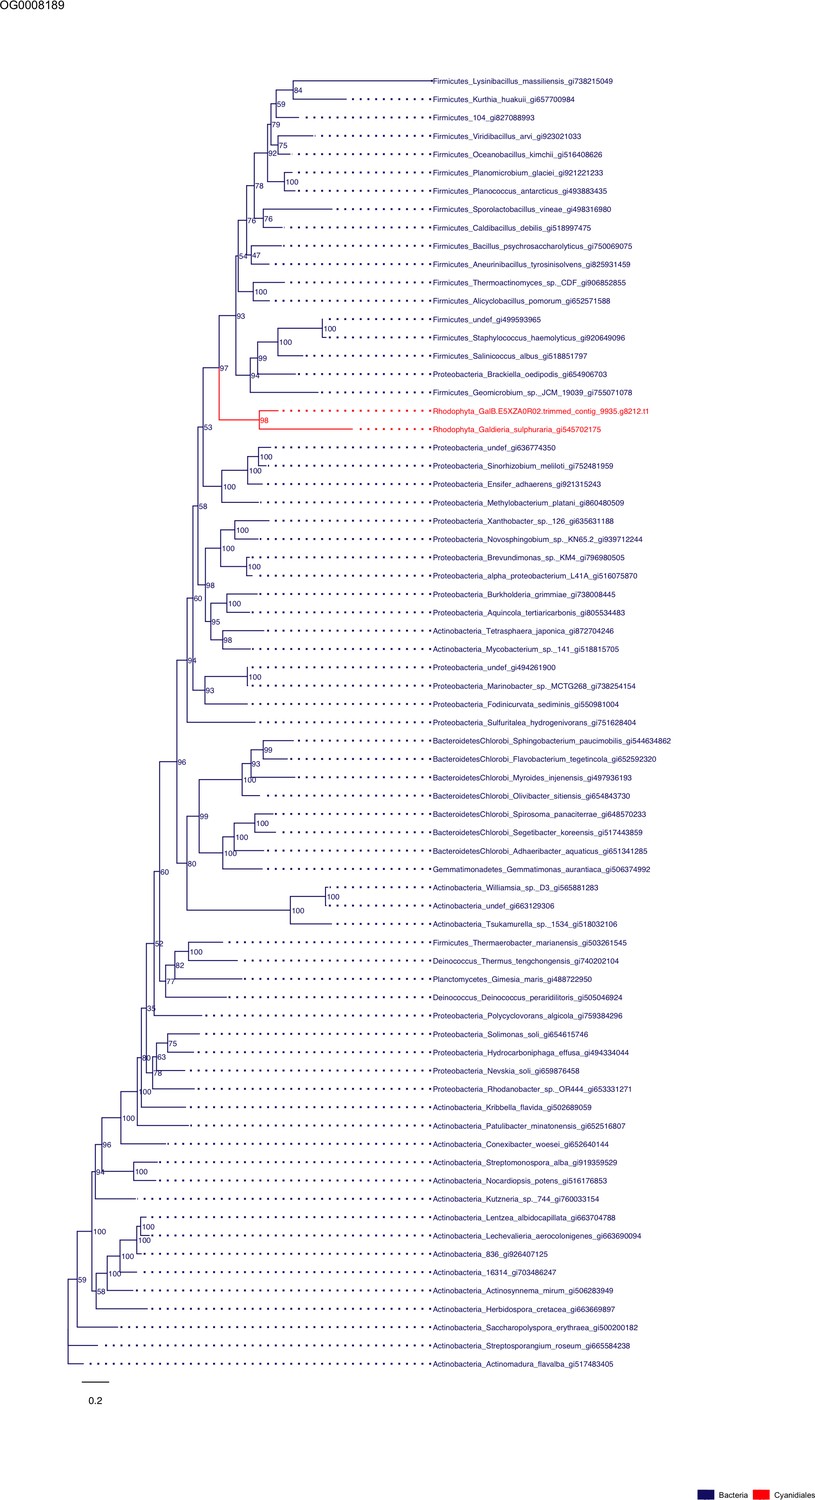
Sequence tree of orthogroup OG0008189.
The tree is based on amino acid sequences. Archaea (yellow), Bacteria (blue), Cyanidiales (red), Eukaryotes including other red algae (green). Branches containing Cyanidiales sequences are highlited in red.
Figure 5—figure supplement 90
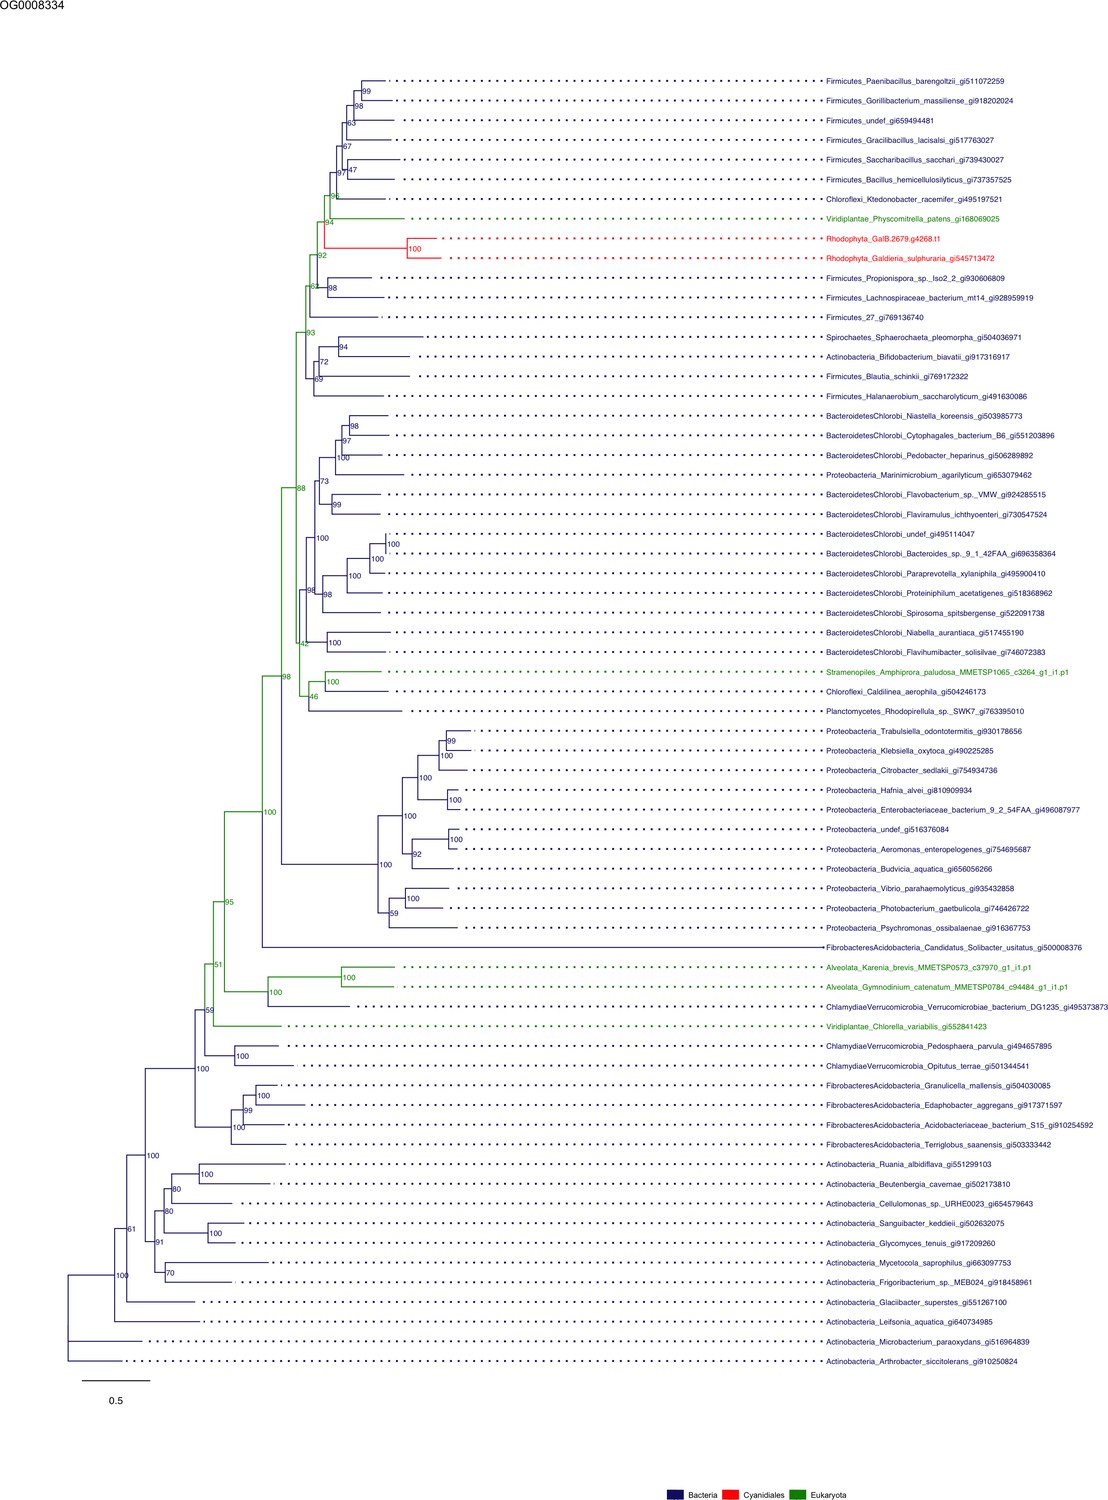
Sequence tree of orthogroup OG0008334.
The tree is based on amino acid sequences. Archaea (yellow), Bacteria (blue), Cyanidiales (red), Eukaryotes including other red algae (green). Branches containing Cyanidiales sequences are highlited in red.
Figure 5—figure supplement 91
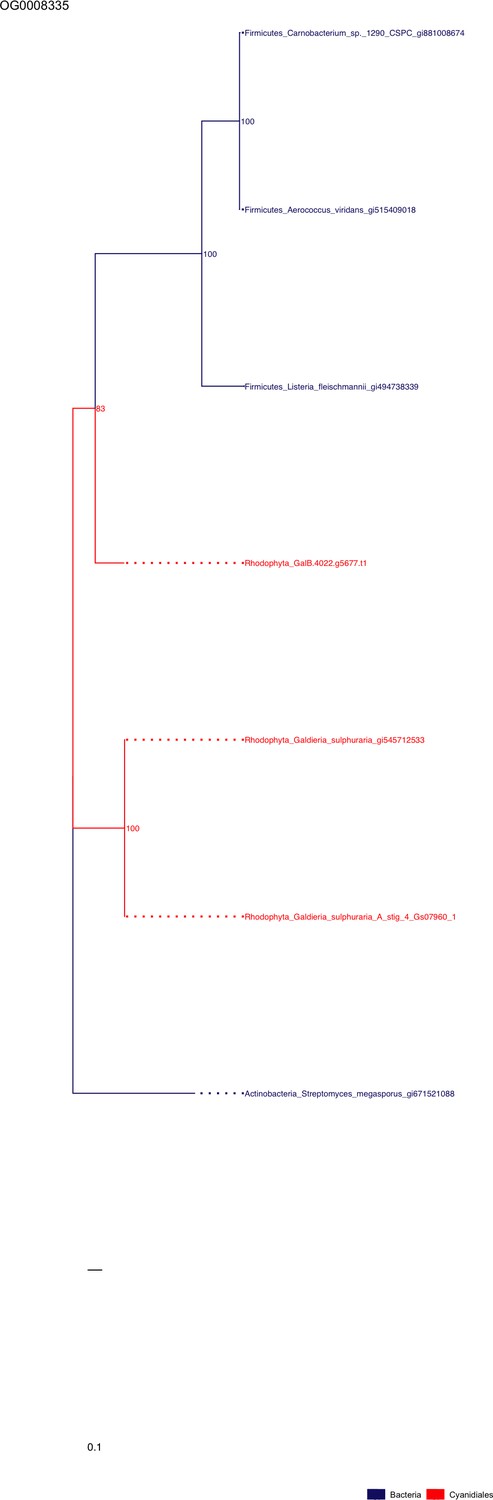
Sequence tree of orthogroup OG0008335.
The tree is based on amino acid sequences. Archaea (yellow), Bacteria (blue), Cyanidiales (red), Eukaryotes including other red algae (green). Branches containing Cyanidiales sequences are highlited in red.
Figure 5—figure supplement 92
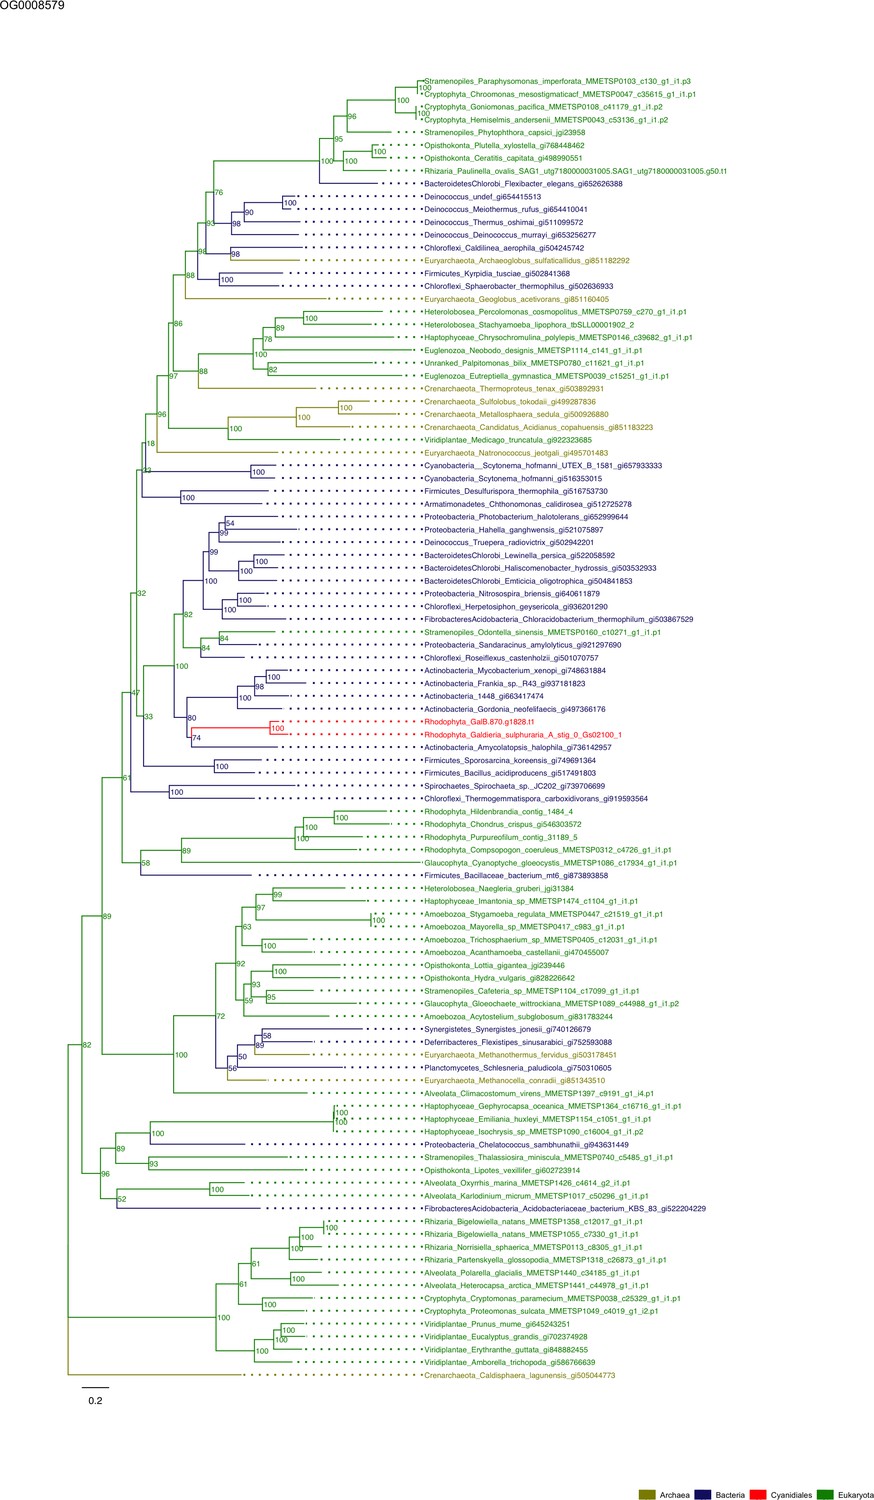
Sequence tree of orthogroup OG0008579.
The tree is based on amino acid sequences. Archaea (yellow), Bacteria (blue), Cyanidiales (red), Eukaryotes including other red algae (green). Branches containing Cyanidiales sequences are highlited in red.
Figure 5—figure supplement 93
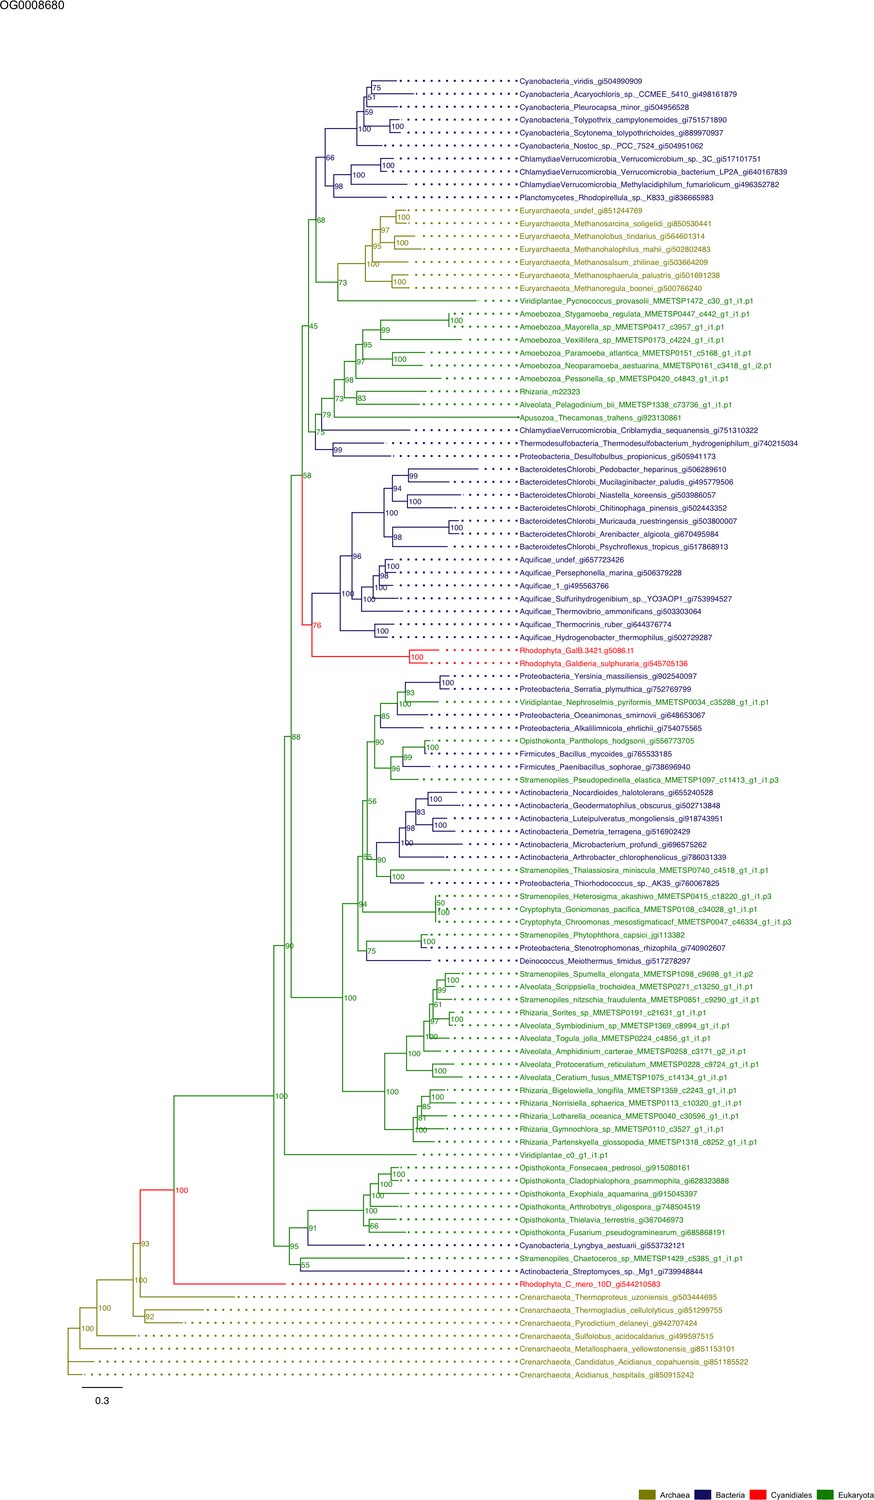
Sequence tree of orthogroup OG0008680.
The tree is based on amino acid sequences. Archaea (yellow), Bacteria (blue), Cyanidiales (red), Eukaryotes including other red algae (green). Branches containing Cyanidiales sequences are highlited in red.
Figure 5—figure supplement 94
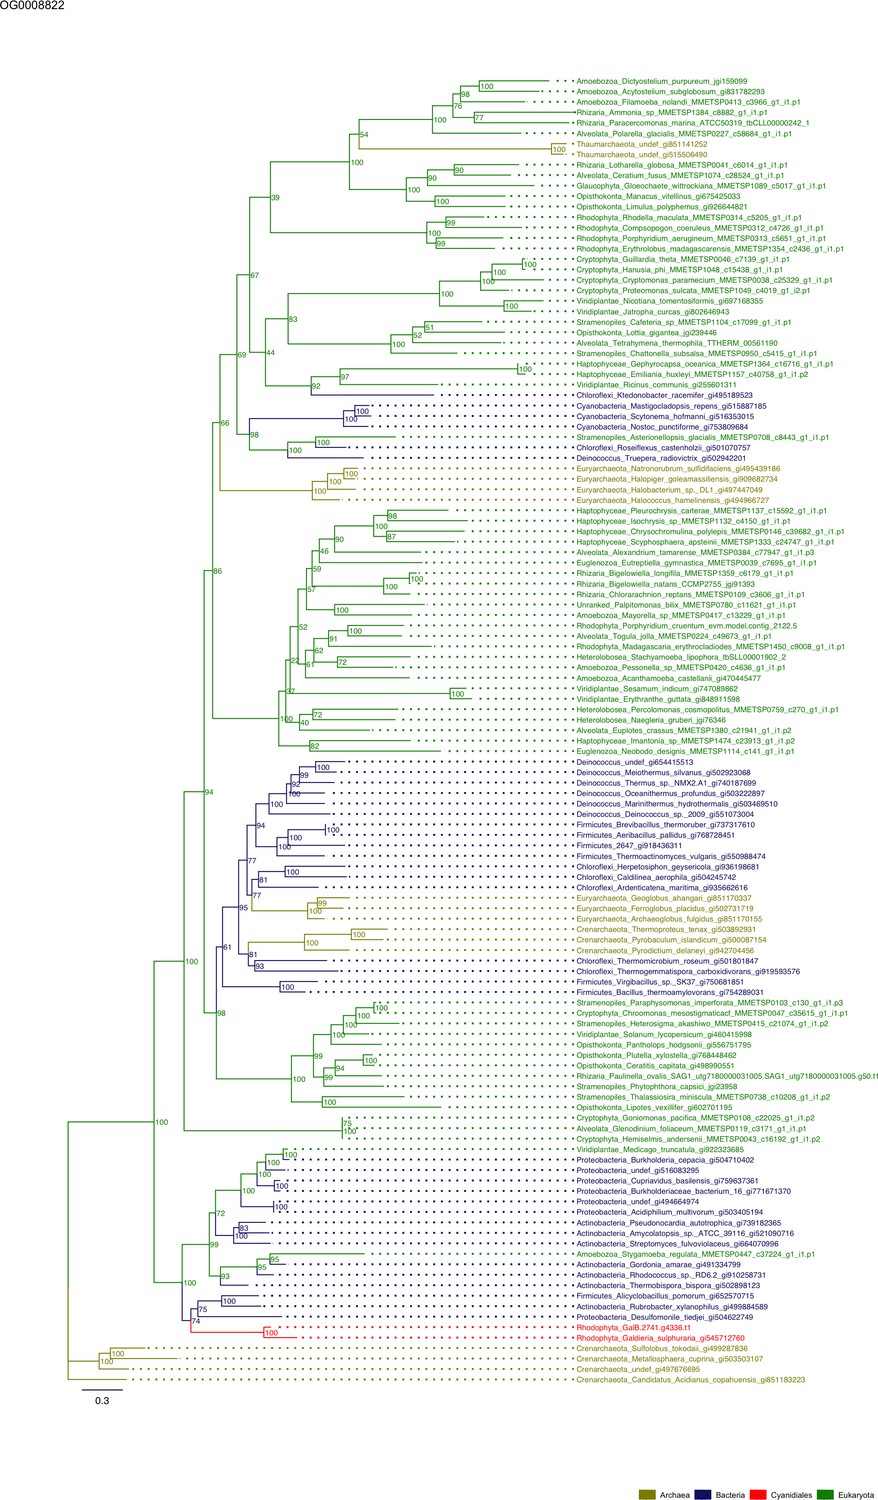
Sequence tree of orthogroup OG0008822.
The tree is based on amino acid sequences. Archaea (yellow), Bacteria (blue), Cyanidiales (red), Eukaryotes including other red algae (green). Branches containing Cyanidiales sequences are highlited in red.
Figure 5—figure supplement 95
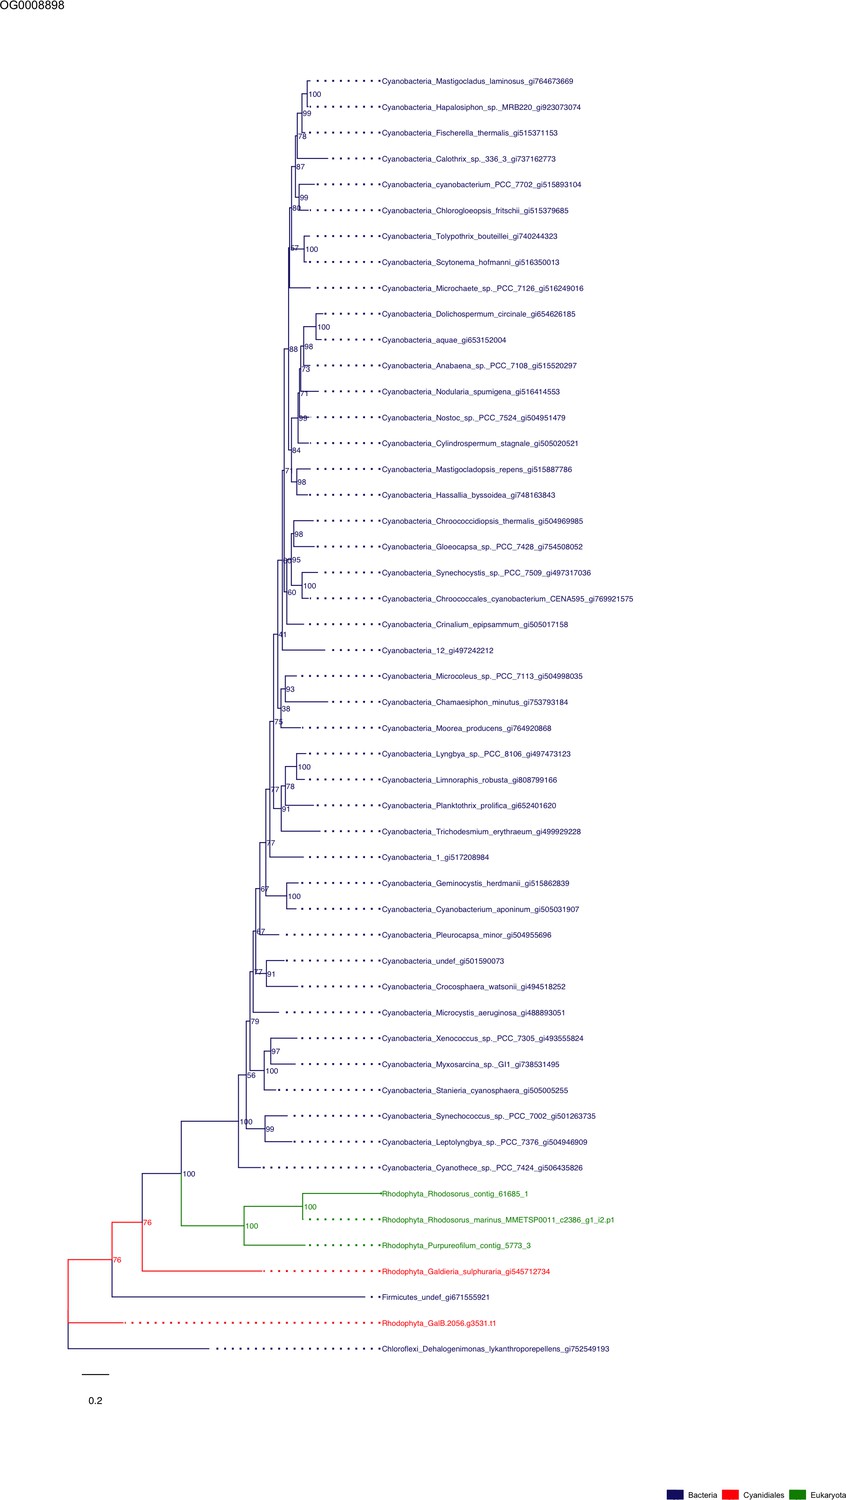
Sequence tree of orthogroup OG0008898.
The tree is based on amino acid sequences. Archaea (yellow), Bacteria (blue), Cyanidiales (red), Eukaryotes including other red algae (green). Branches containing Cyanidiales sequences are highlited in red.
Figure 5—figure supplement 96

Sequence tree of orthogroup OG0008996.
The tree is based on amino acid sequences. Archaea (yellow), Bacteria (blue), Cyanidiales (red), Eukaryotes including other red algae (green). Branches containing Cyanidiales sequences are highlited in red.
Figure 6
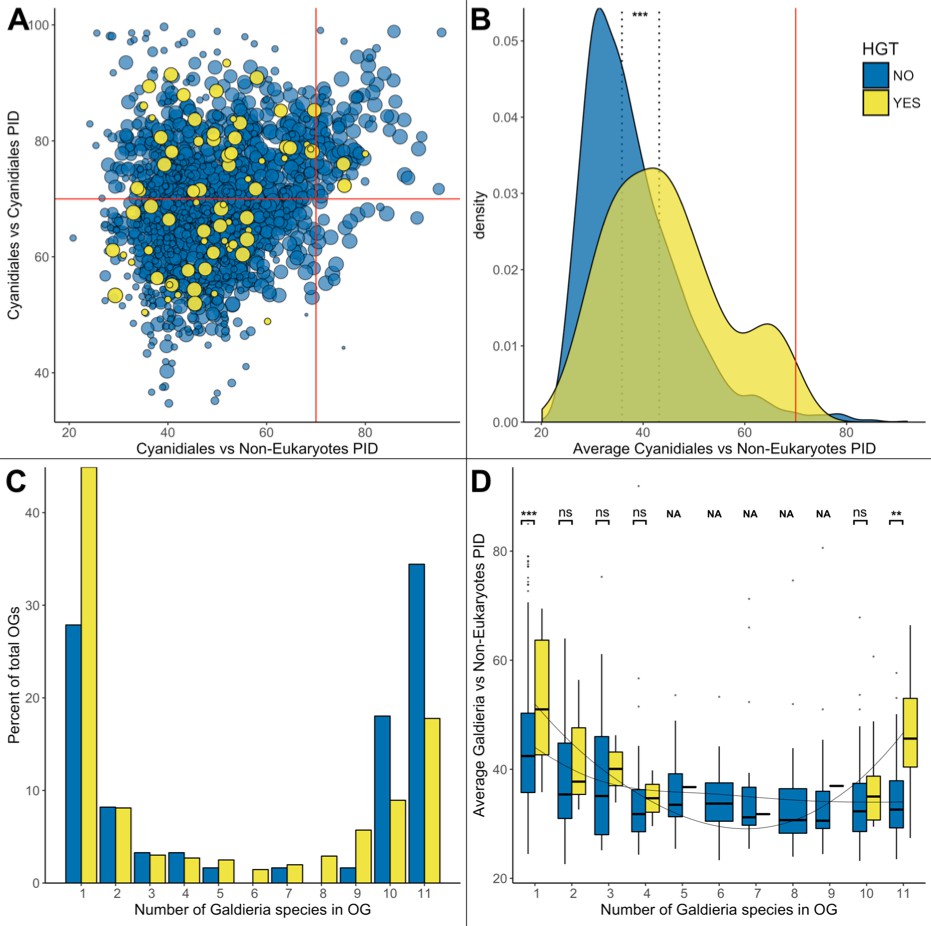
HGT vs. non-HGT orthogroup comparisons.
(A) Maximum PID of Cyanidiales genes in native (blue) and HGT (yellow) orthogroups when compared to non-eukaryotic sequences in each OG. The red lines denote the 70% PID threshold for assembly artifacts according to ‘the 70% rule’. Dots located in the top-right corner depict the 73 OGs that appear to contradict this rule, plus the 5 HGT candidates that score higher than 70%. 18/73 of those OGs are not derived from EGT or contamination within eukaryotic assemblies. (B) Density curve of average PID towards non-eukaryotic species in the same orthogroup (potential non-eukaryotic donors in case of HGT candidates). The area under each curve is equal to 1. The average PID of HGT candidates (left dotted line) is 6.1% higher than the average PID of native OGs also containing non-eukaryotic species (right dotted line). This difference is significant (Wilcoxon rank-sum test, p>0.01). (C) Distribution of OG-sizes (=number of Galdieria species present in each OG) between the native and HGT dataset. A total of 80% of the HGT OGs and 89% of the native OGs are present in either ≤10 species, or ≤2 species. Whereas 52.5% of the native gene set is conserved in ≤10 Galdieria strains, only 36.1% of the HGT candidates are conserved. In contrast, about 50% of the HGT candidates are present in only one Galdieria strain. (D) Pairwise OG-size comparison between HGT OGs and native OGs. A significantly higher PID when compared to non-eukaryotic sequences was measured in the HGT OGs at OG-sizes of 1 and 11 (Wilcoxon rank-sum test, BH, p<0.01). No evidence of cumulative effects was detected in the HGT dataset. However, the fewer Galdieria species that are contained in one OG, the higher the average PID when compared to non-eukaryotic species in the same tree (Jonckheere-Terpstra, p<0.01) in the native dataset.
Figure 7

Cyanidiales live in hostile habitats, necessitating a broad range of adaptations to polyextremophily.
The majority of the 96 HGT-impacted OGs were annotated and putative functions identified (in the image, colored fields are from HGT, whereas gray fields are native functions). The largest number of HGT candidates is involved in carbon and amino acid metabolism, especially in the Galdieria lineage. The excretion of lytic enzymes and the high number of importers (protein/AA symporter, glycerol/H2O symporter) within the HGT dataset suggest a preference for import and catabolic function.
Appendix 1—figure 1
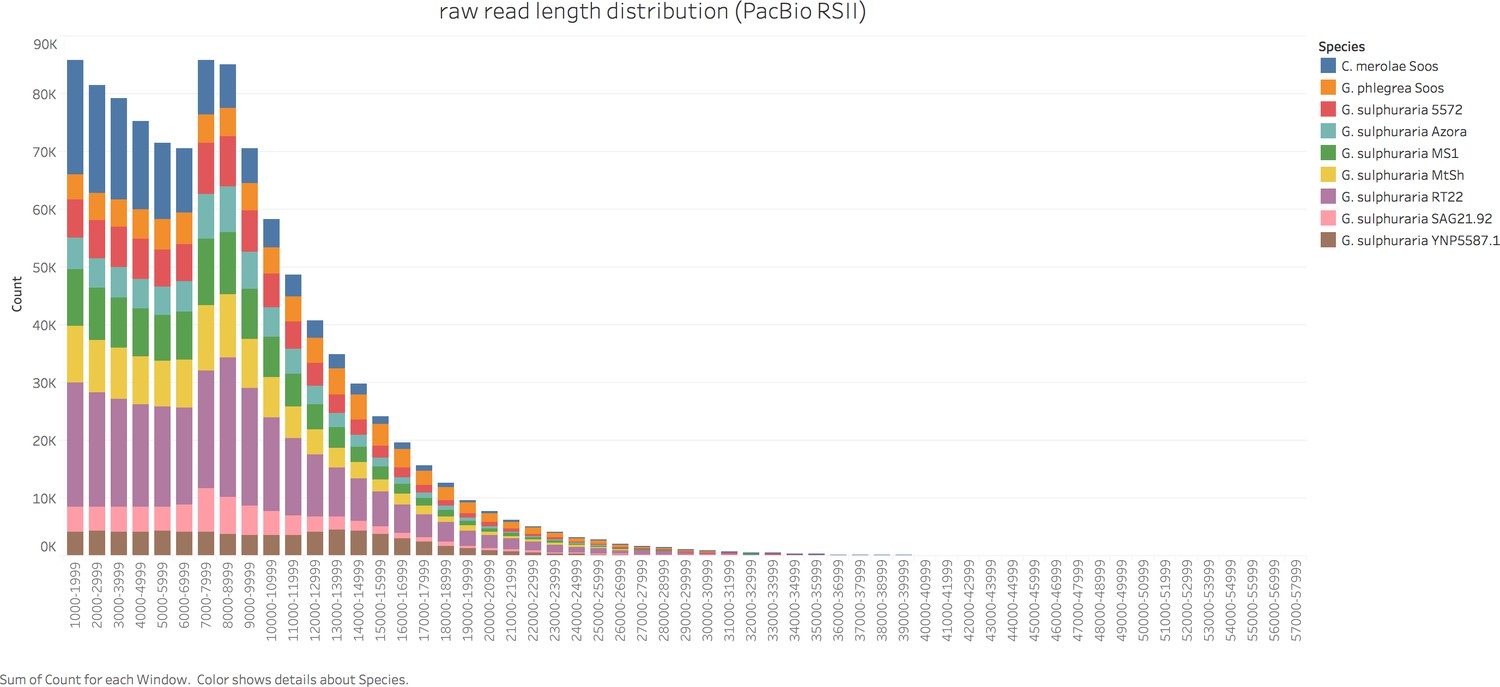
Raw read length distribution of the sequenced Cyanidiales strains.
The strains were sequenced in 2016/2017 using PacBio’s RS2 sequencing technology and P6-C4 chemistry (the only exception being C. merolae Soos, which was sequenced as pilot study using P4-C2 chemistry in 2014). Seven strains, namely G. sulphuraria 5572, G. sulphuraria 002, G. sulphuraria SAG21.92, G. sulphuraria Azora, G. sulphuraria MtSh, G. sulphuraria RT22 and G. sulphuraria MS1 were sequenced at the University of Maryland Institute for Genome Sciences (Baltimore, USA). The remaining three strains, G. sulphuraria YNP5578.1, G. phlegrea Soos and C. merolae Soos, were sequenced at the Max-Planck-Institut für Pflanzenzüchtungsforschung (Cologne, Germany).
Appendix 3—figure 1
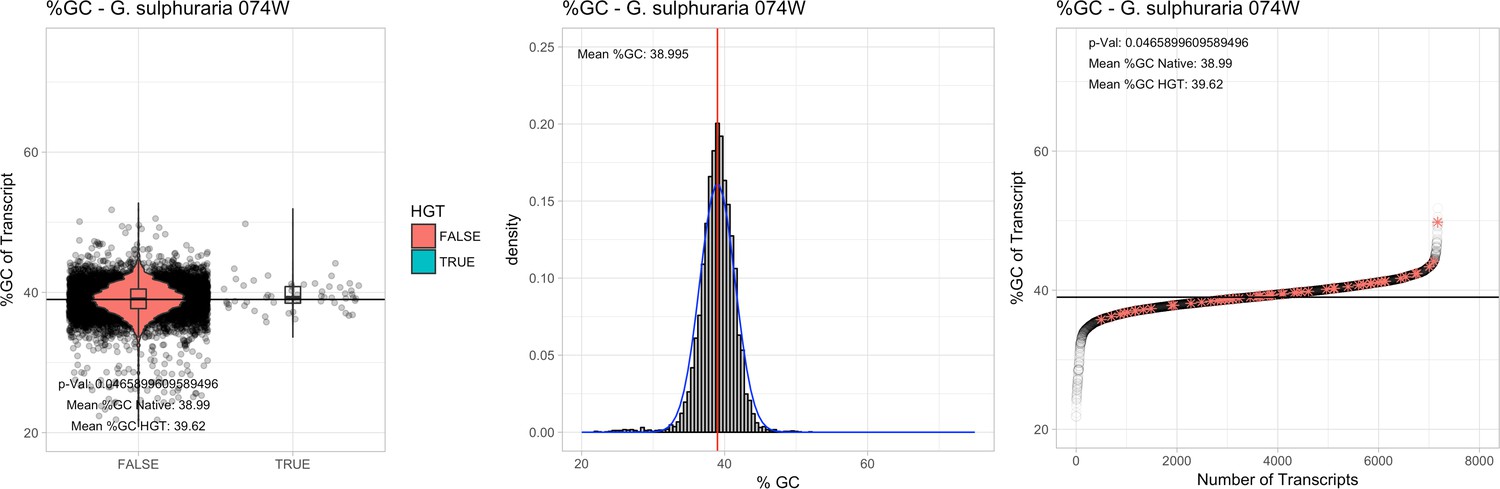
%GC – Galdieria sulphuraria 074W: (Left) Violin plot showing the %GC distribution across native transcripts and HGT candidates.
(Mid) Cumulative %GC distribution of transcripts. Red line shows the average, blue line a normal distribution based on the average value. (Right) Ranking all transcripts based upon their %GC content. Red ‘*' demarks HGT candidates. As the %GC content was normally distributed, students test was applied for the determination of significant differences between the native gene and the HGT candidate subset.
Appendix 3—figure 2

%GC – Galdieria sulphuraria MS1: (Left) Violin plot showing the %GC distribution across native transcripts and HGT candidates.
(Mid) Cumulative %GC distribution of transcripts. Red line shows the average, blue line a normal distribution based on the average value. (Right) Ranking all transcripts based upon their %GC content. Red ‘*' demarks HGT candidates. As the %GC content was normally distributed, students test was applied for the determination of significant differences between the native gene and the HGT candidate subset.
Appendix 3—figure 3

%GC – Galdieria sulphuraria RT22: (Left) Violin plot showing the %GC distribution across native transcripts and HGT candidates.
(Mid) Cumulative %GC distribution of transcripts. Red line shows the average, blue line a normal distribution based on the average value. (Right) Ranking all transcripts based upon their %GC content. Red ‘*' demarks HGT candidates. As the %GC content was normally distributed, students test was applied for the determination of significant differences between the native gene and the HGT candidate subset.
Appendix 3—figure 4
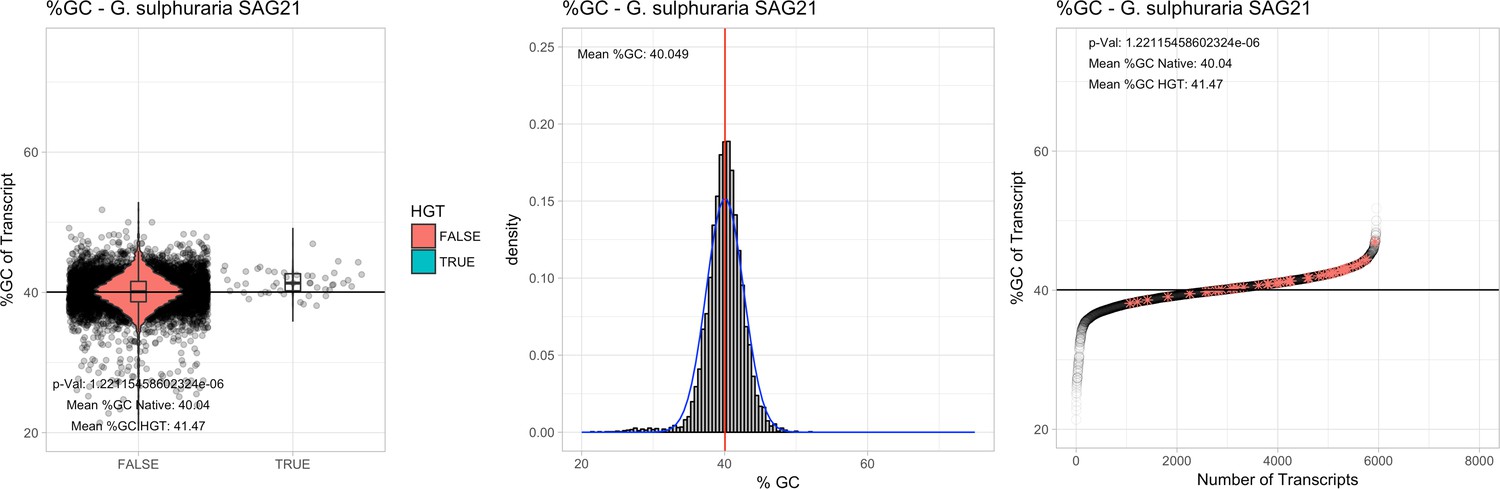
%GC – Galdieria sulphuraria SAG21: (Left) Violin plot showing the %GC distribution across native transcripts and HGT candidates.
(Mid) Cumulative %GC distribution of transcripts. Red line shows the average, blue line a normal distribution based on the average value. (Right) Ranking all transcripts based upon their %GC content. Red ‘*' demarks HGT candidates. As the %GC content was normally distributed, students test was applied for the determination of significant differences between the native gene and the HGT candidate subset.
Appendix 3—figure 5

%GC – Galdieria sulphuraria Mount Shasta (MtSh): (Left) Violin plot showing the %GC distribution across native transcripts and HGT candidates.
(Mid) Cumulative %GC distribution of transcripts. Red line shows the average, blue line a normal distribution based on the average value. (Right) Ranking all transcripts based upon their %GC content. Red ‘*' demarks HGT candidates. As the %GC content was normally distributed, students test was applied for the determination of significant differences between the native gene and the HGT candidate subset.
Appendix 3—figure 6
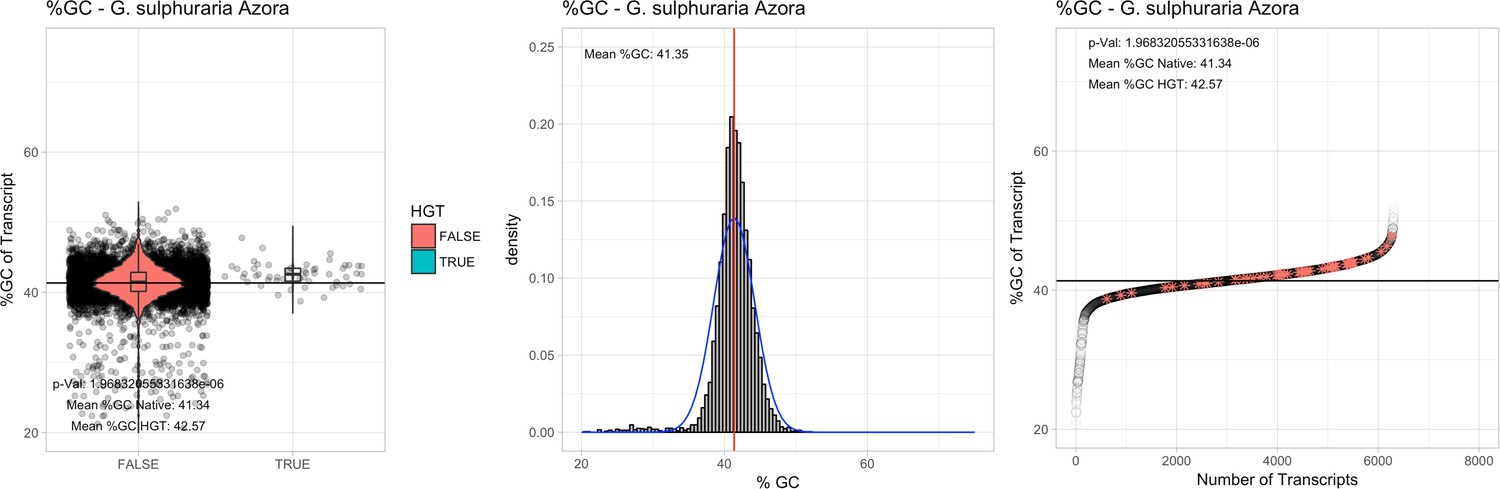
Galdieria sulphuraria Azora: (Left) Violin plot showing the %GC distribution across native transcripts and HGT candidates.
(Mid) Cumulative %GC distribution of transcripts. Red line shows the average, blue line a normal distribution based on the average value. (Right) Ranking all transcripts based upon their %GC content. Red ‘*' demarks HGT candidates. As the %GC content was normally distributed, students test was applied for the determination of significant differences between the native gene and the HGT candidate subset.
Appendix 3—figure 7

%GC – Galdieria sulphuraria Mount Shasta YNP5578.1: (Left) Violin plot showing the %GC distribution across native transcripts and HGT candidates.
(Mid) Cumulative %GC distribution of transcripts. Red line shows the average, blue line a normal distribution based on the average value. (Right) Ranking all transcripts based upon their %GC content. Red ‘*' demarks HGT candidates. As the %GC content was normally distributed, students test was applied for the determination of significant differences between the native gene and the HGT candidate subset.
Appendix 3—figure 8
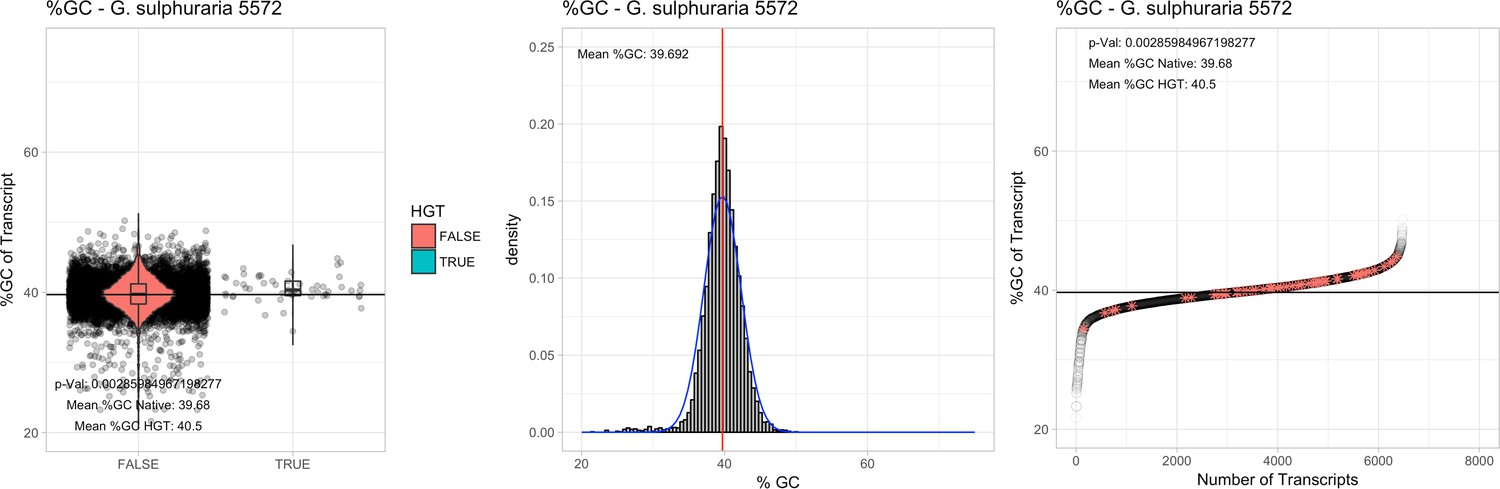
%GC – Galdieria sulphuraria 5572: (Left) Violin plot showing the %GC distribution across native transcripts and HGT candidates.
(Mid) Cumulative %GC distribution of transcripts. Red line shows the average, blue line a normal distribution based on the average value. (Right) Ranking all transcripts based upon their %GC content. Red ‘*' demarks HGT candidates. As the %GC content was normally distributed, students test was applied for the determination of significant differences between the native gene and the HGT candidate subset.
Appendix 3—figure 9
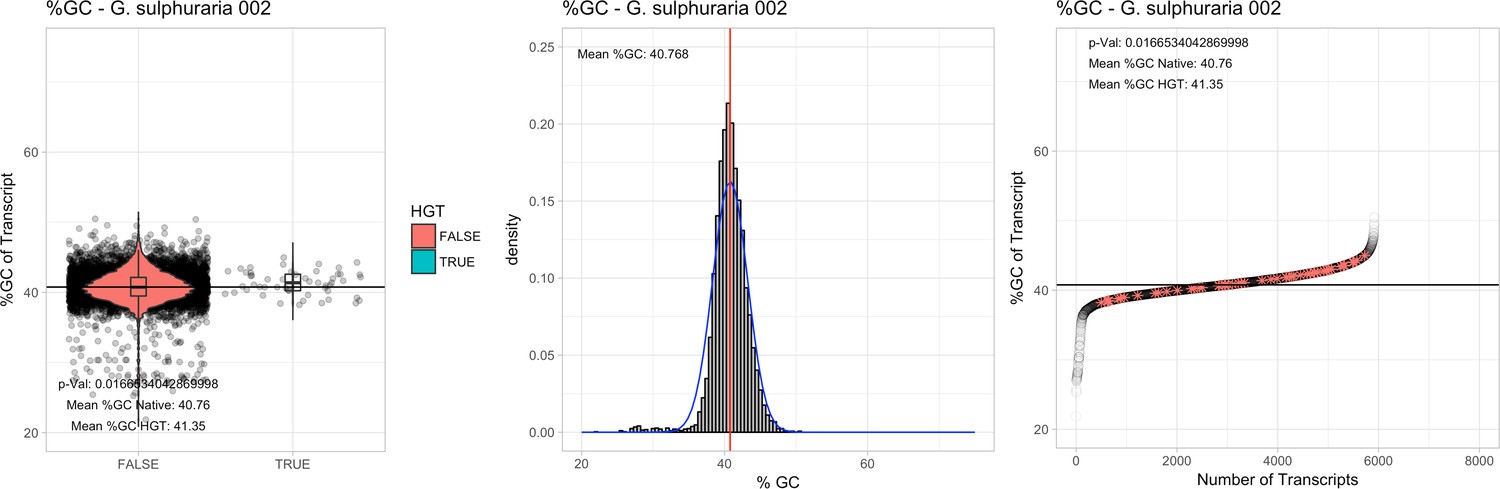
%GC – Galdieria sulphuraria 002: (Left) Violin plot showing the %GC distribution across native transcripts and HGT candidates.
(Mid) Cumulative %GC distribution of transcripts. Red line shows the average, blue line a normal distribution based on the average value. (Right) Ranking all transcripts based upon their %GC content. Red ‘*' demarks HGT candidates. As the %GC content was normally distributed, students test was applied for the determination of significant differences between the native gene and the HGT candidate subset.
Appendix 3—figure 10

%GC – Galdieria phlegrea Soos: (Left) Violin plot showing the %GC distribution across native transcripts and HGT candidates.
(Mid) Cumulative %GC distribution of transcripts. Red line shows the average, blue line a normal distribution based on the average value. (Right) Ranking all transcripts based upon their %GC content. Red ‘*' demarks HGT candidates. As the %GC content was normally distributed, students test was applied for the determination of significant differences between the native gene and the HGT candidate subset.
Appendix 3—figure 11
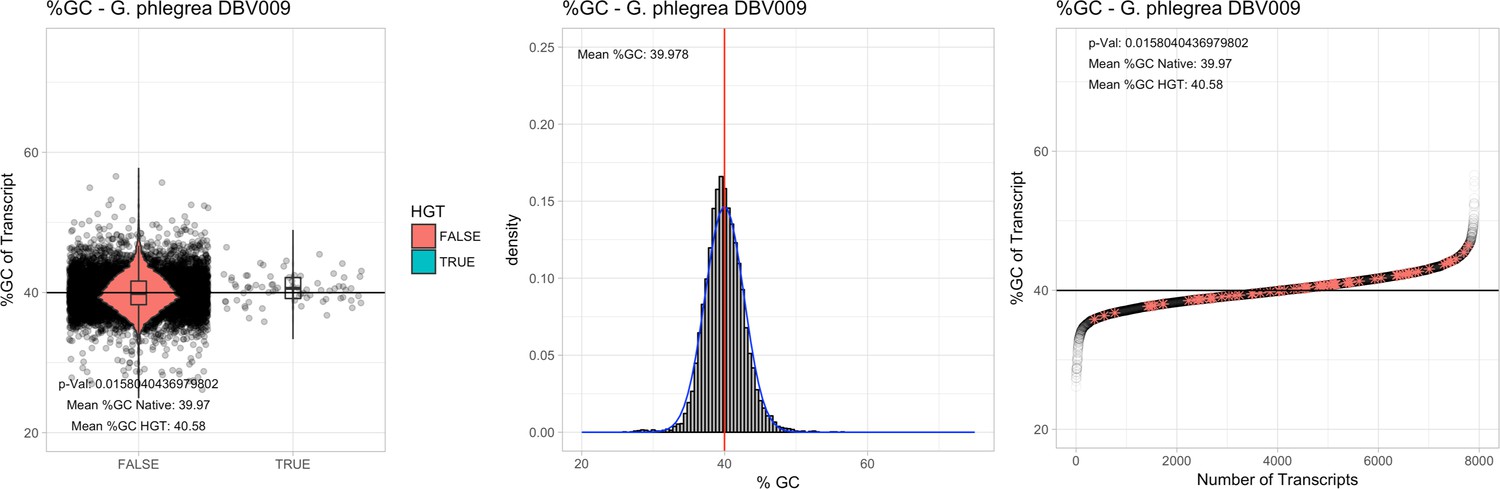
%GC – Galdieria phlegrea DBV009: (Left) Violin plot showing the %GC distribution across native transcripts and HGT candidates.
(Mid) Cumulative %GC distribution of transcripts. Red line shows the average, blue line a normal distribution based on the average value. (Right) Ranking all transcripts based upon their %GC content. Red ‘*' demarks HGT candidates. As the %GC content was normally distributed, students test was applied for the determination of significant differences between the native gene and the HGT candidate subset.
Appendix 3—figure 12
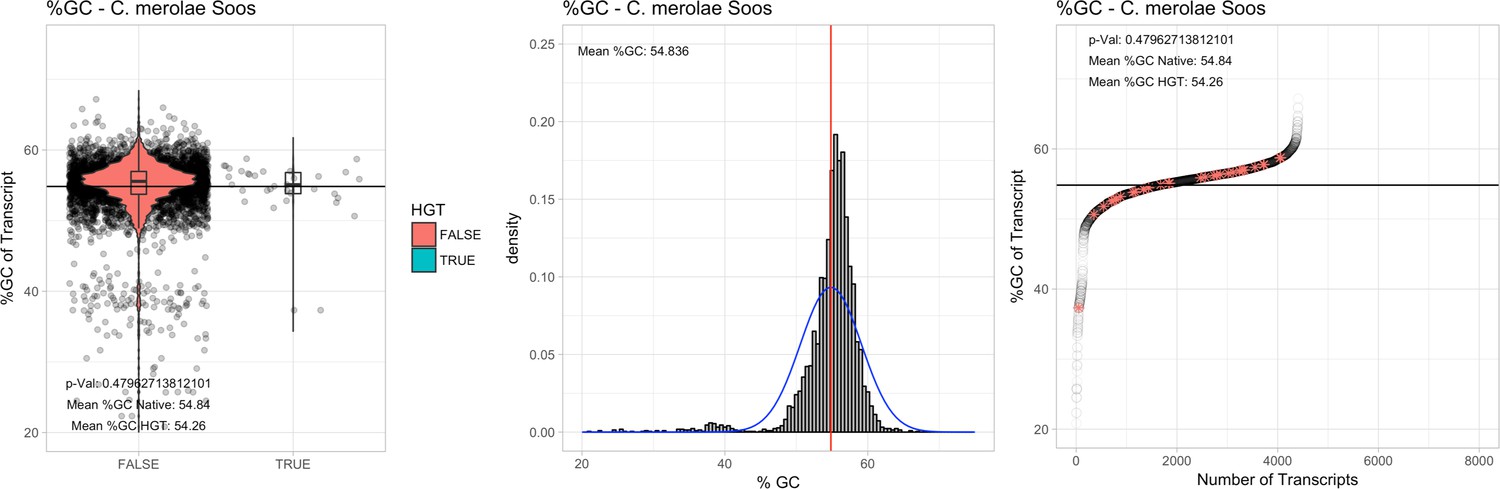
%GC – Cyanidioschyzon merolae Soos: (Left) Violin plot showing the %GC distribution across native transcripts and HGT candidates.
(Mid) Cumulative %GC distribution of transcripts. Red line shows the average, blue line a normal distribution based on the average value. (Right) Ranking all transcripts based upon their %GC content. Red ‘*' demarks HGT candidates. As the %GC content was normally distributed, students test was applied for the determination of significant differences between the native gene and the HGT candidate subset.
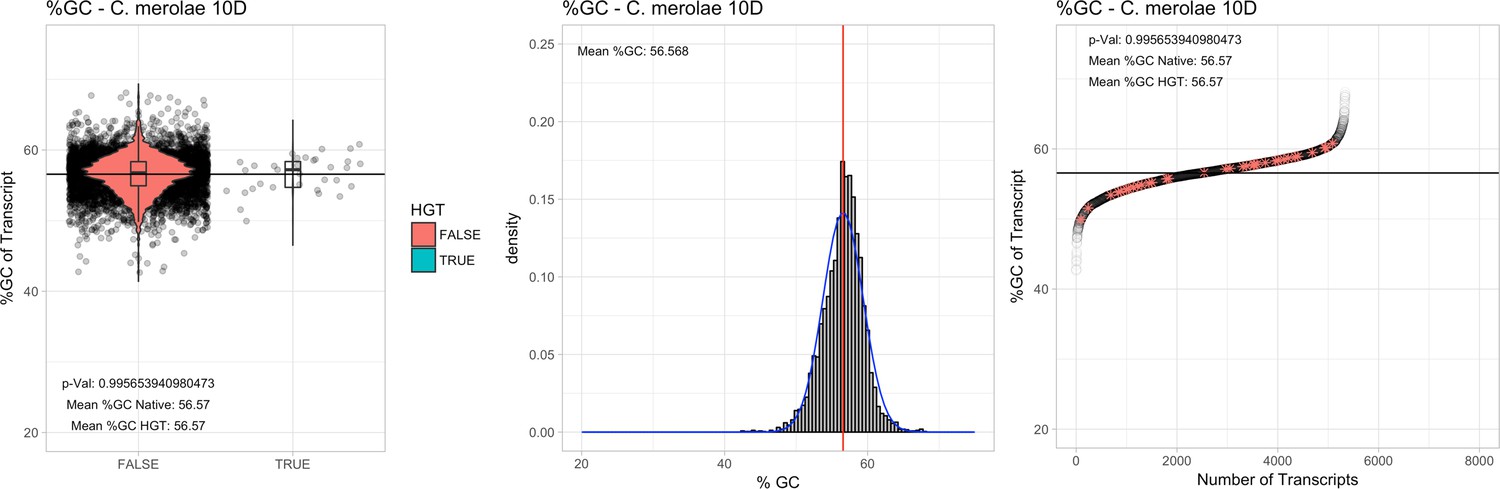
Appendix 3—figure 13
%GC – Cyanidioschyzon merolae 10D: (Left) Violin plot showing the %GC distribution across native transcripts and HGT candidates.
(Mid) Cumulative %GC distribution of transcripts. Red line shows the average, blue line a normal distribution based on the average value. (Right) Ranking all transcripts based upon their %GC content. Red ‘*' demarks HGT candidates. As the %GC content was normally distributed, students test was applied for the determination of significant differences between the native gene and the HGT candidate subset.
Appendix 4—figure 1
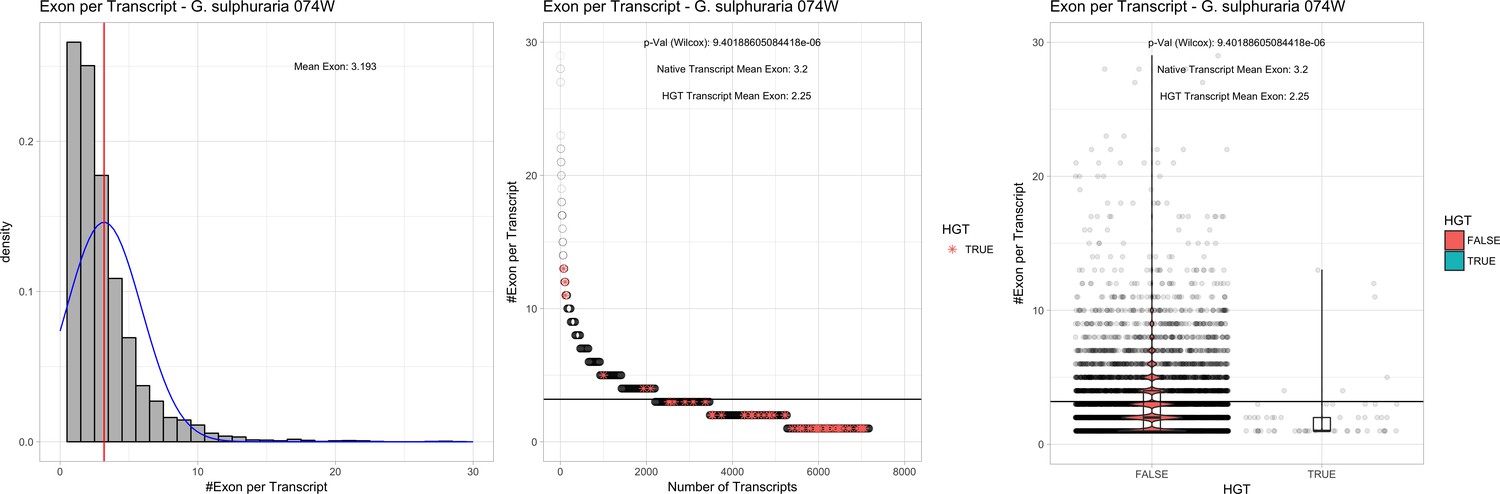
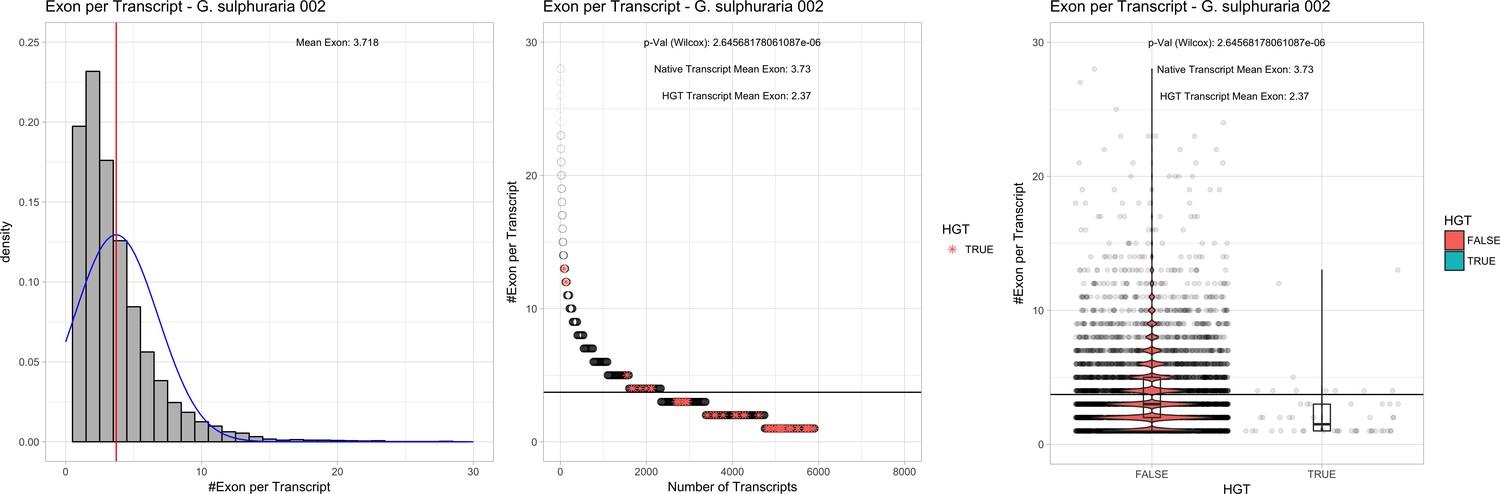
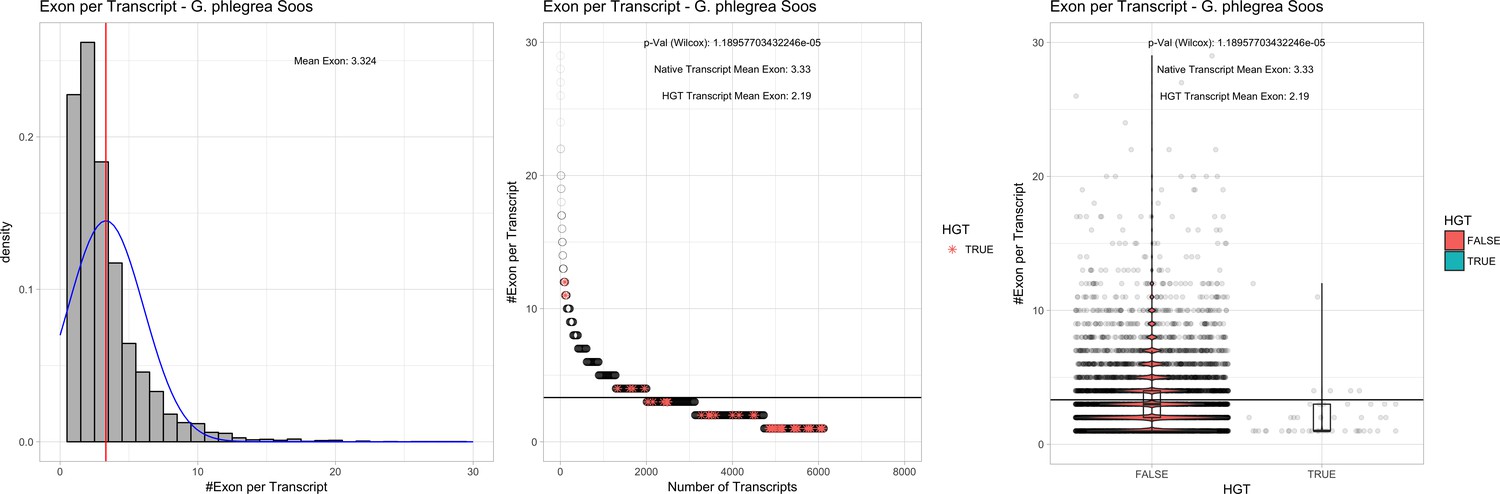
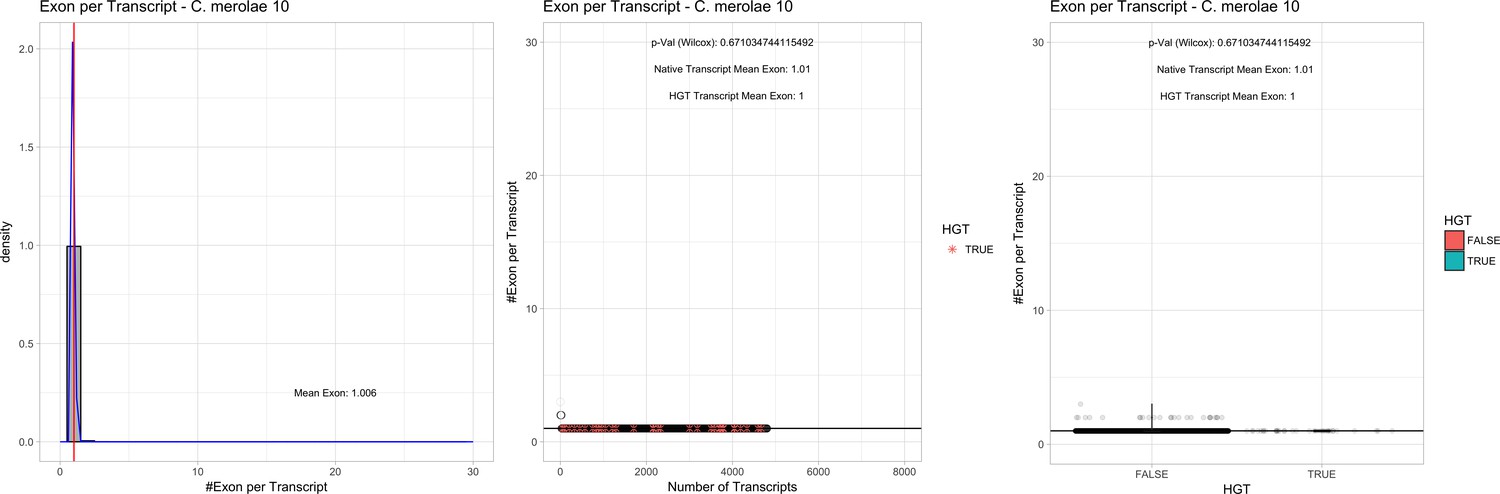
Exon/Intron – Galdieria sulphuraria 074W: (Left) Mid) Cumulative %GC distribution of transcripts.
Red line shows the average, blue line a normal distribution based on the average value. The data is categorical (genes have either one, two, three etc. exons) and does not follow a normal distribution. (Mid) Ranking all transcripts based upon their number of exons. Red ‘*' demarks HGT candidates. As the number of exons was not normally distributed, transcripts were ranked by number of exons. In order to resolve the high number of tied ranks (e.g. many transcripts have two exons) a bootstrap was implied by which the rank of transcripts sharing the same number of exons was randomly assigned 1000 times. Wilcoxon-Mann-Whitney-Test applied for the determination of significant rank differences between the native gene and the HGT candidate subset. (Right) Violin plot showing the number of exons per transcript distribution across native transcripts and HGT candidates.
Appendix 4—figure 2
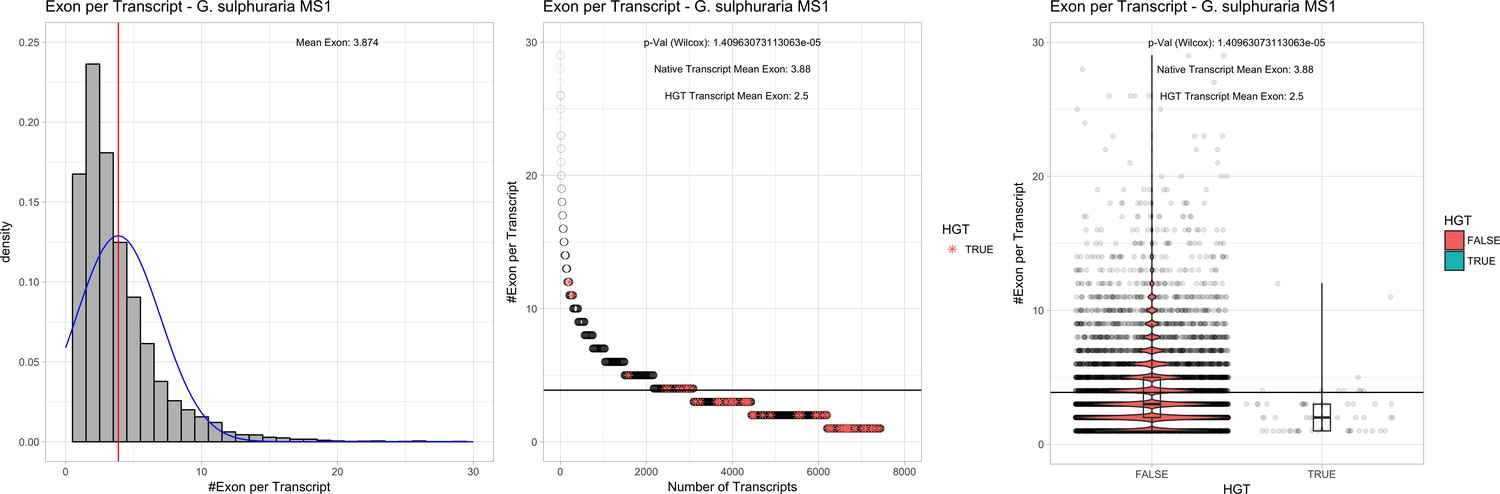
Exon/Intron – Galdieria sulphuraria MS1: (Left) Mid) Cumulative %GC distribution of transcripts.
Red line shows the average, blue line a normal distribution based on the average value. The data is categorical (genes have either one, two, three etc. exons) and does not follow a normal distribution. (Mid) Ranking all transcripts based upon their number of exons. Red ‘*' demarks HGT candidates. As the number of exons was not normally distributed, transcripts were ranked by number of exons. In order to resolve the high number of tied ranks (e.g. many transcripts have two exons) a bootstrap was implied by which the rank of transcripts sharing the same number of exons was randomly assigned 1000 times. Wilcoxon-Mann-Whitney-Test applied for the determination of significant rank differences between the native gene and the HGT candidate subset. (Right) Violin plot showing the number of exons per transcript distribution across native transcripts and HGT candidates.
Appendix 4—figure 3
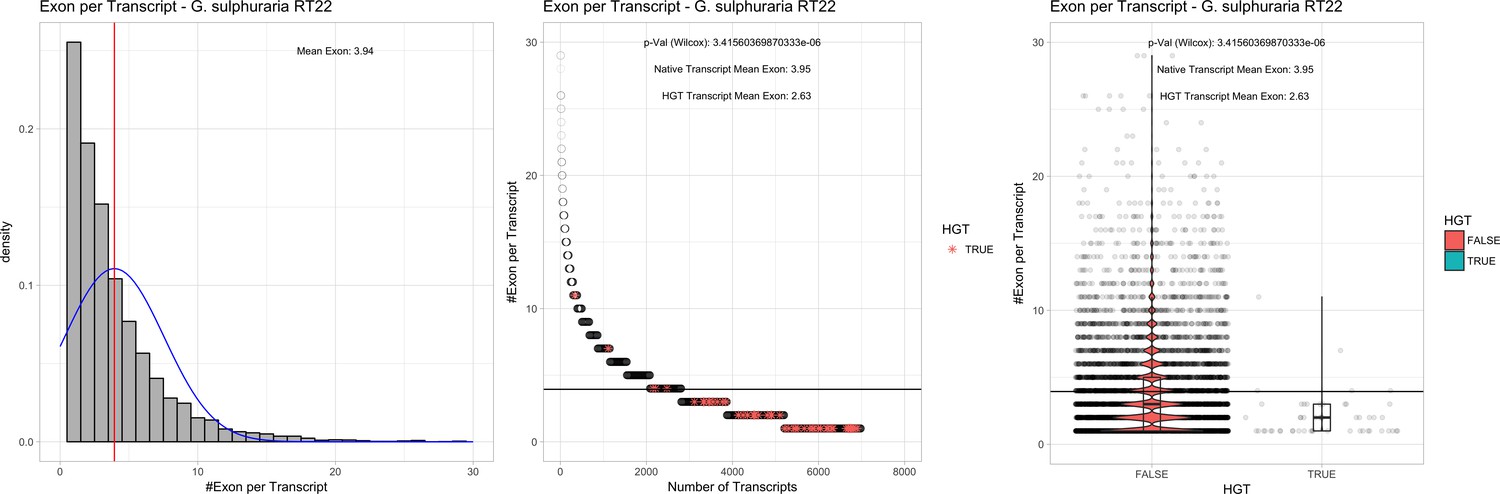
Exon/Intron – Galdieria sulphuraria RT22: (Left) Mid) Cumulative %GC distribution of transcripts.
Red line shows the average, blue line a normal distribution based on the average value. The data is categorical (genes have either one, two, three etc. exons) and does not follow a normal distribution. (Mid) Ranking all transcripts based upon their number of exons. Red ‘*' demarks HGT candidates. As the number of exons was not normally distributed, transcripts were ranked by number of exons. In order to resolve the high number of tied ranks (e.g. many transcripts have two exons) a bootstrap was implied by which the rank of transcripts sharing the same number of exons was randomly assigned 1000 times. Wilcoxon-Mann-Whitney-Test applied for the determination of significant rank differences between the native gene and the HGT candidate subset. (Right) Violin plot showing the number of exons per transcript distribution across native transcripts and HGT candidates.
Appendix 4—figure 4

Exon/Intron – Galdieria sulphuraria SAG21: (Left) Mid) Cumulative %GC distribution of transcripts.
Red line shows the average, blue line a normal distribution based on the average value. The data is categorical (genes have either one, two, three etc. exons) and does not follow a normal distribution. (Mid) Ranking all transcripts based upon their number of exons. Red ‘*' demarks HGT candidates. As the number of exons was not normally distributed, transcripts were ranked by number of exons. In order to resolve the high number of tied ranks (e.g. many transcripts have two exons) a bootstrap was implied by which the rank of transcripts sharing the same number of exons was randomly assigned 1000 times. Wilcoxon-Mann-Whitney-Test applied for the determination of significant rank differences between the native gene and the HGT candidate subset. (Right) Violin plot showing the number of exons per transcript distribution across native transcripts and HGT candidates.
Appendix 4—figure 5
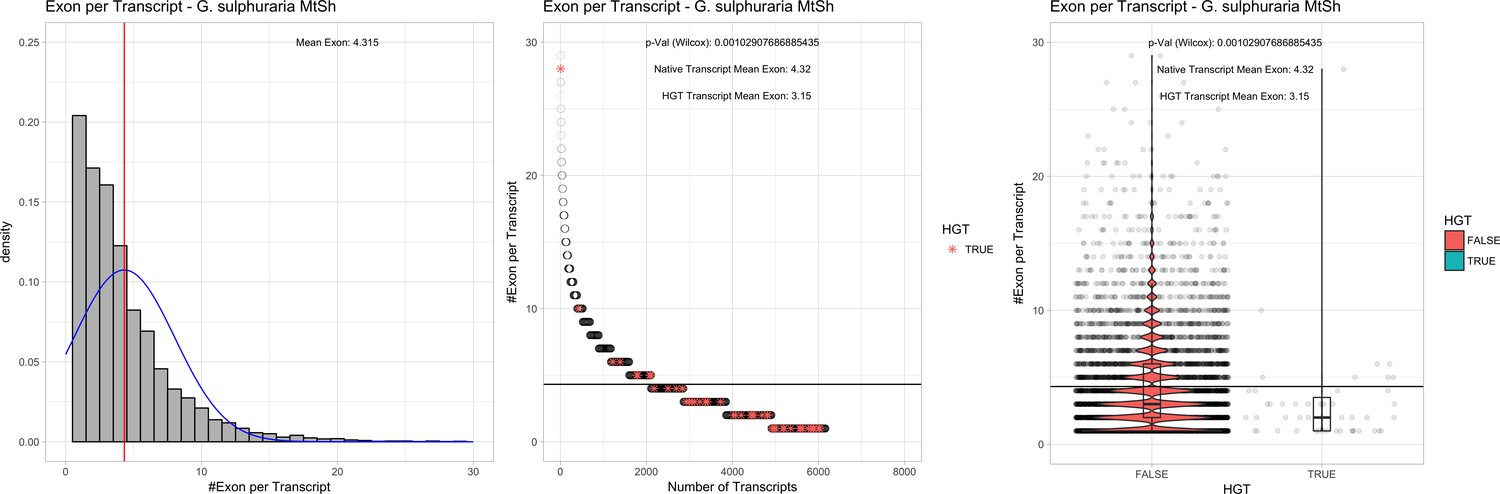
Exon/Intron – Galdieria sulphuraria MtSh: (Left) Mid) Cumulative %GC distribution of transcripts.
Red line shows the average, blue line a normal distribution based on the average value. The data is categorical (genes have either one, two, three etc. exons) and does not follow a normal distribution. (Mid) Ranking all transcripts based upon their number of exons. Red ‘*' demarks HGT candidates. As the number of exons was not normally distributed, transcripts were ranked by number of exons. In order to resolve the high number of tied ranks (e.g. many transcripts have two exons) a bootstrap was implied by which the rank of transcripts sharing the same number of exons was randomly assigned 1000 times. Wilcoxon-Mann-Whitney-Test applied for the determination of significant rank differences between the native gene and the HGT candidate subset. (Right) Violin plot showing the number of exons per transcript distribution across native transcripts and HGT candidates.
Appendix 4—figure 6
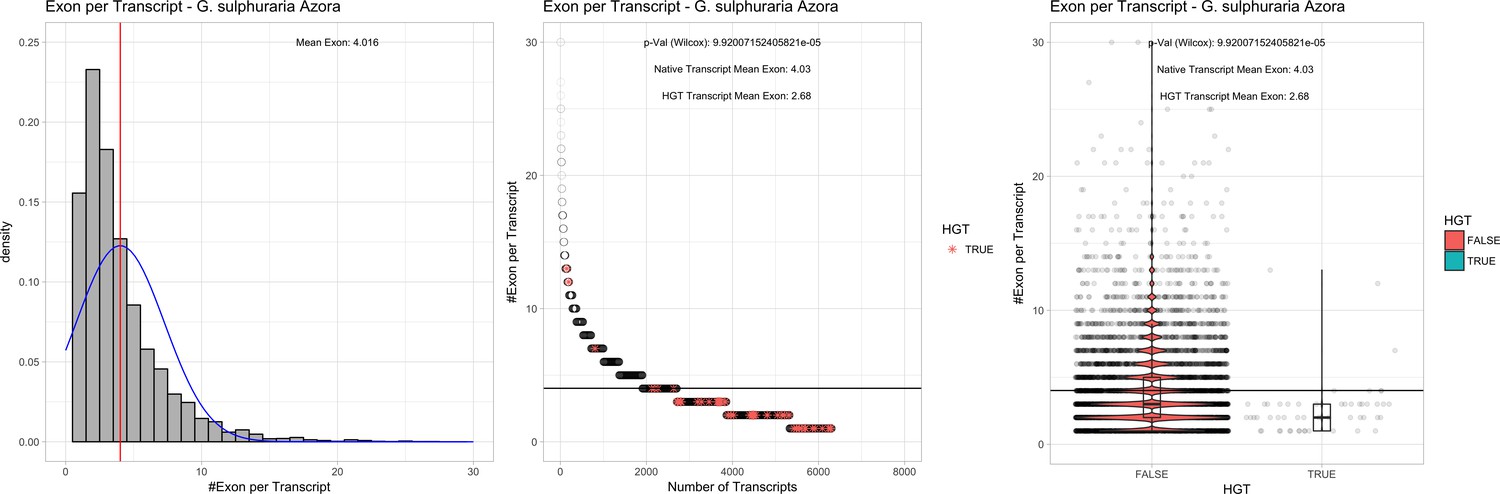
Exon/Intron – Galdieria sulphuraria Azora: (Left) Mid) Cumulative %GC distribution of transcripts.
Red line shows the average, blue line a normal distribution based on the average value. The data is categorical (genes have either one, two, three etc. exons) and does not follow a normal distribution. (Mid) Ranking all transcripts based upon their number of exons. Red ‘*' demarks HGT candidates. As the number of exons was not normally distributed, transcripts were ranked by number of exons. In order to resolve the high number of tied ranks (e.g. many transcripts have two exons) a bootstrap was implied by which the rank of transcripts sharing the same number of exons was randomly assigned 1000 times. Wilcoxon-Mann-Whitney-Test applied for the determination of significant rank differences between the native gene and the HGT candidate subset. (Right) Violin plot showing the number of exons per transcript distribution across native transcripts and HGT candidates.
Appendix 4—figure 7

Exon/Intron – Galdieria sulphuraria YNP5578.1: (Left) Mid) Cumulative %GC distribution of transcripts.
Red line shows the average, blue line a normal distribution based on the average value. The data is categorical (genes have either one, two, three etc. exons) and does not follow a normal distribution. (Mid) Ranking all transcripts based upon their number of exons. Red ‘*' demarks HGT candidates. As the number of exons was not normally distributed, transcripts were ranked by number of exons. In order to resolve the high number of tied ranks (e.g. many transcripts have two exons) a bootstrap was implied by which the rank of transcripts sharing the same number of exons was randomly assigned 1000 times. Wilcoxon-Mann-Whitney-Test applied for the determination of significant rank differences between the native gene and the HGT candidate subset. (Right) Violin plot showing the number of exons per transcript distribution across native transcripts and HGT candidates.
Appendix 4—figure 8

Exon/Intron – Galdieria sulphuraria 5572: (Left) Mid) Cumulative %GC distribution of transcripts.
Red line shows the average, blue line a normal distribution based on the average value. The data is categorical (genes have either one, two, three etc. exons) and does not follow a normal distribution. (Mid) Ranking all transcripts based upon their number of exons. Red ‘*' demarks HGT candidates. As the number of exons was not normally distributed, transcripts were ranked by number of exons. In order to resolve the high number of tied ranks (e.g. many transcripts have two exons) a bootstrap was implied by which the rank of transcripts sharing the same number of exons was randomly assigned 1000 times. Wilcoxon-Mann-Whitney-Test applied for the determination of significant rank differences between the native gene and the HGT candidate subset. (Right) Violin plot showing the number of exons per transcript distribution across native transcripts and HGT candidates.
Appendix 4—figure 9
Exon/Intron – Galdieria sulphuraria 002: (Left) Mid) Cumulative %GC distribution of transcripts.
Red line shows the average, blue line a normal distribution based on the average value. The data is categorical (genes have either one, two, three etc. exons) and does not follow a normal distribution. (Mid) Ranking all transcripts based upon their number of exons. Red ‘*' demarks HGT candidates. As the number of exons was not normally distributed, transcripts were ranked by number of exons. In order to resolve the high number of tied ranks (e.g. many transcripts have two exons) a bootstrap was implied by which the rank of transcripts sharing the same number of exons was randomly assigned 1000 times. Wilcoxon-Mann-Whitney-Test applied for the determination of significant rank differences between the native gene and the HGT candidate subset. (Right) Violin plot showing the number of exons per transcript distribution across native transcripts and HGT candidates.
Appendix 4—figure 10
Exon/Intron – Galdieria phlegrea Soos: (Left) Mid) Cumulative %GC distribution of transcripts.
Red line shows the average, blue line a normal distribution based on the average value. The data is categorical (genes have either one, two, three etc. exons) and does not follow a normal distribution. (Mid) Ranking all transcripts based upon their number of exons. Red ‘*' demarks HGT candidates. As the number of exons was not normally distributed, transcripts were ranked by number of exons. In order to resolve the high number of tied ranks (e.g. many transcripts have two exons) a bootstrap was implied by which the rank of transcripts sharing the same number of exons was randomly assigned 1000 times. Wilcoxon-Mann-Whitney-Test applied for the determination of significant rank differences between the native gene and the HGT candidate subset. (Right) Violin plot showing the number of exons per transcript distribution across native transcripts and HGT candidates.
Appendix 4—figure 11

Exon/Intron – Cyanidioschyzon merolae Soos: (Left) Mid) Cumulative %GC distribution of transcripts.
Red line shows the average, blue line a normal distribution based on the average value. The data is categorical (genes have either one, two, three etc. exons) and does not follow a normal distribution. (Mid) Ranking all transcripts based upon their number of exons. Red ‘*” demarks HGT candidates. As the number of exons was not normally distributed, transcripts were ranked by number of exons. In order to resolve the high number of tied ranks (e.g. many transcripts have two exons) a bootstrap was implied by which the rank of transcripts sharing the same number of exons was randomly assigned 1000 times. Wilcoxon-Mann-Whitney-Test applied for the determination of significant rank differences between the native gene and the HGT candidate subset. (Right) Violin plot showing the number of exons per transcript distribution across native transcripts and HGT candidates..
Appendix 4—figure 12
Exon/Intron – Cyanidioschyzon merolae 074W: (Left) Mid) Cumulative %GC distribution of transcripts.
Red line shows the average, blue line a normal distribution based on the average value. The data is categorical (genes have either one, two, three etc. exons) and does not follow a normal distribution. (Mid) Ranking all transcripts based upon their number of exons. Red ‘*' demarks HGT candidates. As the number of exons was not normally distributed, transcripts were ranked by number of exons. In order to resolve the high number of tied ranks (e.g. many transcripts have two exons) a bootstrap was implied by which the rank of transcripts sharing the same number of exons was randomly assigned 1000 times. Wilcoxon-Mann-Whitney-Test applied for the determination of significant rank differences between the native gene and the HGT candidate subset. (Right) Violin plot showing the number of exons per transcript distribution across native transcripts and HGT candidates.
Appendix 5—figure 1
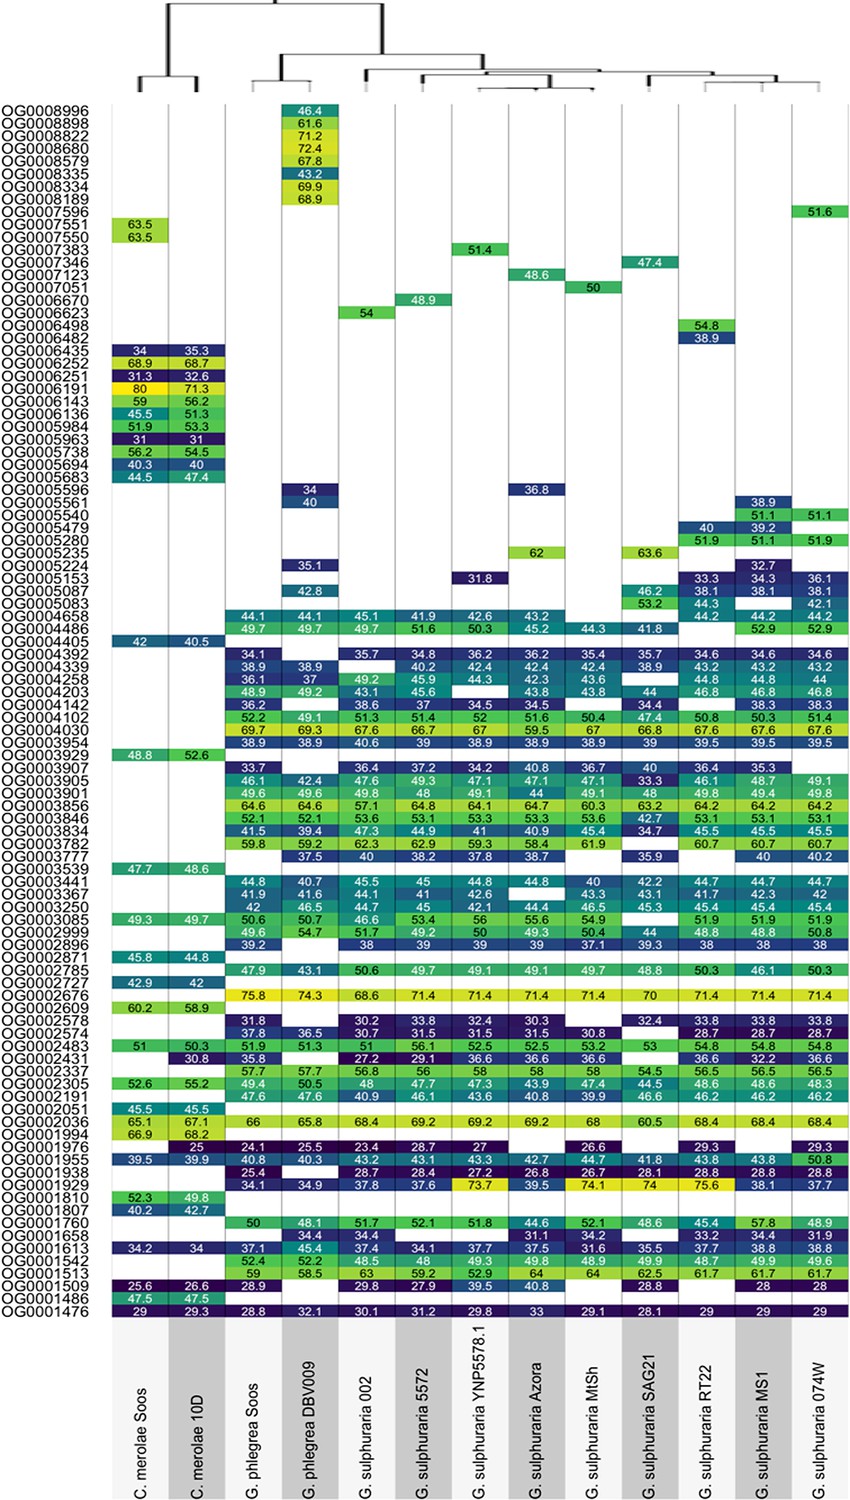
Best Blast Hit between each of the 13 Cyanidiales species and their most similar non-eukaryotic Ortholog in each OG-phylogeny.
Values are given as average percent protein identity between Cyanidiales and non-eukaryotic ortholog. White boxes represent missing Cyanidiales orthologs.
Tables
Table 1
Summary of the 13 analyzed Cyanidiales genomes.
The existing genomes of Galdieria sulphuraria 074W, Cyanidioschyzon merolae 10D, and Galdieria phlegrea are marked with ‘#'. The remaining 10 genomes are novel. Genome Size (Mb): size of the genome assembly in Megabases. Contigs: number of contigs produced by the genome assembly. The contigs were polished with quiver Contig N50 (kb): Contig N50. %GC Content: GC content of the genome given in percent. Genes: transcriptome size of species. Orthogroups: All Cyanidiales genes were clustered into a total of 9075 OGs. Here we show how many OGs there are per species. HGT Orthogroups: Number of OGs derived from HGT. HGT Genes: Number of HGT gene candidates found in species. %GC Native: GC content of the native transcriptome given in percent. %GC HGT: GC content of the HGT gene candidates given in percent % Multiexon Native: % of multiallelic genes in the native transcriptome. % Multiexon HGT: percent of multiallelic genes in the HGT gene candidates. S/M Native: Ratio of Multiexonic vs Singleexonic genes in native transcriptome. S/M HGT: Ratio of Multiexonic vs Singleexonic genes in HGT candidates. Asterisks (*) denote a significant difference (p<=0.05) between native and HGT gene subsets. EC, PFAM, GO, KEGG: Number of species-specific annotations in EC, PFAM, GO, KEGG.
| Strain | Genome features | Gene and OG counts | HGTs | HGT vs native gene subsets | Annotations | |||||||||||||
|---|---|---|---|---|---|---|---|---|---|---|---|---|---|---|---|---|---|---|
| Genome Size (Mb) | Contigs | Contig N50 (kb) | %GC Content | Genes | Orthogroups | HGT orthogroups | HGT genes | %GC Native | %GC HGT | (%) Multiexon Native | (%) Multiexon HGT | Exon/Gene Native | Exon/Gene HGT | EC | PFAM | KEGG | GO | |
| G. sulphuraria 074W# | 13.78 | 433 | 172.3 | 36.89 | 7174 | 5265 | 51 | 55 | 38.99 | 39.62* | 73.6 | 47.3* | 2.25 | 3.2* | 938 | 3073 | 3241 | 6572 |
| G. sulphuraria MS1 | 14.89 | 129 | 172.1 | 37.62 | 7441 | 5389 | 54 | 58 | 39.59 | 40.79* | 83.4 | 62.1* | 2.5 | 3.88* | 930 | 3077 | 3178 | 6564 |
| G. sulphuraria RT22 | 15.62 | 118 | 172.9 | 37.43 | 6982 | 5186 | 51 | 54 | 39.54 | 40.85* | 74.7 | 51.9* | 2.63 | 3.95* | 941 | 3118 | 3223 | 6504 |
| G. sulphuraria SAG21 | 14.31 | 135 | 158.2 | 37.92 | 5956 | 4732 | 44 | 47 | 40.04 | 41.47* | 84.8 | 83.0 | 4.02 | 5.03* | 931 | 3047 | 3143 | 6422 |
| G. sulphuraria MtSh | 14.95 | 101 | 186.6 | 40.04 | 6160 | 4746 | 46 | 47 | 41.33 | 42.48* | 79.7 | 63.8* | 3.15 | 4.32* | 939 | 3114 | 3244 | 6450 |
| G. sulphuraria Azora | 14.06 | 127 | 162.3 | 40.10 | 6305 | 4905 | 49 | 58 | 41.34 | 42.57* | 84.5 | 75.9* | 2.68 | 4.03* | 934 | 3072 | 3181 | 6474 |
| G. sulphuraria YNP5587.1 | 14.42 | 115 | 170.8 | 40.05 | 6118 | 4846 | 46 | 46 | 41.33 | 42.14* | 74.5 | 54.3* | 2.61 | 3.65* | 938 | 3084 | 3206 | 6516 |
| G. sulphuraria 5572 | 14.28 | 108 | 229.7 | 37.99 | 6472 | 5009 | 46 | 53 | 39.68 | 40.5* | 78.4 | 45.3* | 2.15 | 3.53* | 936 | 3108 | 3252 | 6540 |
| G. sulphuraria 002 | 14.11 | 107 | 189.3 | 39.16 | 5912 | 4701 | 46 | 52 | 40.76 | 41.35* | 97.1 | 50.0* | 2.37 | 3.73* | 927 | 3060 | 3184 | 6505 |
| G. phlegrea DBV009# | 11.41 | 9311 | 2.0 | 37.86 | 7836 | 5562 | 54 | 62 | 39.97 | 40.58* | na | na | na | na | 935 | 3018 | 3125 | 6512 |
| G. phlegrea Soos | 14.87 | 108 | 201.1 | 37.52 | 6125 | 4624 | 44 | 47 | 39.57 | 40.73* | 77.5 | 43.2* | 2.19 | 3.33* | 929 | 3034 | 3197 | 6493 |
| C. merolae 10D# | 16.73 | 22 | 859.1 | 54.81 | 4803 | 3980 | 33 | 33 | 56.57 | 56.57 | 0.5 | 0.0 | 1 | 1.01 | 883 | 2811 | 2832 | 6213 |
| C. merolae Soos | 12.33 | 35 | 567.5 | 54.33 | 4406 | 3574 | 34 | 34 | 54.84 | 54.26 | 9.4 | 2.9 | 1.06 | 1.1 | 886 | 2787 | 2823 | 6188 |
Table 2
Natural habitats of extant prokaryotes harboring the closest orthologs to Cyanidiales HGTs.
Numbers in brackets represent how many times HGT candidates from Cyanidiales shared monophyly with non-eukaryotic organisms; for example Proteobacteria were found in 53/96 of the OG monophylies. Kingdom: Taxon at kingdom level. Species: Scientific species name. Habitat: habitat description of the original sampling site. pH: pH of the original sampling site. Temp: Temperature in Celsius of the sampling site. Salt: Ion concentration of the original sampling site. na: no information available.
| Kingdom | Phylogeny | Natural habitat of closest non-eukaryotic ortholog | ||||
|---|---|---|---|---|---|---|
| Division | Species | Habitat description | pH | Max. temp | Salt | |
| Bacteria | Proteobacteria (53) | Acidithiobacillus thiooxidans (4) | Mine drainage/Mineral ores | 2.0–2.5 | 30°C | ‘hypersaline’ |
| Carnimonas nigrificans (4) | Raw cured meat | 3.0 | 35°C | 8% NaCl | ||
| Methylosarcina fibrata (4) | Landfill | 5.0–9.0 | 37°C | 1% NaCl | ||
| Sphingomonas phyllosphaerae (3) | Phyllosphere of Acacia caven | na | 28°C | na | ||
| Gluconacetobacter diazotrophicus (3) | Symbiont of various plant species | 2.0–6.0 | na | ‘high salt’ | ||
| Gluconobacter frateurii (3) | na | na | na | na | ||
| Luteibacter yeojuensis (3) | River | na | na | na | ||
| Thioalkalivibrio sulfidiphilus (3) | Soda lake | 8.0–10.5 | 40°C | 15% total salts | ||
| Thiomonas arsenitoxydans (3) | Disused mine site | 3.0–8.0 | 30°C | ‘halophilic’ | ||
| Firmicutes (28) | Sulfobacillus thermosulfidooxidans (6) | Copper mining | 2.0–2.5 | 45°C | ‘salt tolerant’ | |
| Alicyclobacillus acidoterrestris (4) | Soil sample | 2.0–6.0 | 53°C | 5% NaCl | ||
| Gracilibacillus lacisalsi (3) | Salt lake | 7.2–7.6 | 50°C | 25% total salts | ||
| Actinobacteria (19) | Amycolatopsis halophila (3) | Salt lake | 6.0–8.0 | 45°C | 15% NaCl | |
| Rubrobacter xylanophilus (3) | Thermal industrial runoff | 6.0–8.0 | 60°C | 6.0% NaCl | ||
| Chloroflexi (12) | Caldilinea aerophila (4) | Thermophilic granular sludge | 6.0–8.0 | 65°C | 3% NaCl | |
| Ardenticatena maritima (3) | Coastal hydrothermal field | 5.5–8.0 | 70°C | 6% NaCl | ||
| Ktedonobacter racemifer (3) | Soil sample | 4.8–6.8 | 33°C | >3% NaCl | ||
| Bacteroidetes Chlorobi (10) | Salinibacter ruber (4) | Saltern crystallizer ponds | 6.5–8.0 | 52°C | 30% total salts | |
| Salisaeta longa (3) | Experimental mesocosm (Salt) | 6.5–8.5 | 46°C | 20% NaCl | ||
| Nitrospirae (7) | Leptospirillum ferriphilum (4) | Arsenopyrite biooxidation tank | 0–3.0 | 40°C | 2% NaCl | |
| Fibrobacteres (6) | Acidobacteriaceae bacterium TAA166 (3) | na | na | na | na | |
| Deinococcus (5) | Truepera radiovictrix (3) | Hot spring runoffs | 7.5–9.5 | na | 6% NaCl | |
| Archaea | Euryarchaeota (6) | Ferroplasma acidarmanus (3) | Acid mine drainage | 0–2.5 | 40°C | ‘halophilic’ |
Appendix 1—table 1
Sequencing and Assembly stats.
The strains were sequenced using PacBio’s RS2 sequencing technology and P6-C4 chemistry (the only exception being C. merolae Soos, which was sequenced using P4-C2 chemistry). For genome assembly, canu version 1.5 was used, followed by polishing three times using the Quiver algorithm. Genes were predicted with MAKER v3 beta(Doolittle, 1999; Doolittle, 1999). The performance of genome assemblies (not shown here) and gene prediction was assessed using BUSCO v.3. Raw Reads: Number of raw PacBio RSII reads. Raw Reads N50: 50% of the raw sequence is contained in reads with sizes greater than the N50 value. Raw Reads GC: GC content of the raw reads in percent. Raw Reads (bp): Total number of sequenced basepairs (nucleotides) per species. Raw Coverage (bp): Genomic coverage by raw reads. This figure was computed once the assembly was finished. Unitigging (bp): Total number of basepairs that survived read correction and trimming. This amount of sequence is what the assembler considered when constructing the genome. Unitigging Coverage: Genomic coverage by corrected and trimmed reads. Genome Size (bp): Size of the polished genome. Genome GC: GC content of the polished genome. Contigs: Number of contigs. Contig N50: 50% of the final genomic sequence is contained in contigs sizes greater than the N50 value. Genes: Number of genes predicted by Maker v3 beta. BUSCO (C): Percentage of complete gene models. BUSCO (C + F): Percentage of complete and fragmented gene models. Fragmented gene models are also somewhat present. BUSCO (D): Percentage of duplicated gene models. BUSCO (M): Percentage of missing gene models.
| Species | Raw reads | Raw reads N50 | Raw reads GC | Raw reads (bp) | Raw reads coverage | Unitigging (bp) | Unitigging coverage | Genome size (bp) | Genome GC | Contigs | Contig N50 | Genes | Busco (C) | Busco (C + F) | Busco (D) | Busco (M) |
|---|---|---|---|---|---|---|---|---|---|---|---|---|---|---|---|---|
| G. sulphuraria RT22 | 163764 | 12023 | 35.83% | 1424372481 | 91.20 | 1108677098 | 70.99 | 15617852 | 37.43% | 118 | 172878 | 6982 | 92.8% | 94.5% | 6.3% | 5.5% |
| G. sulphuraria 002 | 131978 | 10109 | 37.90% | 946093501 | 67.05 | 805608410 | 57.09 | 14110219 | 39.16% | 107 | 189293 | 5912 | 87.5% | 92.5% | 5.0% | 7.5% |
| G. sulphuraria 5572 | 101472 | 10449 | 36.45% | 802203307 | 56.19 | 664626554 | 46.55 | 14277368 | 37.99% | 108 | 229711 | 6472 | 91.5% | 93.5% | 5.0% | 6.5% |
| G. sulphuraria MS1 | 128294 | 9991 | 36.18% | 934546621 | 62.77 | 777587876 | 52.23 | 14887946 | 37.62% | 129 | 172087 | 7441 | 90.8% | 94.1% | 4.0% | 5.9% |
| G. sulphuraria MtSh | 158936 | 13617 | 39.19% | 1523875693 | 101.95 | 1235394614 | 82.65 | 14947614 | 40.04% | 101 | 186619 | 6160 | 87.4% | 91.7% | 6.9% | 8.3% |
| G. sulphuraria Azora | 82544 | 10244 | 37.09% | 651280930 | 46.31 | 551720524 | 39.23 | 14063793 | 40.10% | 127 | 162248 | 6305 | 88.4% | 92.0% | 2.3% | 8.0% |
| G. sulphuraria SAG21.92 | 71480 | 10341 | 36.67% | 564874149 | 39.47 | 413793659 | 28.91 | 14312824 | 37.92% | 135 | 158217 | 5956 | 83.8% | 88.4% | 3.6% | 11.6% |
| G. sulphuraria YNP5587.1 | 77421 | 13842 | 36.69% | 769606723 | 53.38 | 613905250 | 42.58 | 14416547 | 40.05% | 115 | 170797 | 6118 | 91.8% | 93.5% | 5.0% | 6.5% |
| G. phlegrea Soos | 92263 | 14365 | 36.01% | 966702049 | 65.00 | 619580741 | 41.66 | 14872696 | 37.52% | 108 | 201071 | 6125 | 92.1% | 93.8% | 7.9% | 6.2% |
| C. merolae Soos | 154461 | 7924 | 52.92% | 848542698 | 68.82 | 570542830 | 46.27 | 12329961 | 54.33% | 35 | 567466 | 4406 | 85.2% | 89.5% | 2.0% | 10.5% |
| G. sulphuraria074W* | 13712004 | 36.89% | 433 | 172322 | 7177 | 83.8% | 87.4% | 2.3% | 10.3% | |||||||
| C. merolae 10D* | 16728945 | 54.81% | 22 | 859119 | 5044 | 90.4% | 93.4% | 1.3% | 6.6% | |||||||
| G. phlegrea DBV009* | 11413183 | 37.86% | 9311 | 1993 | 7836 | 68.3% | 88.1% | 3.6% | 11.9% |
Appendix 3—table 1
%GC analysis of the Cyanidiales transcriptomes.
%GC content of HGT genes was compared to the %GC content of native genes using students test. Legend: HGT Genes: number of HGT gene candidates found in species. Avg. %GC Native: average %GC of native transcripts. Avg. %GC HGT: average %GC of HGT candidates. P-Val (T-test): significance value (p-value) of student’s test. Delta: difference in %GC between average %GC of native genes and the average %GC of HGT candidates.
| HGT genes | Avg. %GC Native | Avg. %GC HGT | p-Val (T-test) | Delta | |
|---|---|---|---|---|---|
| Galdieria_sulphuraria_074W | 55 | 38.99 | 39.62 | 0.046 | 0.63 |
| Galdieria_sulphuraria_MS1 | 58 | 39.59 | 40.79 | 0 | 1.2 |
| Galdieria_sulphuraria_RT22 | 54 | 39.54 | 40.85 | 0 | 1.31 |
| Galdieria_sulphuraria_SAG21 | 47 | 40.04 | 41.47 | 0 | 1.43 |
| Galdieria_sulphuraria_MtSh | 47 | 41.33 | 42.48 | 0 | 1.15 |
| Galdieria_sulphuraria_Azora | 58 | 41.34 | 42.57 | 0 | 1.23 |
| Galdieria_sulphuraria_YNP55871 | 46 | 41.33 | 42.14 | 0.006 | 0.81 |
| Galdieria_sulphuraria_5572 | 53 | 39.68 | 40.5 | 0.002 | 0.82 |
| Galdieria_sulphuraria_002 | 52 | 40.76 | 41.35 | 0.016 | 0.59 |
| Galdieria_phlegrea_DBV08 | 54 | 39.97 | 40.58 | 0.016 | 0.61 |
| Galdieria_phlegrea_Soos | 44 | 39.57 | 40.73 | 0 | 1.16 |
| Cyanidioschyzon_merolae_10D | 33 | 56.57 | 56.57 | 0.996 | 0 |
| Cyanidioschyzon_merolae_Soos | 34 | 54.84 | 54.26 | 0.479 | −0.58 |
Appendix 4—table 1
Single exon genes vs multiexonic.
The ratio of single exon genes vs multiexonic genes was compared between HGT candidates and native Cyanidiales genes (Fisher enrichment test). Legend: HGT Genes: number of HGT gene candidates found in species. Single Exon HGT: number of single exon genes in HGT candidates. Multi Exon HGT: number of multiexonic genes in HGT candidates. Single Exon Native: number of single exon genes in native Cyanidiales genes. Multi Exon Native: number of multiexonic genes in native Cyanidiales genes. HGT SM Ratio percentage of single exon genes within the HGT candidate genes. Native SM Ratio percentage of single exon genes within the native genes. Delta: difference in percent between the percentage of single exon genes between the native genes and HGT candidates. Fisher p-val: p-value of fisher enrichment test.
| HGT genes | Single exon (HGT) | Multi exon (HGT) | Single exon (Native) | Multi exon (Native) | Fisher's p | Single exon % (HGT) | Single exon % (Native) | Multi exon % (HGT) | Multi exon % (Native) | |
|---|---|---|---|---|---|---|---|---|---|---|
| Galdieria_sulphuraria_074W | 55 | 29 | 26 | 1879 | 5240 | 4.05E-05 | 52.7% | 26.4% | 47.3% | 73.6% |
| Galdieria_sulphuraria_MS1 | 58 | 22 | 36 | 1224 | 6159 | 0.0001098 | 37.9% | 16.6% | 62.1% | 83.4% |
| Galdieria_sulphuraria_RT22 | 54 | 26 | 28 | 1756 | 5172 | 0.0004079 | 48.1% | 25.3% | 51.9% | 74.7% |
| Galdieria_sulphuraria_SAG21 | 47 | 8 | 39 | 901 | 5008 | 0.6852 | 17.0% | 15.2% | 83.0% | 84.8% |
| Galdieria_sulphuraria_MtSh | 47 | 17 | 30 | 1239 | 4874 | 0.01054 | 36.2% | 20.3% | 63.8% | 79.7% |
| Galdieria_sulphuraria_Azora | 58 | 14 | 39 | 966 | 5286 | 0.03558 | 24.1% | 15.5% | 75.9% | 84.5% |
| Galdieria_sulphuraria_YNP55871 | 46 | 21 | 25 | 1548 | 4524 | 0.00341 | 45.7% | 25.5% | 54.3% | 74.5% |
| Galdieria_sulphuraria_5572 | 53 | 29 | 24 | 1389 | 5030 | 1.75E-07 | 54.7% | 21.6% | 45.3% | 78.4% |
| Galdieria_sulphuraria_002 | 52 | 26 | 26 | 140 | 4720 | 8.75E-07 | 50.0% | 2.9% | 50.0% | 97.1% |
| Galdieria_phlegrea_DBV009 | 54 | na | na | na | na | na | na | na | na | na |
| Galdieria_phlegrea_Soos | 44 | 25 | 22 | 1369 | 4709 | 5.17E-06 | 56.8% | 22.5% | 43.2% | 77.5% |
| Cyanidioschyzon_merolae_ 10D | 33 | 33 | 0 | 4744 | 26 | 1 | 100.0% | 99.5% | 0.0% | 0.5% |
| Cyanidioschyzon_merolae_Soos | 34 | 33 | 1 | 3960 | 412 | 0.367 | 97.1% | 90.6% | 2.9% | 9.4% |
Appendix 4—table 2
Exon/Gene ratio.
The ratio of exons per gene was compared between HGT candidates and native Cyanidiales genes (Wilcox ranked test). Legend: HGT Genes: number of HGT gene candidates found in species. E/G All: average number of exons per gene across the whole transcriptome. E/G Native: average number of exons per gene across in native genes. E/G HGT: average number of exons per gene in HGT gene candidates. p-Val (Wilcox) SM Ratio p-value of non-parametric Wilcox test for significant differences. Delta: difference in average number of exons per gene the native genes and HGT candidates.
| HGT genes | Mean exon per transcript (HGT) | Mean exon per transcript (Native) | Wilcox (p) | Delta | |
|---|---|---|---|---|---|
| Galdieria_sulphuraria_074W | 55 | 2.25 | 3.2 | 9.40E-06 | 0.95 |
| Galdieria_sulphuraria_MS1 | 58 | 2.5 | 3.88 | 1.41E-05 | 1.38 |
| Galdieria_sulphuraria_RT22 | 54 | 2.63 | 3.95 | 3.42E-06 | 1.32 |
| Galdieria_sulphuraria_SAG21 | 47 | 4.02 | 5.03 | 0.0004 | 1.01 |
| Galdieria_sulphuraria_MtSh | 47 | 3.15 | 4.32 | 0.0011 | 1.17 |
| Galdieria_sulphuraria_Azora | 58 | 2.68 | 4.03 | 9.92E-05 | 1.35 |
| Galdieria_sulphuraria_YNP55871 | 46 | 2.61 | 3.65 | 2.30E-04 | 1.04 |
| Galdieria_sulphuraria_5572 | 53 | 2.15 | 3.53 | 2.25E-07 | 1.38 |
| Galdieria_sulphuraria_002 | 52 | 2.37 | 3.73 | 2.65E-06 | 1.36 |
| Galdieria_phlegrea_DBV009 | 54 | na | na | na | na |
| Galdieria_phlegrea_Soos | 44 | 2.19 | 3.33 | 1.19E-05 | 1.14 |
| Cyanidioschyzon_merolae_10D | 33 | 1 | 1.01 | 1.00E + 00 | 0.01 |
| Cyanidioschyzon_merolae_Soos | 34 | 1.06 | 1.1 | 2.10E-01 | 0.04 |
Additional files
-
Transparent reporting form
- https://doi.org/10.7554/eLife.45017.107
Download links
A two-part list of links to download the article, or parts of the article, in various formats.
Downloads (link to download the article as PDF)
Open citations (links to open the citations from this article in various online reference manager services)
Cite this article (links to download the citations from this article in formats compatible with various reference manager tools)
The genomes of polyextremophilic cyanidiales contain 1% horizontally transferred genes with diverse adaptive functions
eLife 8:e45017.
https://doi.org/10.7554/eLife.45017


