Cerebellar folding is initiated by mechanical constraints on a fluid-like layer without a cellular pre-pattern
- Sloan Kettering Institute, United States
- Syracuse University, United States
- Riverside Research, United States
- NYU School of Medicine, United States
- Chiba University, Japan
- Cornell University, United States
Figures
Figure 1
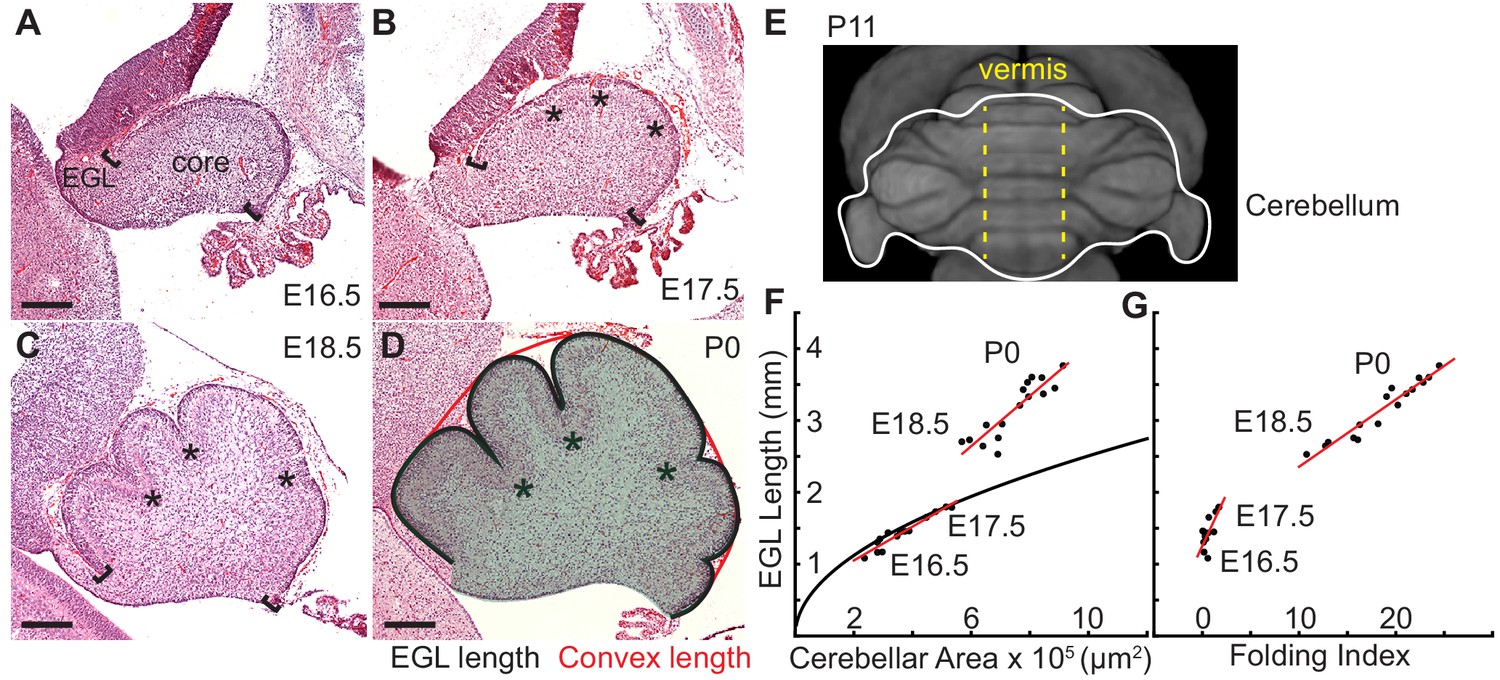
Initiation of cerebellar folding correlates with timing of differential expansion.
(A–D), H and E stained midline sagittal sections of FVB/N mice at the indicated embryonic (E) and postnatal days (P). Anterior to the left. Stars: ACs. Brackets: anterior/posterior ends of the EGL. Black line and red line in (D): EGL and convex length, respectively. Shaded area: core. (E) manganese enhanced magnetic resonance imaging of P11 cerebellum outlined in white adapted from Szulc et al. (2015). Anterior to the top. Vermis indicated by dotted yellow lines. (F), At E16.5 and E17.5 expansion of EGL length and cerebellar area fit the proportional expansion of a semi-circle (curve). At E18.5 and P0 EGL expansion is greater than core area growth creating differential expansion. (G), Folding index [1 - (convex length/EGL length) x 100] reveals folding initiates during differential expansion. Scale bars: 200 μm.
Figure 2 with 3 supplements

Measured tissue stiffness, stress, and shape at folding initiation are inconsistent with wrinkling models.
(A), Inducing the correct number of folds through a wrinkling model requires a stiffness differential between the layers of 50 fold (μf/μs = 50, g = 1.05). (B,C) Acoustic mapping of cerebellar slices show a slightly stiffer EGL than core at each stage (anova df = 5; p=1.0e−4, F = 13.59), but not the required differential. Stars indicate statistical differences. (D) Wrinkling simulations constrained by developmental data produce wavelengths inconsistent with the embryonic mouse cerebellum. (E) Elastic simulations predict the EGL remains closed after cutting. (F,G) Images of a live cerebellar slice before and after cutting, and images from time lapse movie, (H) show the EGL opens, revealing circumferential tension along the EGL. Red and yellow dots: cut edges. Lines: relaxation angle. (I) Staining of nuclei with EGL outlined and lines used to measure thickness. (J–L) Normalized EGL thickness (thickness/mean thickness) at the ACs increases during folding initiation (anova E16.5 df = 29, p=8.2e−20, F = 12.59. E17.5 df = 29, p=3.4e−116, F = 62.78, E18.5 df = 57, p=6.8e−67, F = 13.28). At E16.5 only brains with visible ACs were included. Error bars: S.D.
Figure 2—figure supplement 1

Examples of the regions measured regions by acoustic microscopy.
(A–F) Examples of the Region of Interest (ROI) measured for each for core and EGL. (H–J), Representative bulk modulus maps.
Figure 2—figure supplement 2
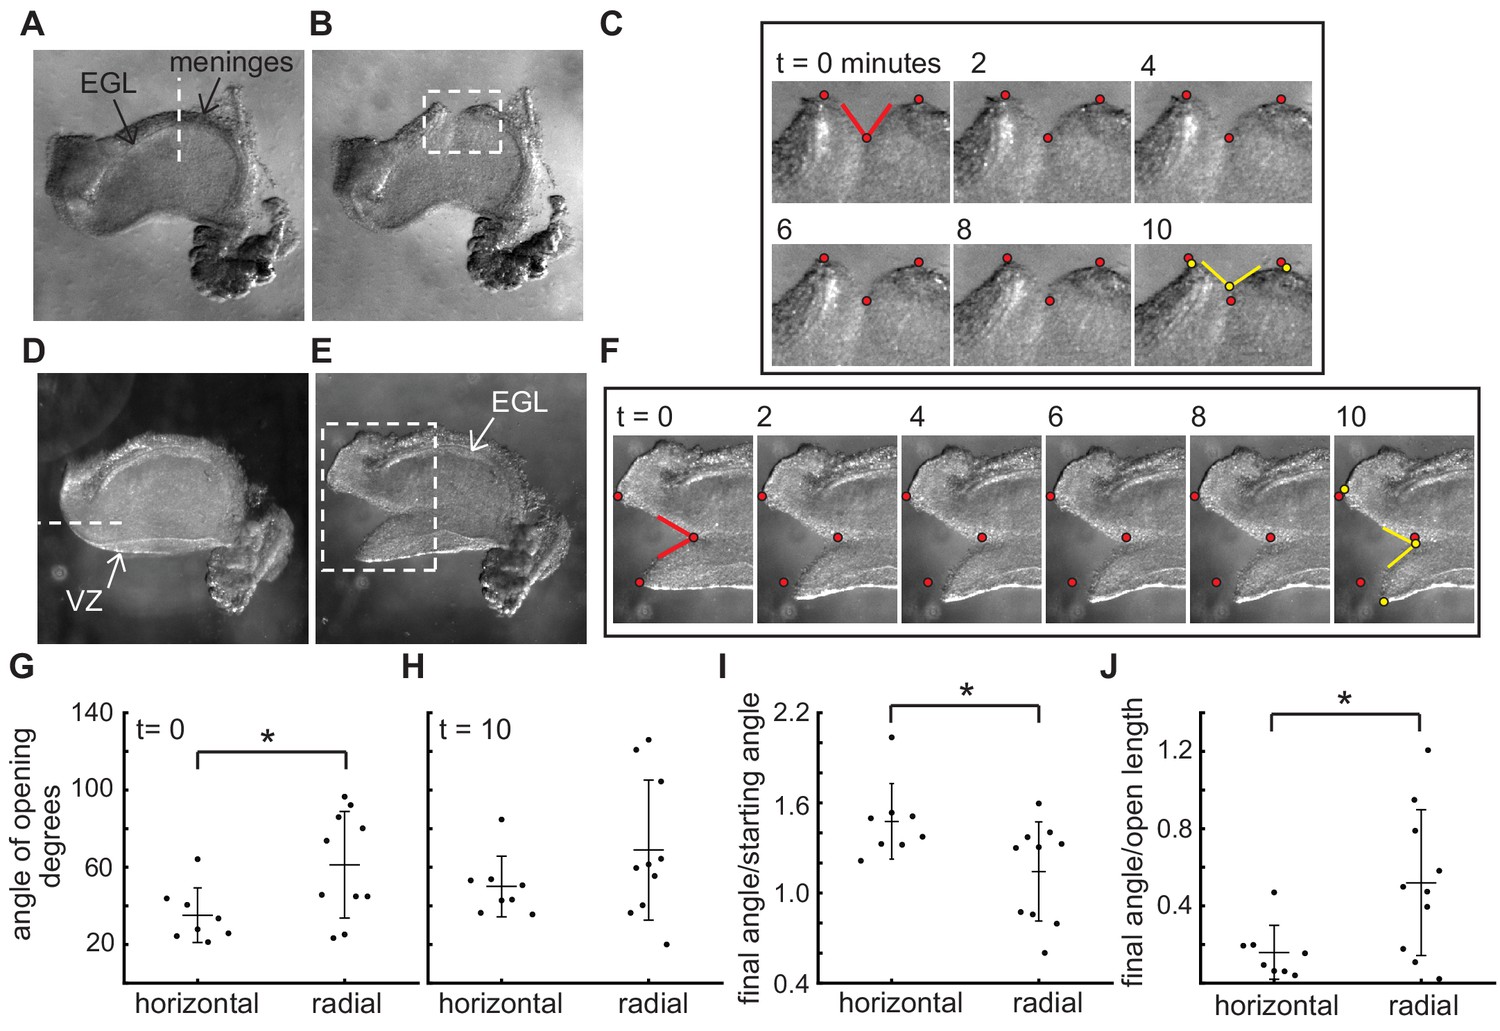
The stress patterns within the cerebellum are different between the EGL and the VZ.
(A–C), Example of a live cerebellar slice before (A) and after (B) a radial cut through the EGL, and still images from a time-lapse (C). Time = 0 min is at the time it takes to remove the knife and start the imaging, therefore the cut has already begun opening. (D–F) Example of a live cerebellar slice before (D) and after (E) a horizontal cut through between the EGL and ventricular zone (VZ), and still images from a movie (F). (G–I) radial cuts through the EGL open more quickly initially than horizontal cuts between the EGL and the Ventricular zone, but the latter continue to relax for longer ((G) f-test for unequal variance p=0.09, two tailed t-test df = 16, p=0.03, T = −2.43; (H) f-test p=0.04 and unequal variance two-tailed t-test df = 12.8 P=0.16, T = −1.48; (I) f-test p=0.49 and two tailed t-test df = 16, p=0.03, T = 2.43). (J) The degree of opening is tightly related to the length of the opening in horizontal cuts but not in radial cuts (f-test p=0.02, unequal variance two tailed t-test df = 11.89, p=0.02, T = −2.80). Stars: statistical differences. Error bars: S.D.
Figure 2—figure supplement 3
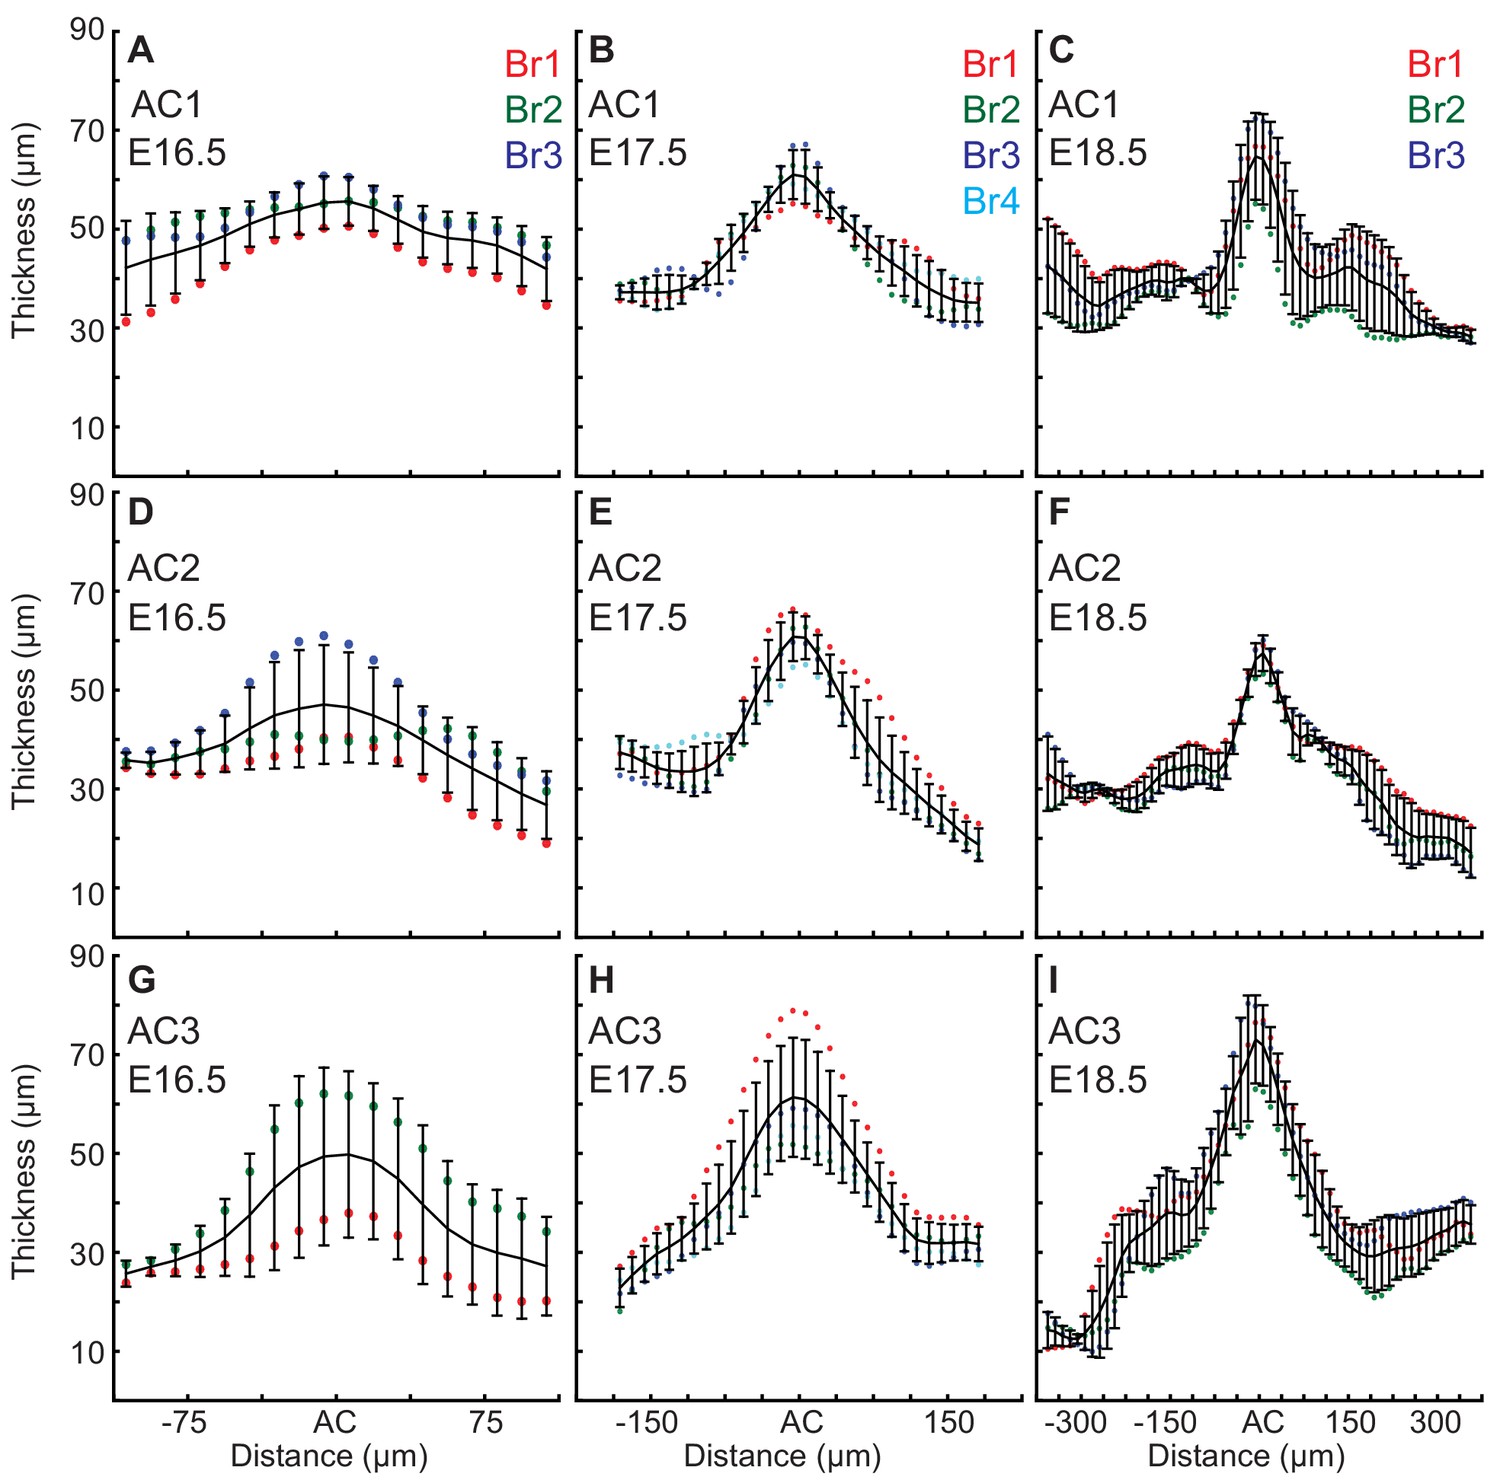
EGL thickness increases in the ACs during the initiation of folding.
Only E16.5 cerebella that showed regional thickening in the geometry where ACs normally arise were used for the measurements, and one embryo did not yet have an AC3. (A–C) Thickness variation in and surrounding AC1 (anova (A) df = 17, p=0.13, F = 1.55 (B) df = 29, p=7.0e−14, F = 6.82 (C) df = 57, p=9.1e−11, F = 4.05). (D–F) Thickness variation in and surrounding AC2 (anova (D) df = 17, p=0.08, F=1.74 (E) df = 29 P=3.9e−22, F = 11.88 (F) df = 57 P=2.9e−35, F = 16.35). (G–I) Thickness variation in and surrounding AC3 (anova (G) df = 17, p=0.59, F=0.89 (H) df = 29, p=2.4e−17, F = 9.81 (I) df = 57, p=7.6e−33, F = 14.57). Error bars are S.D.
Figure 3 with 1 supplement
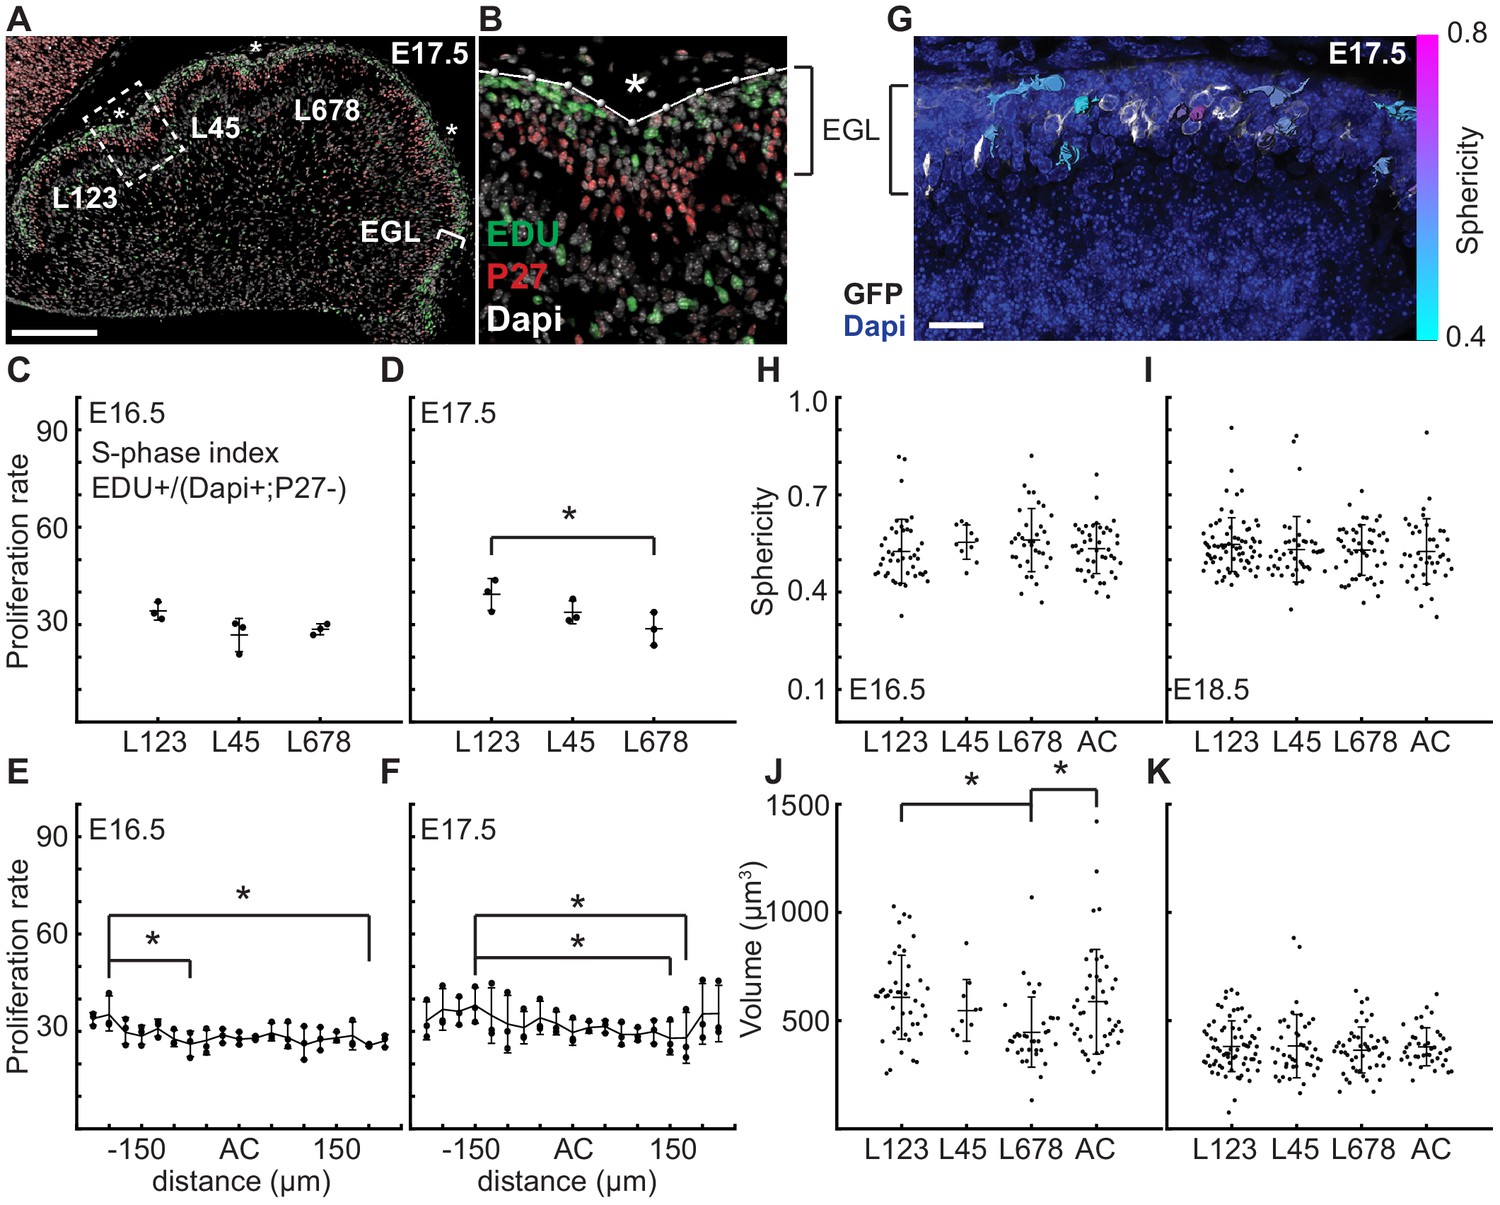
At folding initiation the EGL has uniform proliferation, cell size, and cell shape.
(A,B) Low and high power images of immuno-histochemical (IHC) staining of sagittal cerebellar sections to measure proliferation in the lobules (L) indicated at 25 μm windows surrounding the ACs (stars). Scale bar: 200 μm. (C,D) EGL proliferation rates are shown before and during the onset of invagination (Two-way anova: df = 2. (C) p=0.10, F = 4.36 (D) p=0.03, F = 10.31). (E,F) Proliferation rates are shown in the AC and in the surrounding EGL showing uniformity (Two-way anova: df = 18. (E) p=0.03, F = 2.15 (F) p=2.1e−3, F = 3.06). (G) Section of Atoh1-CreER/+; R26MTMG/+ E16.5 cerebellum showing masked labeled cells. Scale bar: 20 μm. (H,I) Cell shape (sphericity) measurements before and during folding (anova df = 3. (H) p=0.34, F = 1.13 i p=0.61, F = 0.61). (J,K) Cell size measurements before and during folding (anova df = 3. (J) p=3.6e−3, F = 4.75, (K) p=0.85, F = 0.26). Stars indicate statistical differences. Error bars: S.D.
Figure 3—figure supplement 1
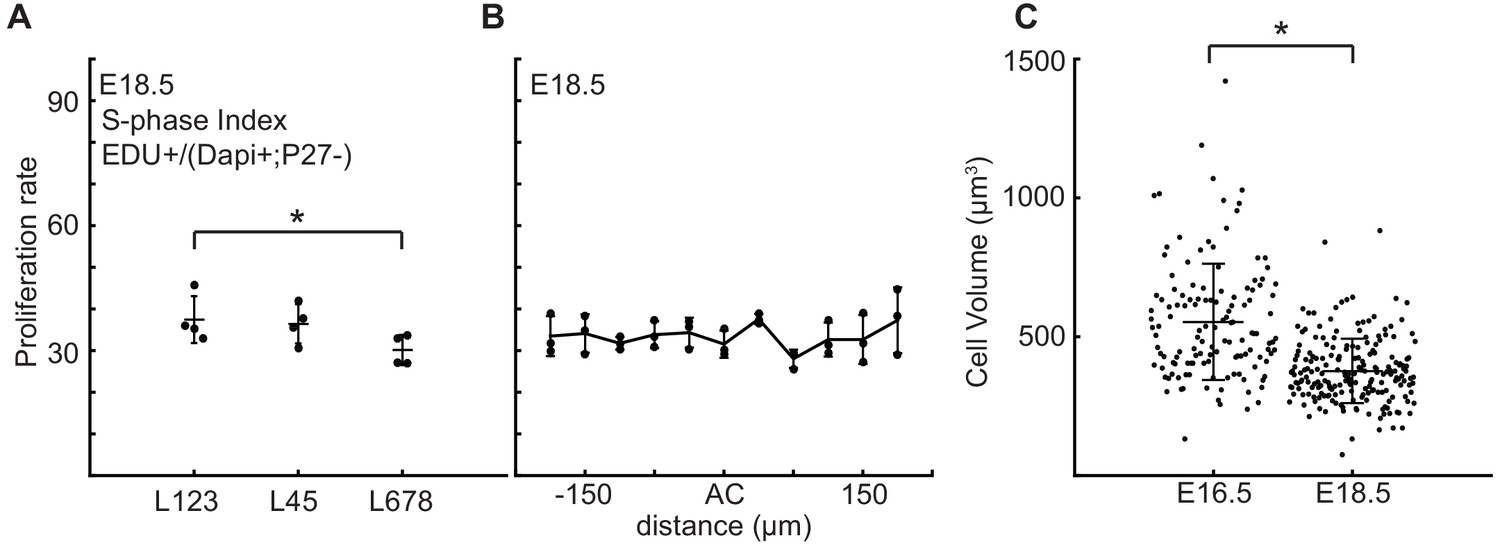
Proliferation rate is reduced in the central zone of the cerebellum after folding initiation.
(A) Proliferation is reduced in lobule region L678 compared to other lobules (anova: df = 2; p=0.01, F = 9.24). (B) Proliferation through the AC regions is uniform with the surrounding EGL (anova: df = 10; p=0.17, F = 1.64). (C) At E18.5 cells within the EGL are smaller than at earlier stages (two-tailed t-test df = 330 P=2.92e−20, T = 9.85). Stars: statistical differences. Error bars: S.D.
Figure 4
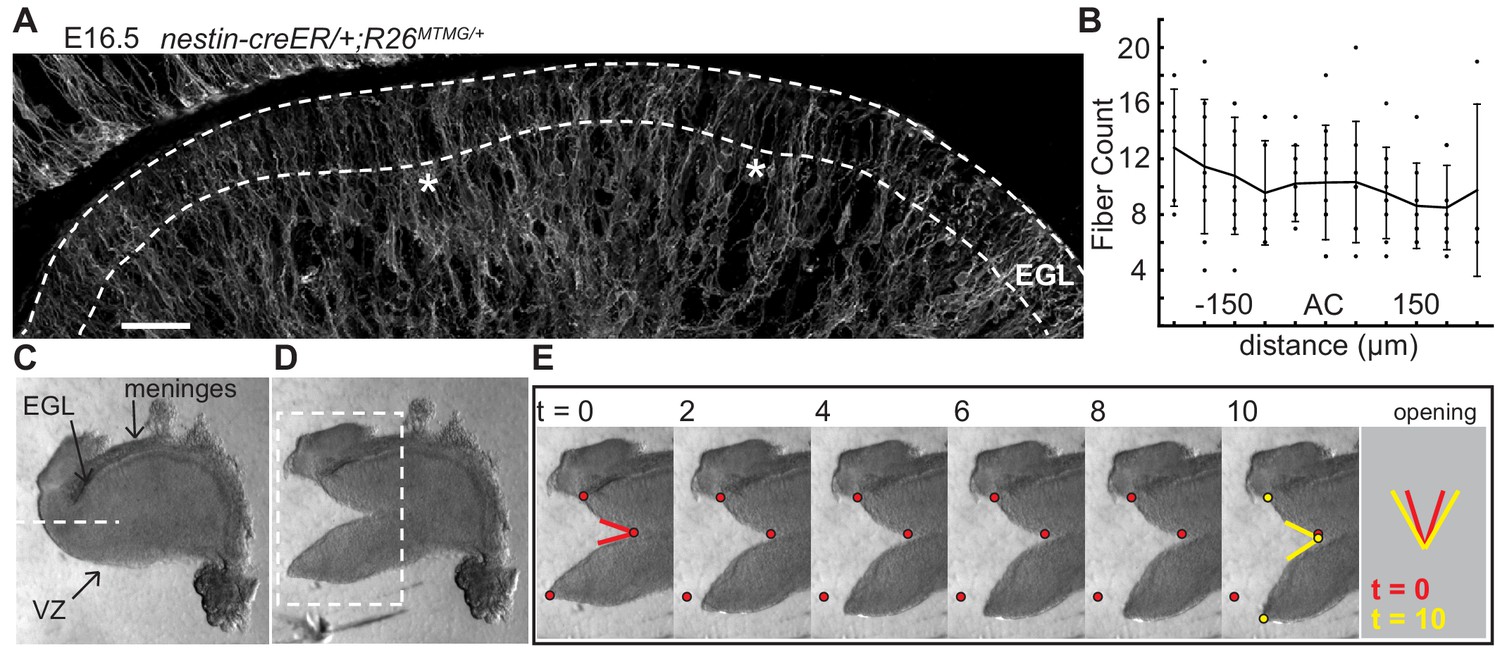
The EGL has a uniform distribution of crossing fibers at folding initiation.
(A) E16.5 nestin-CreER/+; R26MTMG/+ cerebellum section showing fluorescent labeling of radial and Bergmann glial fibers. Stars: AC. Dotted lines denote EGL. Scale bar: 50 μm. (B) Measurements of fiber density in the ACs compared to the surrounding EGL (anova df = 10; p=0.76, F = 0.66). Error bars: S.D. (C–E) Still images of a tissue cutting experiment to test for radial tension between the EGL and the VZ. Red and yellow dots: cut edges at t = 0, 10. Lines: relaxation angle.
Figure 5
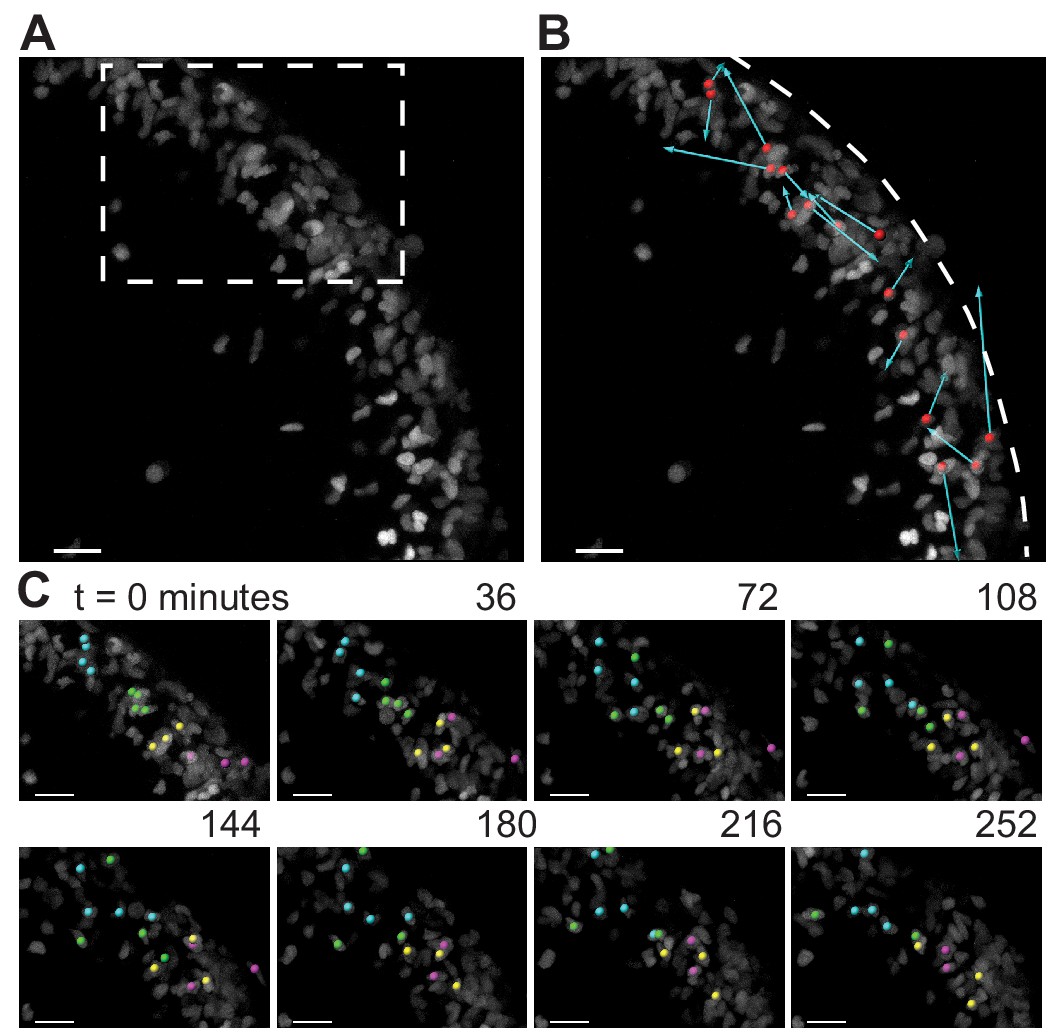
During folding initiation, cells within the EGL are motile and undergo rearrangement.
(A) Image of E16.5 live cerebellar slice (Atoh1-creER/+R26Ai75/+) showing scattered labeling within the EGL. (B) Red dots indicate starting position, displacement arrows show final position of marked cells after 5 hr. White dashed line indicates outer edge of EGL. (C) Still images from time-lapse, inset above. Cells tracked and marked with colored spheres exchange nearest neighbors over a time-scale of tens of minutes. Scale bars are 20 μm.
Figure 6
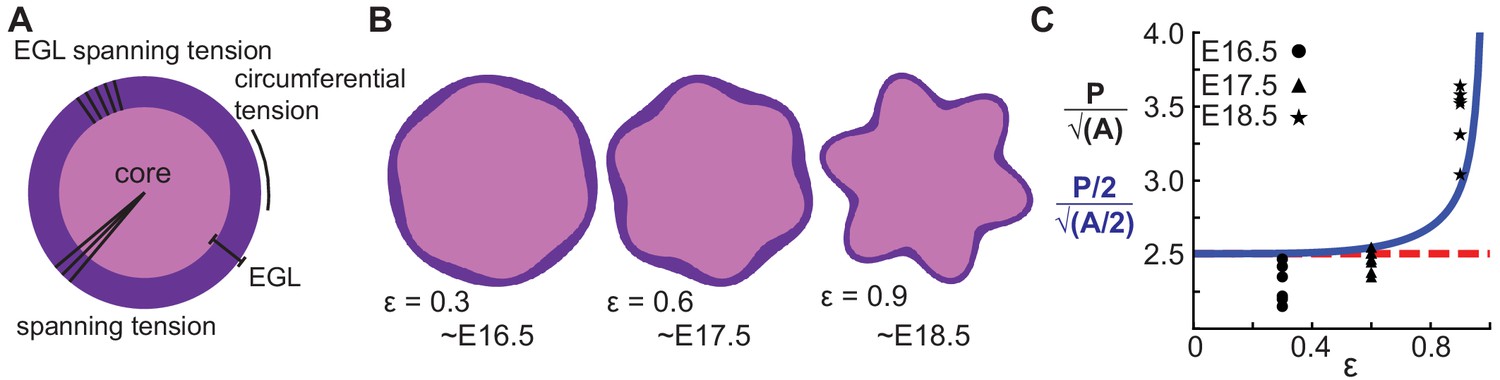
A multiphase model with radial and circumferential constraints and liquid-fibrous EGL composition approximates evolution of cerebellar shape.
(A) Schematic of multiphase model showing types of tension. (B) Thickness variations that arise concomitant with folding approximate those seen in the cerebellum. (C) Shape factor analysis: model for semicircle (red), multi-phase model shape prediction (blue) and actual shape measured from sections (black). Assumed linear relationship between ε and time, ε(T) = 0.3(T −15.5).
Figure 7
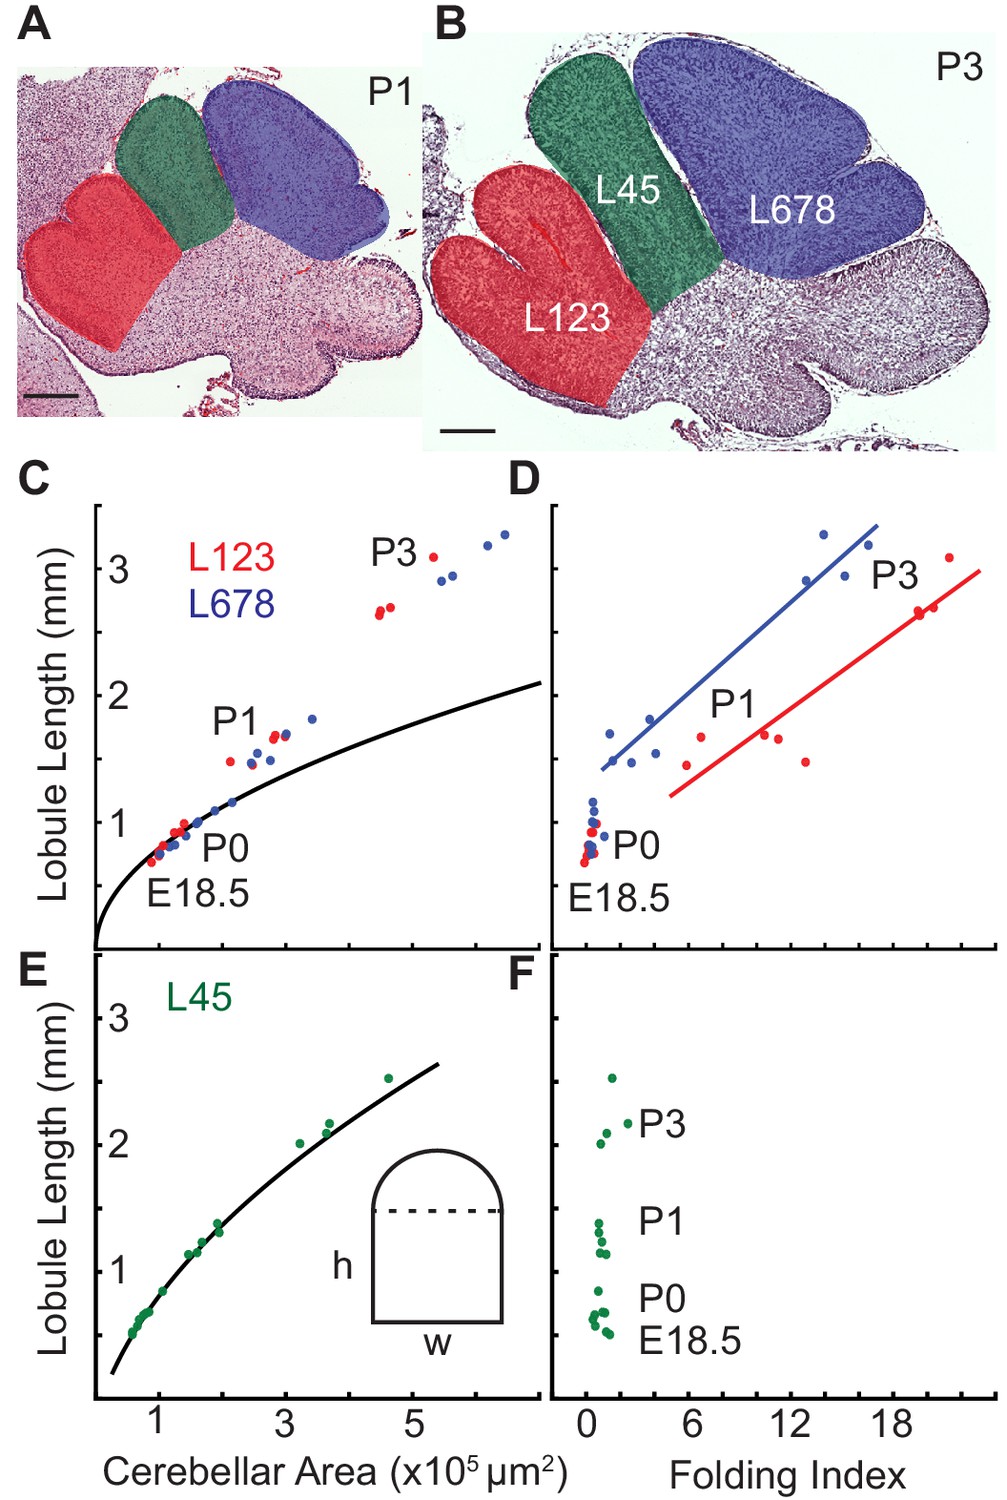
Differential expansion correlates with progressive subfolding of initial folds.
(A,B) H and E stained midline sagittal sections of FVB/N cerebella at P1 and P3 with three lobule regions highlighted in red (L123), green (L45), and blue (L678). (C) Expansion of lobule length and lobule area for L123 and L678 approximate the proportional expansion of a semi-circle (curve) in both regions at E18.5 and P0. After P0 the EGL expansion in both regions increases more than the underlying area creating differential expansion. (D) Folding initiates during regional differential expansion. (E) The expansion in length and area of L45 is proportional to a columnar shape (curve and inset figure) from E18.5 to P3. (F) the L45 region remains unfolded through P3. Scale bars: 200 μm.
Figure 8
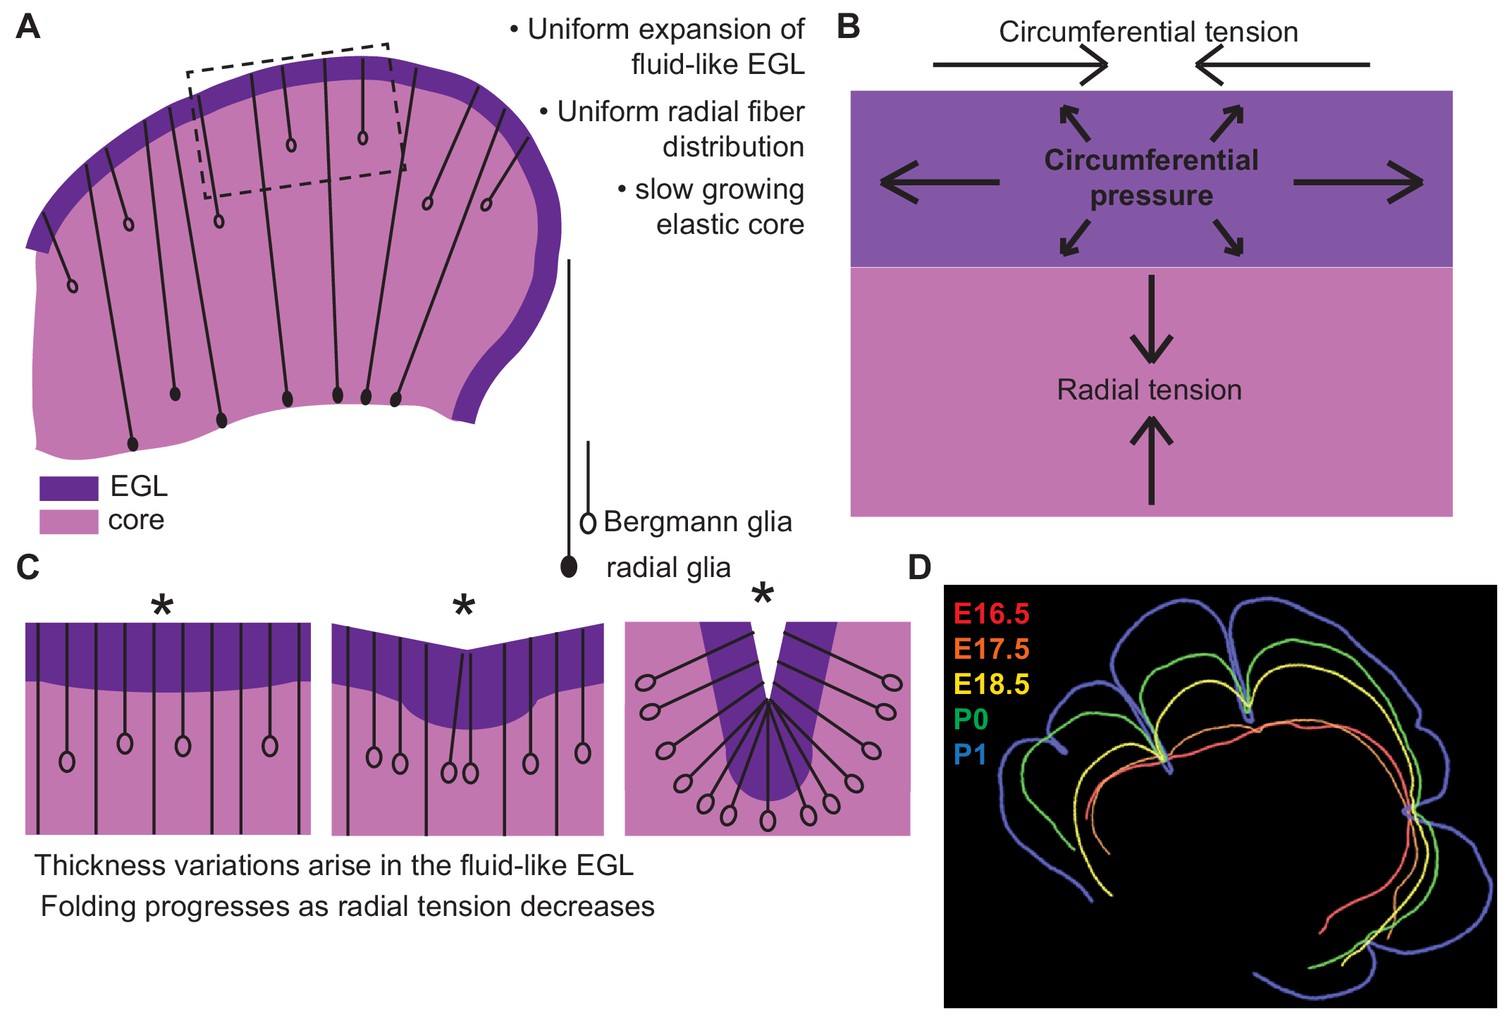
Uniform cell behaviors within a fluid-like EGL create differential expansion based folding approximated by a multiphase model with radial and circumferential tension.
(A) Cartoon of E16.5 cerebellum showing the EGL (dark purple) overlying the in incompressible core (light purple) with fibers (lines) of radial glia (closed ovals) and Bergmann glia (open ovals) crossing the cerebellum and the EGL. (B) Map of stress within the cerebellum at the onset of foliation. (C) Schematics showing that an AC is first detected as a regional inward thickening of the EGL (left). The constraining tensions shape the fluid-like EGL such that the EGL becomes thicker at the AC (middle). As radial glia transition to Bergmann glia, modeling predicts a reduction in radial tension (right). (D) Since ACs hold their position in space, and compartmentalize the cells within the EGL, we propose that they behave as mechanical boundaries allowing local domains of differential expansion to arise and progressive folding to occur.
Videos
Video 1
Live slice cutting and relaxation reveals circumferential tension along the EGL.
Time-lapse video shows relaxation of live tissue slice after cutting radially through the EGL and into the underlying core. Images were acquired every 10 s for 10 min. The time-lapse was started moments after the tissue was collected in frame after the cut. The slice shown in the video is the same as in Figure 2f–h.
Video 2
Live slice cutting and relaxation reveals radial tension between the EGL and The VZ.
Time-lapse video shows relaxation of live tissue slice after cutting horizontally into the core between the EGL and the VZ. Images were acquired every 10 s for 10 min. The time-lapse was started moments after the tissue was collected in frame after the cut. The Slice shown in the video is the same as in Figure 4c–e.
Video 3
Live slice imaging reveals fluid-like behavior in the EGL.
Time-lapse video shows dynamic cell rearrangement of progenitors within the EGL. Image stacks were acquired every ~3.5 min for 5 hr. Cells undergo mixing and neighbor exchange in the tens to hundreds of minutes.
Video 4
Live slice imaging reveals fluid-like behavior in the EGL.
Time-lapse shown in Video 3, with a subset of cells tracked through time and their positions marked with colored spheres.
Tables
Key resources table
| Reagent type (species) or resource | Designation | Source or reference | Identifiers | Additional information |
|---|---|---|---|---|
| Genetic reagent (M.Musculus) | FVB/N | Jax Mice, The Jackson Laboratory | Jackson Labs Stock number: 001800 | |
| Genetic reagent (M.Musculus) | Atoh1-CreER | Machold and Fishell, 2005 | Jackson Labs Stock number: 007684 | |
| Genetic reagent (M.Musculus) | Nestin-CreER | Imayoshi et al., 2006 | ||
| Genetic reagent (M.Musculus) | Rosa26MTMG | Muzumdar et al., 2007 | Jackson labs Stock number: 007676 | |
| Genetic reagent (M.Musculus) | Rosa26Ai75 | Daigle et al., 2018 | Jackson labs Stock number: 025106 | |
| Antibody | mouse monoclonal anti-P27 | BD Pharmingen | 610241 | Dilution 1:500 |
| Antibody | rabbit polyclonal anti-GFP | Life Technologies | A11122 | Dilution 1:500 |
| Antibody | rat monoclonal anti-GFP | Nacalai Tesque | 04404–84 | Dilution 1:500 |
| Commercial Assay or Kit | EDU | Invitrogen | C10340 |
Additional files
-
Transparent reporting form
- https://doi.org/10.7554/eLife.45019.019
Download links
A two-part list of links to download the article, or parts of the article, in various formats.
Downloads (link to download the article as PDF)
Open citations (links to open the citations from this article in various online reference manager services)
Cite this article (links to download the citations from this article in formats compatible with various reference manager tools)
Cerebellar folding is initiated by mechanical constraints on a fluid-like layer without a cellular pre-pattern
eLife 8:e45019.
https://doi.org/10.7554/eLife.45019


