Frontotemporal dementia mutant Tau promotes aberrant Fyn nanoclustering in hippocampal dendritic spines
- University of Queensland, Australia
Figures
Figure 1 with 3 supplements
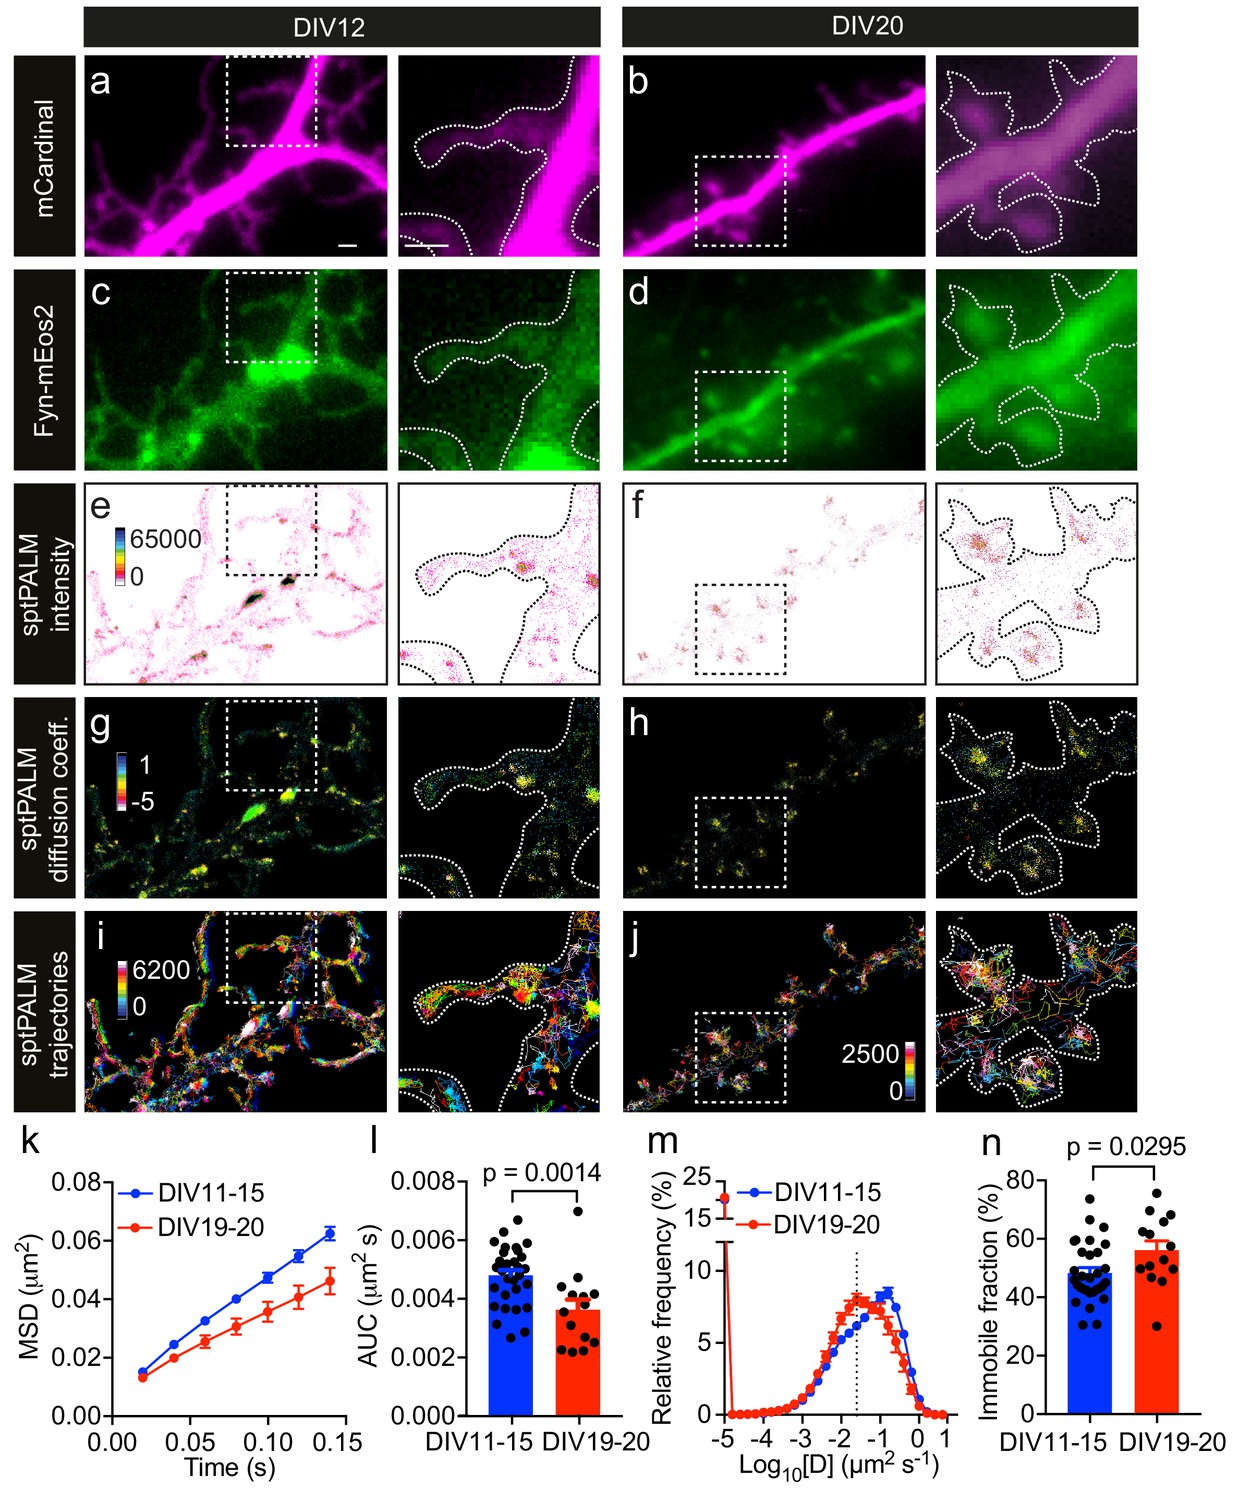
Fyn mobility decreases with dendritic spine maturation.
The analysis was performed at days in vitro (DIV)11–15 and DIV19–20. (a–d) Representative epifluorescence images of DIV12 (a, c) and DIV20 (b, d) neurons co-expressing mCardinal (a, b) and Fyn-mEos2 (c, d), acquired before photoconversion of mEos2 molecules. Insets are shown at a higher magnification. Scale bars, 1 μm. (e–j) sptPALM imaging was performed at 50 Hz for 320 s (16,000 frames) to construct the maps of the localization intensities (e, f), diffusion coefficients (g, h) and trajectories (i, j) of Fyn-mEos2 molecules. The cooler colors represent higher localization intensities (e, f) and larger diffusion coefficients (g, h), and each trajectory is coded with a different color (i, j). (k–n) Comparison of Fyn mobility parameters with development. (k) Average mean square displacement (MSD) as a function of time. (l) The corresponding area under the MSD curves (AUC). (m) Distribution of diffusion coefficients (D) shown in a semi-log plot. The threshold to distinguish the immobile (Log10[D]≤−1.6) and the mobile (Log10[D]>−1.6) fraction of molecules is indicated with a dashed line. (n) The corresponding immobile fraction. Error bars are standard errors of the mean (SEM). Mean ± SEM values were obtained from n = 31 neurons (DIV11–15) and n = 14 neurons (DIV19–20). Statistical comparisons were performed using the Mann-Whitney U test (l) and Student’s t-test (n).
Figure 1—figure supplement 1
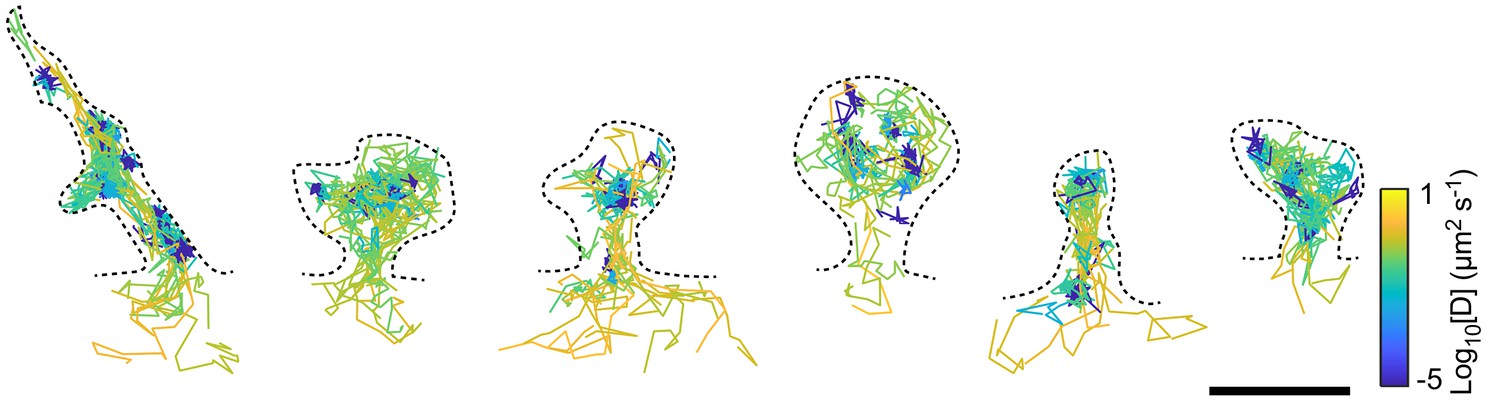
Fyn mobility is heterogeneous even within individual spines.
Representative examples of spines in which the diffusion coefficients of Fyn-mEos2 molecules varied more than 100-fold. Trajectories are color-coded with their respective diffusion coefficients. Scale bar, 1 μm.
Figure 1—figure supplement 2
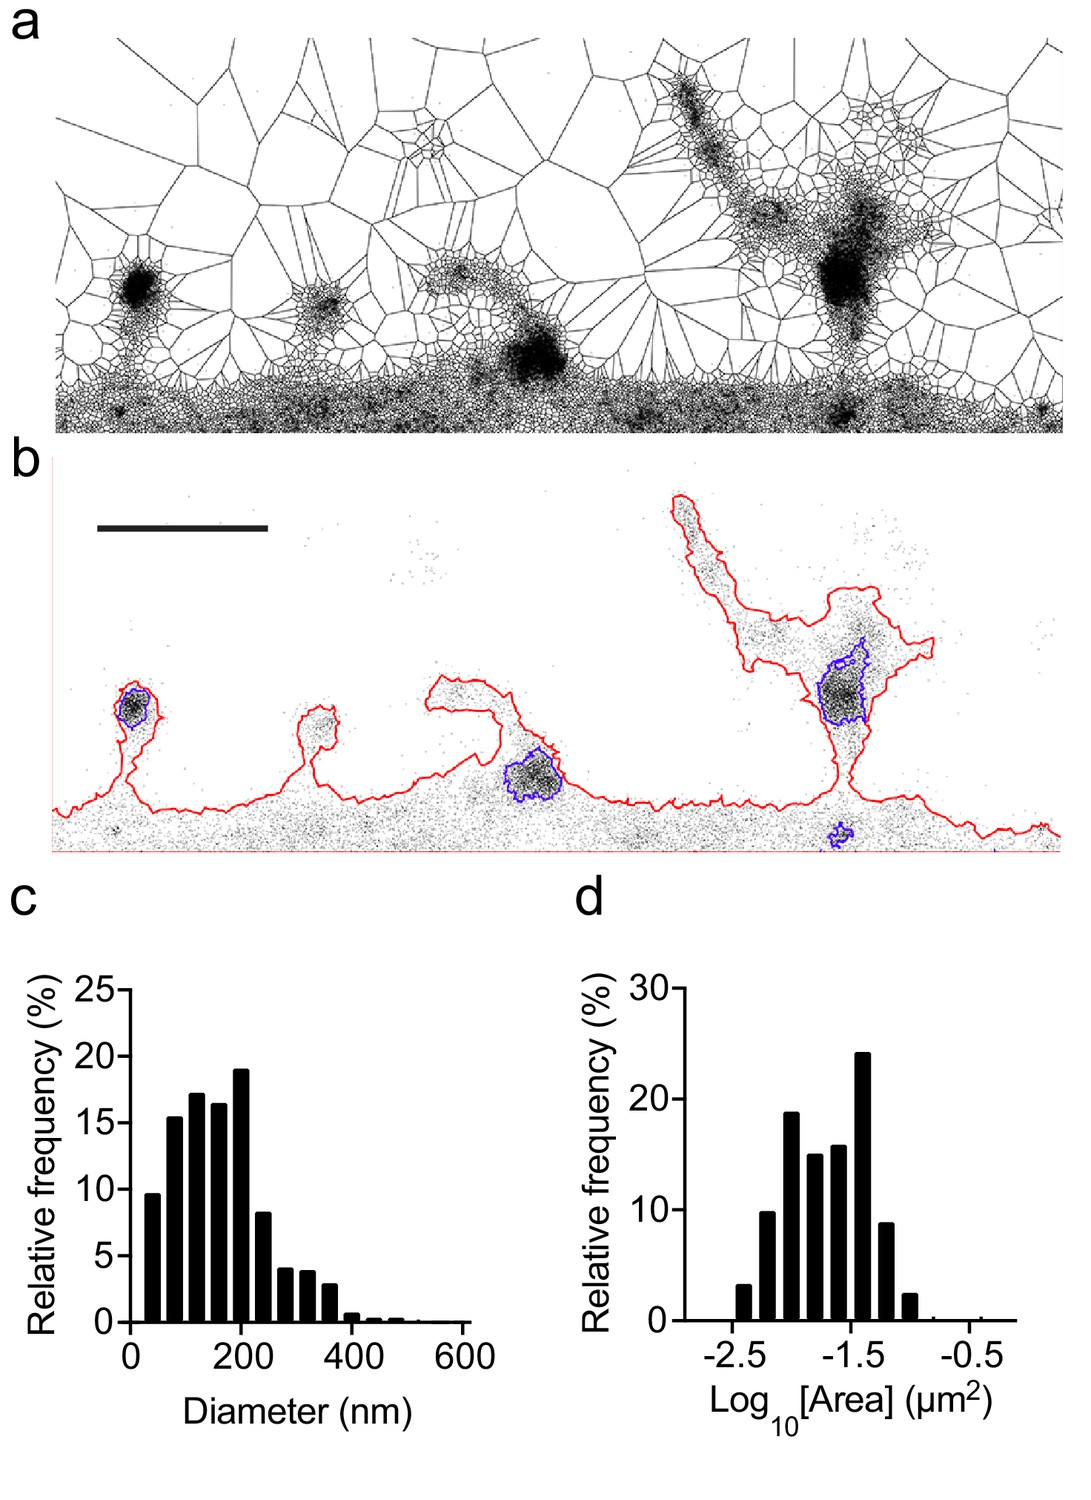
The Voronoï-tessellation-based spatial clustering algorithm identifies Fyn nanodomains in dendritic spines.
(a) Voronoï diagram of Fyn-mEos2 detections. (b) Neuronal contour (red outline) and Fyn nanodomains (blue outline) identified using the Voronoï-tessellation-based spatial clustering algorithm. Scale bar, 1 μm. (c, d) The distributions of the diameter (c) and the area (d) of Fyn nanodomains (n = 502 nanodomains, 14 neurons).
Figure 1—figure supplement 3

Mean square displacement analysis.
(a, b) Representative DIV20 neuron with Fyn-mEos2 trajectories having Log10[D]≤−1.6 (color-coded in red in (a)) and Log10[D]>−1.6 (color-coded in blue in (b)). Scale bar, 1 μm. (c) Average mean square displacement as a function of time for trajectories with Log10[D]≤−1.6 and Log10[D]>−1.6 (n = 14 neurons).
Figure 2
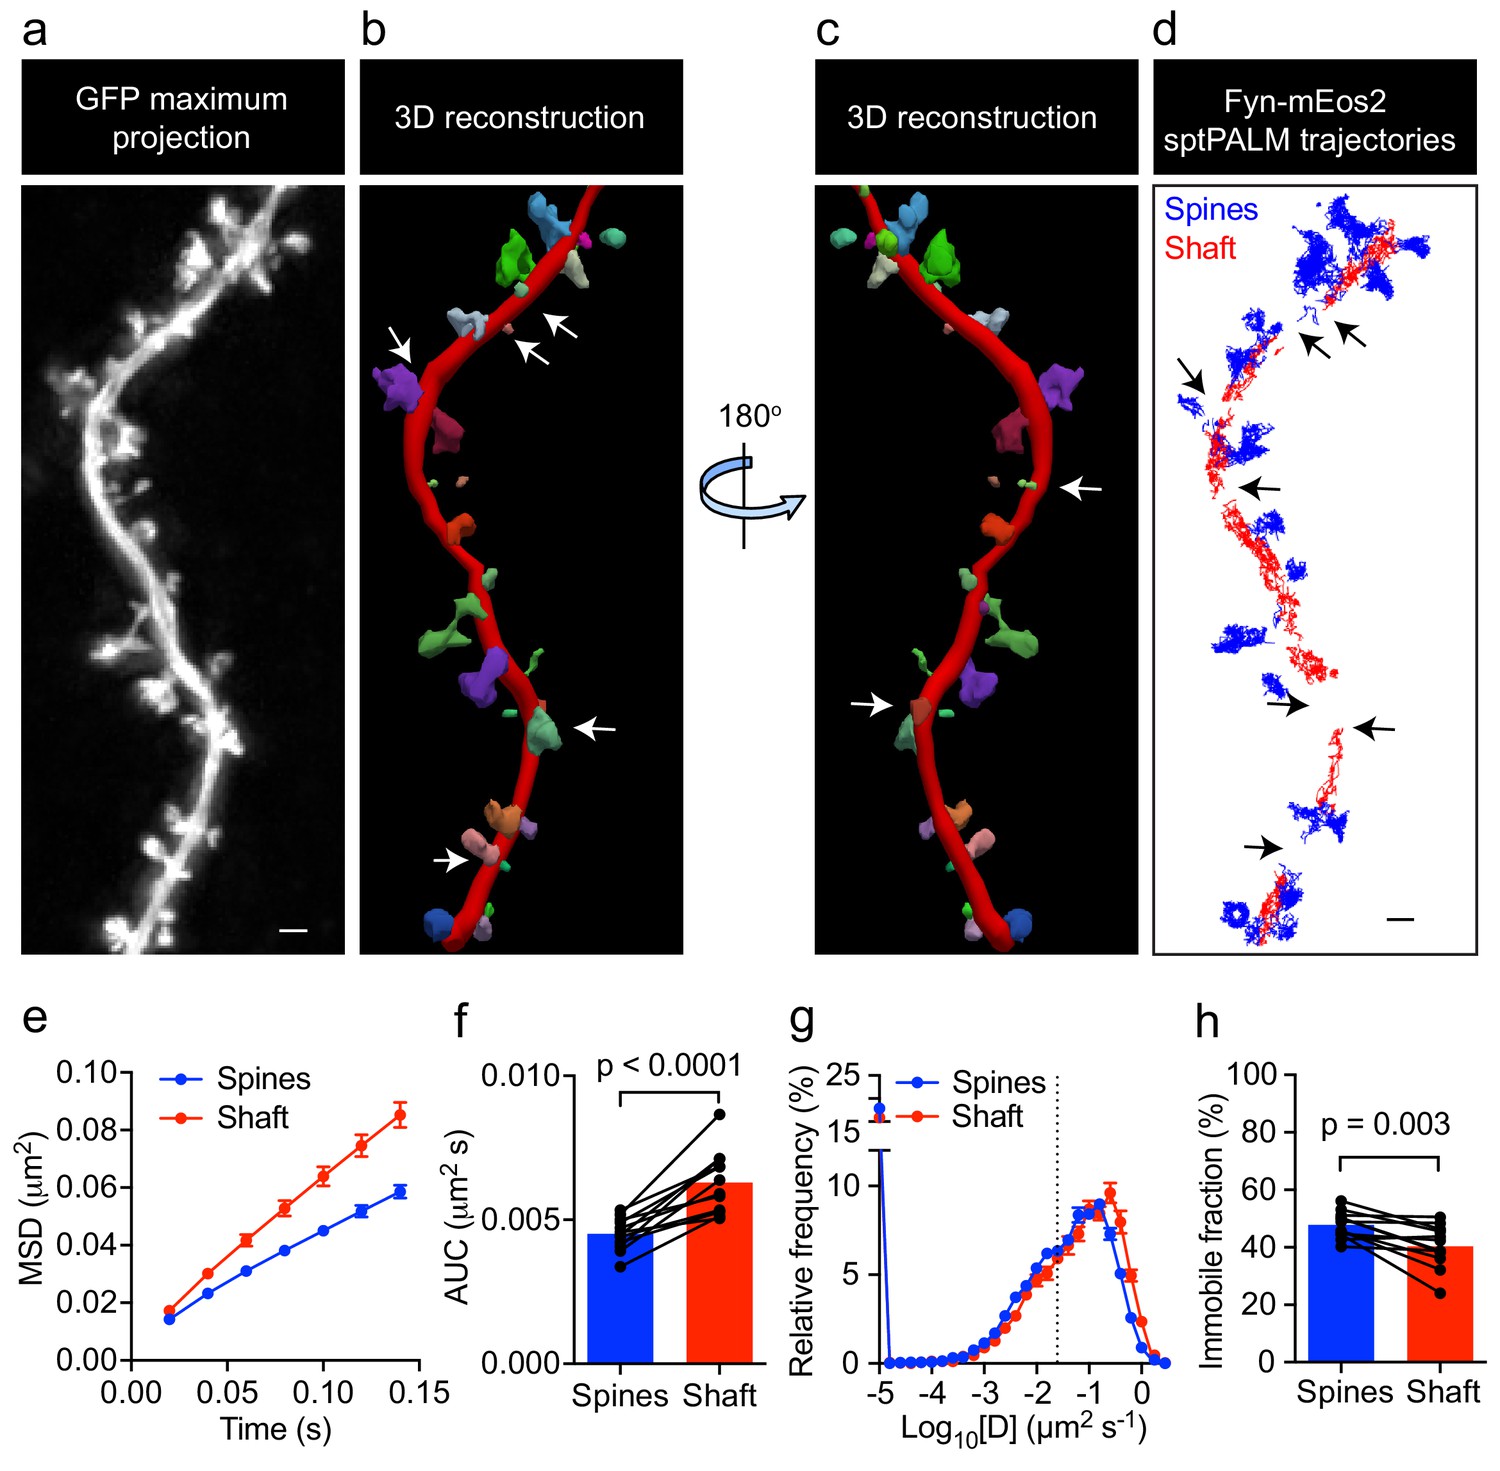
Fyn mobility is lower in spines than in shafts.
(a) An EGFP image stack of a representative hippocampal neuron co-expressing Fyn-mEos2 and EGFP is shown as a two-dimensional (2D) maximum intensity projection along the z-direction. (b) 3D reconstruction of the same neuron using Neurolucida. (c) The image shown in (b) rotated 180° along the y-axis. (d) Trajectories belonging to spines that were nearly parallel to the sptPALM imaging plane (blue) and the dendritic shaft region (red) of the same neuron shown in (a). Dendritic segments containing spines projecting away from the sptPALM imaging plane were discarded (white arrows in (b) and (c), and black arrows in (d)). (e–h) Comparison of Fyn mobility parameters in dendritic shafts and spines. (e) Average mean square displacement (MSD) as a function of time. (f) The corresponding area under the MSD curves (AUC). (g) The distribution of diffusion coefficients (D) shown in a semi-log plot. The threshold used to distinguish the immobile (Log10[D]≤−1.6) and mobile (Log10[D]>−1.6) fractions of molecules is indicated with a dashed line. (h) The corresponding immobile fractions. Error bars are SEM. Mean ± SEM values were obtained from n = 12 neurons. Statistical comparisons were performed using a paired Student’s t-test (f, h).
Figure 3
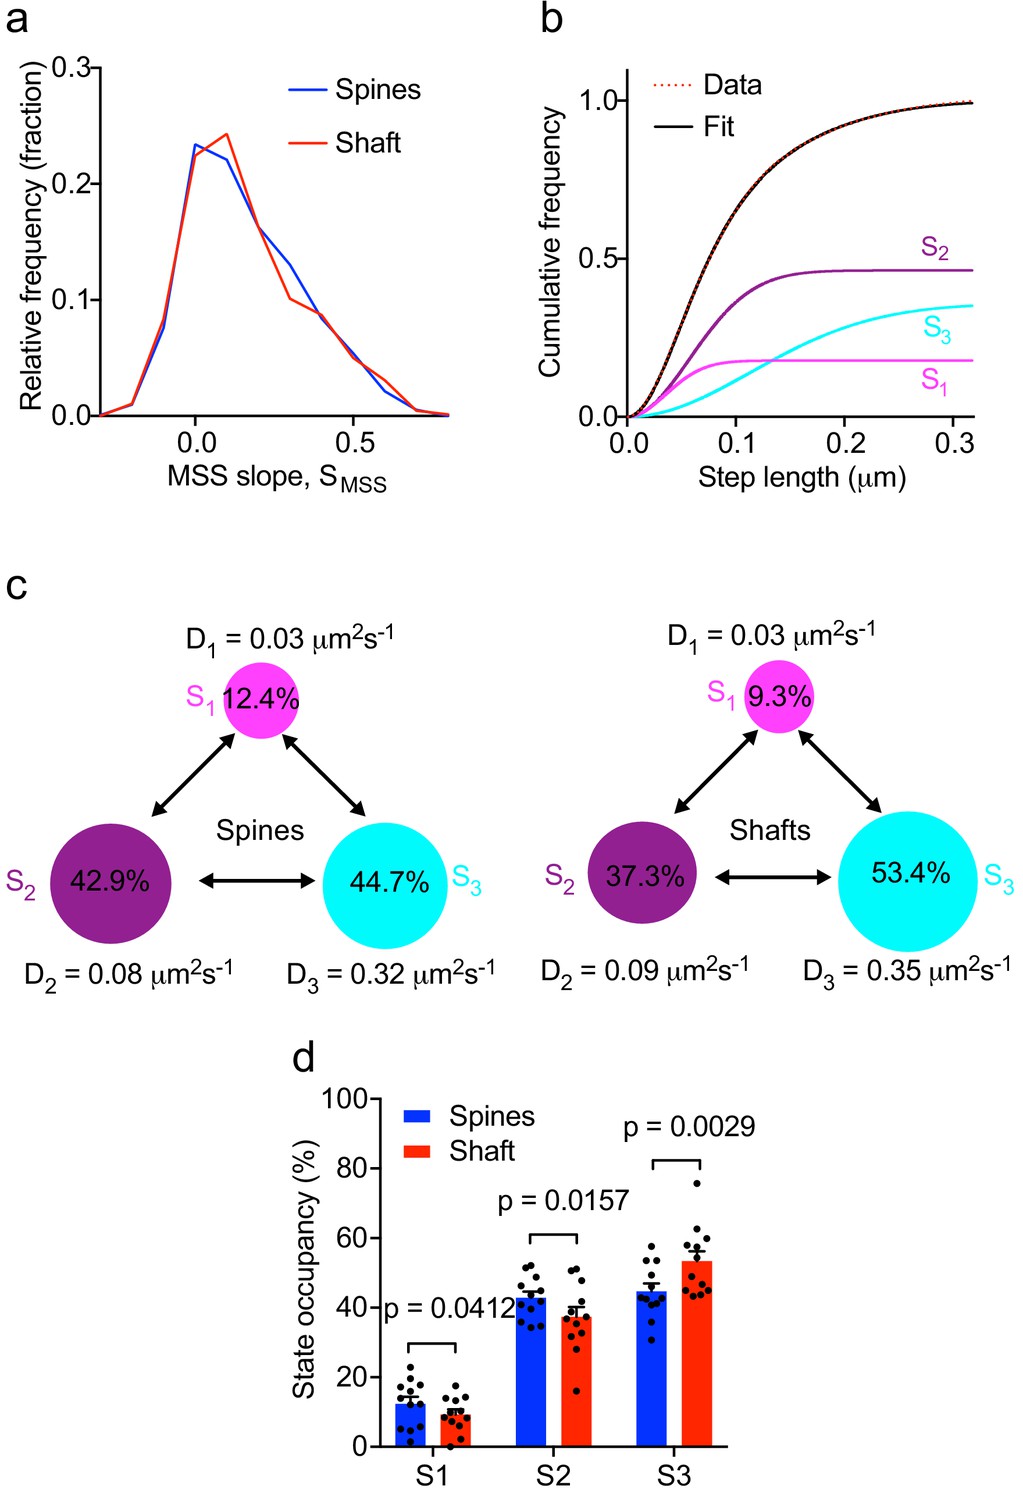
Multiple kinetic populations of Fyn in spines and shafts.
(a) Distribution of the slope of the moment scaling spectrum (SMSS) of trajectories lasting for at least 20 frames. (b) Representative fit (solid black line) of a three-diffusive-state model (Equation (1)) of the cumulative distribution of displacements at 20 ms intervals from Fyn-mEos2 molecules located inside the spines and shafts of neurons. The contribution of each diffusive state is shown individually. (c) A three-state model in which the estimated apparent diffusion coefficients and state occupancies are represented (state S1, immobile; state S2, confined; state S3, apparently free), with the circle area being proportional to the state occupancy. (d) Comparison of the estimated state occupancies of Fyn-mEos2 molecules in spines (blue) and shafts (red). Statistical comparisons were performed using paired Student’s t-tests .
Figure 4
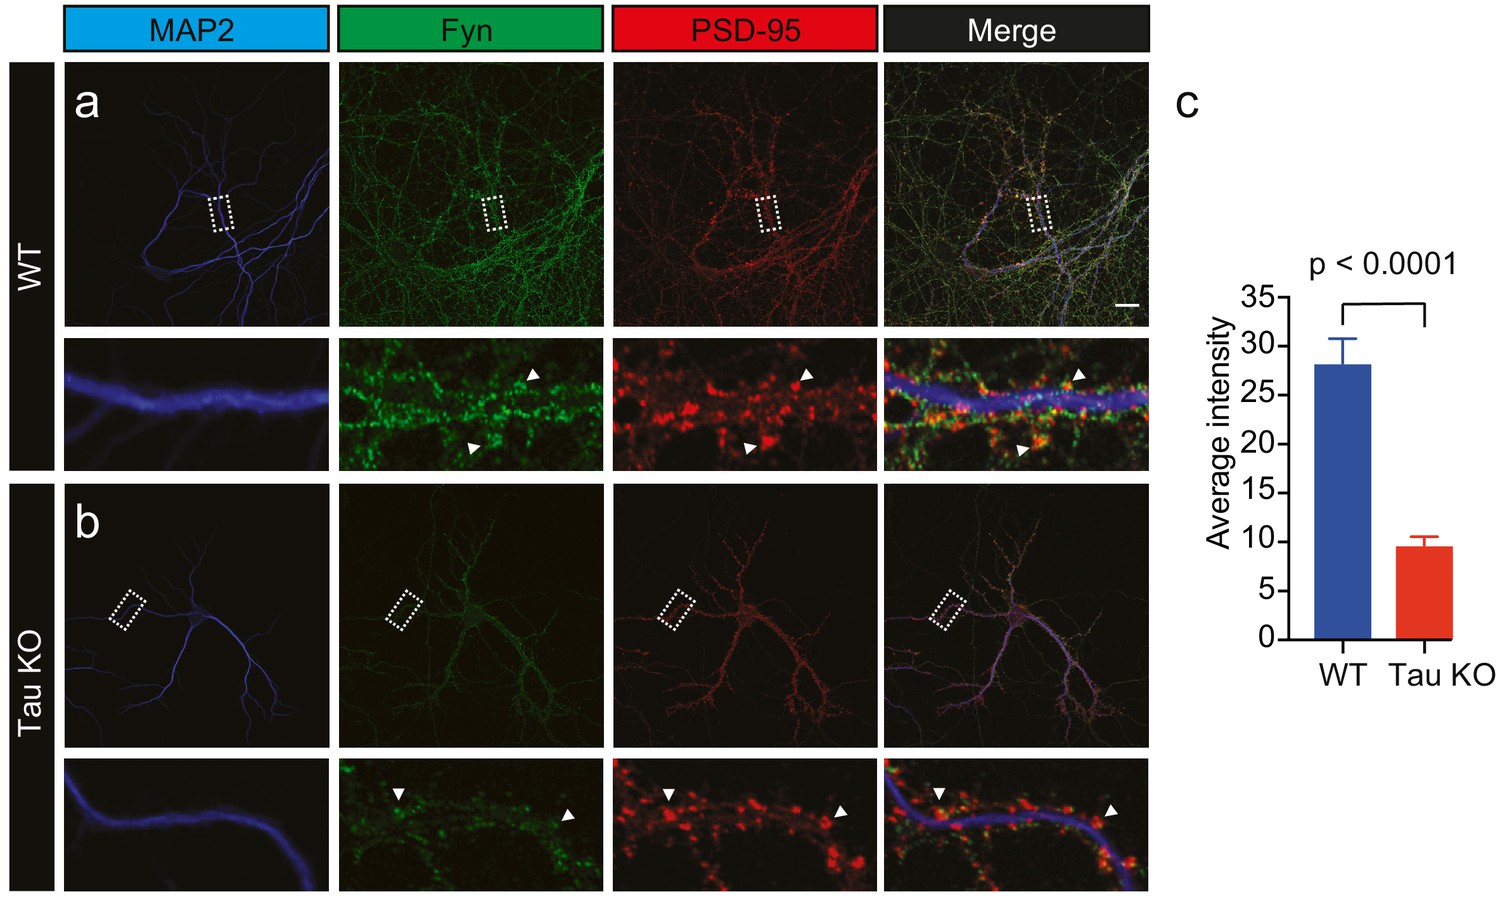
Loss of Tau reduces the localization of endogenous Fyn into the dendritic arbor.
Immunocytochemistry of Fyn to characterize the distribution of endogenous Fyn along the dendritic arbor in wildtype (WT) and Tau knock-out (KO) mouse hippocampal neurons. (a, b) Panels showing the distribution of Fyn (green) in WT neurons (a) and Tau KO neurons (b). MAP2 (blue) was used to identify dendrites and PSD-95 (red) was used to identify dendritic spines. (c) Quantification of the average intensity of Fyn immunofluorescence in dendrites from WT and Tau KO neurons. Mean ± SEM values are calculated from n = 13 neurons. A statistical comparison of the average intensities was performed using a Student’s t-test. Scale bars, 20 μm.
Figure 5 with 1 supplement
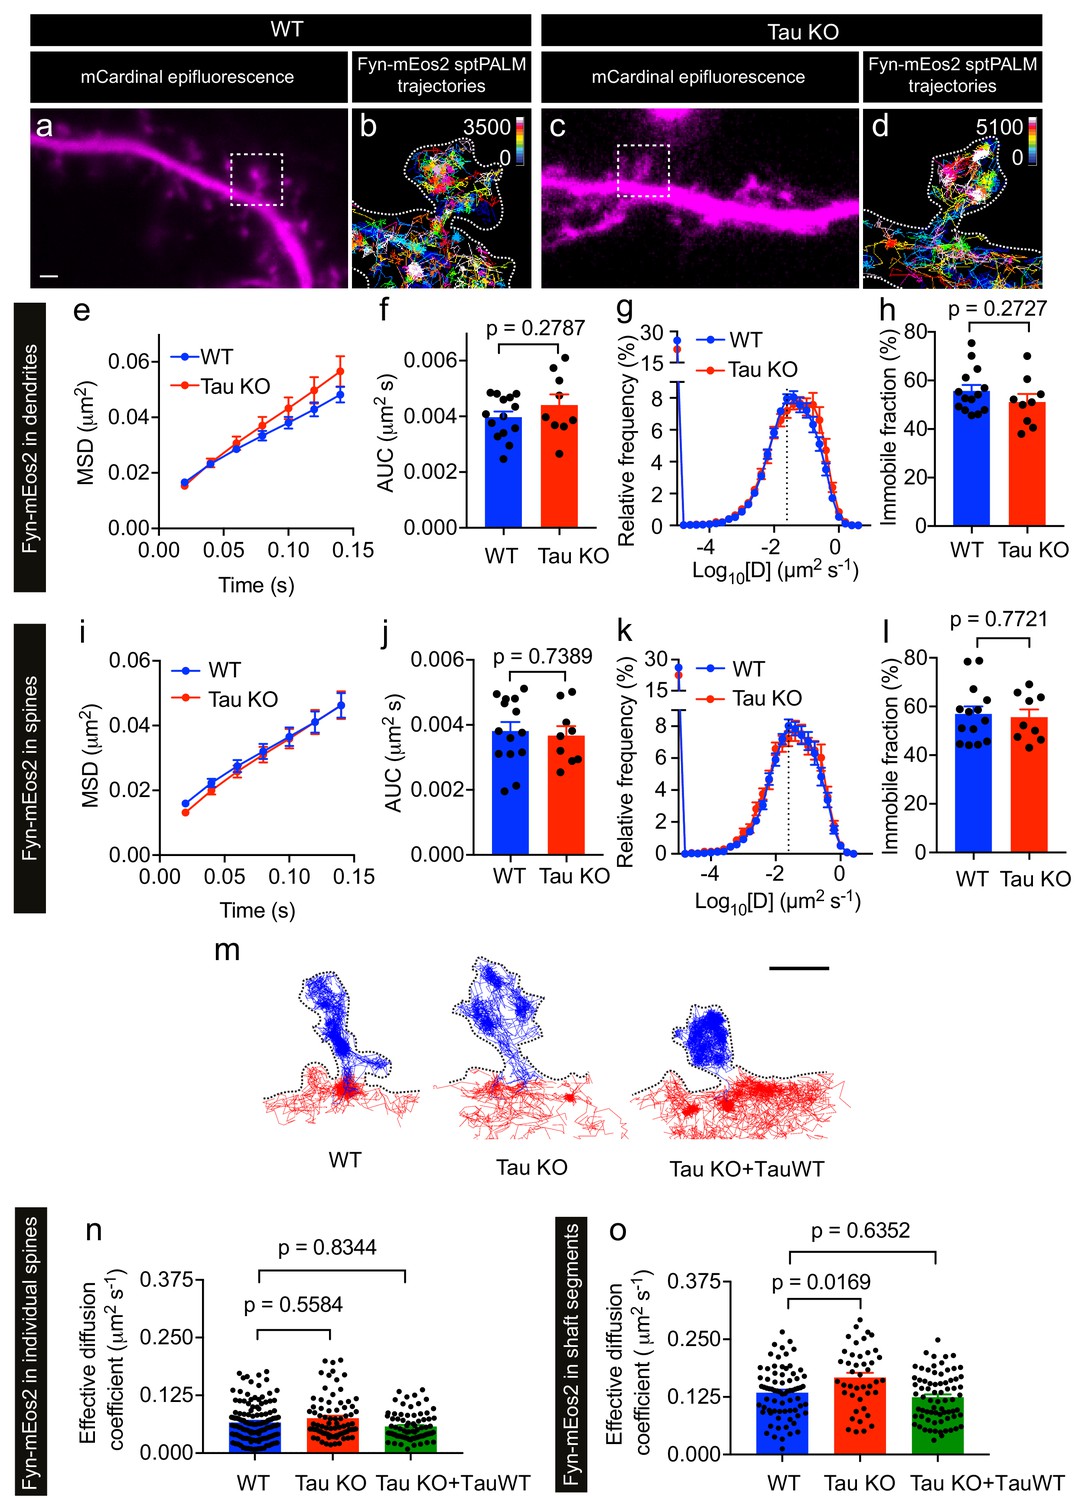
Loss of Tau alters Fyn mobility in the dendritic shafts but not in the spines.
(a–d) Representative epifluorescence images of WT (a) and Tau KO (c) neurons co-expressing mCardinal and Fyn-mEos2. sptPALM trajectory maps of Fyn-mEos2 molecules in WT (b) and Tau KO (d) neurons. Regions marked in (a) and (c) are shown at higher magnification in (b) and (d), respectively. Scale bar, 1 μm. (e–l) Comparison of Fyn mobility in dendrites (e–h) and in spines (i–l) of WT (blue) or Tau KO (red) neurons. Mean ± SEM values were obtained from n = 14 WT neurons and n = 9 Tau KO neurons. (e, i) The average mean square displacement (MSD) as a function of time. (f, j) The corresponding area under the MSD curves (AUC). (g, k) The distribution of diffusion coefficients (D) shown in a semi-log plot. The dashed line distinguishes the immobile and mobile fractions. (h, l) The corresponding immobile fraction. (m) Examples of trajectories of Fyn-mEos2 molecules in an individual spine (blue) and the immediately adjacent shaft region (red) of WT (left), Tau KO (middle) and Tau KO expressing TauWT-GFP neurons. Scale bar, 1 μm. (n) Effective diffusion coefficients (Deff) of the trajectories belonging to individual spines of WT, Tau KO and Tau KO + TauWT neurons. (o) Deff of the trajectories belonging to individual shaft regions of WT, Tau KO and Tau KO + TauWT neurons. In (n) and (o), spines or shaft segments that contained at least 50 trajectories were used to compute Deff. Statistical comparisons were performed using Student’s t-test (f, h, j, l) or Kruskal-Wallis test with Dunn’s post hoc multiple comparisons test (n, o) . The adjusted p-values accounting for multiple comparisons are reported in (n) and (o).
Figure 5—figure supplement 1
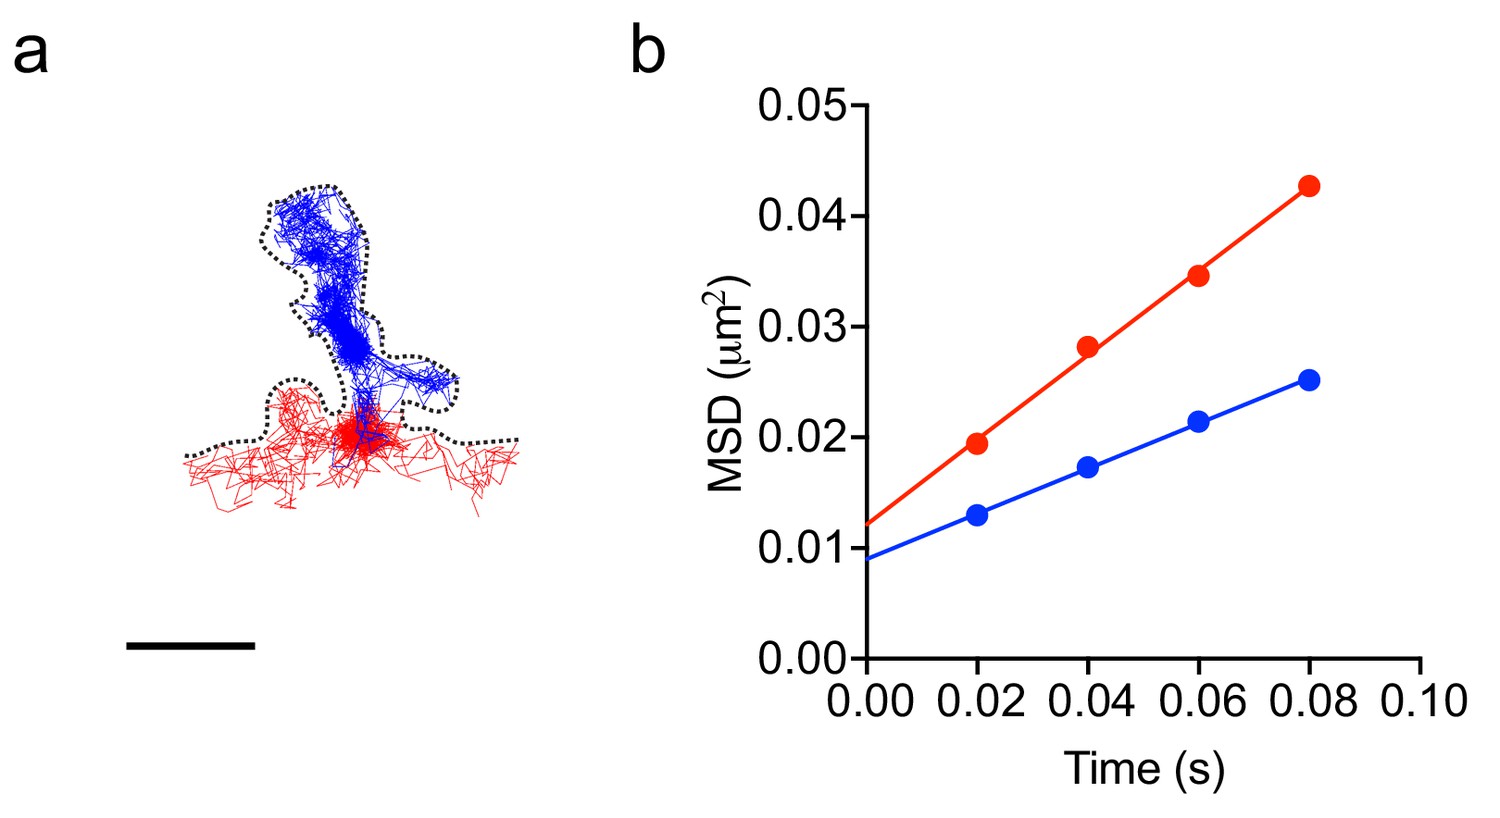
Estimation of the effective diffusion coefficient of Fyn trajectories in dendritic spines and shaft segments.
(a) An example of trajectories of Fyn-mEos2 molecules in an individual spine (blue) and immediately adjacent shaft segment (red) of a WT neuron (same as in Figure 5m). Scale bar, 1 μm. (b) The first four points of the average MSD of trajectories from the spine (blue circles) and shaft segment (red circles) were fitted by the equation MSD(t)=a + 4 Defft, where Deff is the effective diffusion coefficient, a is the y-intercept and t is the time.
Figure 6
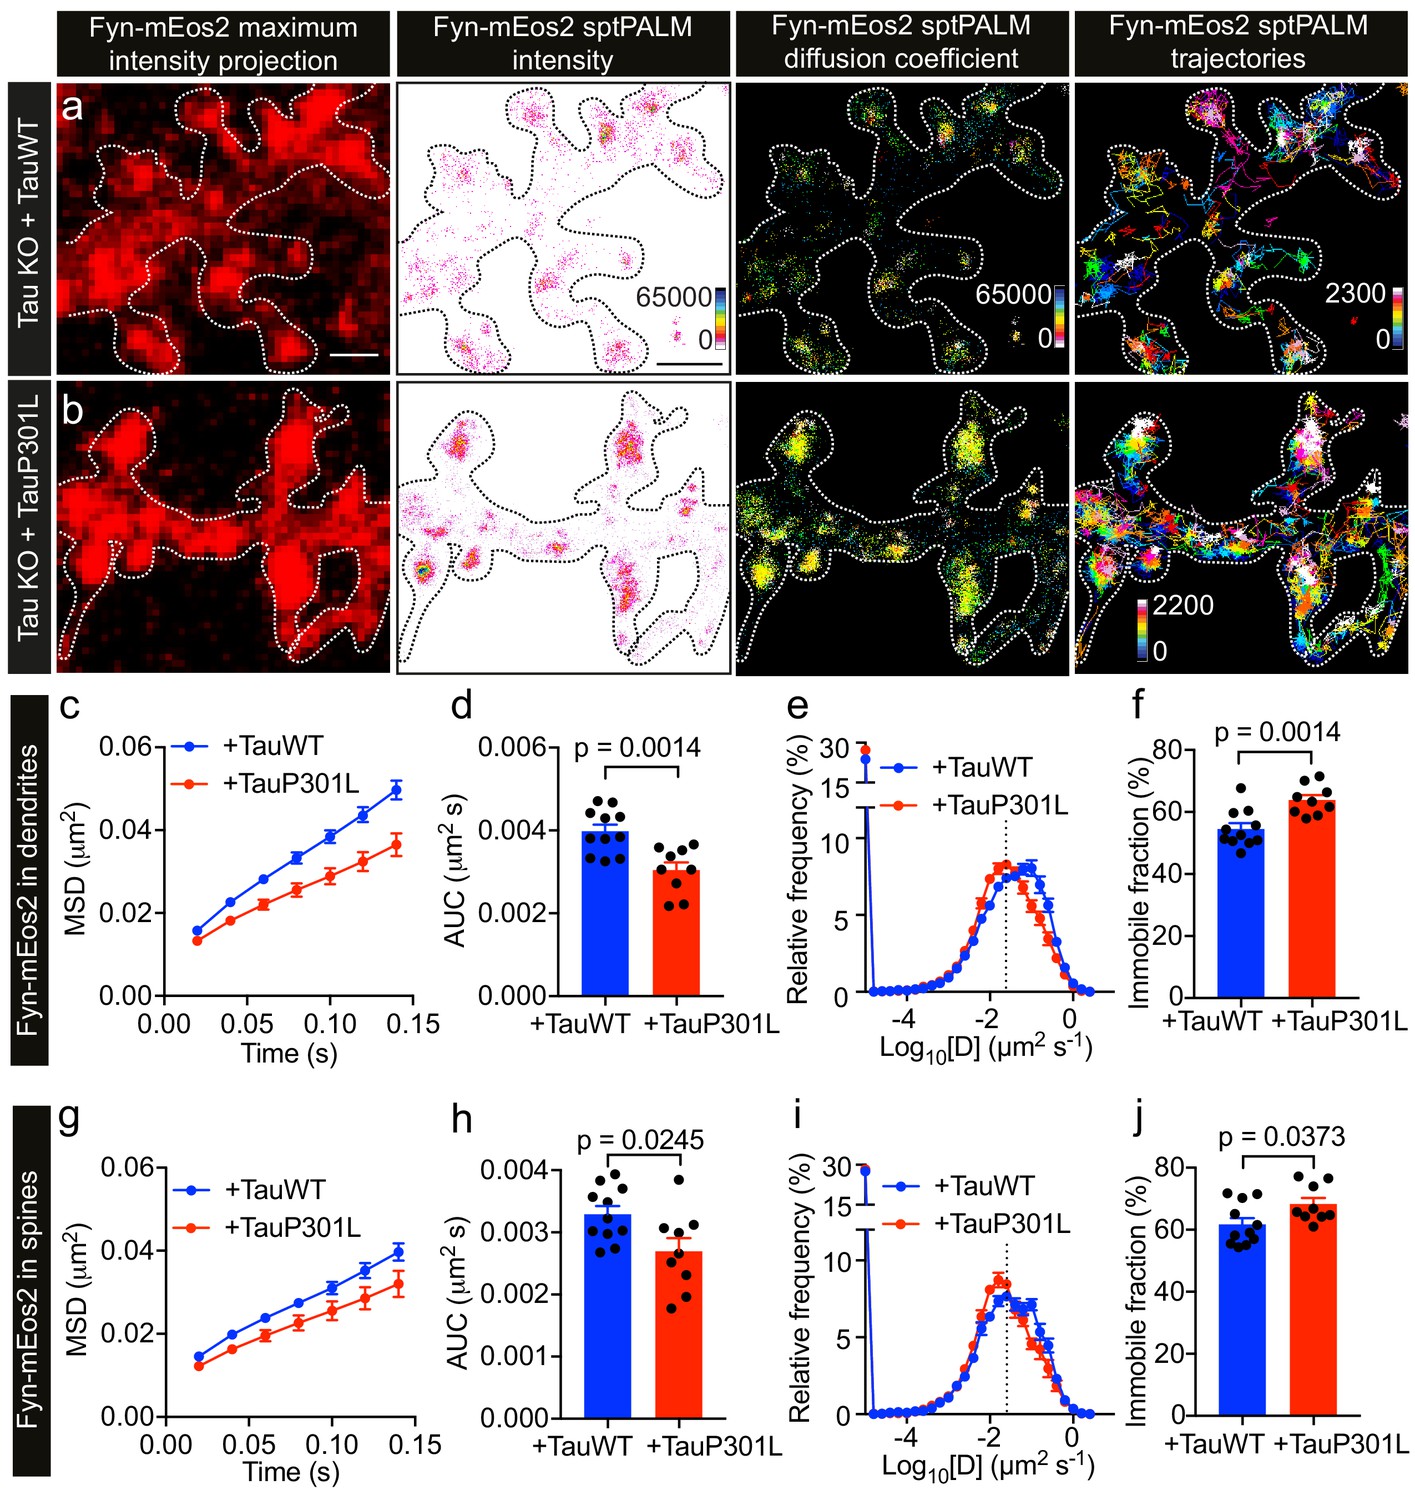
P301L mutant Tau lowers Fyn mobility in dendrites.
(a, b) Representative low-resolution and super-resolution images of Tau KO neurons expressing mCardinal, Fyn-mEos2 and TauWT-GFP or TauP301L-GFP, obtained using sptPALM. sptPALM imaging was performed at 50 Hz for 320 s (16,000 frames) to construct the maps of localization intensities, diffusion coefficients, and trajectories of Fyn-mEos2 molecules. The cooler colors represent higher localization intensities and larger diffusion coefficients, and each trajectory is coded with a different color. (c–j) Comparison of Fyn mobility in the dendrites (c–f) and spines (g–j) of Tau KO neurons expressing TauWT-GFP (blue) or TauP301L-GFP. (c, g) The average mean square displacement (MSD) as a function of time. (d, h) The corresponding area under the MSD curves (AUC). (e, i) The distribution of diffusion coefficients (D) shown in a semi-log plot. The threshold used to distinguish the immobile (Log10[D] ≤ −1.6) and mobile (Log10[D] > −1.6) fractions of molecules is indicated with a dashed line. (f, j) The corresponding immobile fraction. Mean ± SEM values were obtained from n = 11 Tau KO neurons expressing TauWT-GFP and n = 9 Tau KO neurons expressing TauP301L-GFP. Statistical comparisons were performed using Student’s t-tests (d, f, h, and j).
Figure 7
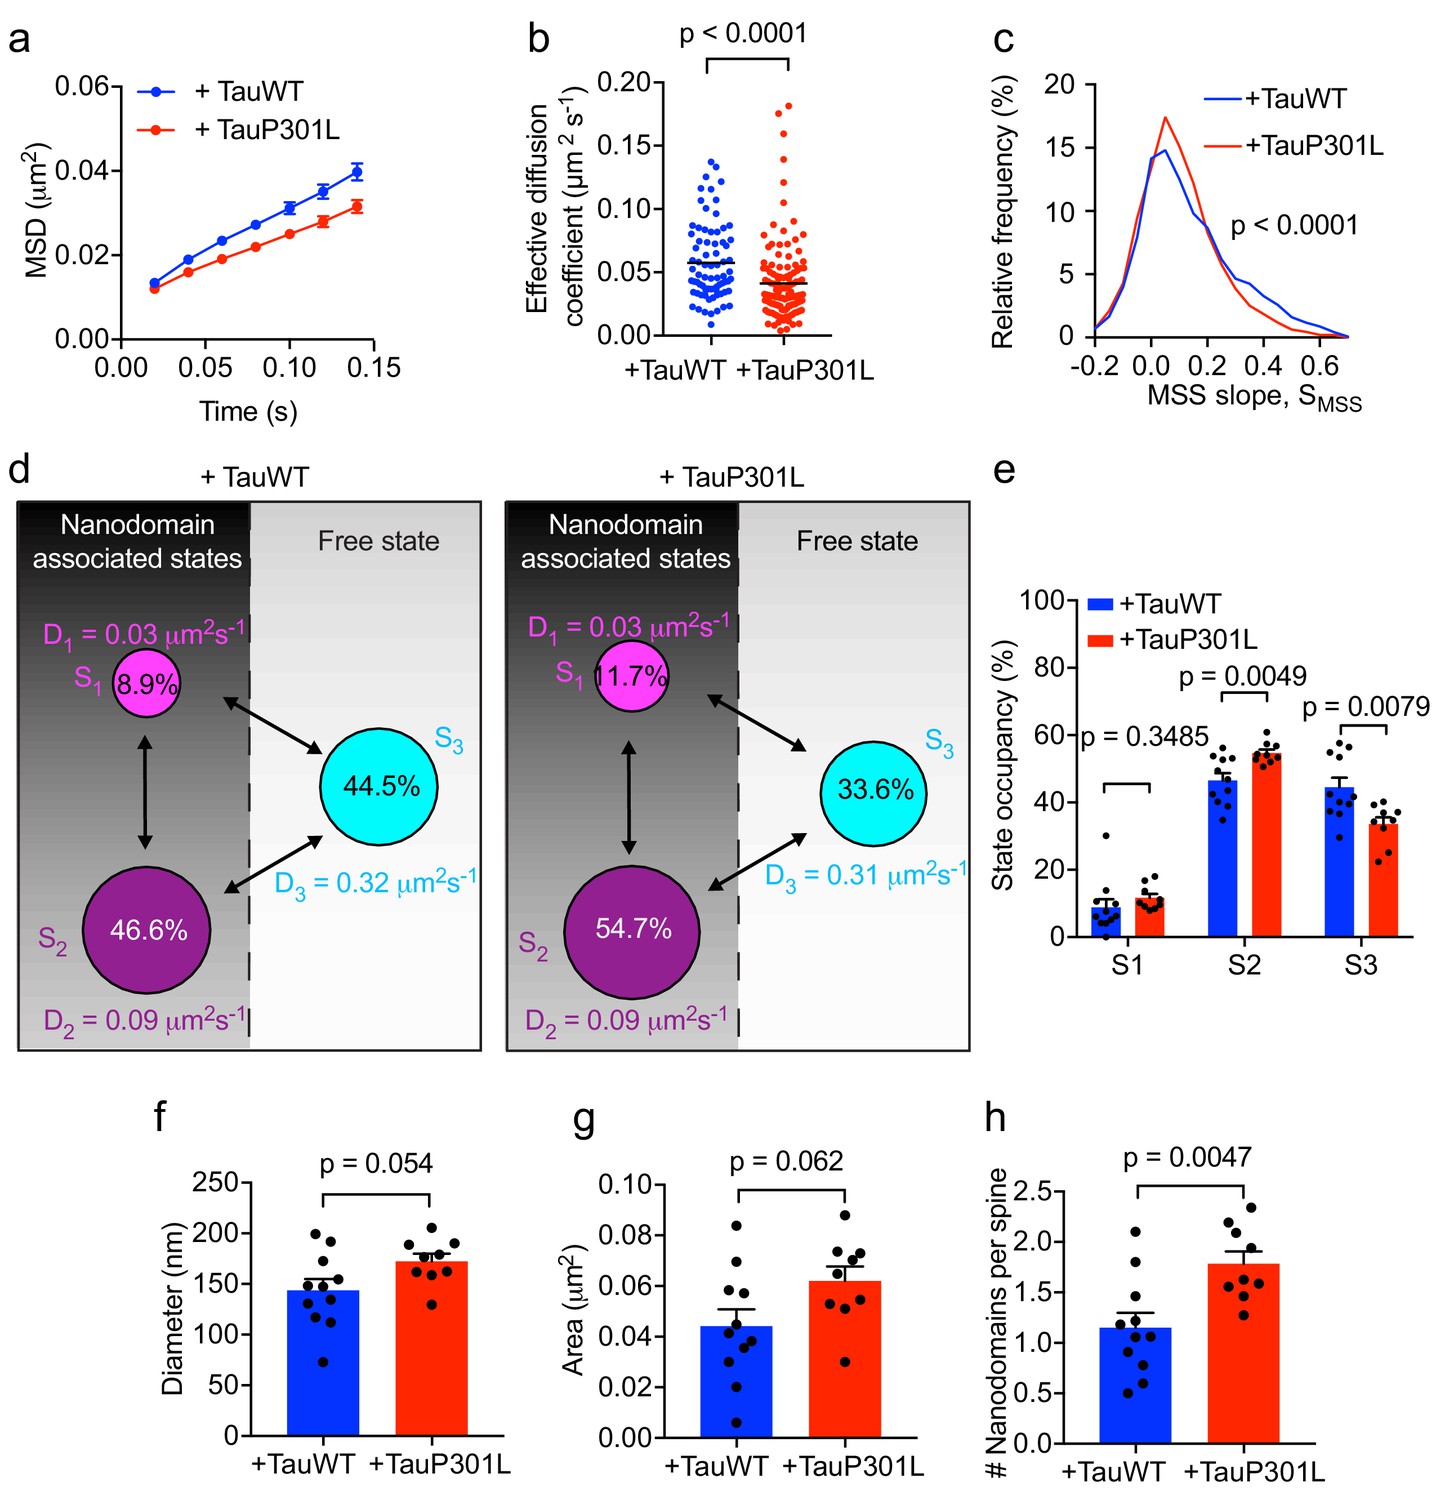
Expression of mutant Tau-P301L traps Fyn in spines.
(a) The average mean square displacement (MSD) of Fyn-mEos2 trajectories from individual spines of Tau KO neurons expressing TauWT-GFP (n = 76 spines) or TauP301L-GFP (n = 124 spines). (b) The effective diffusion coefficient computed from the MSD of individual spines. (c) Distribution of the moment scaling spectrum slope (SMSS) of trajectories lasting for at least 20 frames (n = 2282 trajectories from the spines of 11 Tau KO neurons expressing TauWT-GFP and n = 3764 trajectories from the spines of 9 Tau KO neurons expressing TauP301L-GFP). (d) A three-state model showing the inferred apparent diffusion coefficients and state occupancies (state S1, immobile; state S2, confined; state S3, apparently free), with the circle area being proportional to the state occupancy. (e) Comparison of the estimated state occupancies. (f, g) Comparison of average nanodomain diameter (f) and area (g). (h) Comparison of the number of nanodomains per spine. Statistical comparisons were performed using the Kruskal-Wallis test (b), the Kolmogorov-Smirnov test (c) or Student’s t-test (e–h).
Figure 8

Tau lacking the microtubule-binding domain (ΔTau) mislocalizes to dendritic spines but does not affect Fyn mobility in dendrites and spines.
(a) Representative epifluorescence images of Tau KO neurons co-expressing either full-length Tau (TauWT-GFP) and mCardinal or Tau lacking the microtubule-binding domain (ΔTau-GFP) and mCardinal. Arrows denote reduced localization of TauWT-GFP in dendritic spines and arrowheads denote increased mislocalization of ΔTau-GFP in dendritic spines. Scale bar, 1 μm. (b–i) Comparison of Fyn mobility in the dendrites (b–e) and spines (f–i) of Tau KO neurons expressing Fyn-mEos2, TauWT-GFP and GFP (blue) and Tau KO neurons expressing Fyn-mEos2, ΔTau-GFP and GFP. (b, f) The average mean square displacement (MSD) as a function of time. (c, g) The corresponding area under the MSD curves (AUC). (d, h) The distribution of diffusion coefficients (D) shown in a semi-log plot. (e i,) The corresponding immobile fraction. (j) The average mean square displacement (MSD) of Fyn- mEos2 trajectories from individual spines of Tau KO neurons expressing TauWT-GFP (n = 99 spines) or ΔTau-GFP (n = 181 spines). (k) The effective diffusion coefficient computed from the MSD of individual spines. (l) The distribution of the moment scaling spectrum slope (SMSS) of trajectories lasting for at least 20 frames (n = 2561 trajectories from the spines of 8 Tau KO neurons expressing TauWT-GFP and n = 4943 trajectories from the spines of 11 Tau KO neurons expressing ΔTau-GFP). (m) The comparison of the state occupancies estimated using a three-state model. In (b–i) and (m), mean ± SEM values were obtained from n = 8 Tau KO neurons expressing Fyn-mEos2, TauWT-GFP and GFP and n = 11 Tau KO neurons expressing Fyn- mEos2, ΔTau-GFP and GFP. Statistical comparisons were performed using the Mann-Whitney U test (c, e and k), Student’s t-test with Welch’s correction (g, i), the Kolmogorov-Smirnov test (l) and Student’s t-test (m).
Tables
Key resources table
| Reagent type (species) or resource | Designation | Source or reference | Identifiers | Additional information |
|---|---|---|---|---|
| Strain, strain background (M. musculus) | C57B1/6 | Jackson Laboratory | Cat. #000664 | NA |
| Genetic reagent (M. musculus) | Tau KO (Mapt–/–) | Jackson Laboratory (Dawson et al., 2001) | Cat. #007251 | Prof. Michael Vitek (Duke University Medical Center) |
| Antibody | Rabbit anti-Fyn | Cell Signalling Technologies | Cat. #4023 | IF (1:500) |
| Antibody | Mouse anti-PSD-95 | Merck Millipore | Cat. #MABN68 | IF (1:500) |
| Antibody | Chicken anti MAP2 | Merck Millipore | Cat. #AB15452 | IF (1:500) |
| Recombinant DNA reagent | mCardinal-N1 | Addgene | Cat. #54590 | |
| Recombinant DNA reagent | pEGFP-N1 | Clontech/NovoPro | Cat. #V12021 | |
| Recombinant DNA reagent | Fyn-mEos2 | This paper | ||
| Recombinant DNA reagent | Tau-GFP | PMID: 27378256 | Prof. Jürgen Götz (Queensland Brain Institute, University of Queensland) | |
| Recombinant DNA reagent | Tau-P301L-GFP | PMID: 27378256 | Prof. Jürgen Götz (Queensland Brain Institute, University of Queensland) | |
| Recombinant DNA reagent | ΔTau-GFP | Cummins et al., 2019 | Prof. Jürgen Götz (Queensland Brain Institute, University of Queensland) | |
| Chemical compound, drug | Phalloidin-Alexa Fluor 647 | NEB | Cat. #8940S | IF (1:100) |
| Software, algorithm | Fiji-ImageJ | ImageJ (http://imagej.nih.gov/ij/) | RRID:SCR_003070 | Version 2.0.0-rc-68/1.52e |
| Software, algorithm | Neurolucida | MBF Bioscience | RRID:SCR_001775 | |
| Software, algorithm | Huygens software | Scientific Volume Imaging | RRID:SCR_014237 | |
| Software, algorithm | Metamorph software | Molecular Devices (https://www.moleculardevices.com) | RRID:SCR_002368 | Version 7.7.8 |
| Software, algorithm | PALMTracer | http://www.iins.u-bordeaux.fr/team-sibarita-PALMTracer | ||
| Software, algorithm | SR-Tesseler | Levet et al., 2015 (http://www.iins.u-bordeaux.fr/team-sibarita-SR-Tesseler) | ||
| Software, algorithm | SharpViSu | Andronov et al., 2016 (https://github.com/andronovl/SharpViSu) | ||
| Software, algorithm | DC-MSS | Vega et al., 2018 (https://github.com/kjaqaman/DC-MSS) | ||
| Software, algorithm | Graphpad Prism | GraphPad Prism (https://graphpad.com) | RRID:SCR_015807 | Version 7.0d |
Additional files
-
Supplementary file 1
Summary of statistical analyses.
- https://doi.org/10.7554/eLife.45040.014
-
Transparent reporting form
- https://doi.org/10.7554/eLife.45040.015
Download links
A two-part list of links to download the article, or parts of the article, in various formats.
Downloads (link to download the article as PDF)
Open citations (links to open the citations from this article in various online reference manager services)
Cite this article (links to download the citations from this article in formats compatible with various reference manager tools)
Frontotemporal dementia mutant Tau promotes aberrant Fyn nanoclustering in hippocampal dendritic spines
eLife 8:e45040.
https://doi.org/10.7554/eLife.45040


