Global donor and acceptor splicing site kinetics in human cells
- Technical University of Munich, Germany
- Max-Planck-Institute for Biophysical Chemistry, Germany
Figures
Figure 1 with 1 supplement
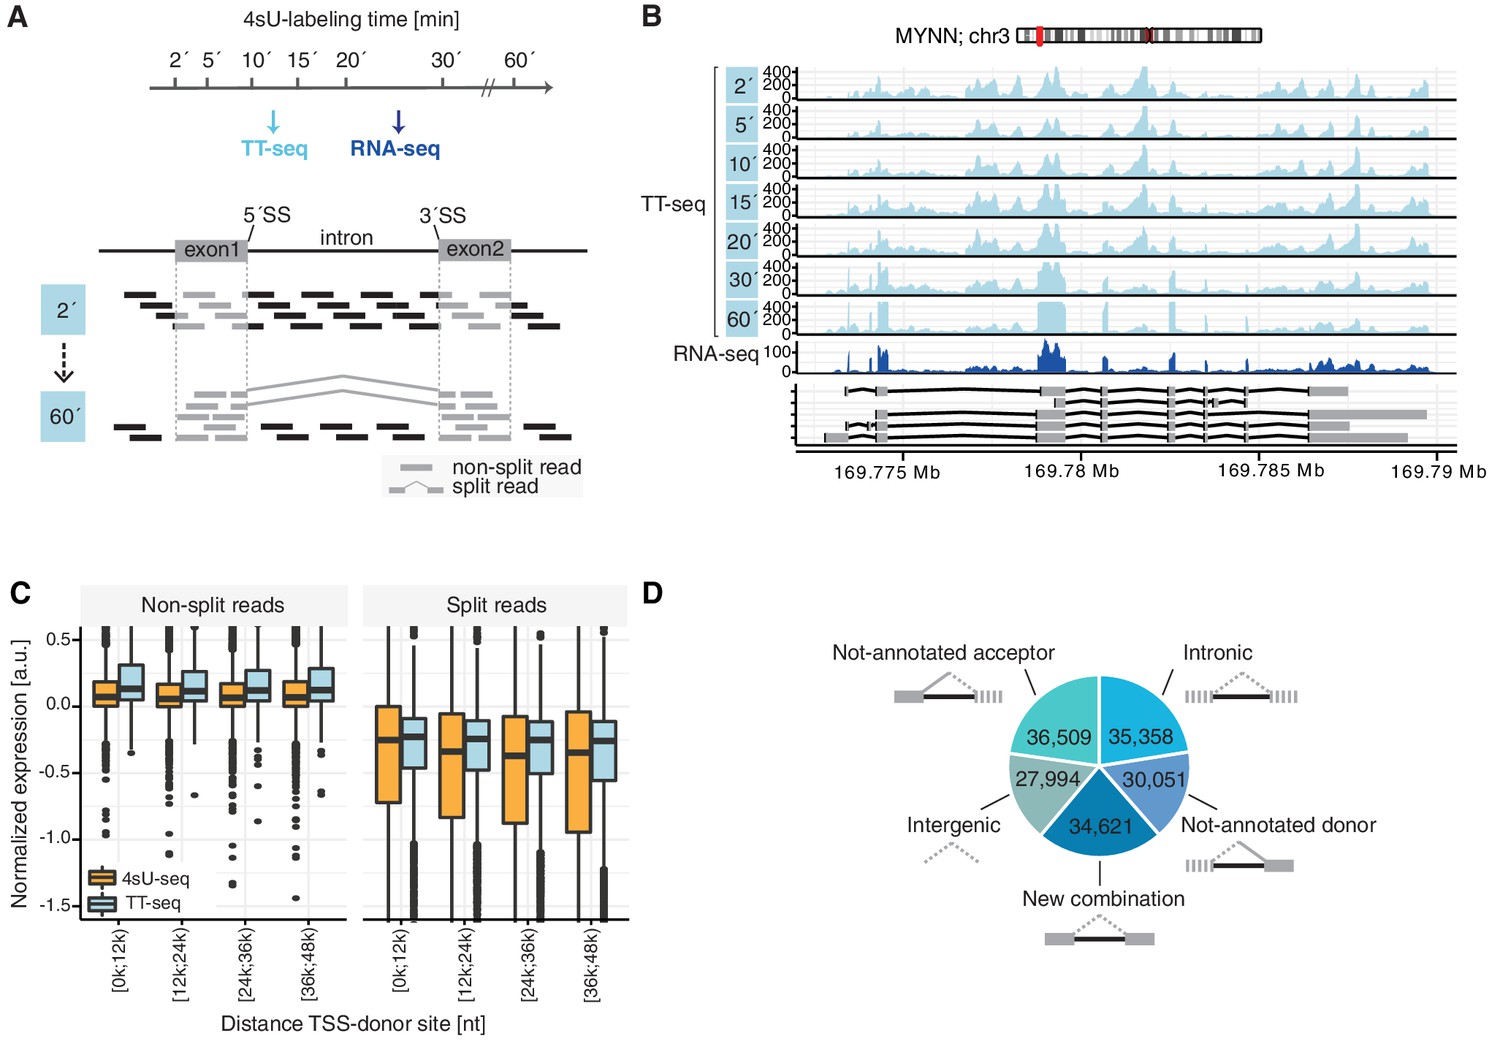
TT-seq monitors human RNA splicing.
(A) Experimental design. TT-seq and RNA-seq were performed after 2, 5, 10, 15, 20, 30 and 60 min of 4sU-labeling in human K562 cells. The number of reads spanning exon-intron/intron-exon splice-sites (non-split reads) gradually decrease with longer labeling duration, while exonic reads and reads spanning exon-exon junctions (split reads) increase during the time course, converging to levels similar to RNA-seq. (B) Coverage track of MYNN gene for 2, 5, 10, 15, 20, 30 and 60 min of 4sU-labeling followed by TT-seq and 2 min of 4sU-labeling followed by total RNA-seq. (C) Distribution of non-split reads (left) and split-reads (right) in previously published 4sU-seq (orange) and TT-seq (blue) (Schwalb et al., 2016) split by quartiles of the transcription start site to donor splice-site distance. Black bars represent the median values for each group. Lower and upper boxes are the first and third quartile, respectively. (D) Fractions of novel splicing events detected in intragenic and intergenic genomic regions. Solid boxes represent known exons, dashed boxes represent novel exons. (D based on Supplementary file 1).
Figure 1—figure supplement 1

TT-seq is highly reproducible and captures newly synthesized RNAs.
(A) Gene coverage in second against first biological replicates for 5 min and 60 min samples in TT-seq and RNA-seq experiments, with the corresponding Spearman correlation. (B) Coverage track of the MYNN gene for 2, 5, 10, 15, 20, 30, 60 min of 4sU-labeling followed by total RNA-seq. (C) Distribution of split and non-split reads in TT-seq and matching RNA-seq samples for each time point. Replicates were pooled together.
Figure 2 with 1 supplement
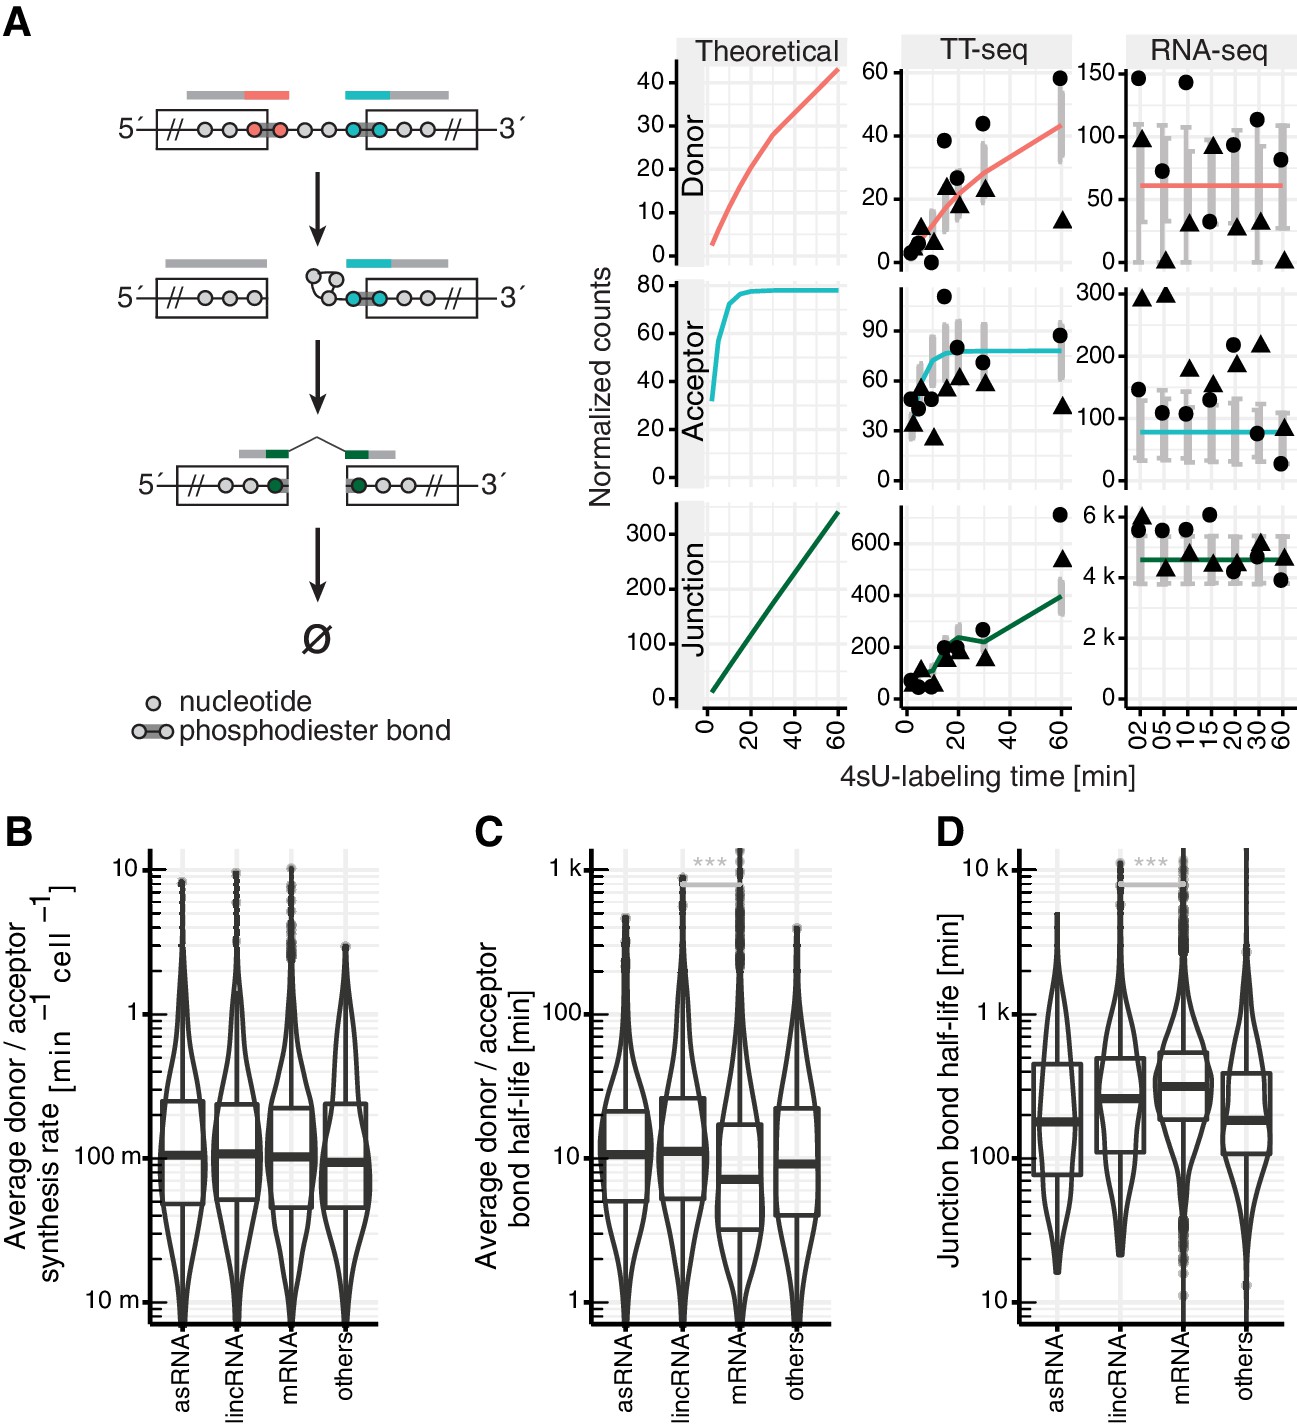
Estimation of RNA metabolic rates at individual phosphodiester bonds.
(A) Definition of kinetic parameters at the level of individual phosphodiester bonds enables independent estimation of the rates of donor (red) and acceptor (blue) bond half-life and of junction (product, green) formation (left). Reads covering the introns were extracted and divided into three classes: reads starting at the upstream exon and extending into the intron (red), reads starting within the intron and extending to the downstream exon (blue) and reads mapped to the upstream and downstream exon but gaping the intron (green). Theoretical analytical curves as well as the curves corrected for cross-contamination for TT-seq and RNA-seq are shown. Sequencing depth-normalized counts are provided for both replicates (circle, triangle). Estimated standard errors are depicted in grey. A dip in expectation value of the junction count was observed at 30 min 4sU-labeling time due to variation of cross-contamination across samples (unlabeled RNA in TT-seq samples), (right). (B–D) Violin plots representing the distribution of synthesis rate (B), average donor and acceptor bond half-life (C) and junction bond half-life (D) for mRNAs (n = 8,770), lincRNAs (n = 204), antisense RNAs (asRNA, n = 162) and other ncRNAs (n = 290). Black bars represent the median values for each group. Lower and upper boxes are the first and third quartile, respectively. (B–D based on Supplementary file 3).
Figure 2—figure supplement 1
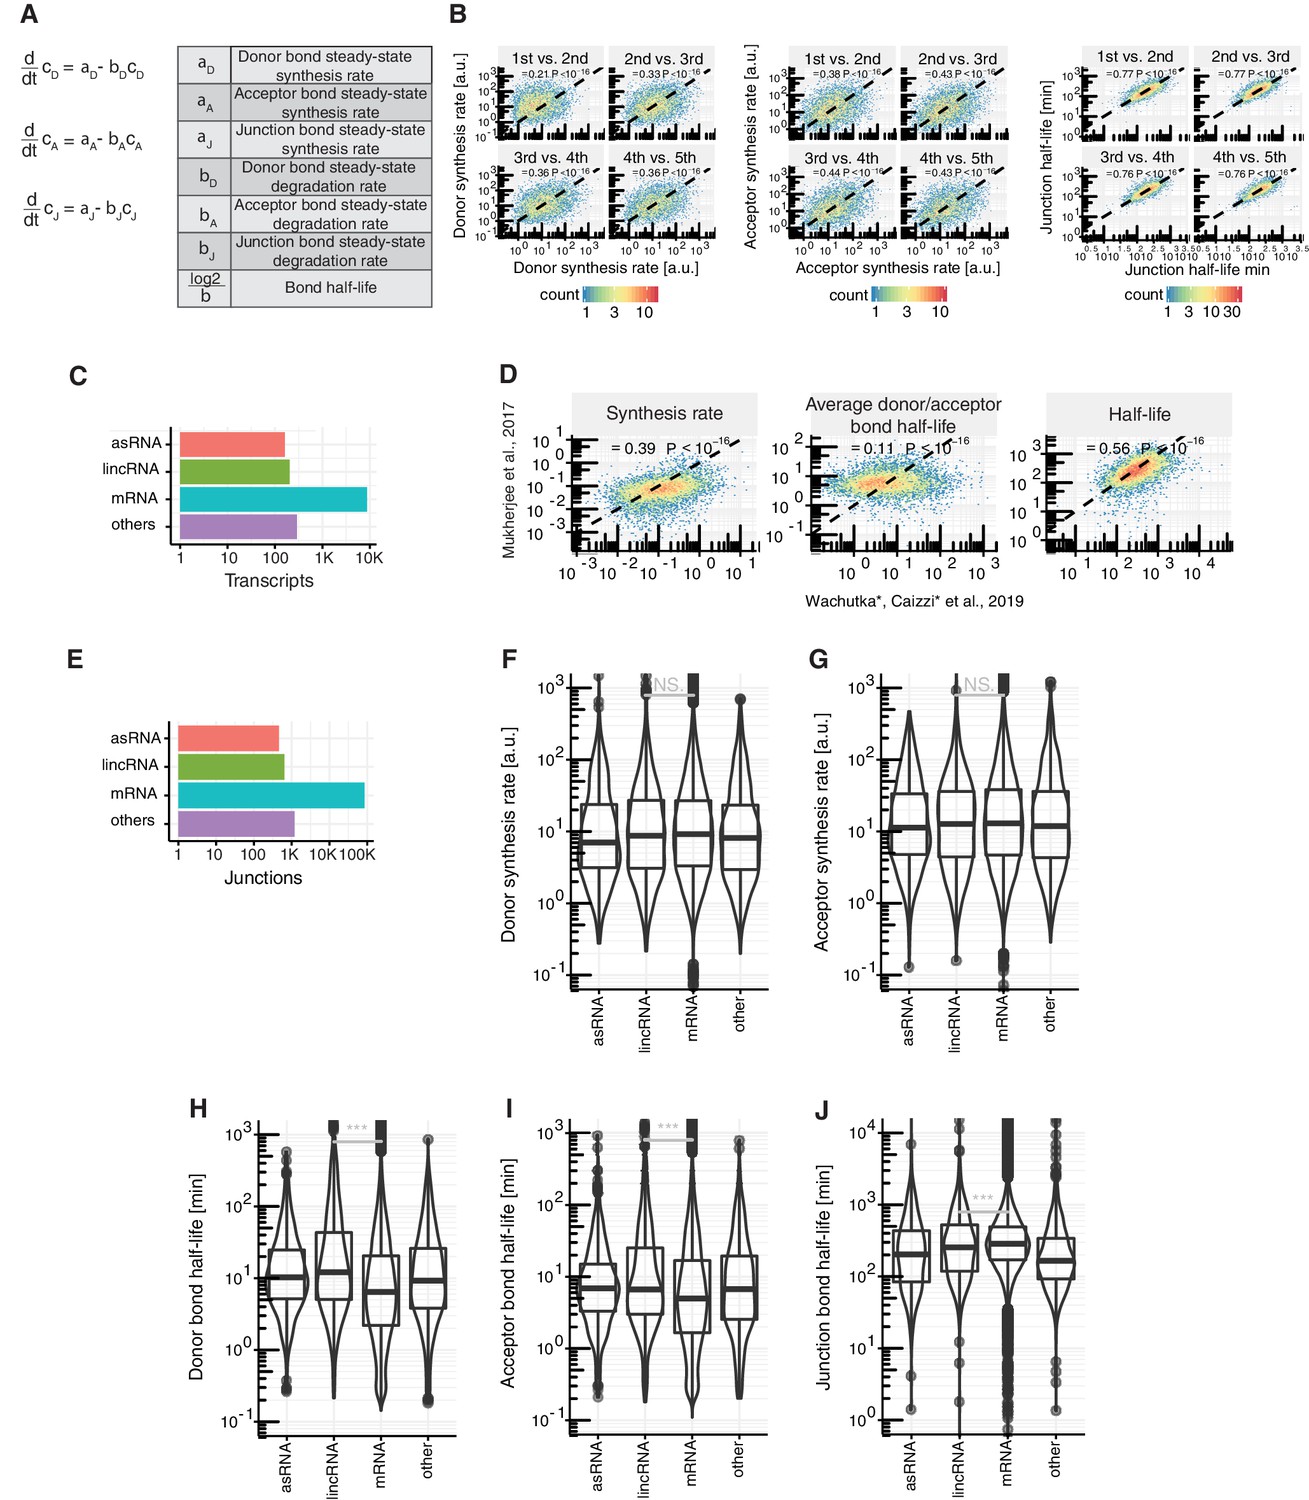
Details on kinetic modeling of RNA metabolic rates.
(A) Relevant parameters and their relation for modeling and estimation of rates, where is the concentration of the donor, acceptor or junction bond. (B) Comparison of estimated donor synthesis rates (left), acceptor synthesis rates (middle) and junction half-life (right) of 1st against 2nd, 2nd against 3rd, 3rd against 4th and 4th against 5th introns in major isoforms, with the corresponding Spearman correlation. (C) Number of antisense RNAs (asRNA, n=162), lincRNAs (n=204), mRNAs (n=8,770) and other ncRNAs (n=290) with respect to the GENCODE annotation for which kinetic rates were estimated. (D) Major-isoform aggregated synthesis, splicing and degradation rates estimated by Mukherjee et al. (2017) against this study, with corresponding Spearman correlation and P-value. (E) Number of junctions belonging to antisense RNAs (asRNA, n= 462), lincRNAs (n=644), mRNAs (n=84,749) and other ncRNAs (n= 1,196) with respect to the GENCODE annotation for which kinetic rates were estimated. (F-J) Distribution of site-specific rates of donor synthesis rate (F), acceptor synthesis rate (G), donor bond half-life (H), acceptor bond half-life (I) and junction bond half-life (J) for junctions in mRNAs (n=84,749), lincRNAs (n=644) antisense RNAs (auRNA, n=462), and other ncRNAs (n=1,196). Black bars represent the median values for each group. Lower and upper boxes are the first and third quartile, respectively. Mirrored curves show density estimates (B,C, E-J based on Supplementary file 2).
Figure 3 with 1 supplement
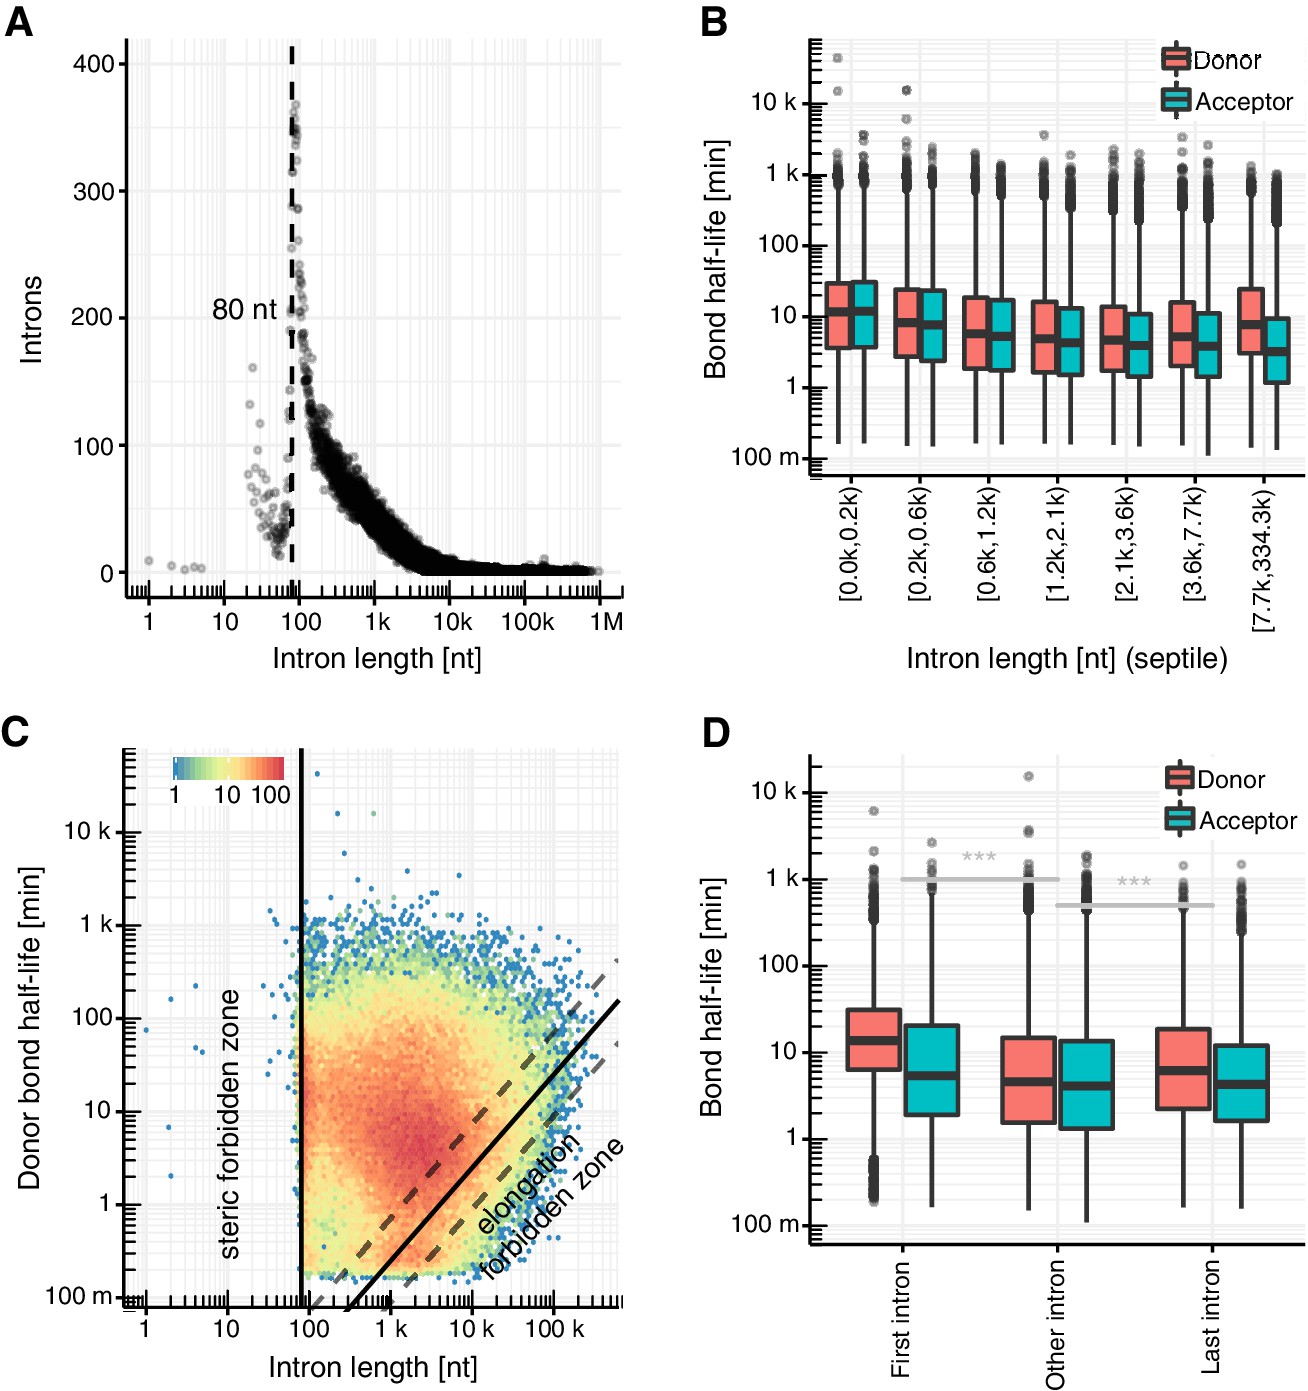
Intron length influences splicing kinetics.
(A) Number of introns against intron length. Dashed line represents the minimum estimated intron length. (B) Distribution of donor and acceptor bond half-life for introns split by intron length septiles. Black bars represent the median values for each group. Lower and upper boxes are the first and third quartile, respectively. (C) Donor bond half-life against intron length for all observed introns, minimum estimated intron length (black vertical line), and theoretical elongation boundary for a intronic polymerase elongation rate of 4 kb min−1 (black lines) and 95% confidence interval estimates (dashed lines, Materials and method). Colors encode data point density. (D) Distribution of half-life of donor (red) and acceptor (blue) bonds for first and last introns in major isoforms compared to other introns. (A–D based on Supplementary file 2).
Figure 3—figure supplement 1
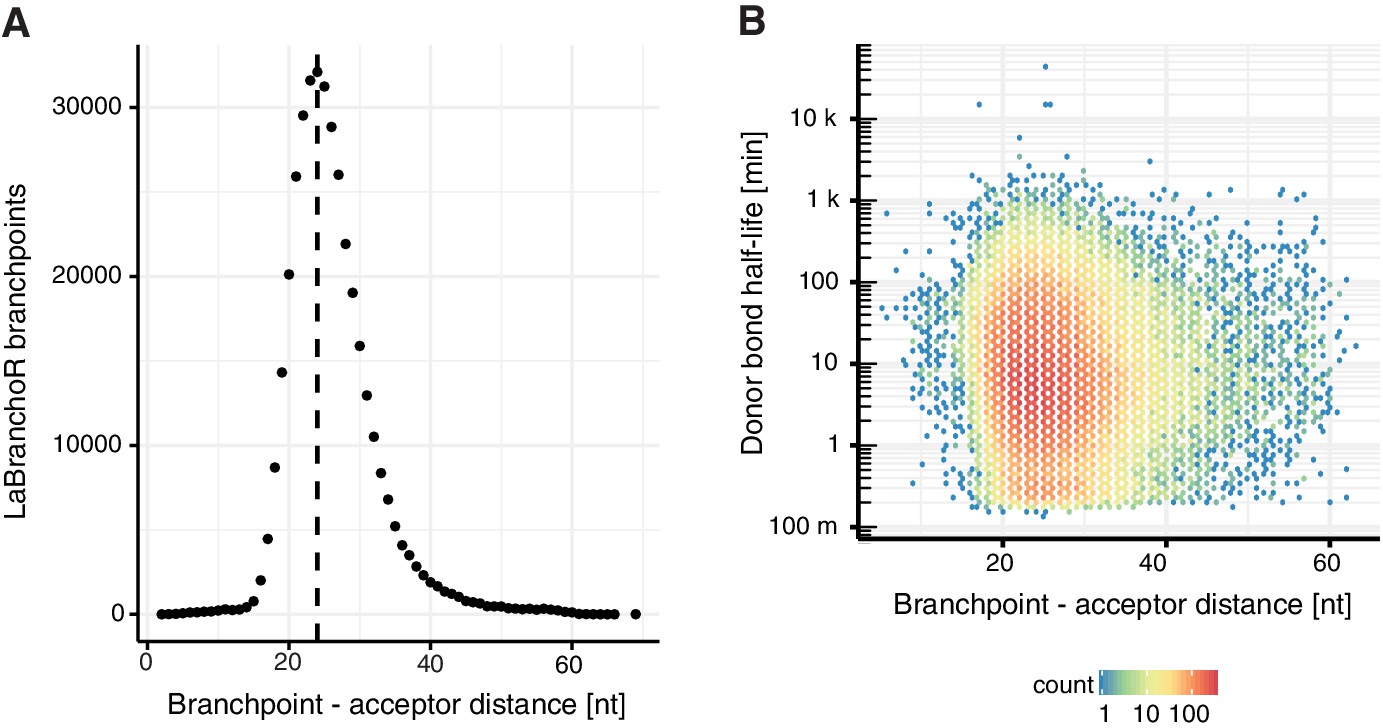
Branchpoint-acceptor site distance.
(A) Number of introns per distance between the acceptor site and the identified branchpoint by LaBranchoR. (B) Scatter plot representing the distance between branchpoint and acceptor site against donor bond half-life.
Figure 4 with 1 supplement
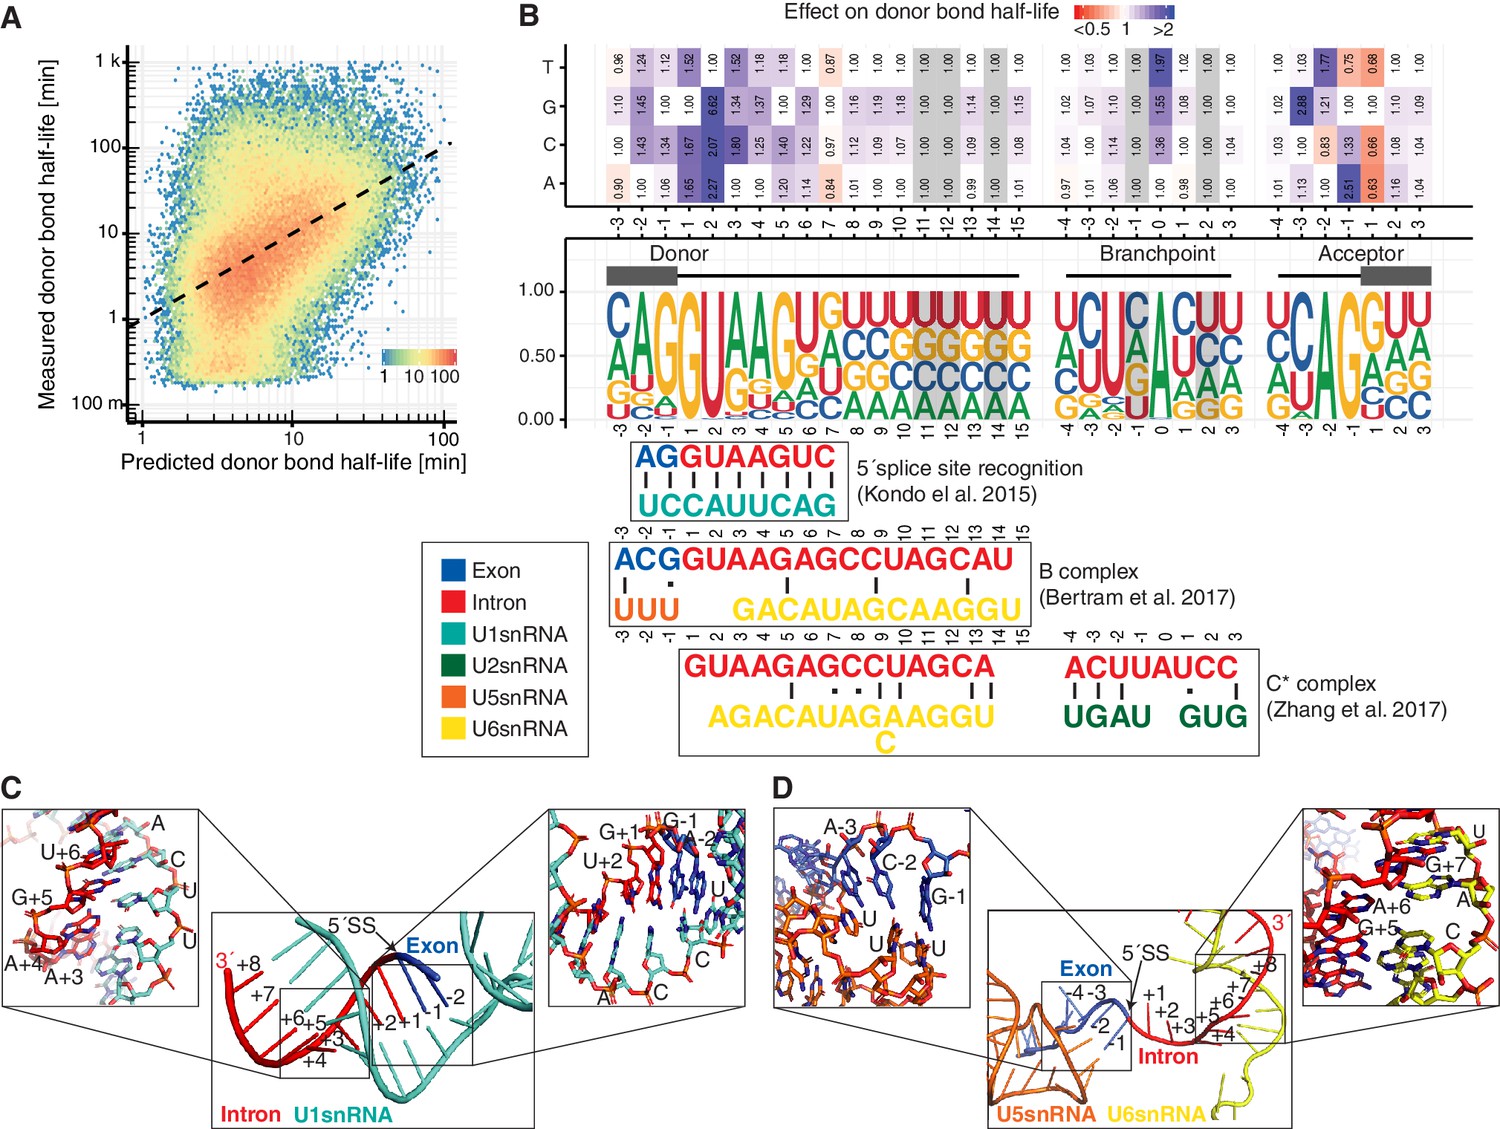
Sequence and structural contributions to donor bond half-life (related to the first catalytic step).
(A) Measured donor bond half-life against single nucleotide model prediction (median relative error of 150%, Spearman's rank correlation ρ = 0.45, p<10−16). (B) Nucleotide frequency (middle track) and prediction of the relative effect on donor bond half-life (upper track) for single nucleotide deviation from consensus sequence around donor, acceptor splice-site and branchpoint. Grey color marks positions predicted to have no effect (Materials and methods). RNA map of base-pairing interactions between four snRNAs (U1, U2, U5, U6) and precursor RNA sequences used in three published spliceosome structures of U1 snRNP binding to 5´splice-site, B and C* complex (bottom track) (exon (blue), intron (red), U1 snRNA (light blue), U2 snRNA (green), U5 snRNA (orange), U6 snRNA (yellow)). Canonical and non-canonical base-pairing interactions are depicted by black solid lines and black dots, respectively. (B based on Supplementary file 4). (C) Structure of U1 snRNA interactions with precursor RNA 5´splice-site (Kondo et al., 2015). (D) Structure of U5 and U6 snRNA interactions with precursor RNA in spliceosome B complex (Bertram et al., 2017a).
Figure 4—figure supplement 1
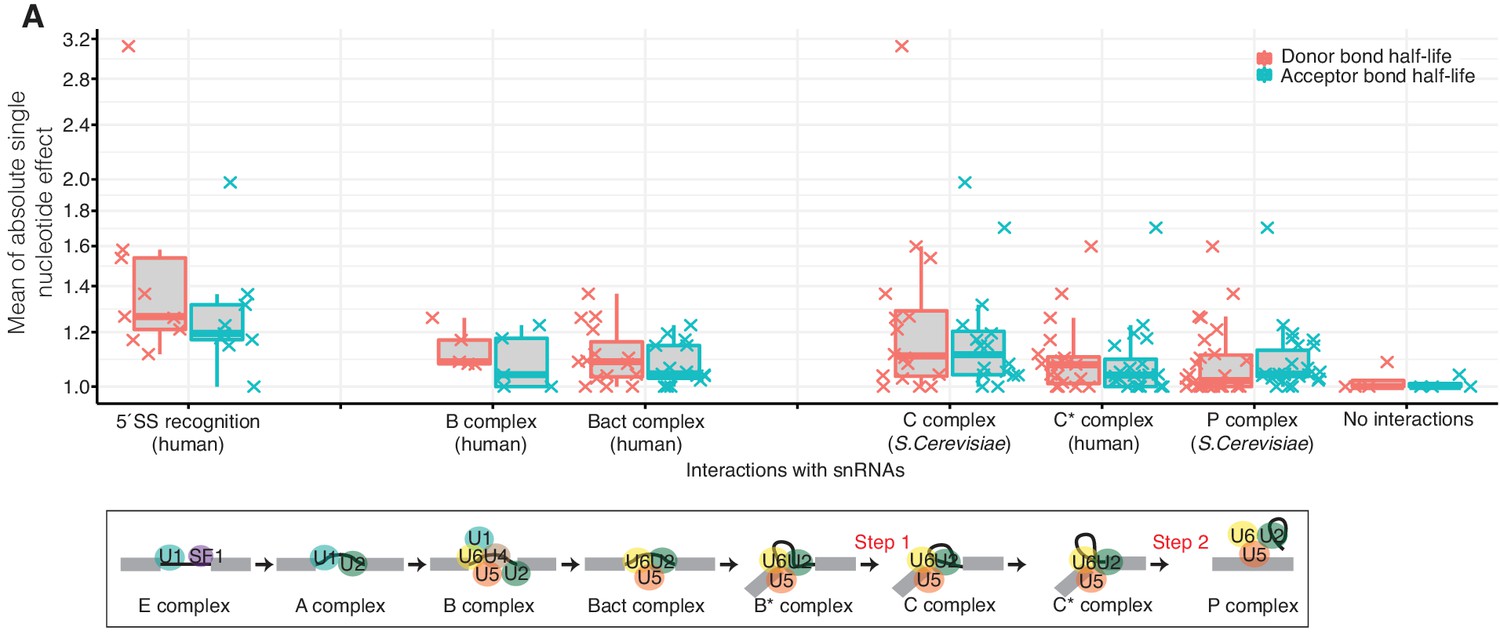
Effects of nucleotide changes on splicing kinetics as the spliceosome proceeds.
(A) Distribution of the mean absolute effect of single nucleotide effects on donor and acceptor bond half-lives for the reported interactions between the precursor RNA and the snRNAs of the available spliceosomal complex structures for 5´splice-site recognition (Kondo et al., 2015), B-complex (Bertram et al., 2017a), Bact complex (Haselbach et al., 2018), C complex (Galej et al., 2016), C*-complex (Zhang et al., 2017), and P-complex (Bai et al., 2017) (top). Schematic representation of snRNAs during the different splicing stages (bottom). (Based on Supplementary file 4).
Figure 5
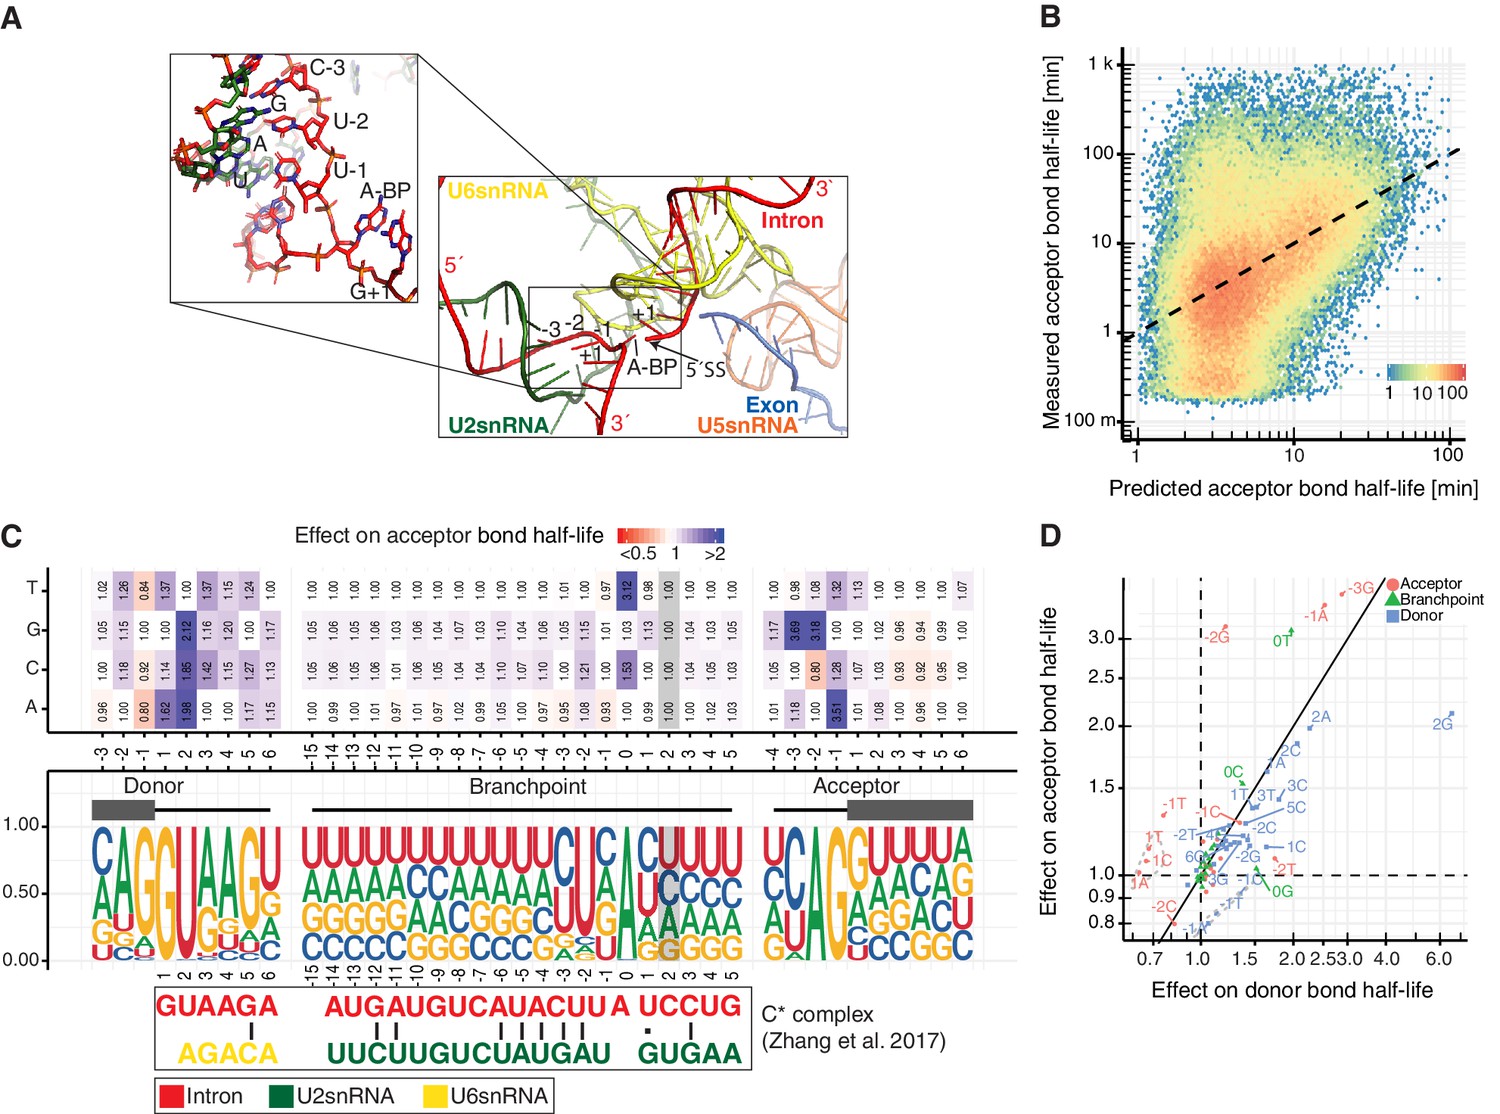
Sequence and structural contributions to acceptor bond half-life (related to the first and second catalytic steps).
(A) Structure of U2, U5 and U6 snRNAs interactions with precursor RNA in C* spliceosome complex (Zhang et al., 2017). (B) Measured acceptor bond half-life against single nucleotide model prediction (median relative error of 150%, Spearman's rank correlation ρ = 0.45, p<10−16). (C) Nucleotide frequency (middle track) and prediction of the relative effect on acceptor bond half-life (upper track) for single nucleotide deviation from consensus sequence in sequence around donor, acceptor splice-site and branchpoint. Grey color marks positions predicted to have no effect (Materials and methods). RNA map of base-pairing interactions between two snRNAs (U2 and U6) and precursor RNA sequences used in the published spliceosome structures of C* complex (intron (red), U2 snRNA (green), U6 snRNA (yellow)). Canonical and non-canonical base-pairing interactions are depicted by black solid lines and black dots, respectively. (D) Comparison of the effects of single nucleotide changes on donor bond half-life against effects on acceptor bond half-life. Donor (blue), acceptor (red), branchpoint (green) single nucleotide effects are shown. Positions one nt before the donor site and one nt after the acceptor site are encircled in grey. (C, D based on Supplementary file 4).
Figure 6 with 1 supplement
Precursor RNA sequences contributions to splicing kinetics.
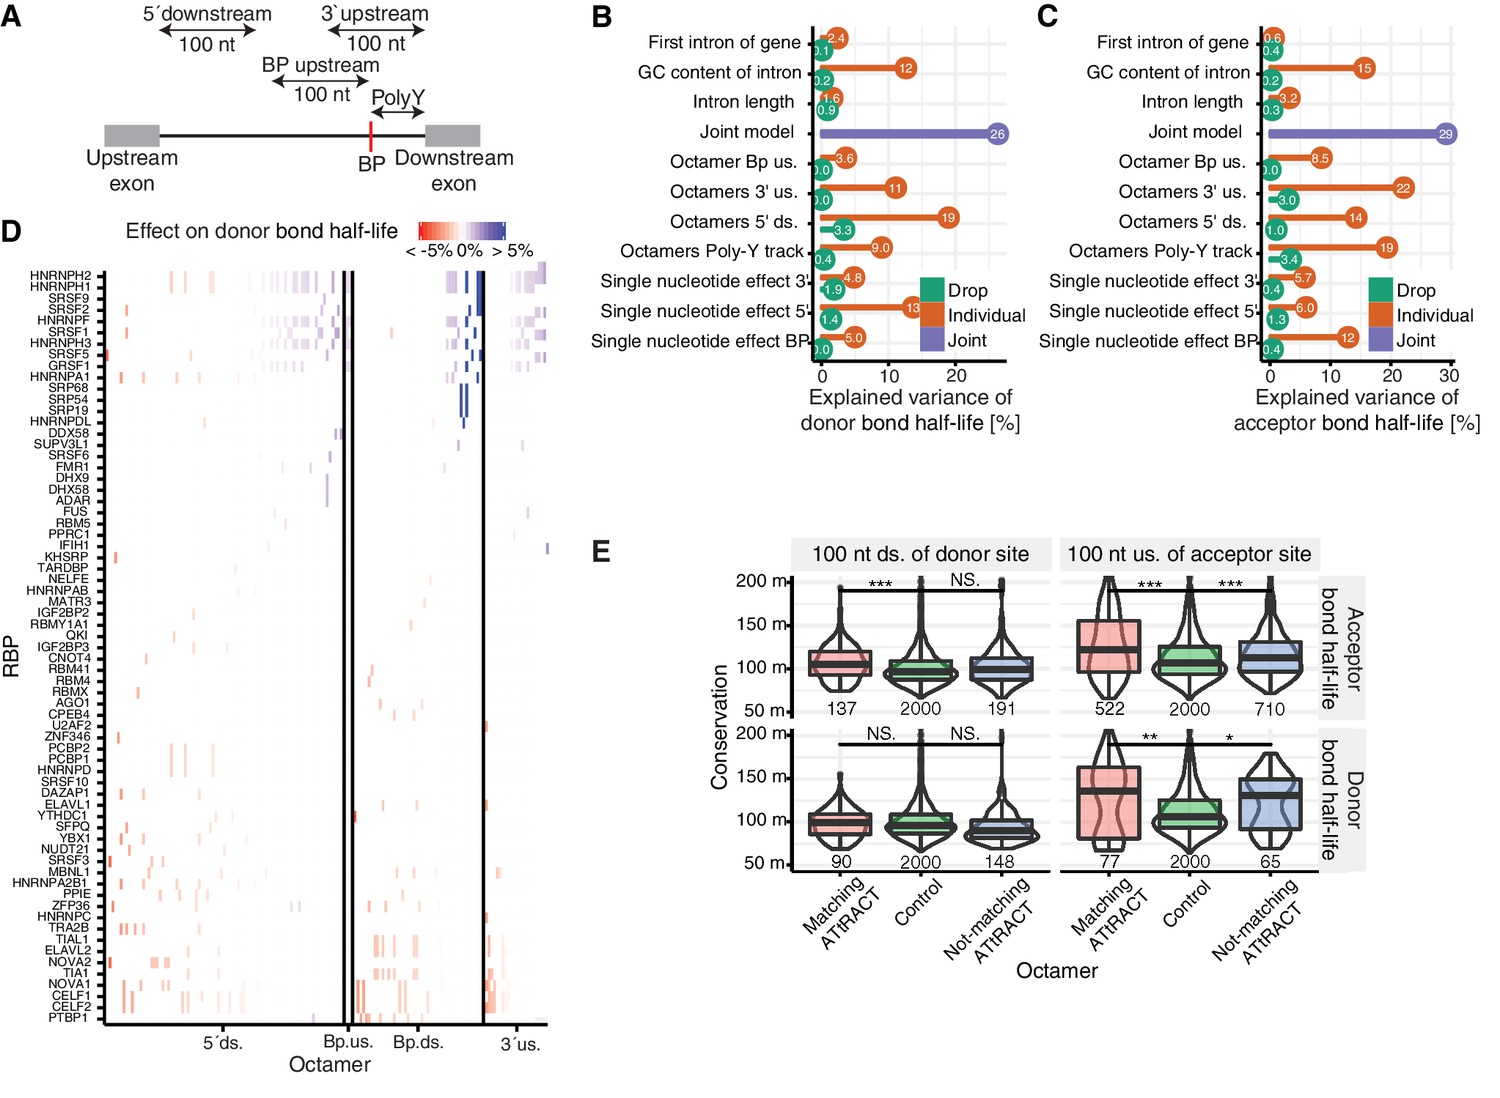
(A) Schematic representation of the regions used for the octamer search (BP = branchpoint, polyY = polyY track). In case of short intron, the regions 5ʹ downstream, 3ʹ upstream, and BP upstream were cropped to not extend into the exonic regions. Poly-Y track was defined as the region from the branchpoint up to the acceptor site. (B–C) Proportion of variance explained by the joint model (purple) for log-transformed donor (B) or acceptor (C) bond half-lives, as well as proportion of variance explained by individual features (orange) and drop of the proportion of variance explained when individual features are removed from the joint model (green). 5´ds = 5´downstream, 3´us = 3´upstream. (D) Effect on donor bond half-life of octamers matching to RNA-binding proteins (RBP, rows) motifs identified using the ATtRACT database. Each column represents one octamer; the color depicts strength and direction of the effect. (E) Distribution of the phylogenetic conservation score (PhastCons 100-way) of random octamers (green), significant octamers matching (red) and not matching (blue) the ATtRACT database of RNA-binding motifs, estimated by region (column) and model (row). Black bars represent the median values for each group. Lower and upper boxes are the first and third quartile, respectively. Stars above boxes depict pairwise significance levels by Wilcoxon signed rank test. (D based on Supplementary file 5).
Figure 6—figure supplement 1
Predicted octamers show significant regulatory effects on donor and acceptor bond half-life.
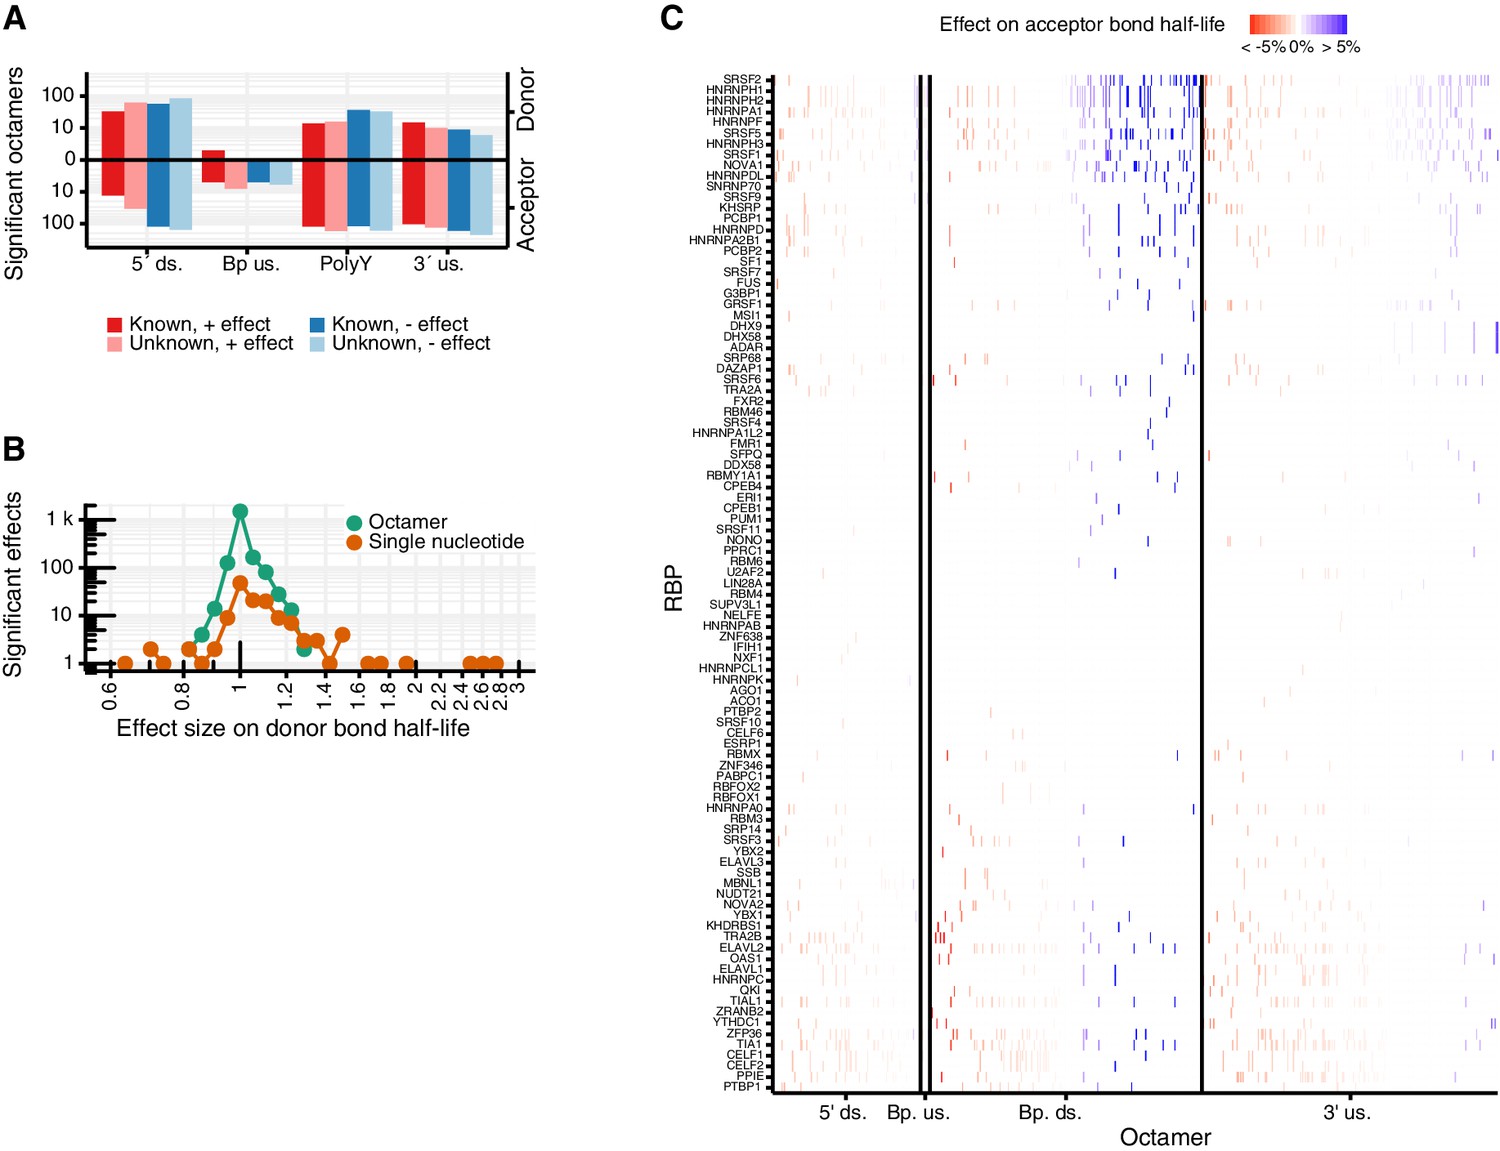
(A) Double bar chart showing the number of significant octamers found in each region used for the octamer search (5´ds = 5´downstream, BP up = branchpoint upstream, polyY = polyY track, 3´up = 3´upstream). In the upper part, the log-transformed donor bond half-life is used as response variable. In the lower part, the log-transformed acceptor bond half-life is used as response variable. Octamers were classified in whether they show a prolonging (red) or shortening (blue) effect on the bond half-lives and whether they match to a known PWM of the ATtRACT RBP database (Materials and methods). (B) Histogram of the octamer and single nucleotide effect sizes in the joint model. The models with log-transformed donor and acceptor bond half-life as response variable are considered together. (C) Effect on acceptor bond half-life of octamers matching to RNA binding proteins (RBP, rows) motifs identified using ATtRACT database. Each column represents one octamer; the color depicts strength and direction of the effect. (A–C based on Supplementary files 4,5).
Figure 7 with 1 supplement
Splicing yield differs between RNA classes.
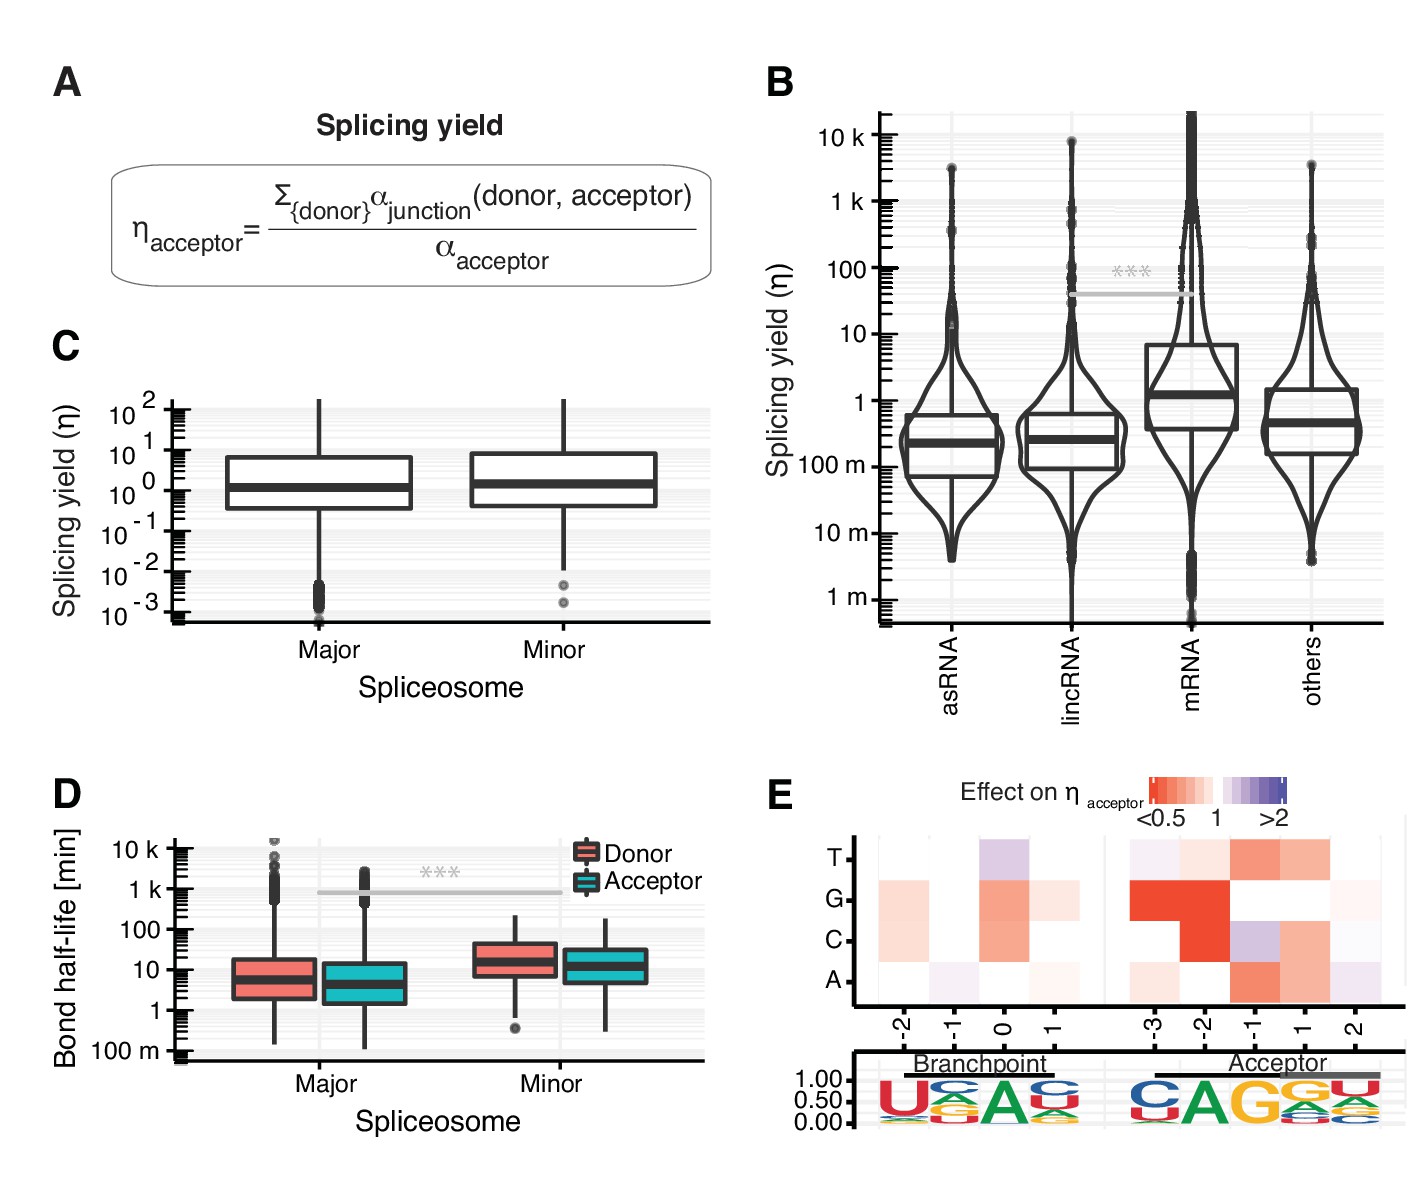
(A) Definition of synthesis rate at individual phosphodiester bonds enables the estimation of splicing yield for acceptor splice sites (ηacceptor). (B) Distribution of splicing yield of acceptor splice sites for introns of mRNAs (n=64,555), lincRNAs (n=398) antisense RNAs (asRNA, n=265), and other ncRNAs (n=876) of major transcripts (Materials and methods) for GENCODE genes. Black bars represent the median values for each group. Lower and upper boxes are the first and third quartile, respectively. (C–D) Distributions of the observed acceptor spicing yield (C) and donor and acceptor bond half-life (D) of splice-sites split by major (U2-type) and minor (U12-type) spliceosome. (E). Single nucleotide effects for branchpoint and acceptor splice site on ηacceptor. Color depicts effect on yield relative to consensus nucleotide (Materials and methods). Relative frequency of the nucleotides is shown for all modeled introns. (B–E based on Supplementary file 2).
Figure 7—figure supplement 1

Splicing yield is affected by intron length.
(A) Distribution of acceptor splicing yield split by septiles of intron lengths. Black bars represent the median values for each group. Lower and upper boxes are the first and third quartile, respectively. (B) Upper part: number of introns preferential spliced from major (U2-type) or minor (U12-type) spliceosome: GUAG (n = 69,672), GCAG (n = 594), others (n = 33), GUUG (n = 10), AUAC (n = 91). Lower part: box plots depicting changes of donor bond half-life [min] across different combinations of characteristic dinucleotides (±2 nt from donor and acceptor sites). (A, B based on Supplementary file 2). Global donor and acceptor splicing site kinetics in human cells.
Appendix 1—figure 1
Evaluation of first order kinetic model fitting.
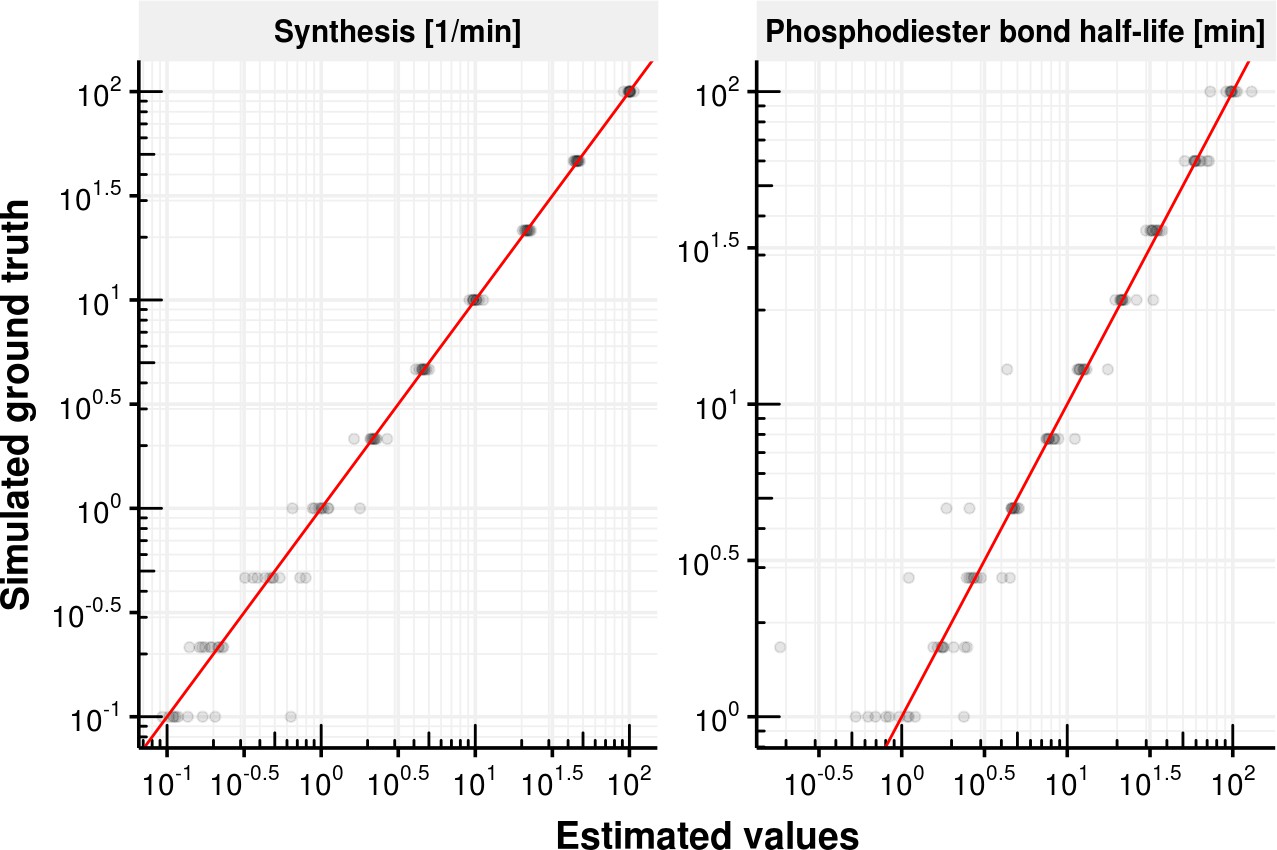
Estimated synthesis rate (left) and phosphodiester bond half-life (, right) on x-axis vs. simulated ground truth synthesis rate and phosphodiester bond half-life. The red line shows the identity line y=x.
Appendix 1—figure 2
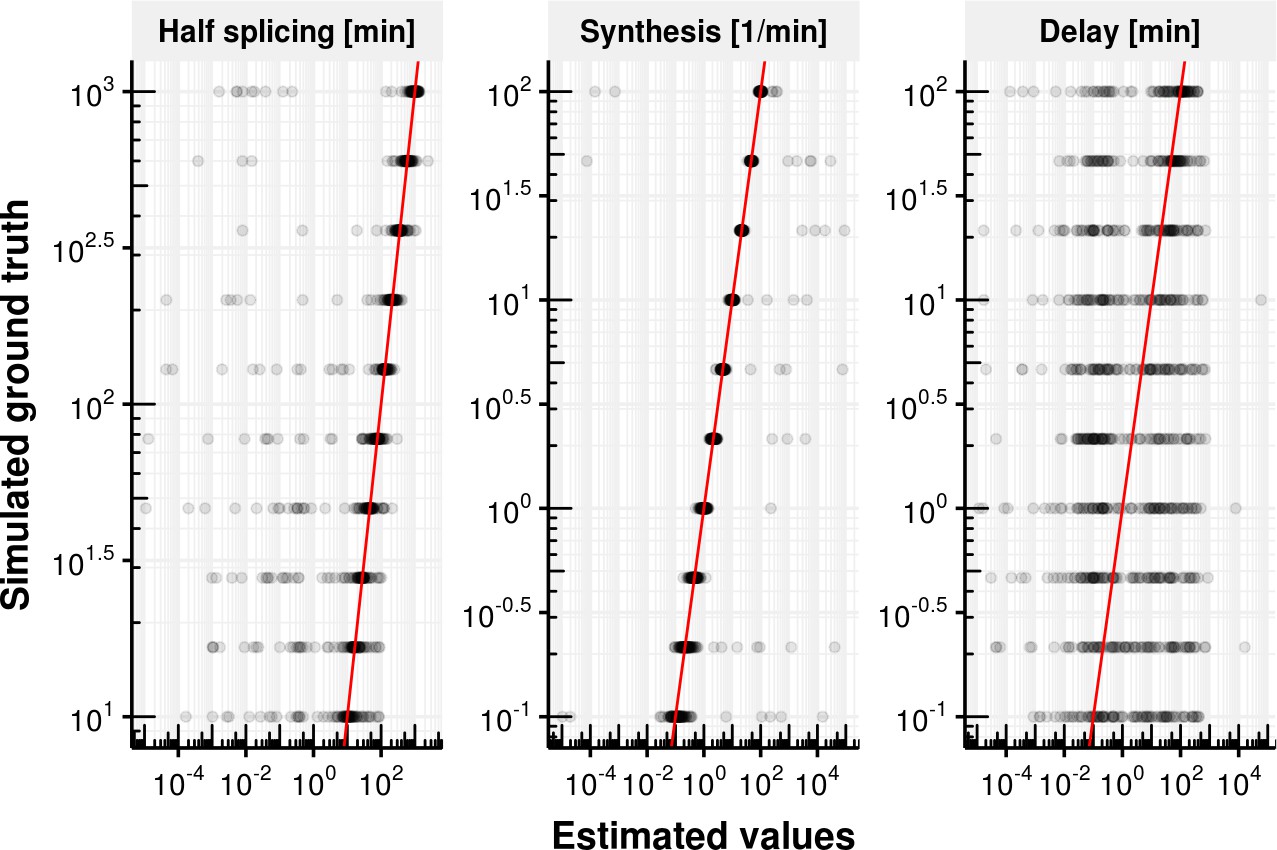
Evaluation of delay model fitting.
Estimated splicing half-time (), synthesis rate and delay time on the x-axis vs. simulated ground truth half-life, synthesis rate and delay. The red line shows the identity line. Most estimates are close to the identity line except for the delay.
Appendix 1—figure 3
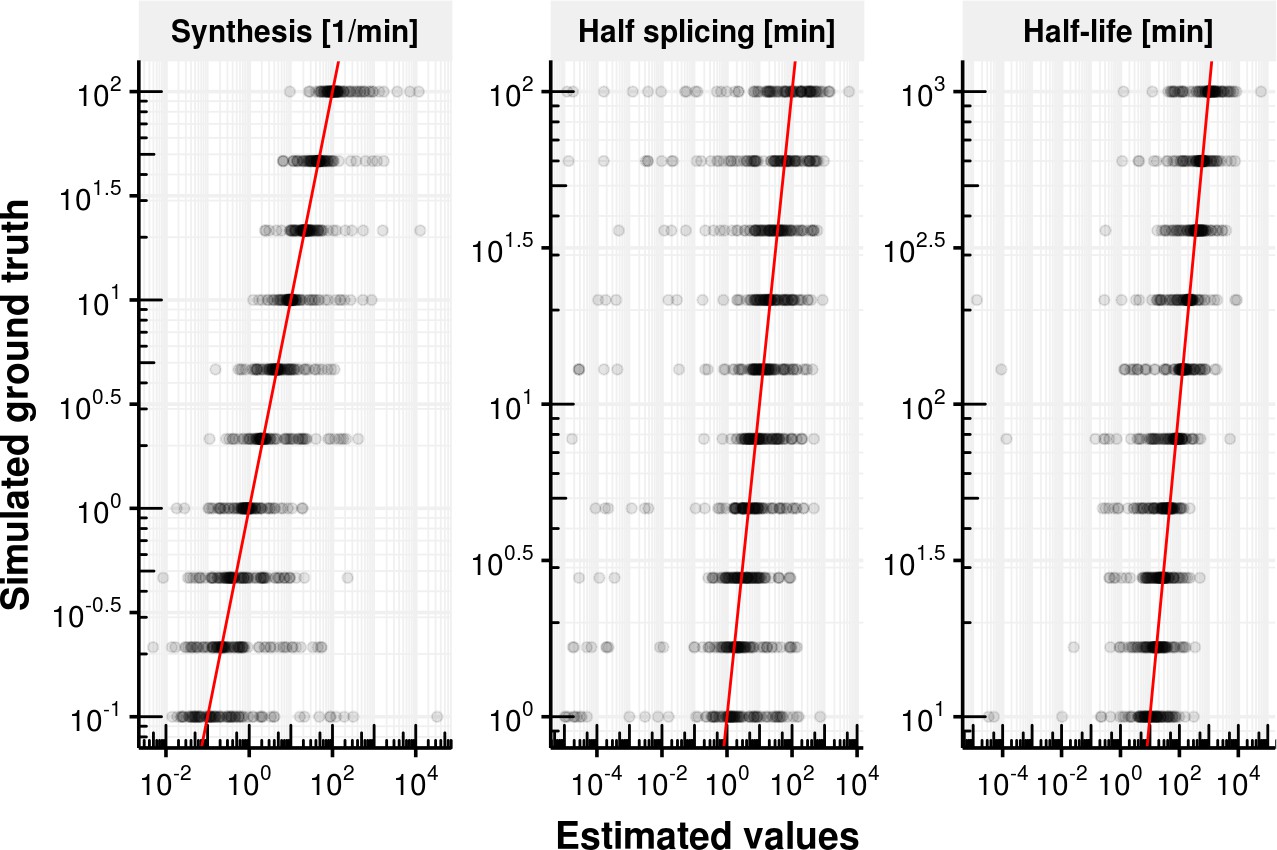
Evaluation of coupled model fitting.
Estimated synthesis rate , splicing half-time () and junction bond half-life () on the x-axis vs. simulated ground truth synthesis rate, splicing half time and half-life time. The red line shows the identity. Most estimates are unbiased but show a high degree variation.
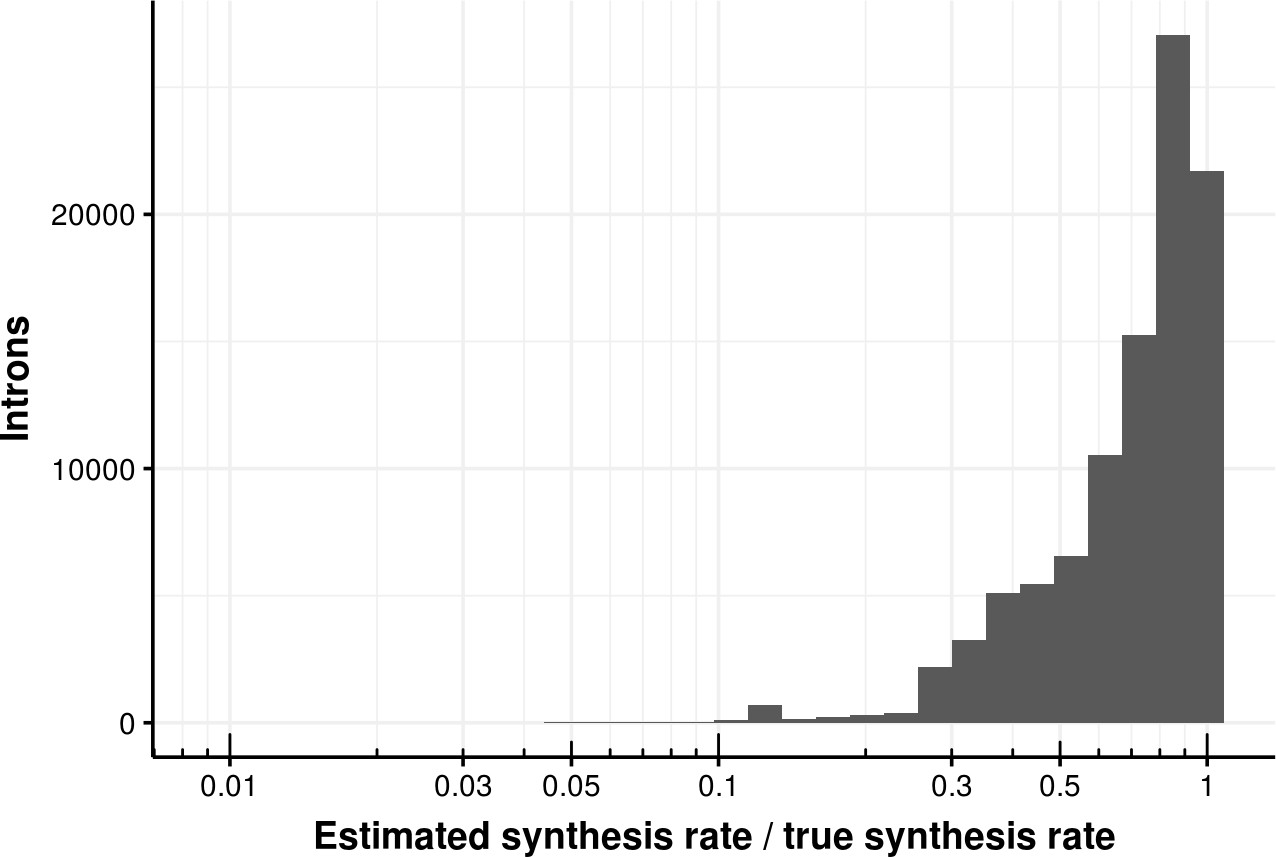
Appendix 1—figure 4
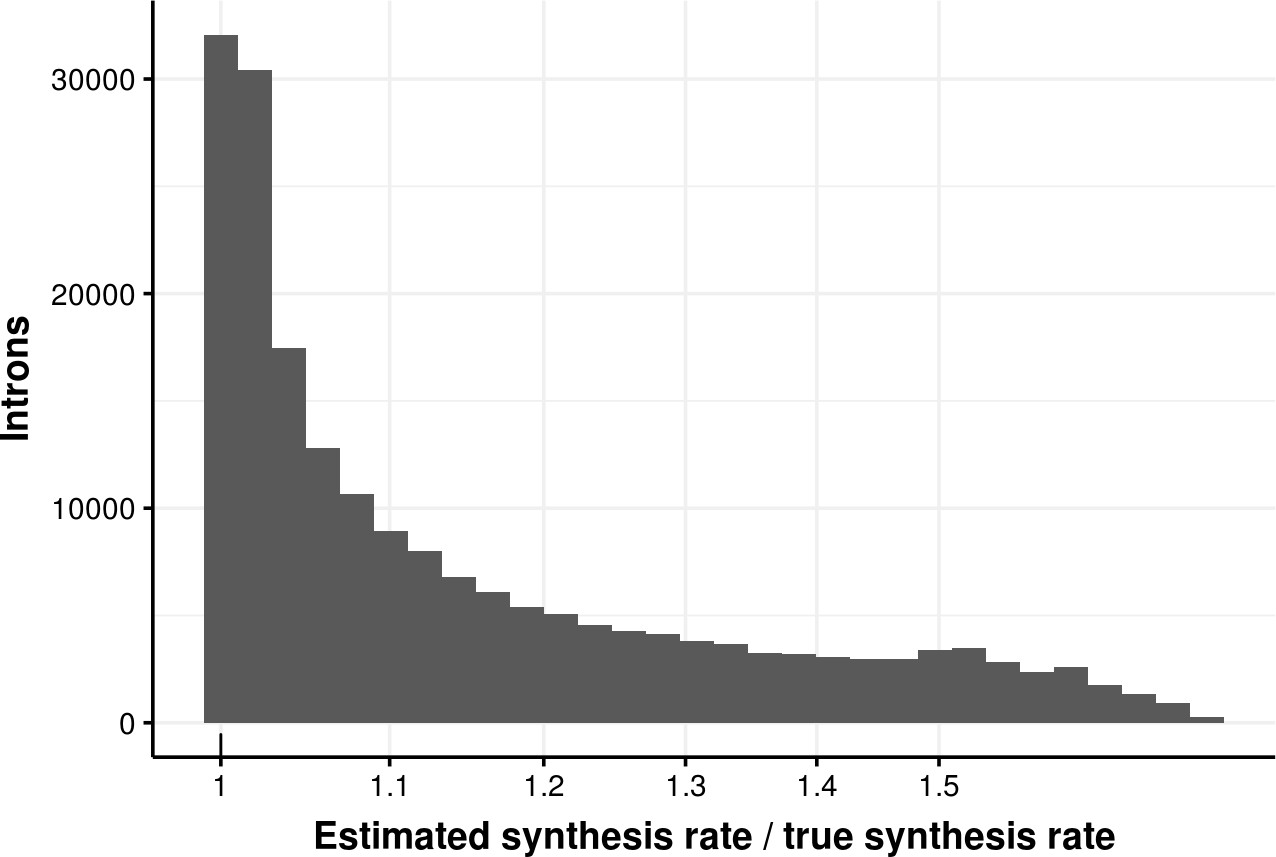
Estimated bond synthesis rate error for delay model.
Histogram of the ratio of estimated and true synthesis rate of donors simulated with the delay model. The median error is 1.08.
Appendix 1—figure 5
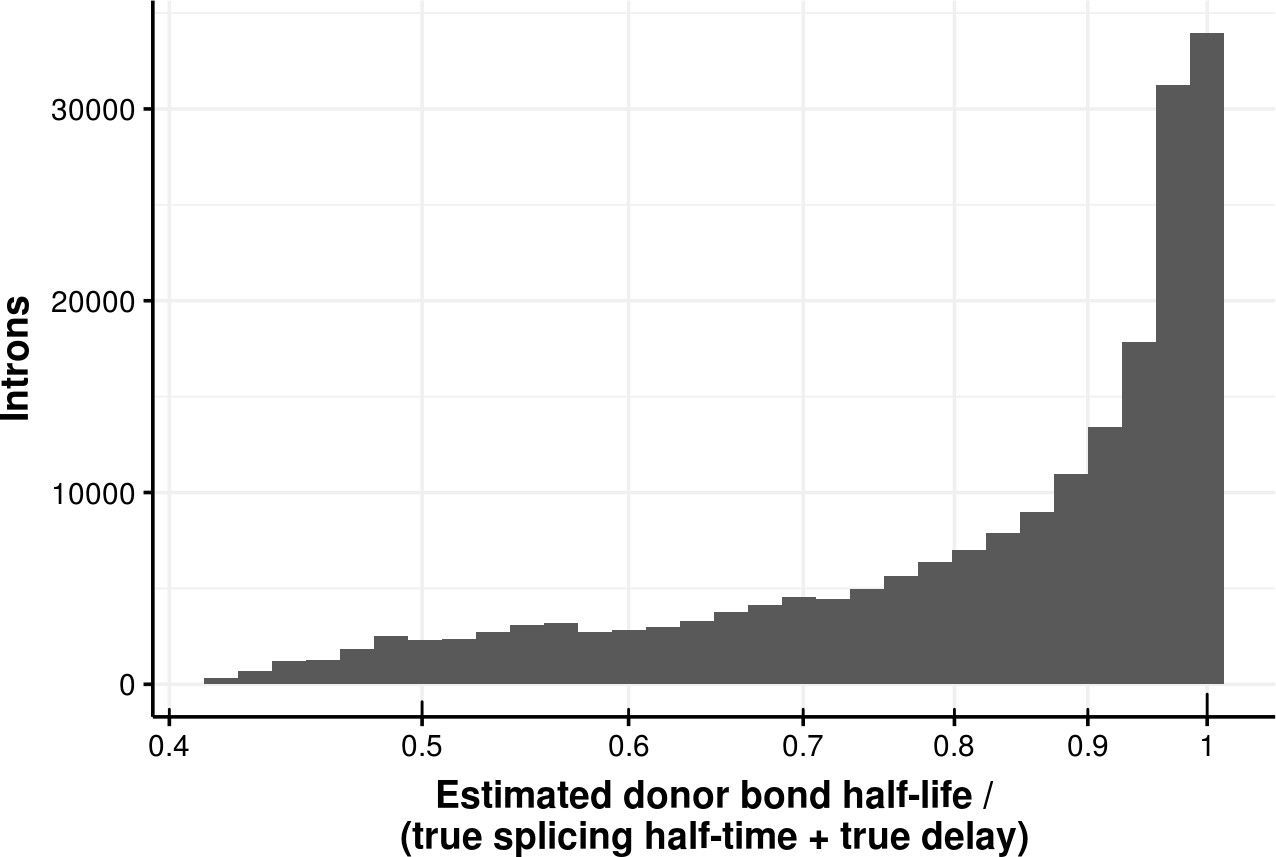
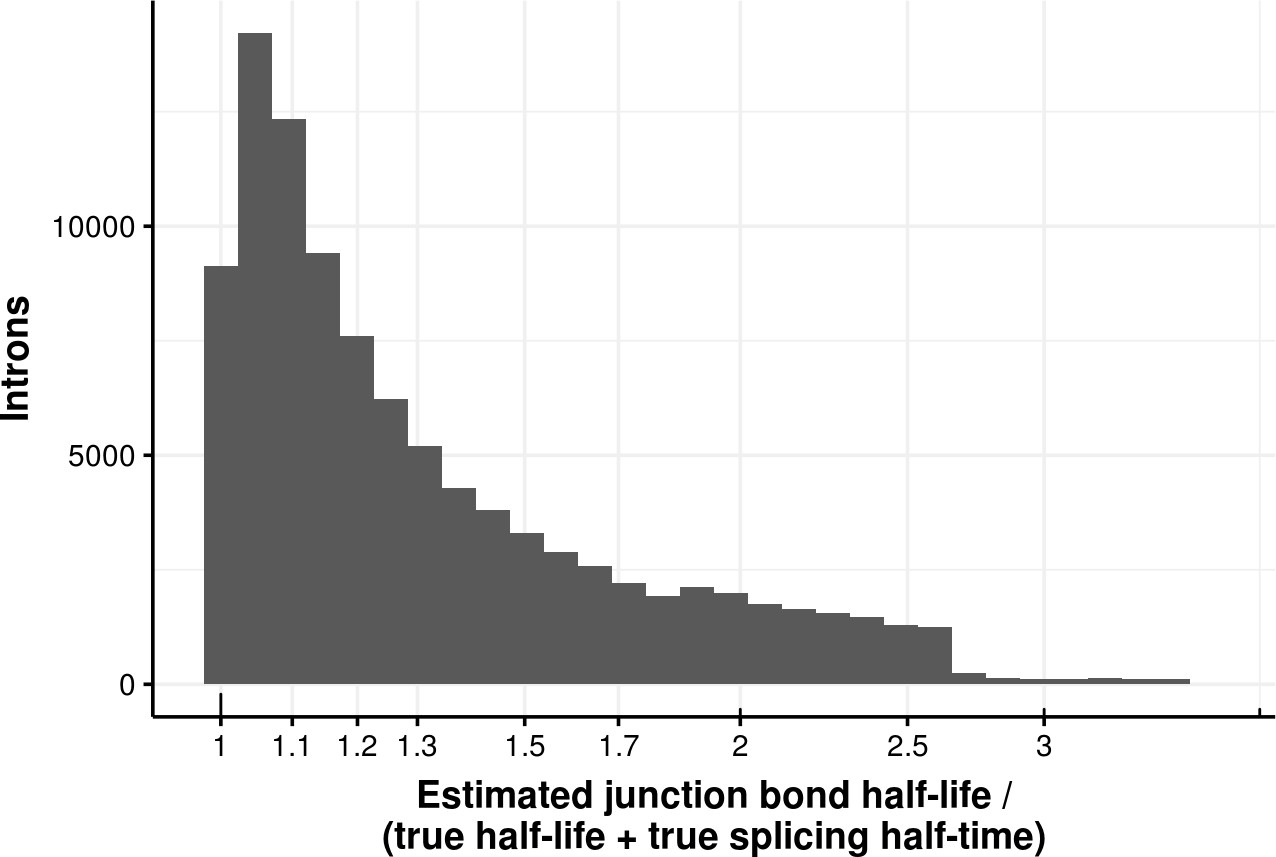
Estimated bond half-life error for delay model.
Histogram of the ratio of donor bond half-life estimated using a first order kinetic model and the sum of the true splicing half-time and delay of donors simulated using a delay model. The median error is 0.89.
Appendix 1—figure 6
Estimated bond synthesis rate error for the coupled model.
Histogram of the ratio of estimated and true synthesis rate of junctions based on the coupled model. The median error is 0.8.
Appendix 1—figure 7
Estimated bond half-life error for coupled model.
Histogram of the ratio of junction bond half-life estimated with a first order kinetic model and the sum of the true processed RNA half-life and of the splicing half-time of junction data simulated with a coupled model. The median error is 1.2.
Appendix 1—figure 8
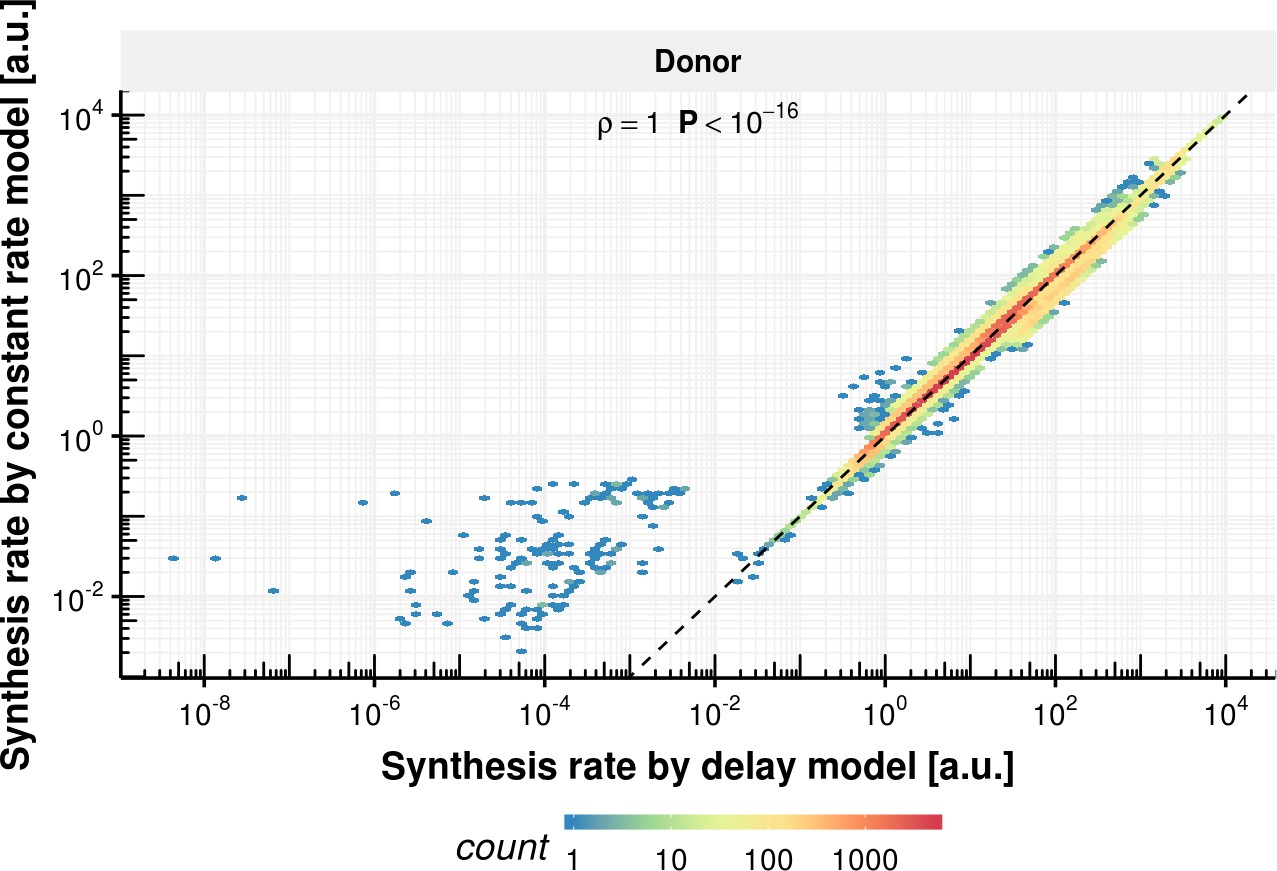
Synthesis rate comparison of delay and constant rate model.
Synthesis rate estimated with the constant splicing rate model (y-axis) vs. synthesis rate estimated with the delay model (x-axis) for the donor bond based on the observed experimental data.
Appendix 1—figure 9
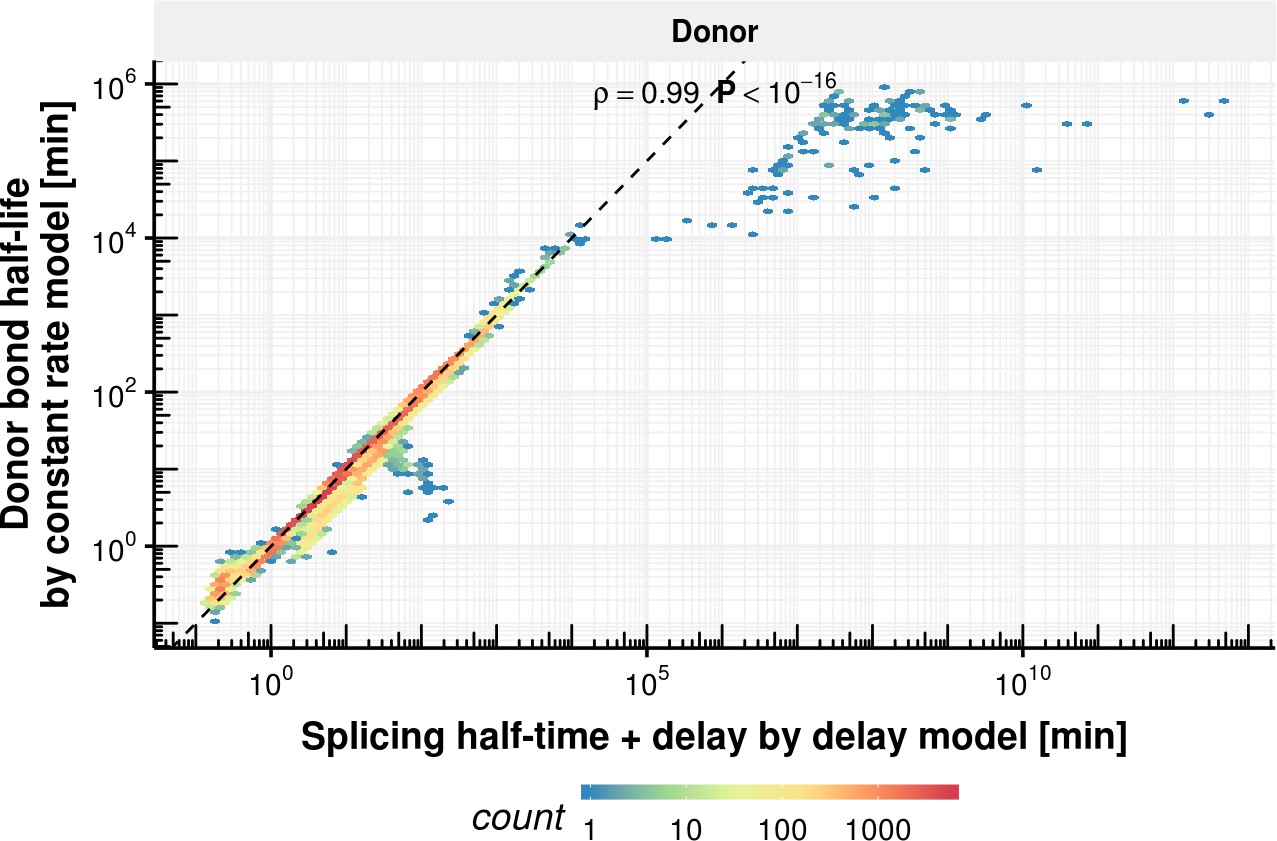
Donor bond half-life comparison of delay and constant rate model.
Donor bond half-life estimated with the constant splicing rate model (y-axis) vs. the sum of the splicing half-time and delay estimated with the delay model (x-axis) for the donor bond (right) based on the observed experimental data.
Appendix 1—figure 10
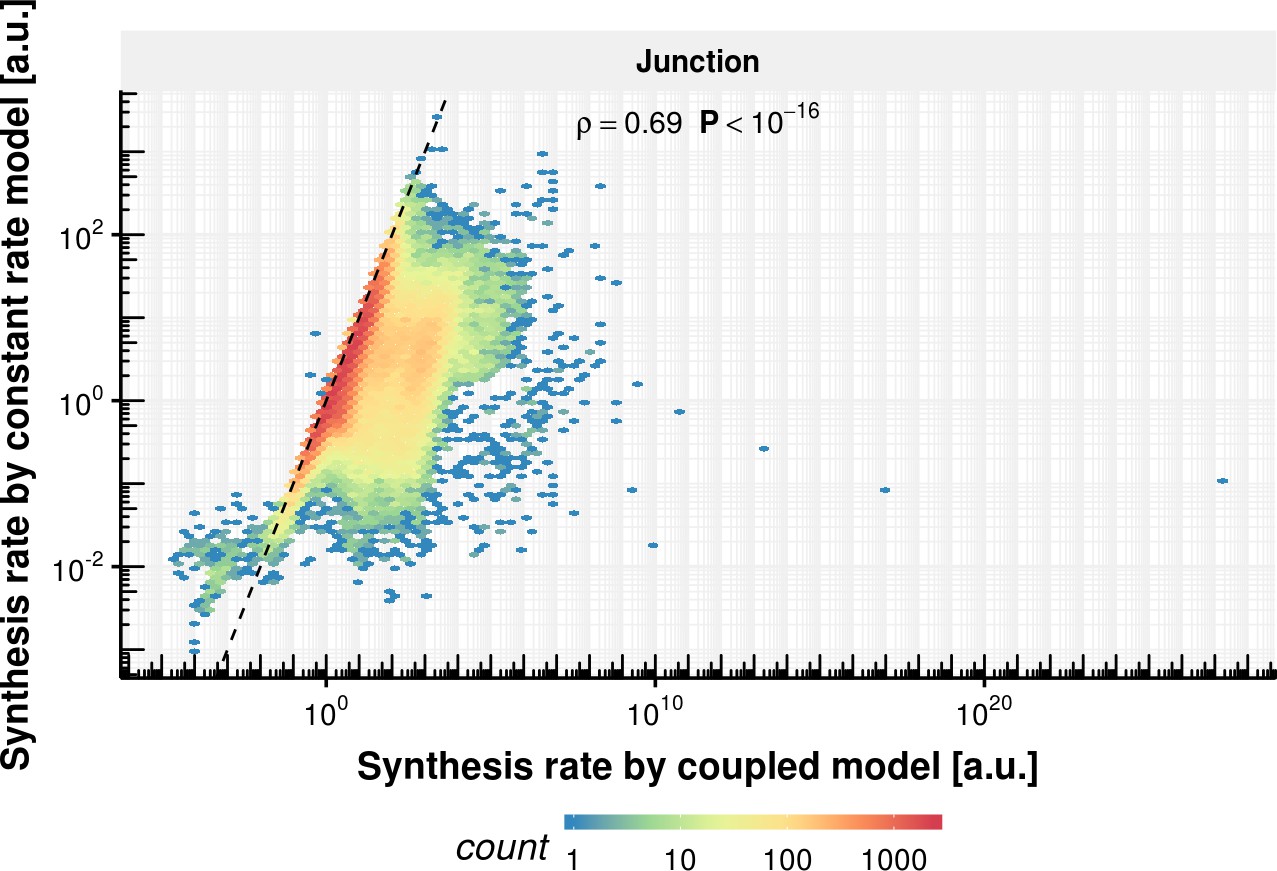
Synthesis rate comparison of coupled and constant rate model.
Estimated synthesis rate of the constant splicing rate model (y-axis) vs estimated synthesis rate of the coupled model based on the observed experimental data.
Appendix 1—figure 11
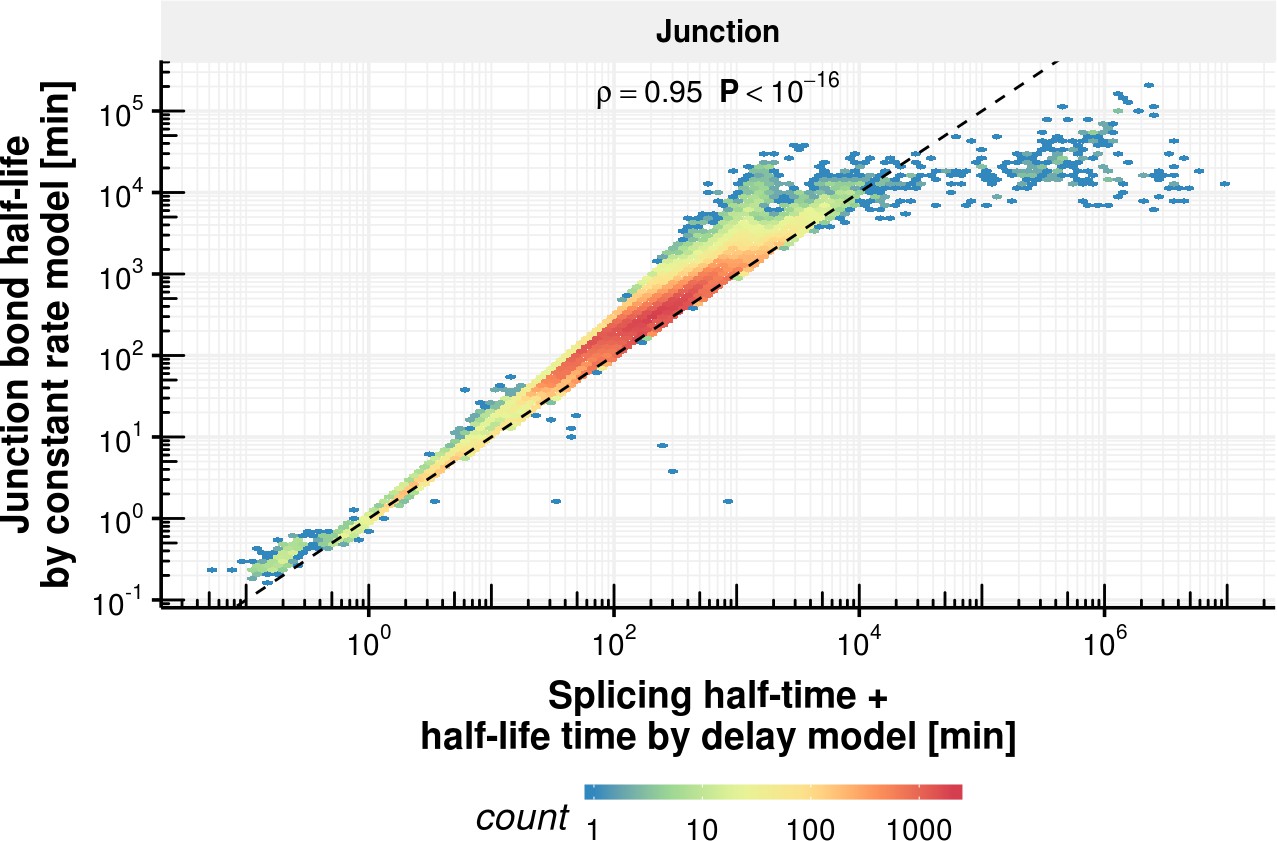
Junction bond half-life comparison of delay and constant rate model.
Junction bond half-life estimated with the constant splicing rate model (y-axis) vs. the sum of splicing half-time and half-life estimated with the coupled model (x-axis) based on the observed experimental data.
Appendix 1—figure 12
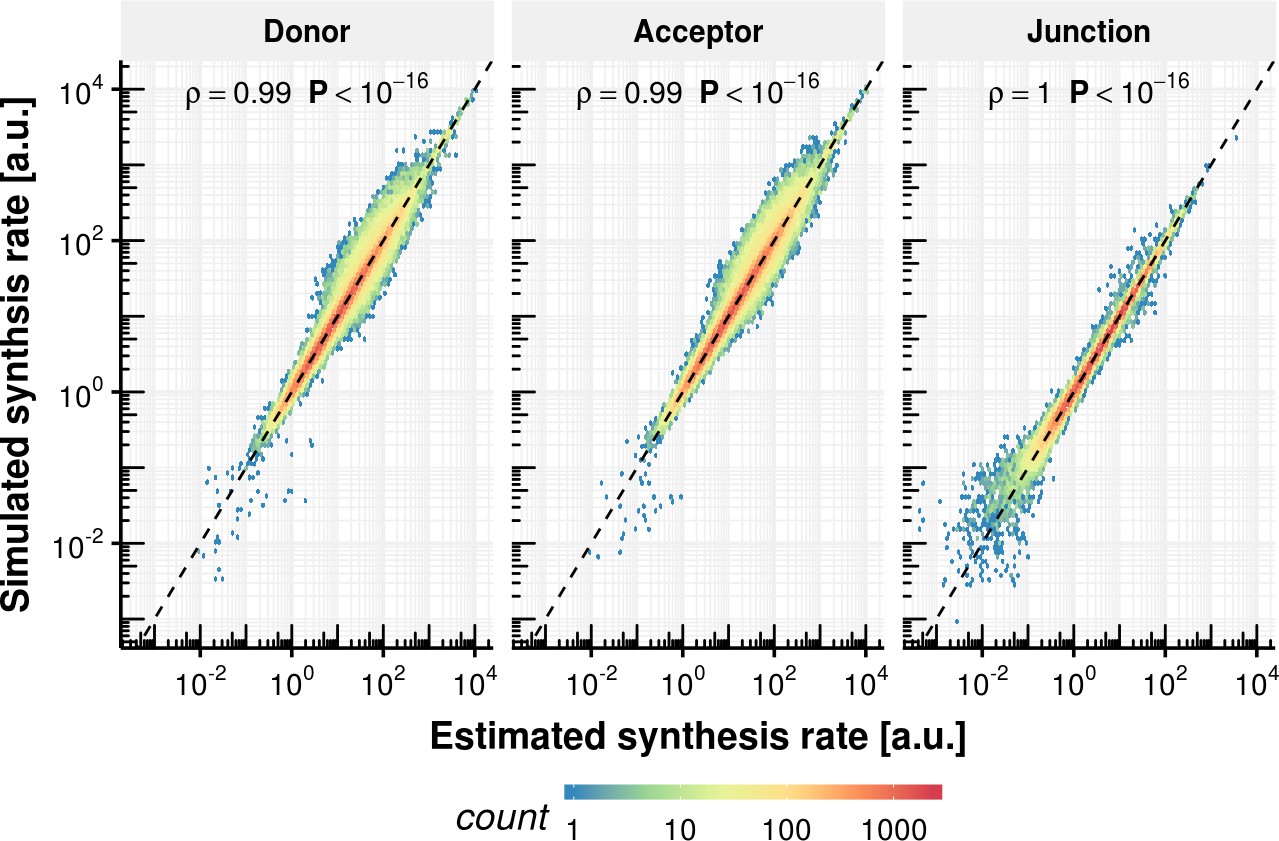
Synthesis rate precision of rate estimation procedure.
Estimated synthesis rate based on simulated counts on the x-axis vs. the ground truth synthesis rate for donor, acceptor and junctions.
Appendix 1—figure 13
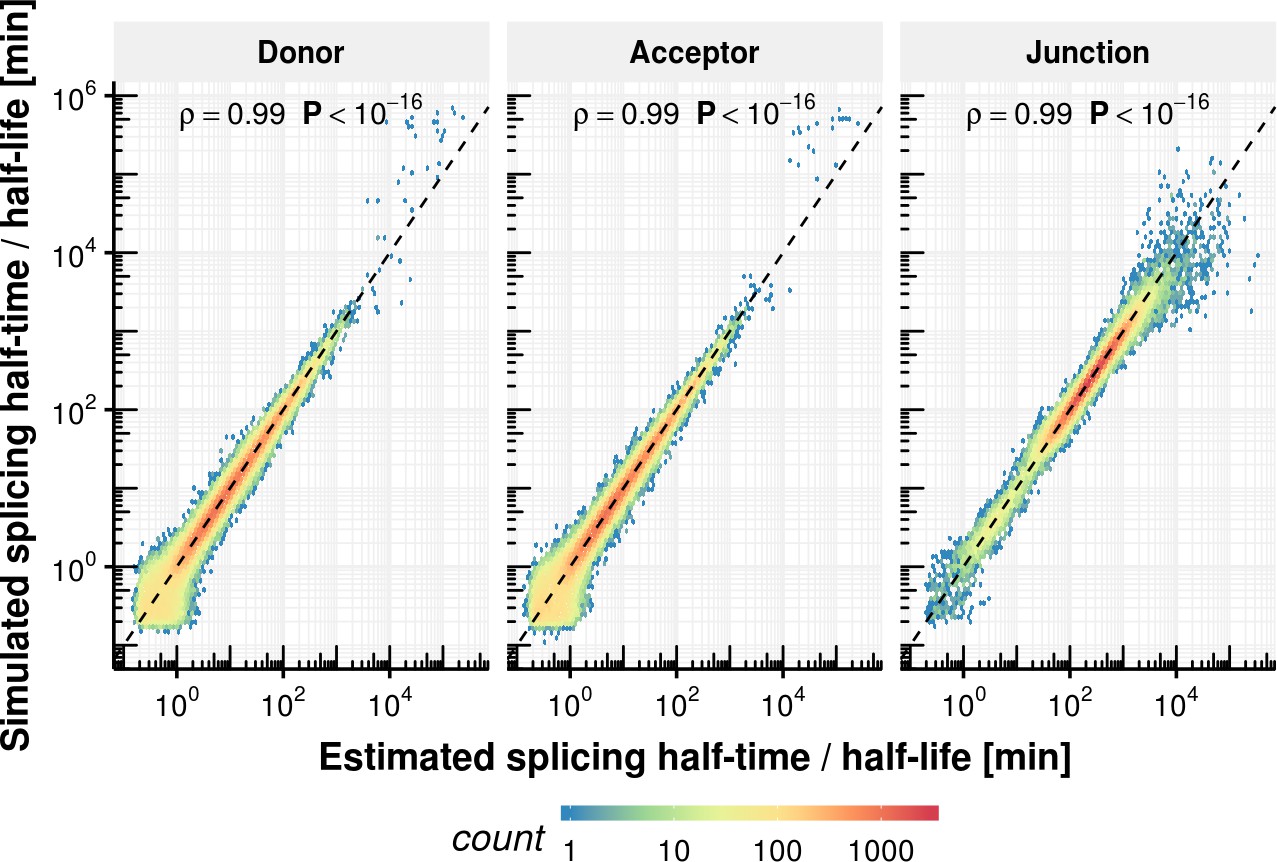
Splicing half-time precision of rate estimation procedure.
Estimated half splicing time for donor and acceptor as well as half-life for junctions based on simulated counts on the x-axis vs. the ground truth.
Appendix 1—figure 14
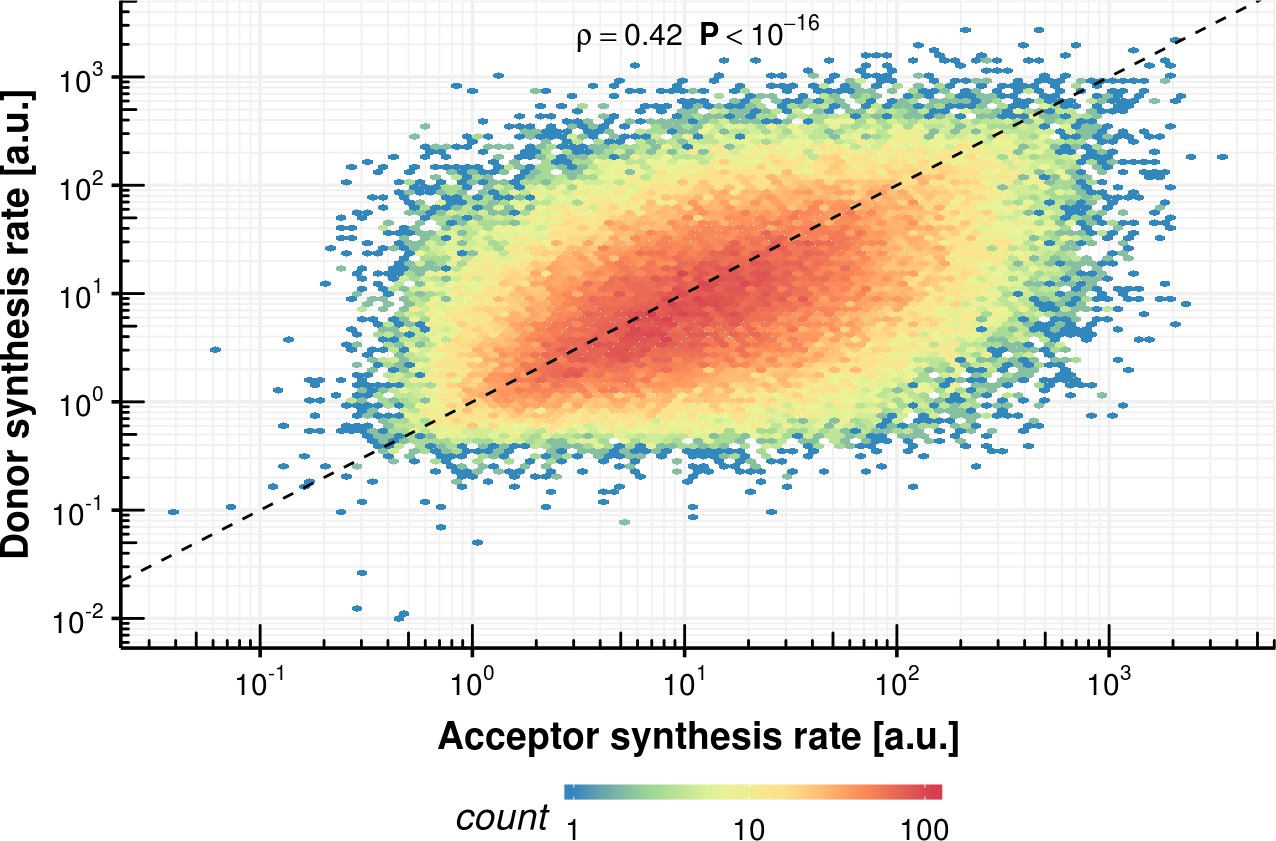
Donor synthesis rate vs. acceptor synthesis rate within the same intron.
https://doi.org/10.7554/eLife.45056.039
Appendix 1—figure 15

Acceptor synthesis rate vs. junction synthesis rate within the same intron.
https://doi.org/10.7554/eLife.45056.040
Appendix 1—figure 16
Comparison of expected counts of the constant rate model with observed experimental counts.
Expected donor counts based on the constant rate model vs. the experimentally observed counts.
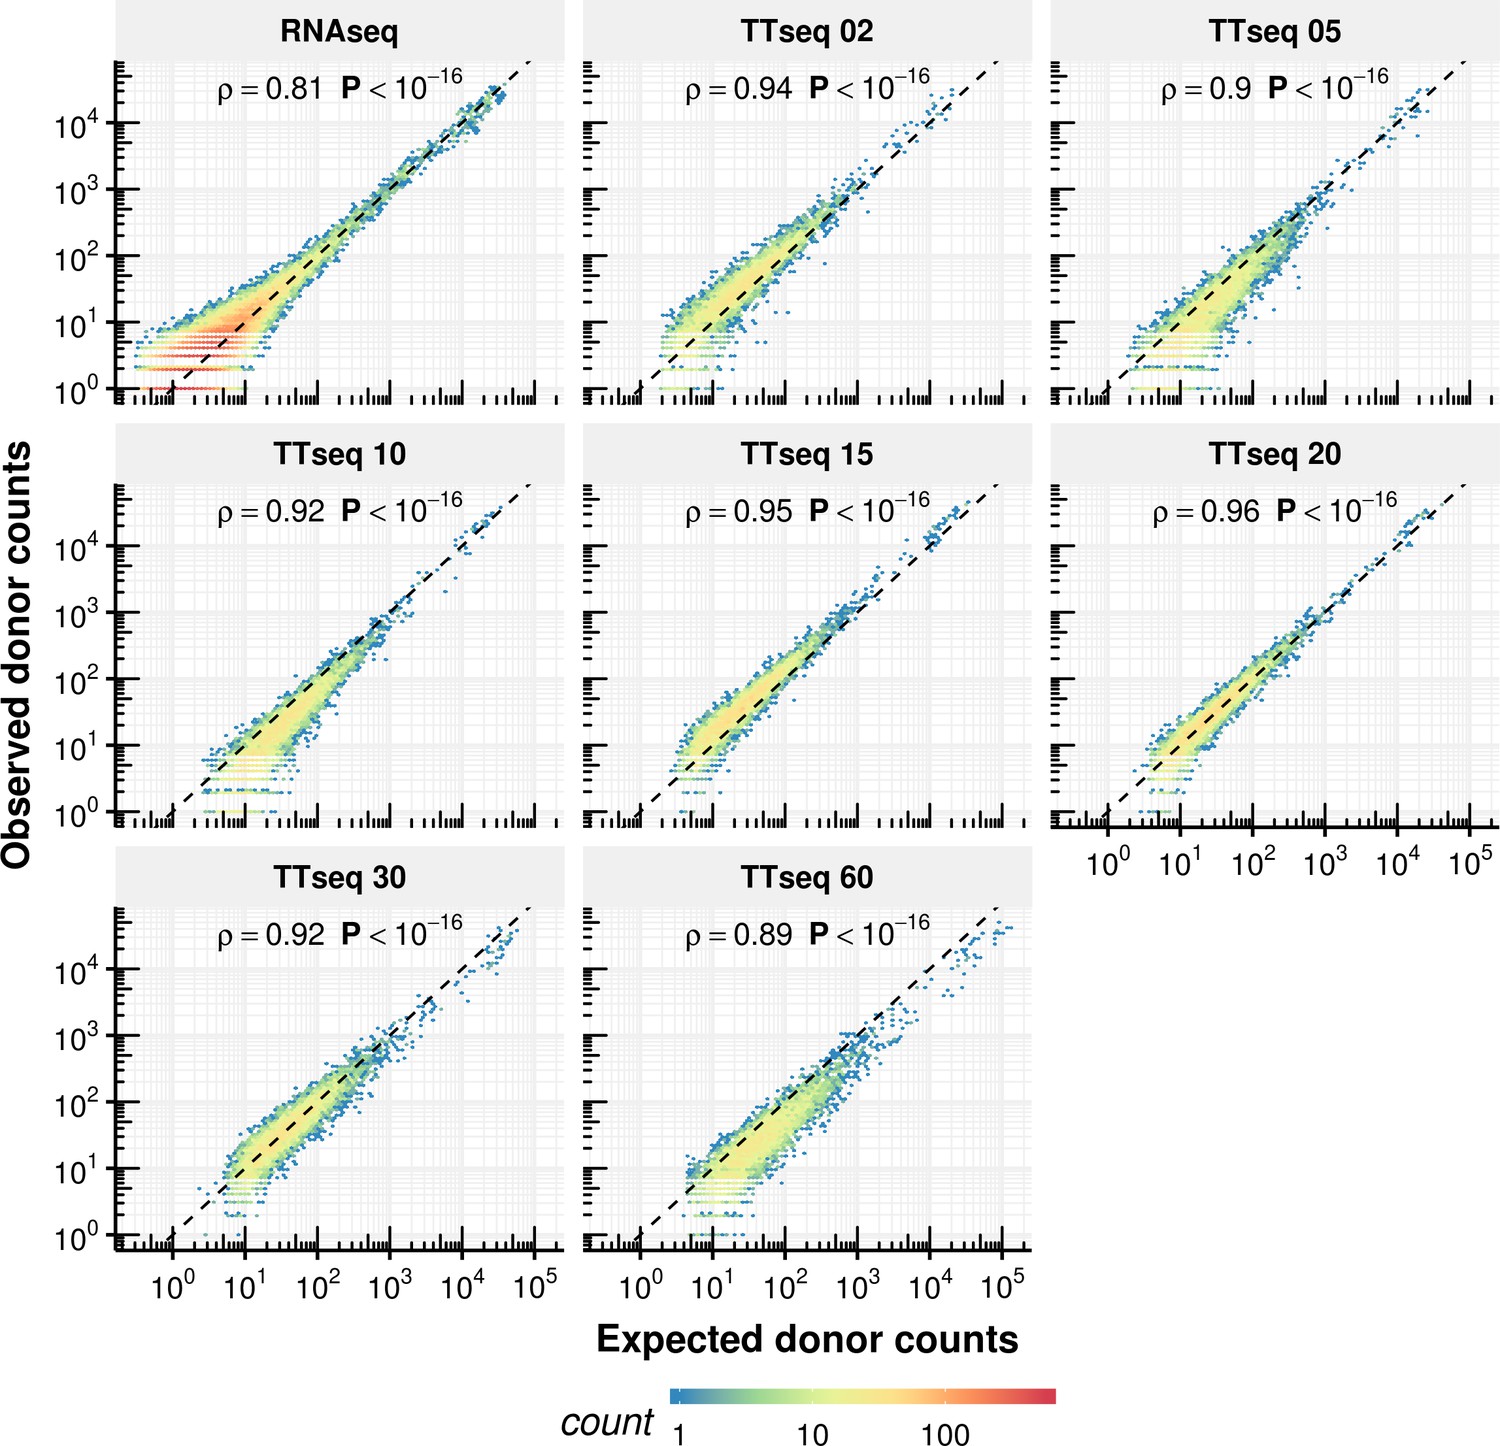
Appendix 1—figure 17

Comparison of expected counts of the constant rate model with observed experimental counts.
Expected acceptor counts based on the constant rate model vs. the experimentally observed counts.
Appendix 1—figure 18

Comparison of expected counts of the constant rate model with observed experimental counts.
Expected junction counts based on the constant rate model vs. the experimentally observed counts.
Appendix 1—figure 19
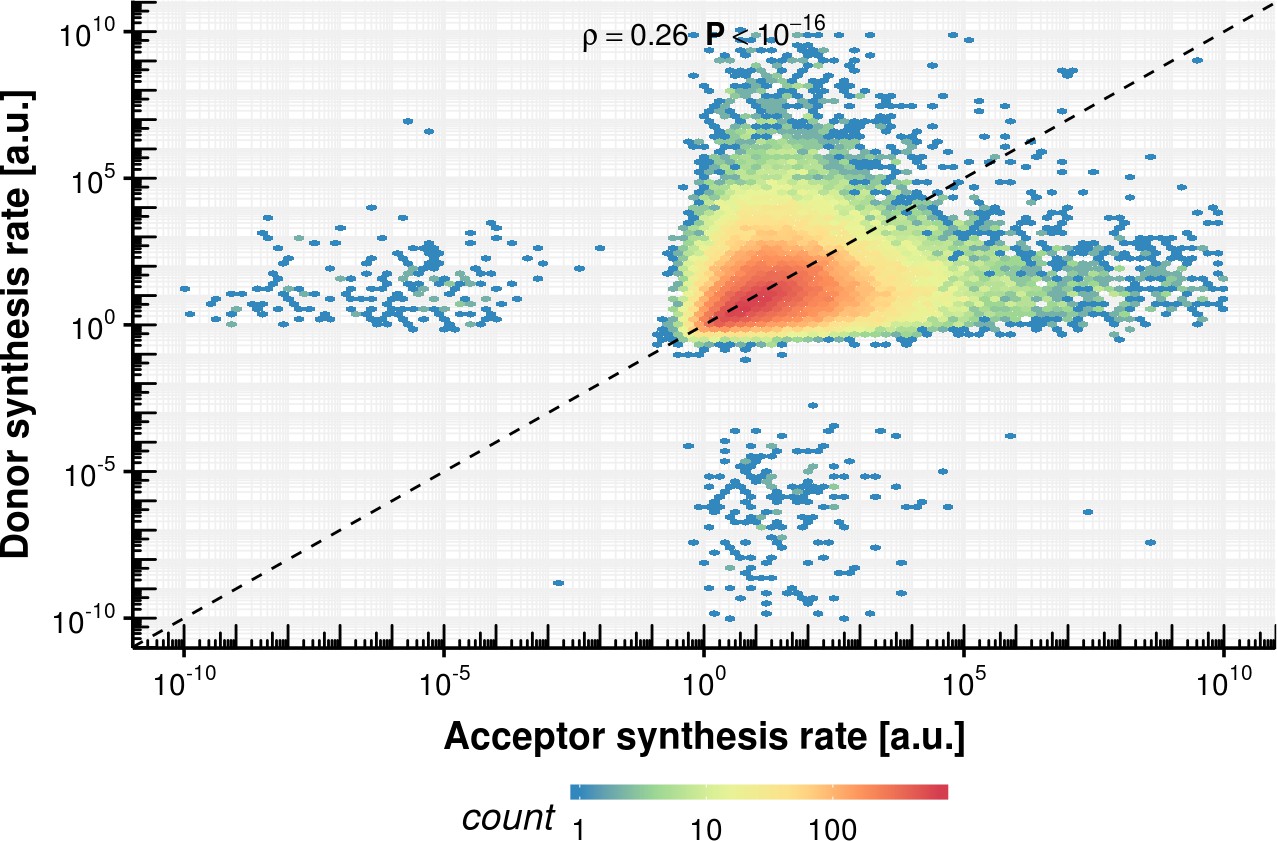
Acceptor vs. donor synthesis rate estimation based on the fixed delay model.
https://doi.org/10.7554/eLife.45056.044
Appendix 1—figure 20

Acceptor vs. donor splicing half-time estimation based on the fixed delay model.
https://doi.org/10.7554/eLife.45056.045
Appendix 1—figure 21
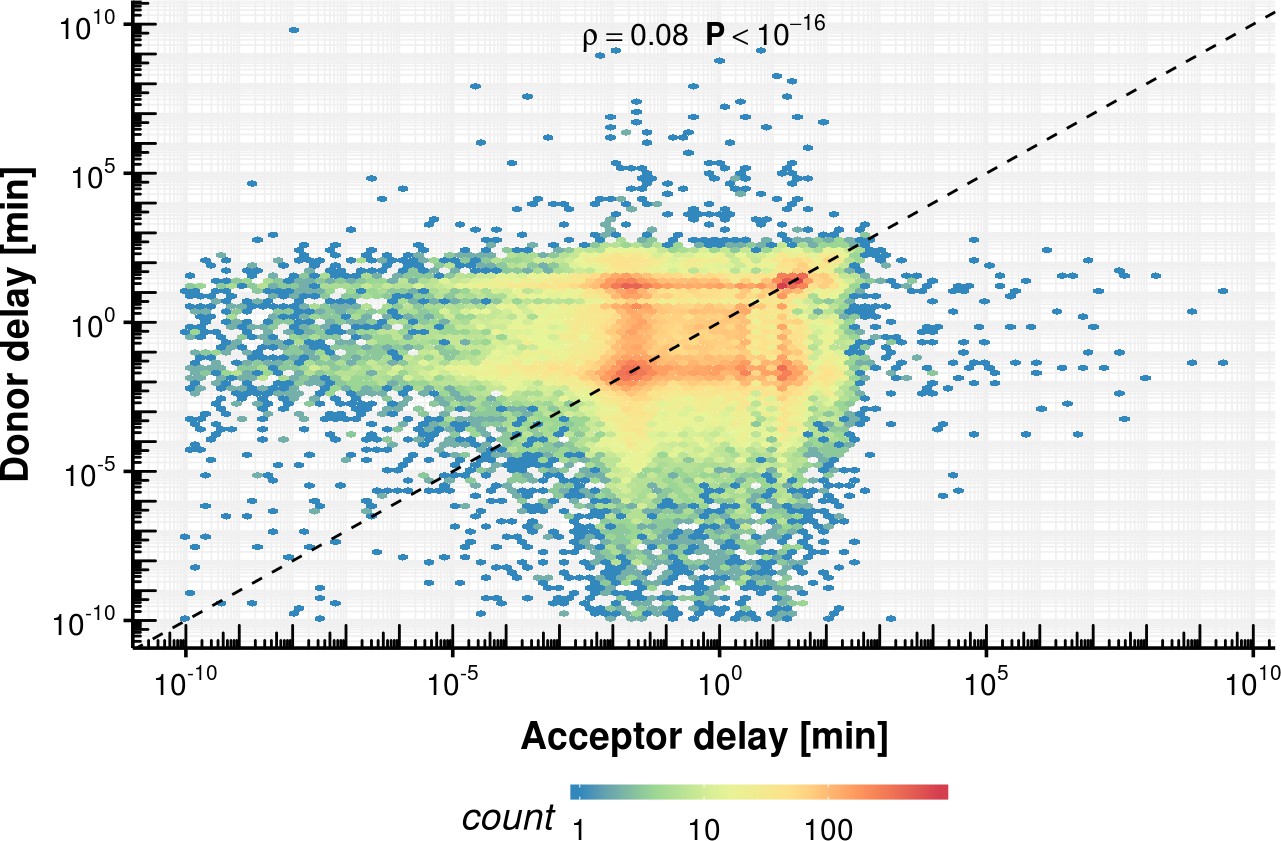
Acceptor vs. donor delay estimation based on the fixed delay model.
https://doi.org/10.7554/eLife.45056.046
Appendix 1—figure 22
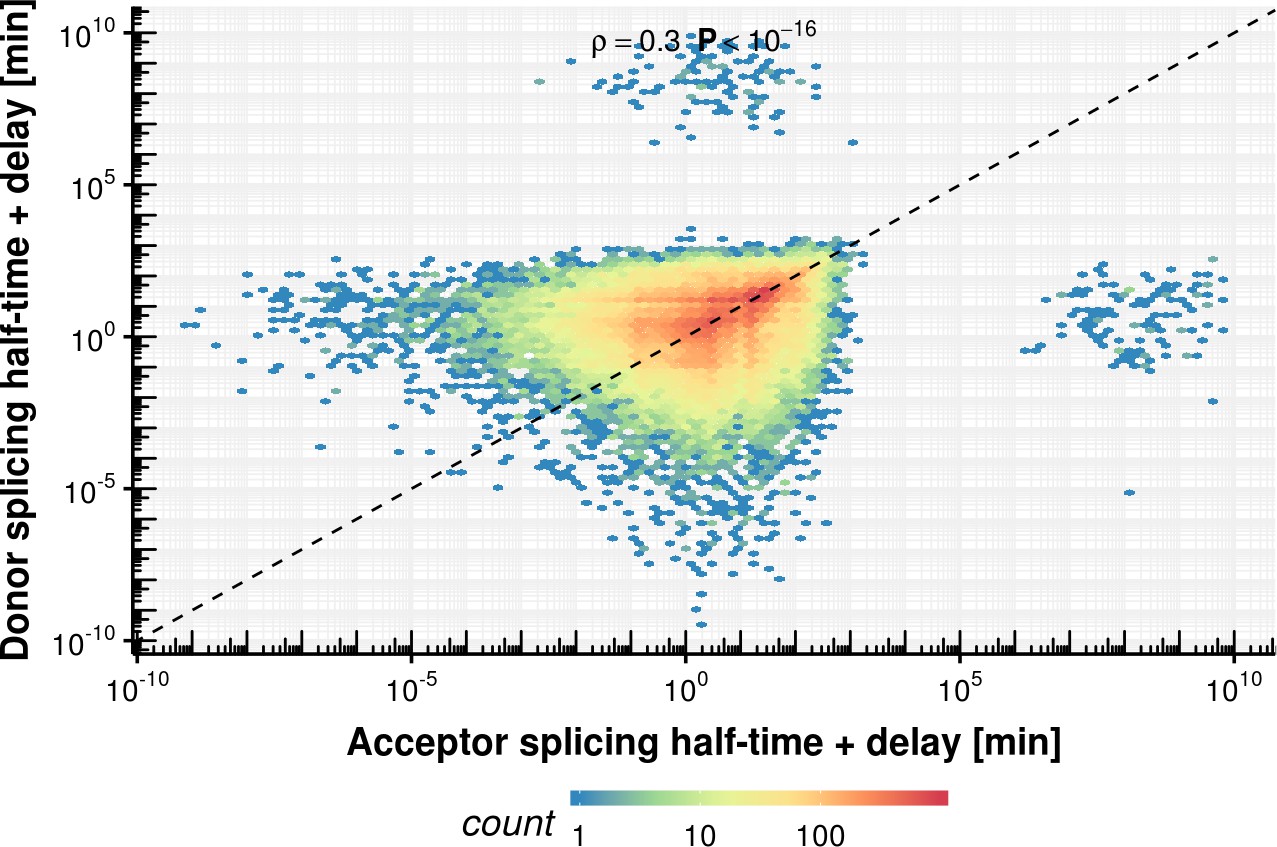
Acceptor vs. donor sum of splicing half-time and delay estimation based on the fixed delay model.
https://doi.org/10.7554/eLife.45056.047
Appendix 1—figure 23
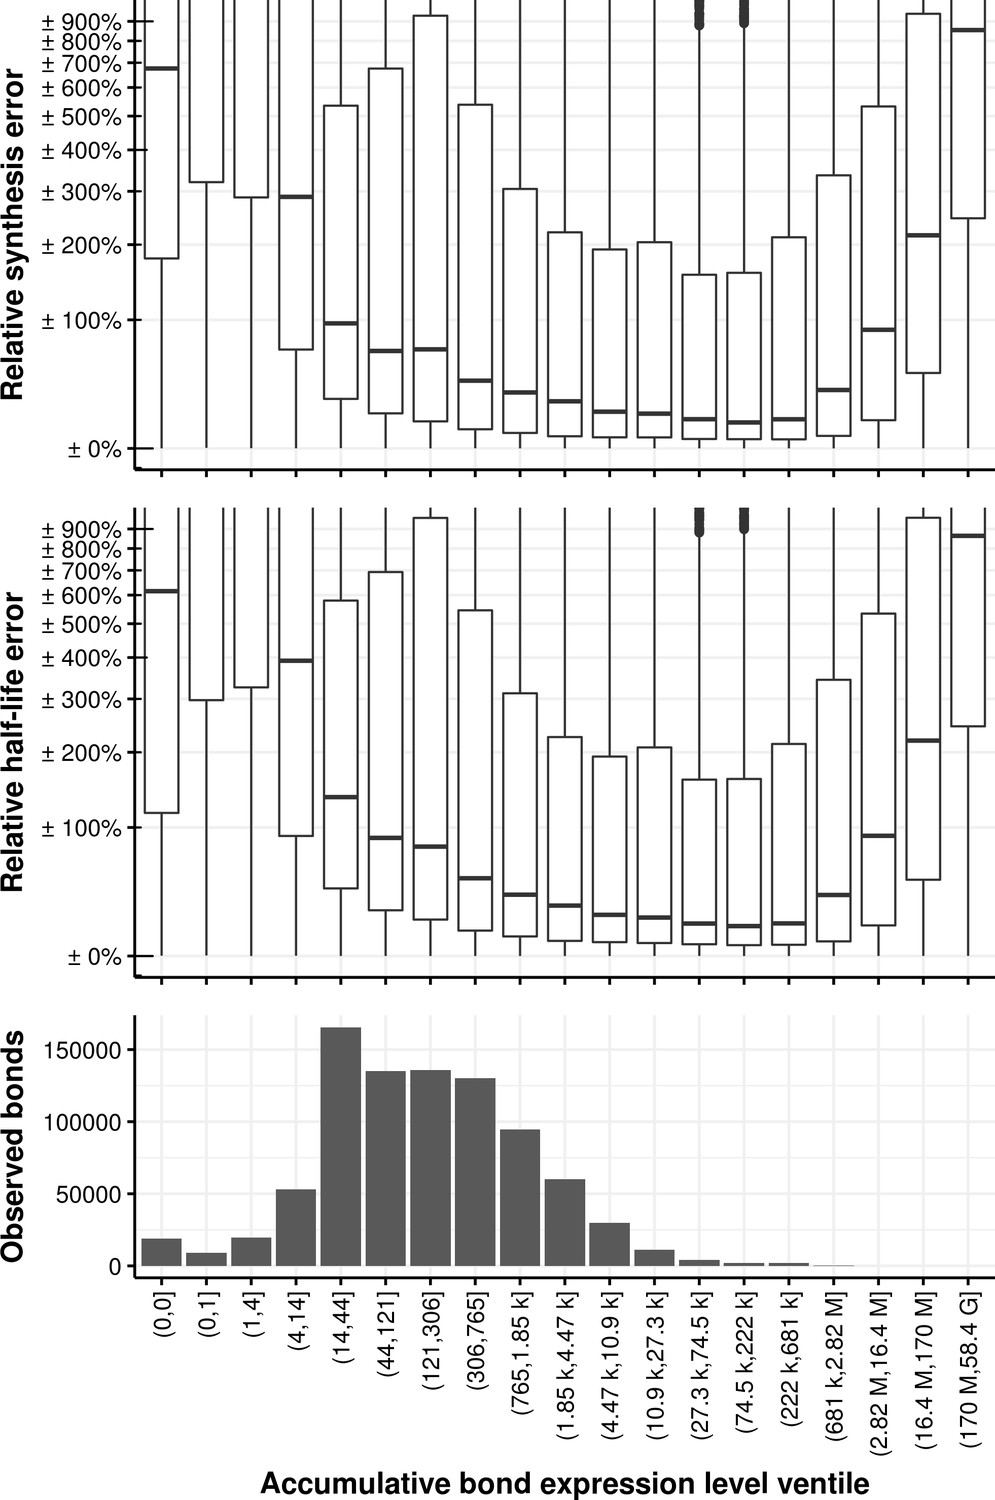
Relative synthesis rate and half-life error vs. the accumulative bond read count accumulated in all samples and binned in its ventiles.
The first bin comprises the first two ventiles.
Appendix 1—figure 24
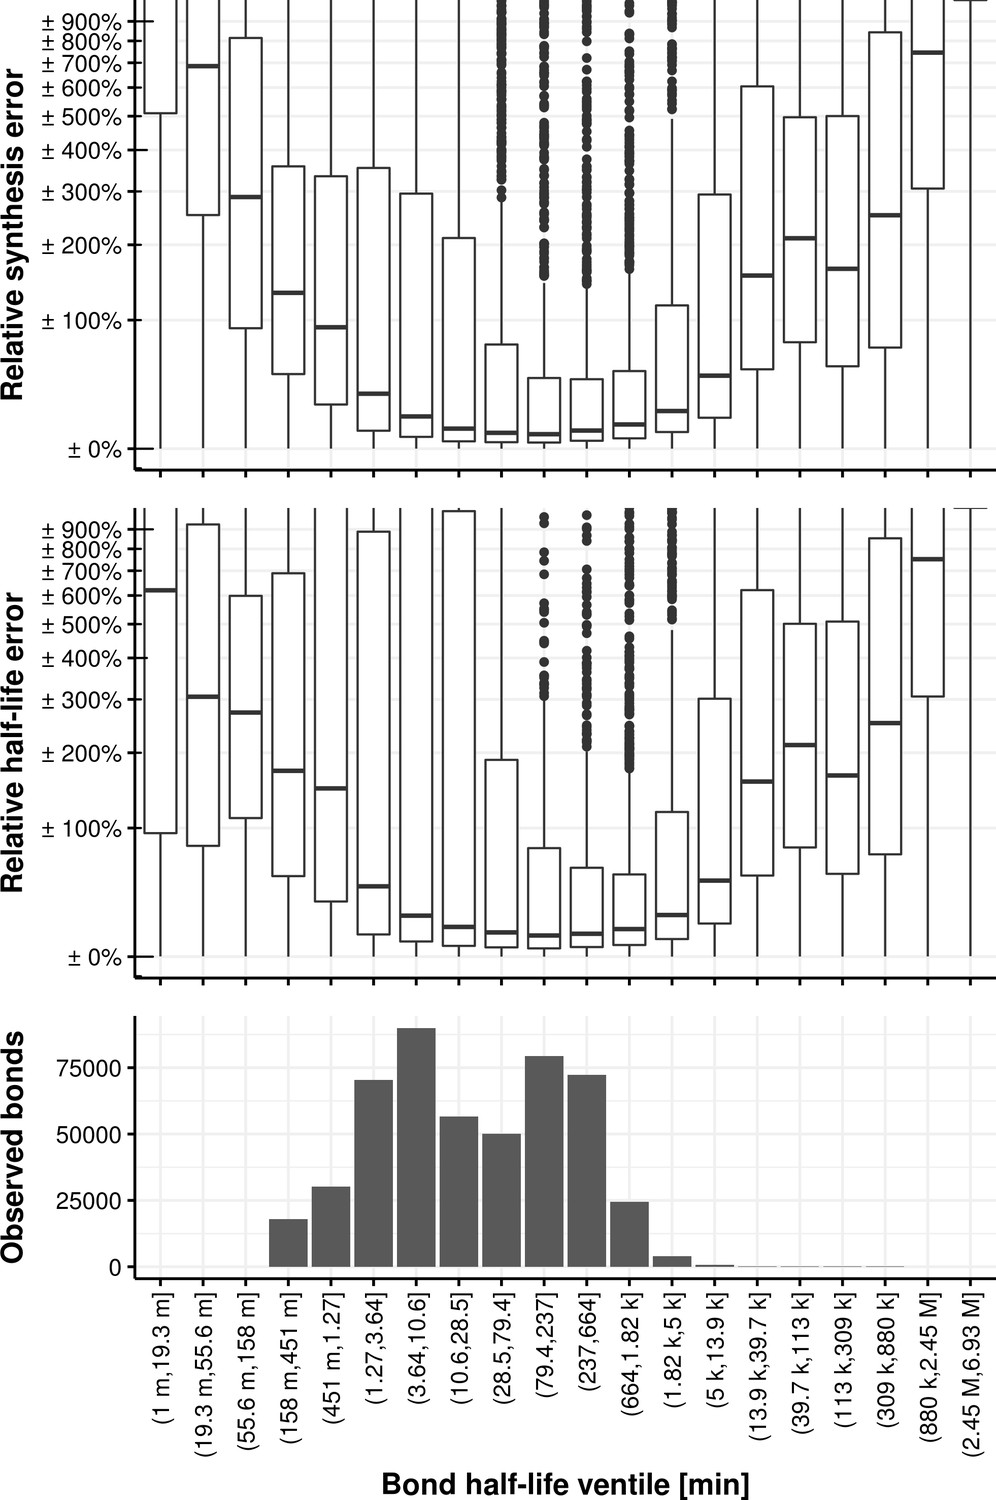
Relative synthesis rate and half-life error vs. the bond half-life binned in its ventiles.
https://doi.org/10.7554/eLife.45056.049
Appendix 1—figure 25

Relative synthesis rate and half-life error vs. the bond synthesis rate binned in its ventiles.
https://doi.org/10.7554/eLife.45056.050
Appendix 1—figure 26
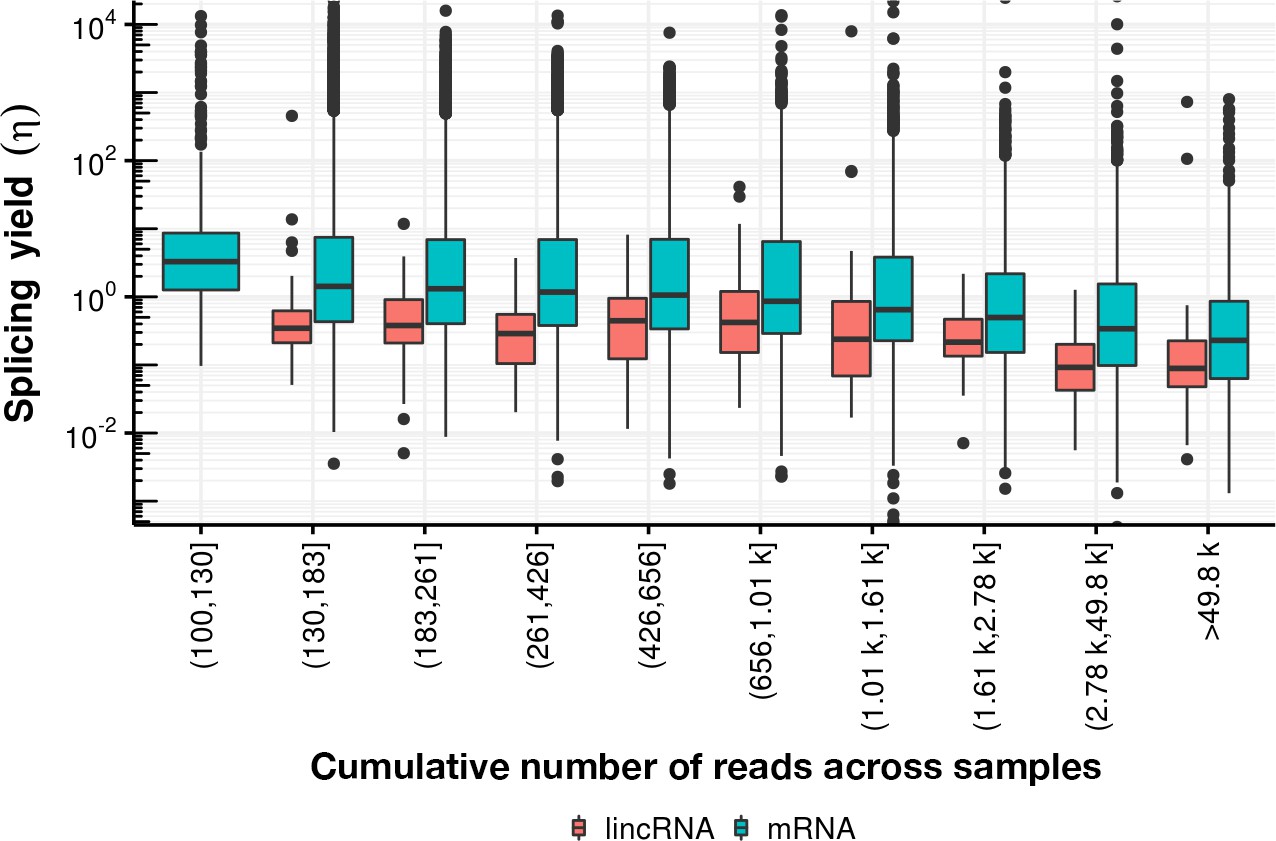
Splicing yield distribution (boxplot) of lincRNA (red) and mRNA (blue) stratified by bins of cumulative number of reads across all samples.
Although yield correlates negatively with the cumulative number of reads, indicative of potential estimation bias, the mRNA yield remains higher than the lincRNA yield in every stratum.
Appendix 1—figure 27
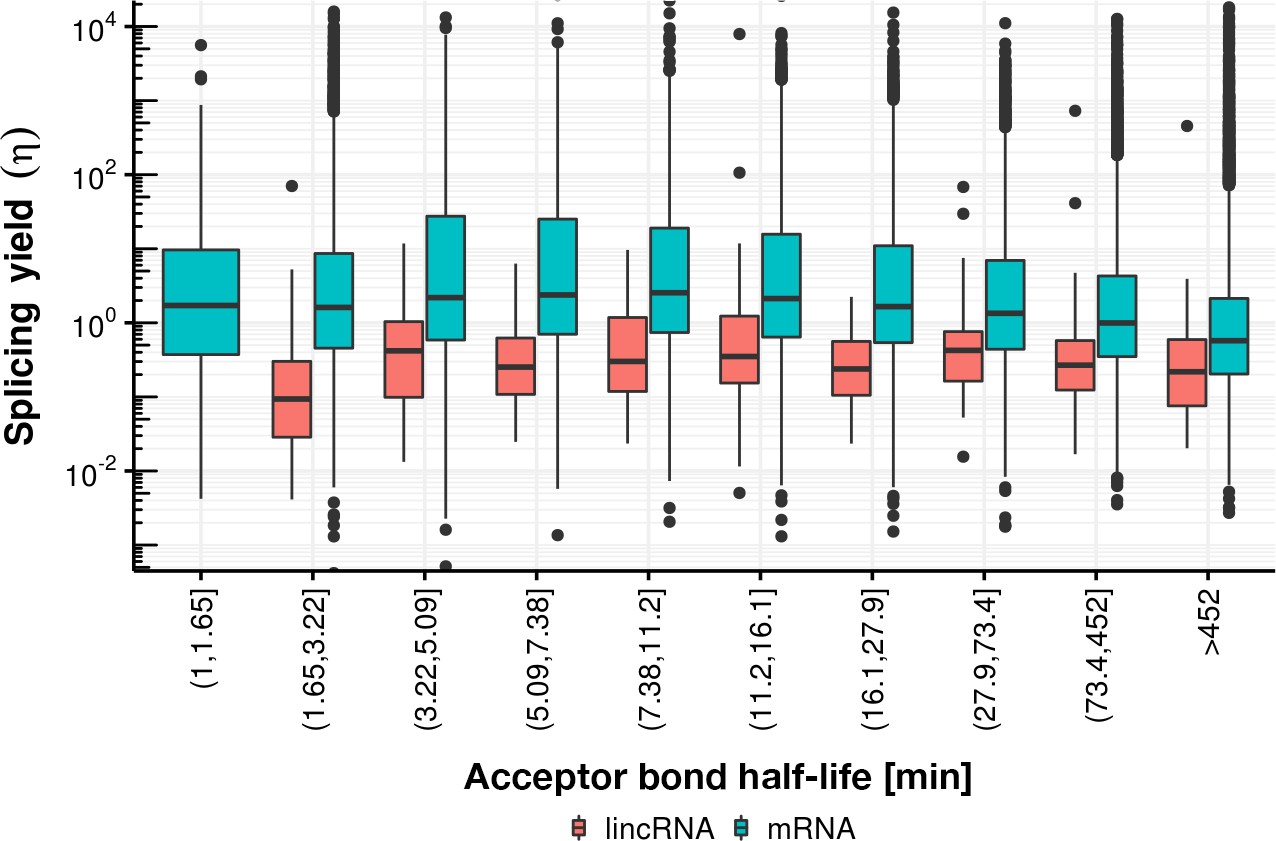
Splicing yield distribution (boxplot) of lincRNA (red) and mRNA (blue) stratified by bins of acceptor bond half-life.
Although yield correlates negatively with acceptor bond half-life (for half-life larger than 16 min), indicative of potential estimation bias, the mRNA yield remains higher than the lincRNA yield in every stratum.
Tables
Key resources table
| Reagent type (species) or resource | Designation | Source or reference | Identifiers | Additional information |
|---|---|---|---|---|
| Cell line (Homo sapiens; female) | K562 chronic myeloid leukemia in blast crisis | DSMZ | DSMZ Cat# ACC-10, RRID:CVCL_0004 | |
| Commercial assay or kit | Plasmo Test Mycoplasma Detection Kit | InvivoGen, San Diego, CA USA | rep-pt1 | |
| Commercial assay or kit | Ovation Universal RNA-Seq System | NuGEN, Leek, The Netherland | 0343–32 | |
| Chemical compound, drug | 4-thiouracil | Carbosynth, UK | NT06186 | CAS 13957-31-8 |
| Software | STAR | https://github.com/alexdobin/STAR | RRID:SCR_015899 | |
| Software | Picard | http://broadinstitute.github.io/picard/ | RRID:SCR_006525 | |
| Software | Salmon | https://combine-lab.github.io/salmon/ | RRID:SCR_017036 | |
| Software | glmnet | https://cran.r-project.org/web/packages/glmnet/index.html | RRID:SCR_015505 | |
| Software | PyMOL | https://pymol.org/2/ | RRID:SCR_000305 | |
| Software | LaBranchoR | https://kipoi.org/models/labranchor | ||
| Software | CleTimer | https://kipoi.org/models/CleTimer | ||
| Software | rCube | https://github.com/gagneurlab/rCube | Last commit number: 463119 |
Appendix 1—table 1
Rate definitions of phophodiester bonds.
https://doi.org/10.7554/eLife.45056.024| Phosphodiester bond | Steady-state synthesis rate | Steady-state degradation rate |
|---|---|---|
| Donor | ||
| Acceptor | ||
| Junction |
Appendix 1—table 2
Relations of different splicing quantities.
Square brackets stand for concentrations. The lariat is a spliced-out intron, known to be quickly degraded. Because lariat degradation rate may not be faster than splicing rate, we therefore consider it in the model of the concentration of intronic reads.
| Steady-state quantity | Value |
|---|---|
| 3’SS or 5´SS intron-exon ratio (Khodor et al., 2011) | |
| Splicing efficiency (Převorovský et al., 2016) | |
| Splicing Index (Schlackow et al., 2017) |
Additional files
-
Supplementary file 1
Coordinates (start, stop, strand, chromosome) of all junctions (exon – exon boundaries) with at least 10 reads in all samples.
- https://doi.org/10.7554/eLife.45056.016
-
Supplementary file 2
Synthesis rate and half-life time of donor, acceptor and junction bonds estimated using different models as well as splicing yield estimates for junction bonds.
Each bond is annotated based on GENCODE and major isoform estimation was done using the software Salmon.
- https://doi.org/10.7554/eLife.45056.017
-
Supplementary file 3
Synthesis rate, mean donor-bond and acceptor-bond half-life and junction-bond half-life aggregated by median of all introns belonging to the major isoform determined by Salmon.
- https://doi.org/10.7554/eLife.45056.018
-
Supplementary file 4
Single nucleotide multiplicative effects on the donor-bond or acceptor-bond half-life.
For each position, it is annotated whether there is a known contact between a spliceosomal structure and the processed RNA.
- https://doi.org/10.7554/eLife.45056.019
-
Supplementary file 5
Octamer multiplicative effects on the donor-bond or acceptor-bond half-life and their match to ATtRACT database.
- https://doi.org/10.7554/eLife.45056.020
-
Supplementary file 6
Spike-in sequences used in the experiment and oligonucleotides sequences used in RT-qPCR to amplify selected regions of 4sU-labeled and unlabeled spike-ins.
- https://doi.org/10.7554/eLife.45056.021
-
Transparent reporting form
- https://doi.org/10.7554/eLife.45056.022
Download links
A two-part list of links to download the article, or parts of the article, in various formats.
Downloads (link to download the article as PDF)
Open citations (links to open the citations from this article in various online reference manager services)
Cite this article (links to download the citations from this article in formats compatible with various reference manager tools)
Global donor and acceptor splicing site kinetics in human cells
eLife 8:e45056.
https://doi.org/10.7554/eLife.45056


