Attentional amplification of neural codes for number independent of other quantities along the dorsal visual stream
- CEA DRF/JOLIOT, INSERM, Université Paris-Sud, Université Paris-Saclay, NeuroSpin Center, France
- University of Trento, Italy
- CEA DRF/JOLIOT, Université Paris-Saclay, NeuroSpin Center, France
Figures
Figure 1 with 1 supplement
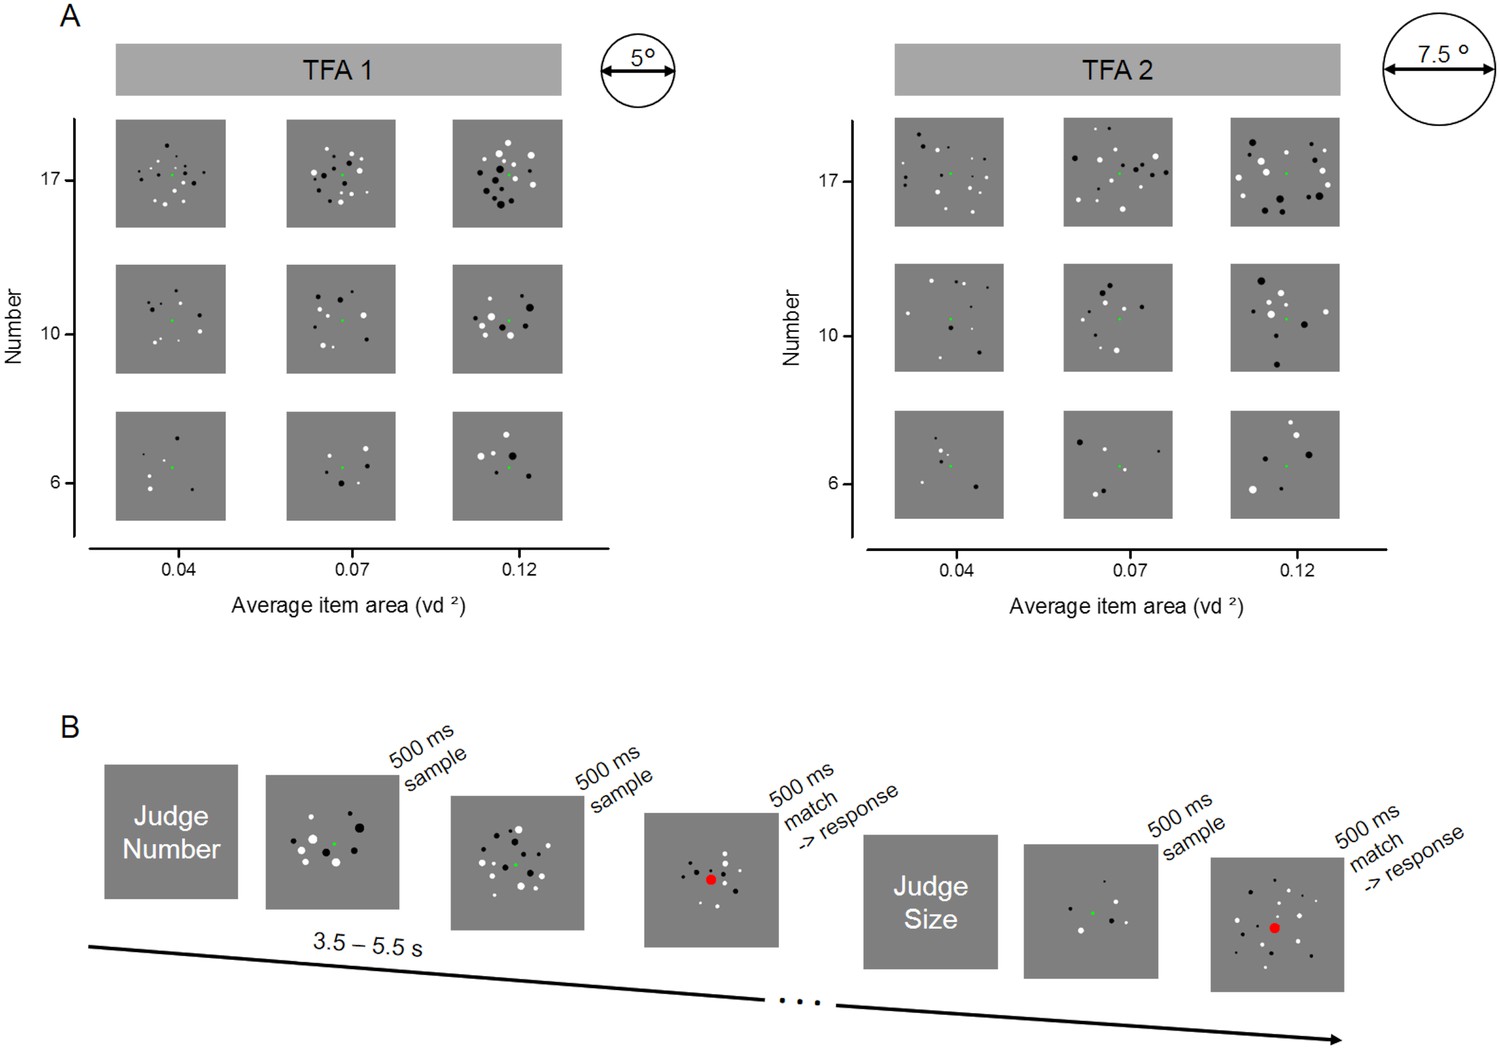
Stimulus set and design for the fMRI experiment.
(A) Example of the full set of stimulus conditions. Arrays of six, ten or seventeen dots were created with three average item areas (0.04, 0.07 and 0.12 visual degree2) and displayed within two total field areas, enclosed by imaginary circles of 5° (TFA 1) and 7.5° (TFA 2) diameter. (B) Illustration of the trials’ temporal presentation and paradigm during scanning. At the beginning of each block, written instructions informed participants about the dimension to attend: either the numerosity or the average size of the dots arrays. Participants were instructed to keep in memory the relevant dimension of each sample trial until the following trial was shown (after a variable time interval of 3.5–5.5 s). The color of the fixation point in the upcoming trial provided further instruction: if it remained green, participants had to update their memory with the new stimulus (new sample trial), while if it turned red, participants had to compare the current stimulus (match trial) with the one kept in memory, and to indicate by button press whether the match stimulus was larger or smaller than the sample on the attended dimension. After the response a new sample stimulus appeared after at least 8 s. FMRI analyses focused on activity evoked by sample stimuli only.
Figure 1—figure supplement 1
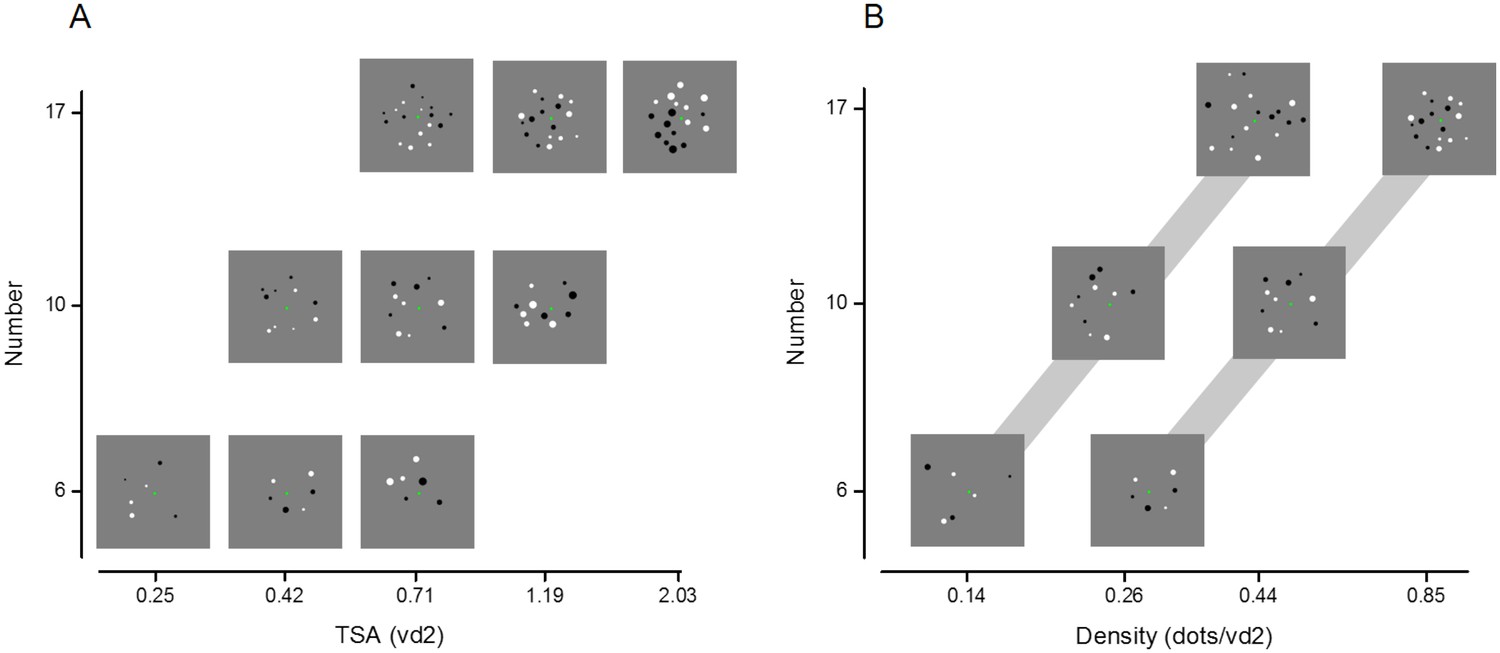
Additional illustration of stimulus set.
Example of stimulus conditions showing approximately how number varies as a function of total surface area (A) and density (B). Images in (A) are taken from the small total field area set (but the same relationship between number and total surface area holds for the large total field area). Images in (B) are taken from the medium average item size (but the same relationship holds for the small and large average item size) and the gray bar links the images with same total field area, either large (left) or small (right).
Figure 2
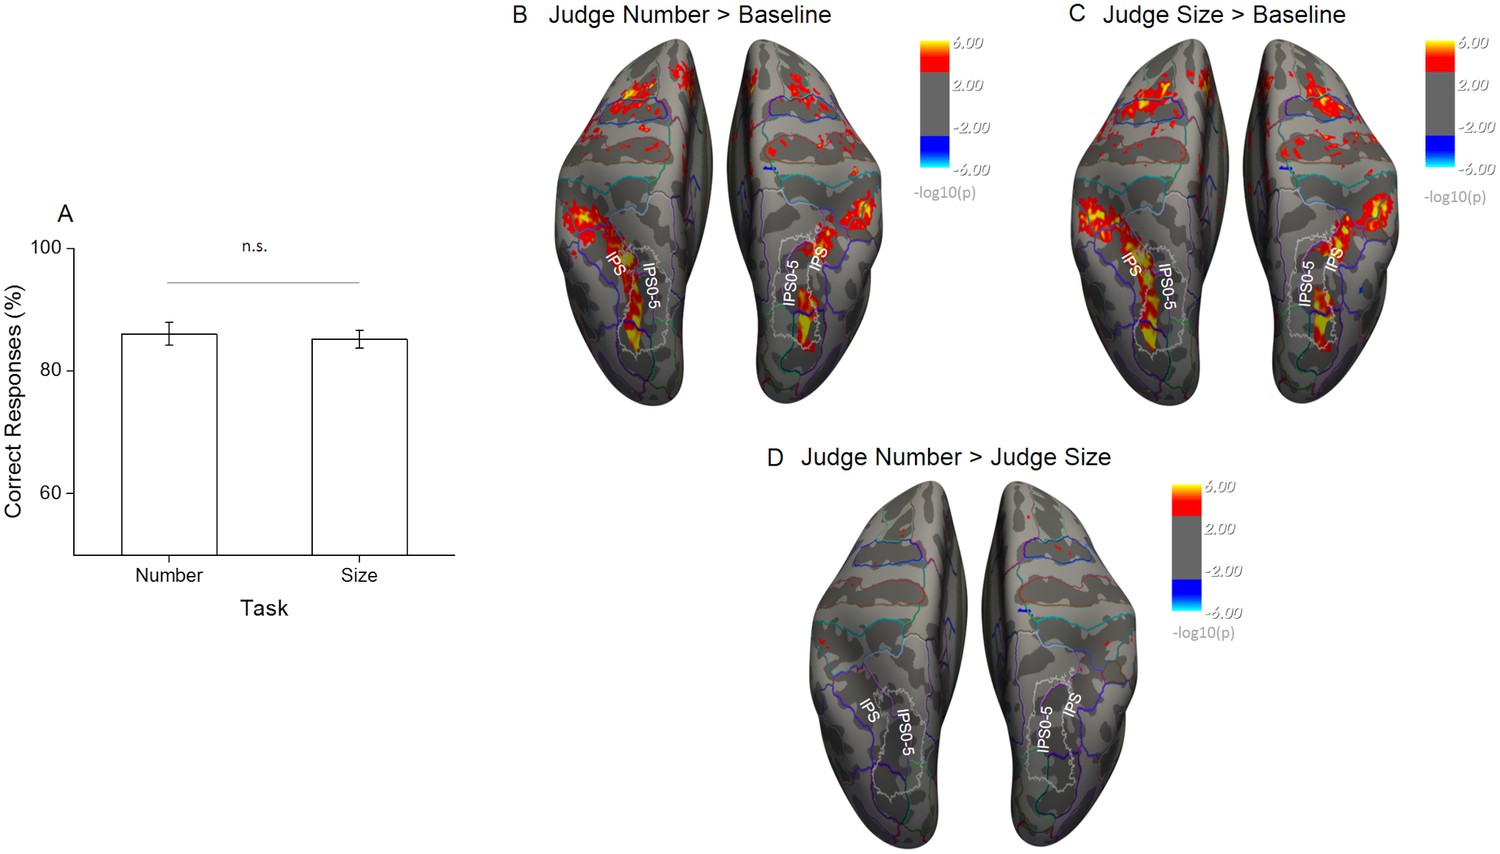
Behavioral performance during scanning and univariate effects of task.
(A) The percentage of correct responses to match stimuli for the two tasks performed during scanning shows that task difficulty was successfully matched (n = 20, mean ± standard error of the mean (SEM)). (B–D) Statistical results obtained from the surface based group analysis (n = 20). The maps show the activation elicited for all sample trials during the number task (B) and the size task (C) when contrasted against the implicit baseline and against each other (D). Activation maps are thresholded at p < 0.001, uncorrected for multiple comparison, and displayed on Freesurfer’s fsaverage surface with colored outlines identifying the major anatomical sulci and gyri based on the Destrieux Atlas (Fischl, 2004) and white outlines the field maps IPS0-5 based on visual topography (Wang et al., 2015).
Figure 3 with 2 supplements
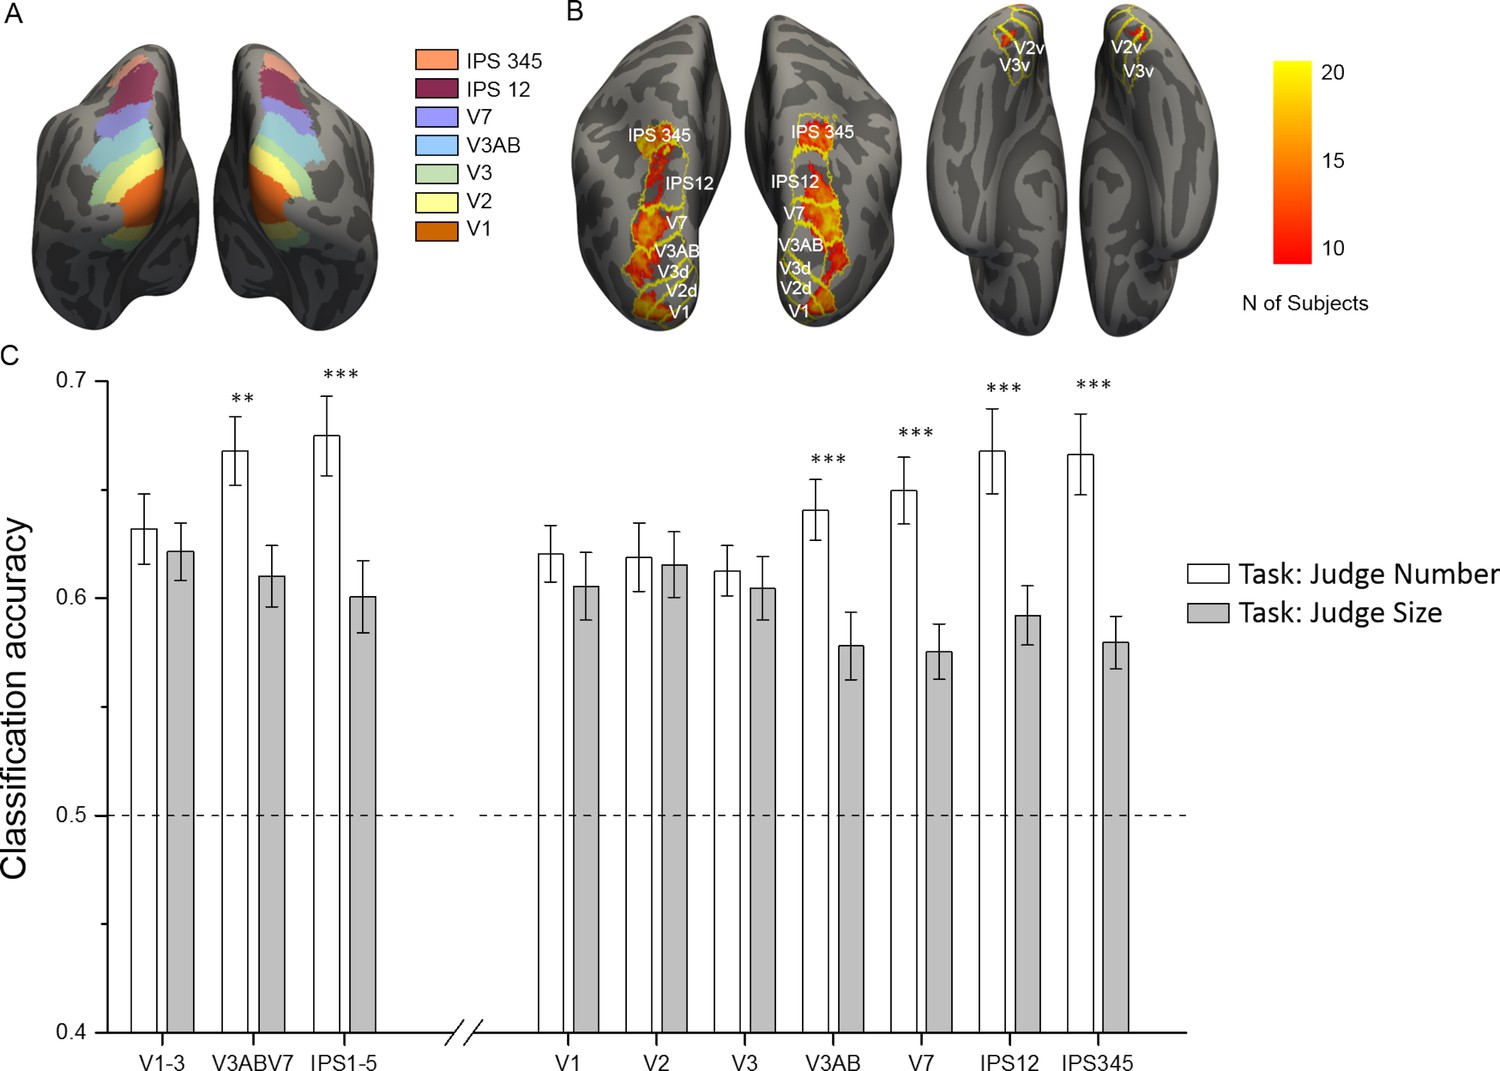
ROI localization and results of multivariate classification for discrimination between numerosities as a function of the task.
(A) Color-coded ROIs defined by the probabilistic atlas are shown on the inflated brain template. (B) Across-subject overlap map of the most activated voxels in the contrast all sample > baseline. For each subject the most activated voxels were selected from each ROI (outlines) and hemisphere and the color map shows the number of subjects for which a given location was selected. (C) Sample numerosities could be classified significantly above chance across all the combined (left side) and individual (right side) ROIs, both during the number (white bars) and size (gray bars) task. The classification performance is strongly modulated by task only in the intermediate and higher-level ROIs, starting from V3AB on, but not in the early areas (V1, V2 and V3). Results show mean classification accuracy across subjects (n = 20) ± standard error of the mean (SEM). Stars mark the difference across tasks, not against chance level (which is significant for all regions and tasks; see Supplementary file 1 for statistical results).
Figure 3—figure supplement 1
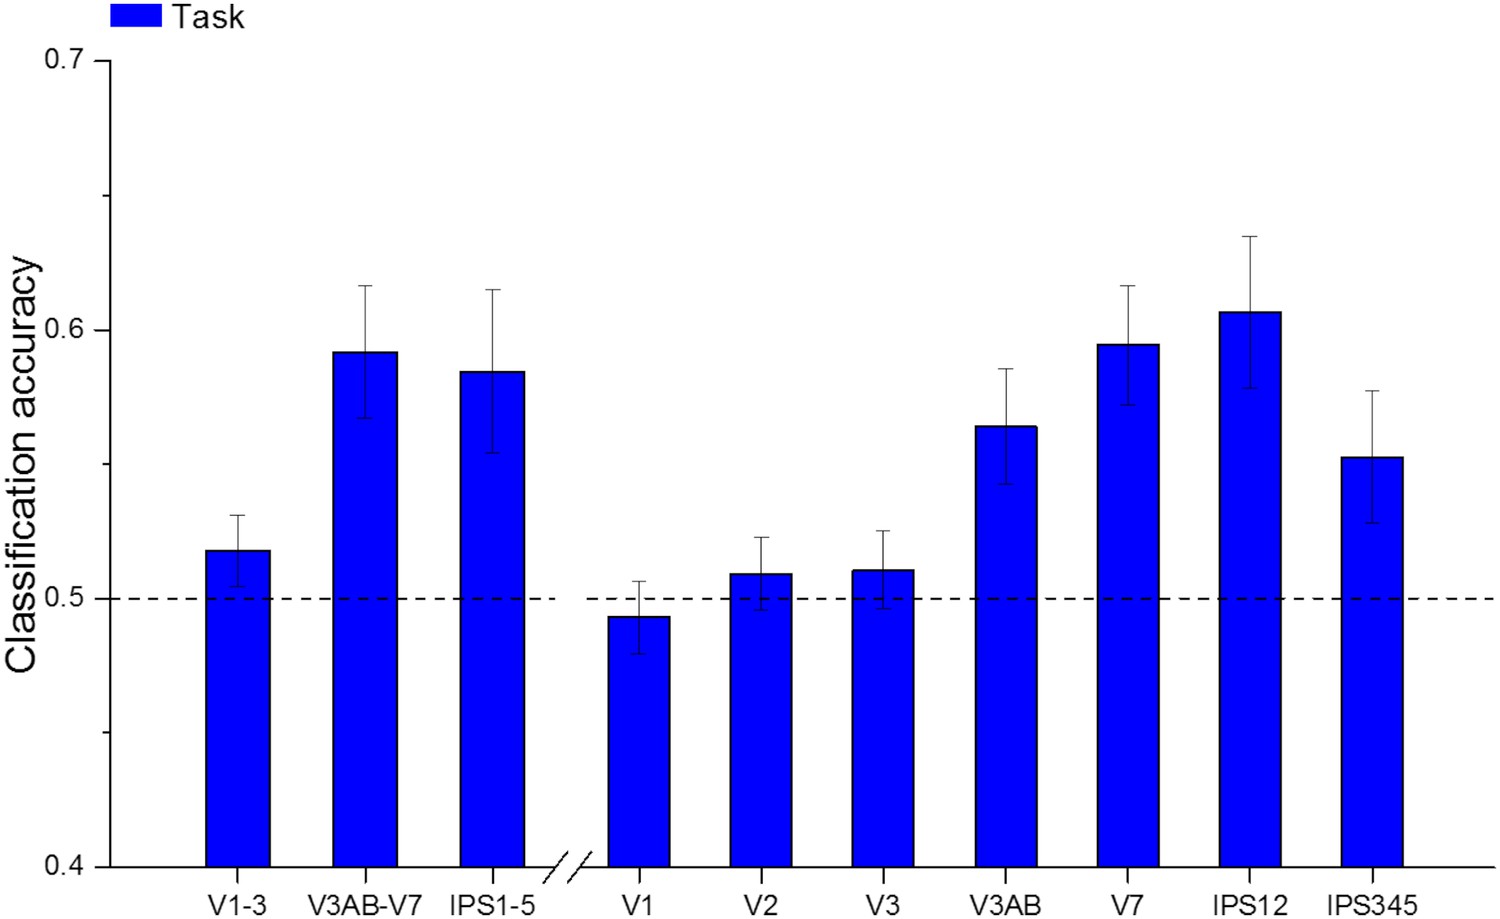
Results of multivariate classification for discrimination between tasks.
Task (judge number vs judge size) could be classified significantly above chance in intermediate (V3AB-V7) and higher level (IPS 1–5) regions, but not in early visual areas (V1-3). ANOVA on the merged regions revealed a significant effect of ROI (F(1.42,27.07) = 6.623, p = 0.0090). The classification accuracy significantly increases when proceeding across the visual hierarchy starting to be above chance from V3AB on, but not in the early areas (V1, V2 and V3). ANOVA on the individual ROIs showed a significant main effect of ROI (F(2.67,50.79) = 11.027, p < 10−4)). The bar graph shows mean classification accuracy across subjects (n = 20) ± standard error of the mean (SEM). Detailed results of the two-tailed t-tests against 0.5 (chance level) used to evaluate the significance of task classification reported in Supplementary file 3.
Figure 3—figure supplement 2
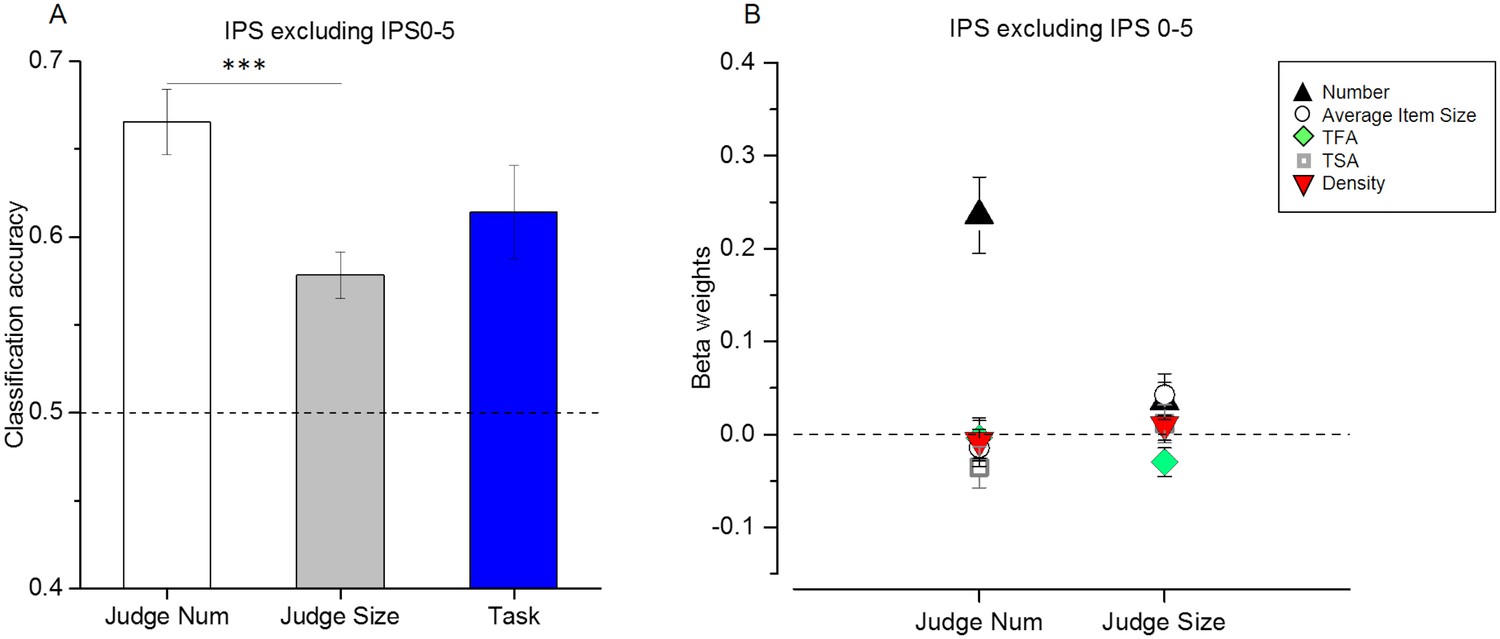
Results for the ROI defined along IPS excluding IPS0-5.
(A) Results of multivariate classification for discrimination between numerosities during the number (white bar) and size (gray bar) task and for discrimination between tasks (blue bar). Sample numerosities could be classified significantly above chance both during the number (t-test against chance: t(19) = 8.94, p < 10−6) and size (t-test against chance: t(19) = 5.87, p = 0.000001) task, and the classification performance was modulated by task (paired t-test: t(19) = 4.50, p = 0.0002). Task could also be significantly discriminated in this region (t(19) = 4.3, p = 0.0004). While number could be discriminated to a similar extent in this region and in the IPS1-5 ROI (t-test across ROIs: t(19) = 0.66, p = 0.5), classification accuracy for discrimination between tasks was significantly higher in IPS excluding IPS0-5 ROI (t-test across ROIs: t(19) = 2.39, p = 0.03). The bar graph shows mean classification accuracy across subjects (n = 20) ± standard error of the mean (SEM). P-values indicating the significance of the classification accuracy for number during different tasks and for task are reported in Supplementary file 4a and 4b, respectively. (B) Beta weights obtained from the RSA multiple regression for number (black triangles), average item size (circles), total field area (TFA, diamonds), total surface area (TSA, squares) and density (red triangles) for the number and size task. Only betas for number are significantly above zero (t(19) = 5.74, p = 0.00001) during the number task, however this value dropped to just not-significant values (t(19)=1.78, p = 0.09) during the size task. Beta values for the other dimensions were never significantly different from zero. Data points show mean beta weights across subjects (n = 20) ± standard error of the mean (SEM). P-values testing the significance of the beta coefficients for each dimension are reported in Supplementary file 4c.
Figure 4
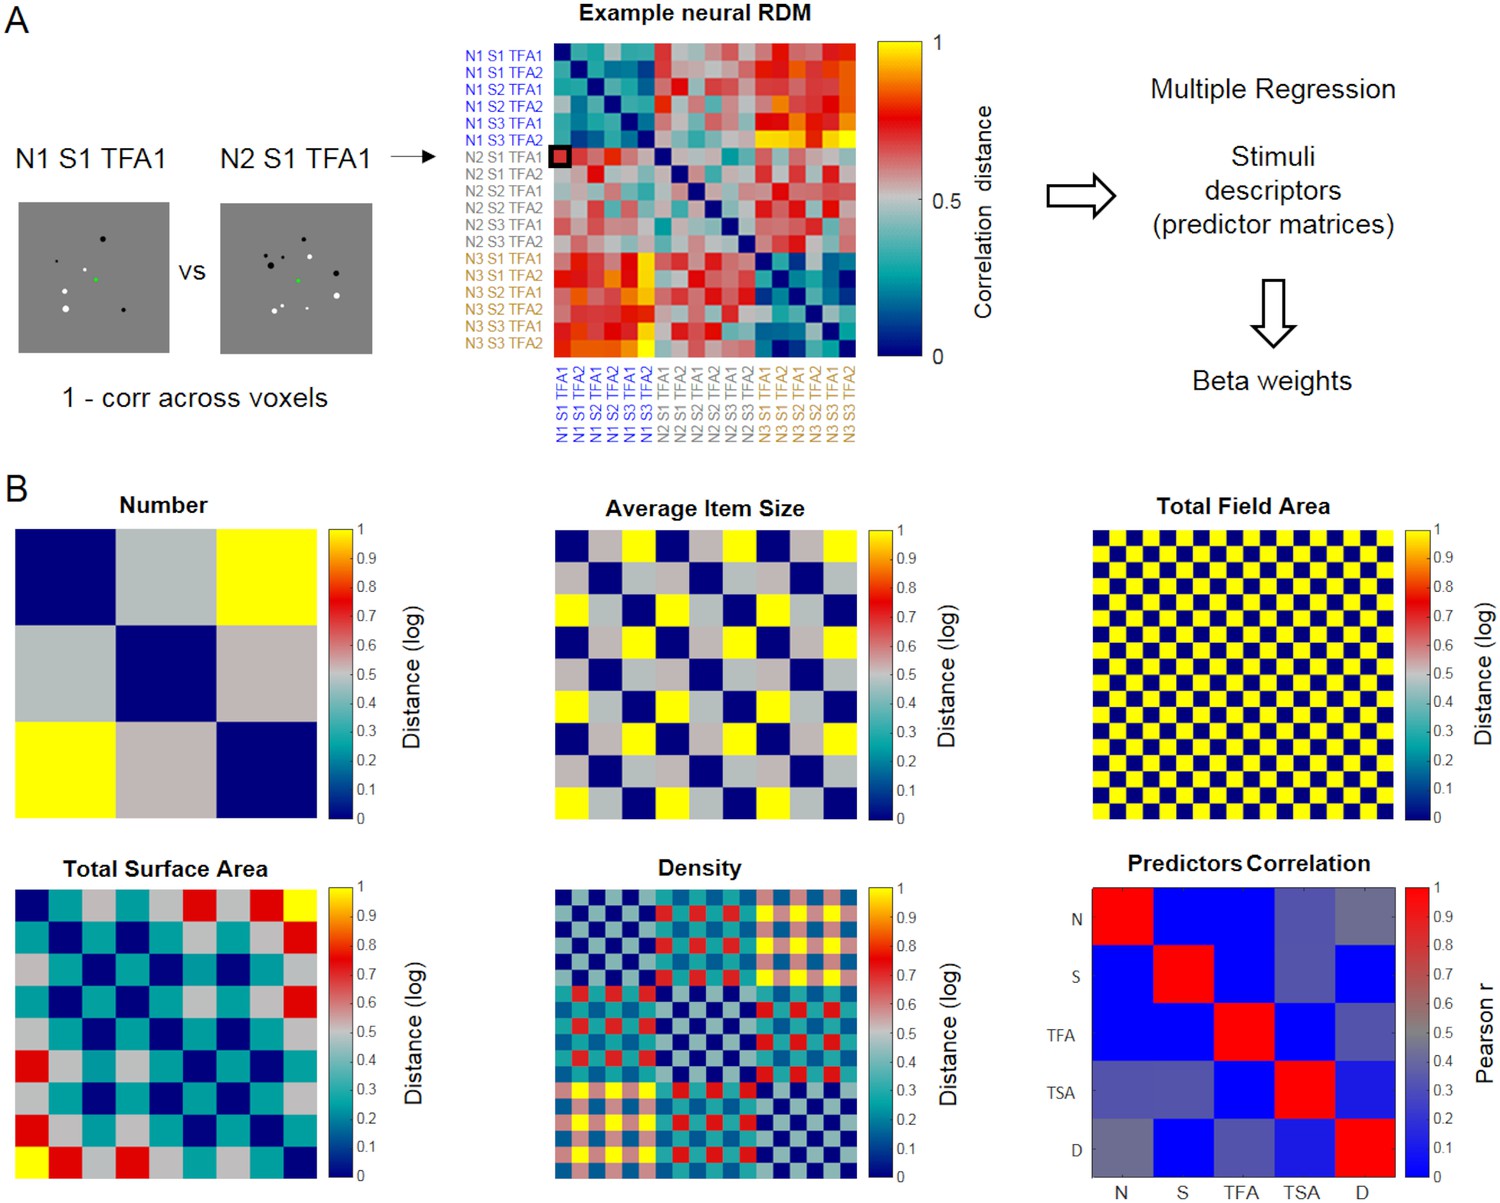
Schematic illustration of representational similarity analysis.
Neural representational dissimilarity matrices (RDM) derived from fMRI were entered into a multiple regression where predictors corresponded to five matrices describing the dissimilarities across stimulus conditions along numerical and non-numerical dimensions. (A) Example neural RDM, quantifying the correlation distance (1 – Pearson correlation) between the patterns of activity elicited by all possible pairs of stimulus conditions across voxels within a given ROI (matrix scaled between 0 and 1 for visualization purposes). Each cell represents the correlation distance between activity patterns associated with a given pair of stimulus conditions (relatively lower values indicate more similar, and higher values more dissimilar patterns, respectively). The total of 18 conditions correspond to the combinations of 3 numerosities (N1, N2 and N3 corresponding to 6, 10 and 17 dots), three average item sizes (S1, S2 and S3 corresponding to small, medium and large average item sizes) and two total field areas (TFA1 and TFA2 corresponding to small and large total field area). The labels’ colors follow changes along the numerical dimension. (B) The five dissimilarity matrices used as predictors in the multiple regression analysis represent the logarithmic distance between pairs of stimuli in terms of number, average item size, total field area, total surface area and density (all matrices scaled between 0 and 1 for visualization purposes). The correlation across these five predicted matrices is shown in the ‘predictor correlation’ matrix.
Figure 5 with 2 supplements
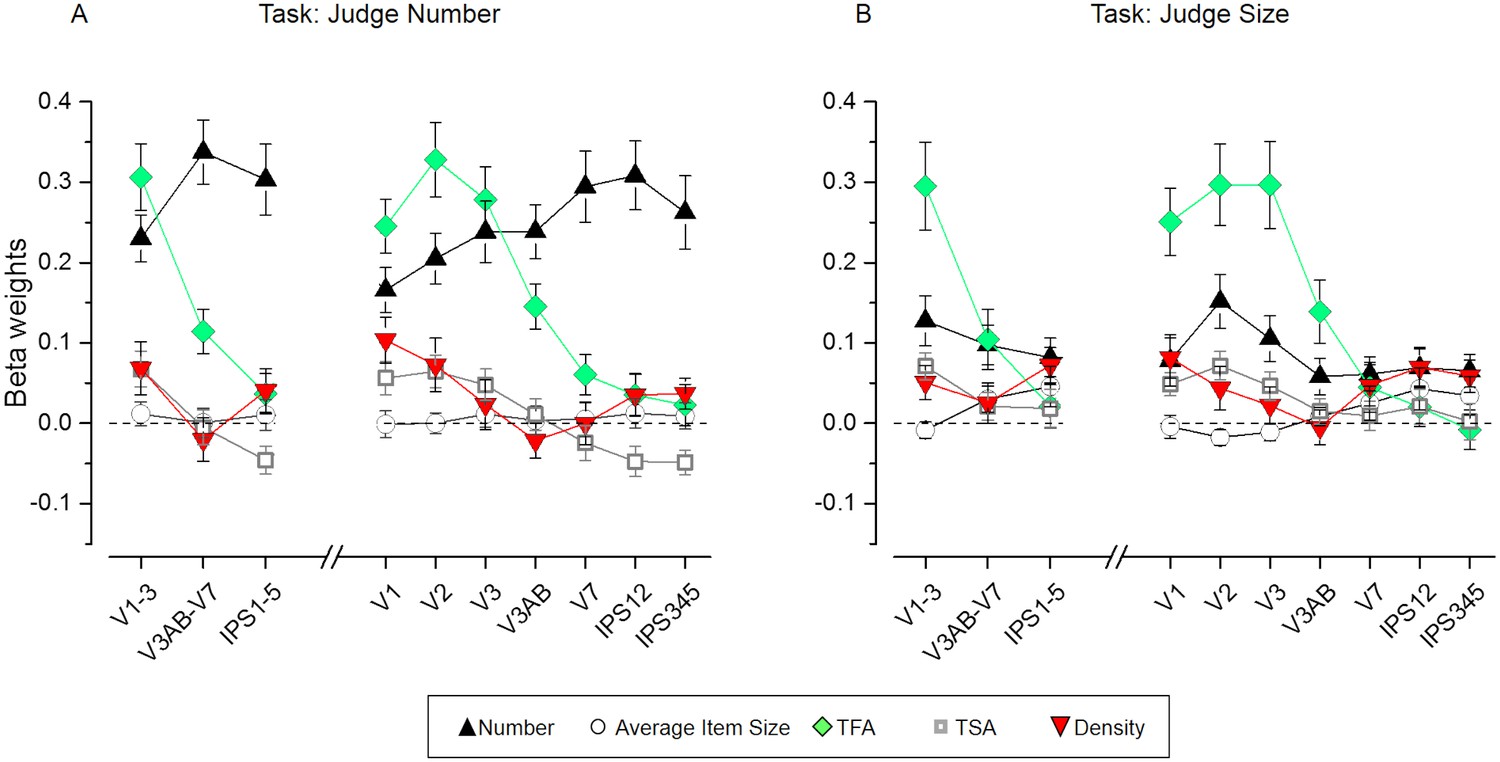
Results of the representational similarity analysis.
Beta weights obtained from the RSA multiple regression analysis for number (black triangles), average item size (circles), total field area (TFA, diamonds), total surface area (TSA, squares) and density (red triangles) for the number (A) and size (B) task. While the fMRI pattern dissimilarity in early visual areas reflected contributions of multiple properties (TFA, density, TSA, but also number on top of these), when attending to number (A) the dissimilarity matrix for number increasingly better explained the fMRI pattern dissimilarity when progressing towards higher areas of the dorsal visual stream, where the contribution of non-numerical dimensions was smaller. The dissimilarity matrix for number however, contributed much less to explain neural dissimilarity in mid- and higher-level ROIs during the size task (B). The contribution of the non-numerical dissimilarity matrices remained mostly unaffected in most of the ROIs, with only a slightly enhanced contribution of the dissimilarity matrix for density which significantly contributed to explain the neural RDMs in higher areas during the size judgments. Data points show mean beta weights across subjects (n = 20) ± standard error of the mean (SEM). P-values testing the significance of the beta coefficients for each dimension and ROI are reported in Supplementary file 1.
Figure 5—figure supplement 1
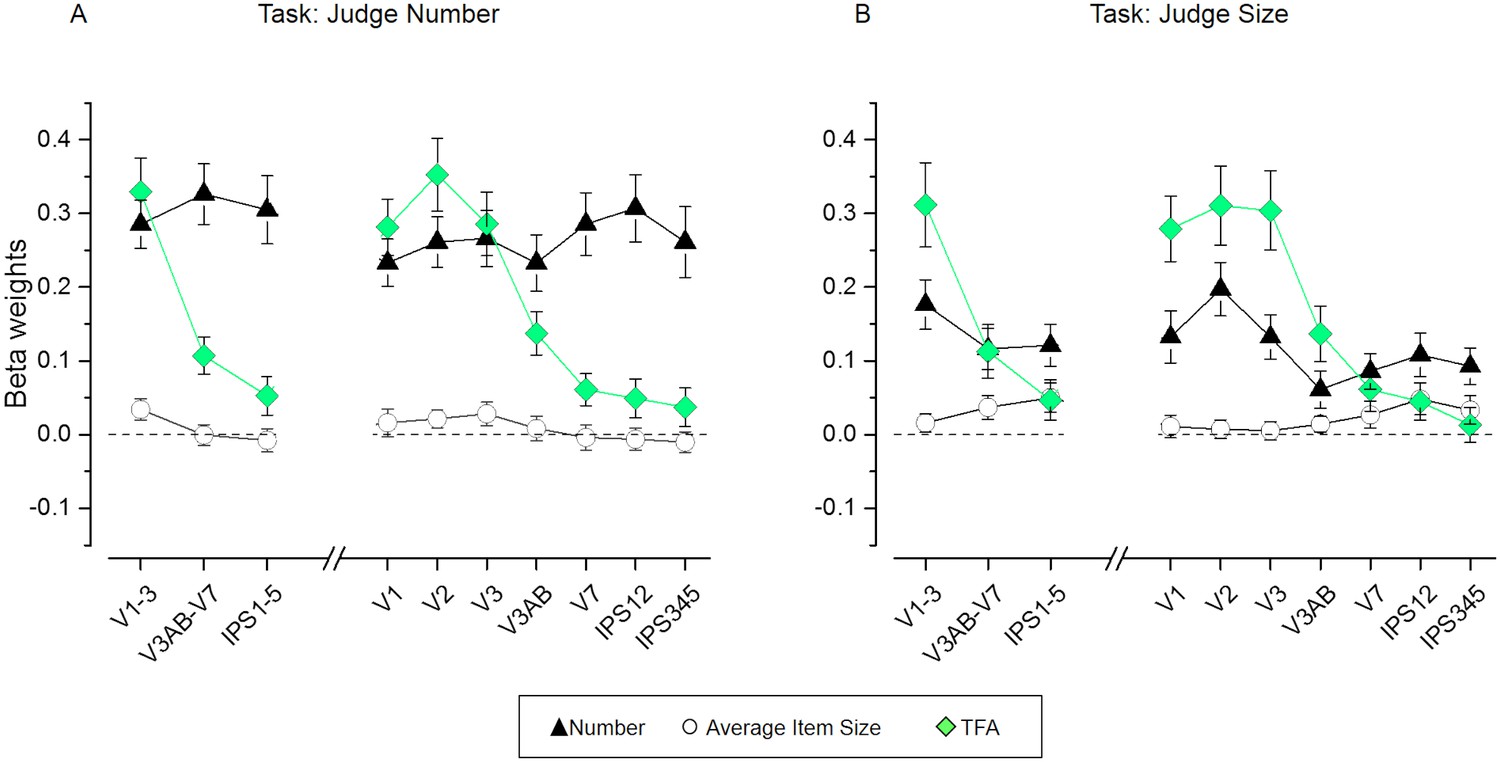
Results of the representational similarity analysis for a model including only number, average item size and total field area as predictors.
Beta weights obtained from the RSA multiple regression for number (black triangles), average item size (circles), total field area (TFA, diamonds) for the number (A) and size (B) task. The triple interaction between ROI, task and dimension was significant both for the three large regions: F(2.86,54.43) = 4.73, p = 0.006 as well as for the individual regions: F(4.52,85.95) = 3.34, p = 0.01. When quantifying the changes in beta weights across ROIs and tasks for each dimension separately, the interaction between these factors was close to significance for number (for the three large regions: F(1.48,28.19) = 3.49, p = 0.0569; for the individual regions: F(2.25,42.69) = 2.92, p = 0.0589). The interaction between ROI and task was significant for average item size (for the three large regions: F(1.74,33.12) = 5.32, p = 0.01; for the individual regions: F(2.70,51.22) = 3.07, p = 0.04), however the near zero beta values estimated for this dimension make this result difficult to interpret, and not significant for total field area (for the three large regions: F(1.51,28.69) = 0.22, p = 0.74; for the individual regions: F(2.87,54.47) = 0.67, p = 0.56). Data points show mean beta weights across subjects (n = 20) ± standard error of the mean (SEM). P-values indicating the significance of the beta coefficients for each dimension and ROI are reported in Supplementary file 5.
Figure 5—figure supplement 2
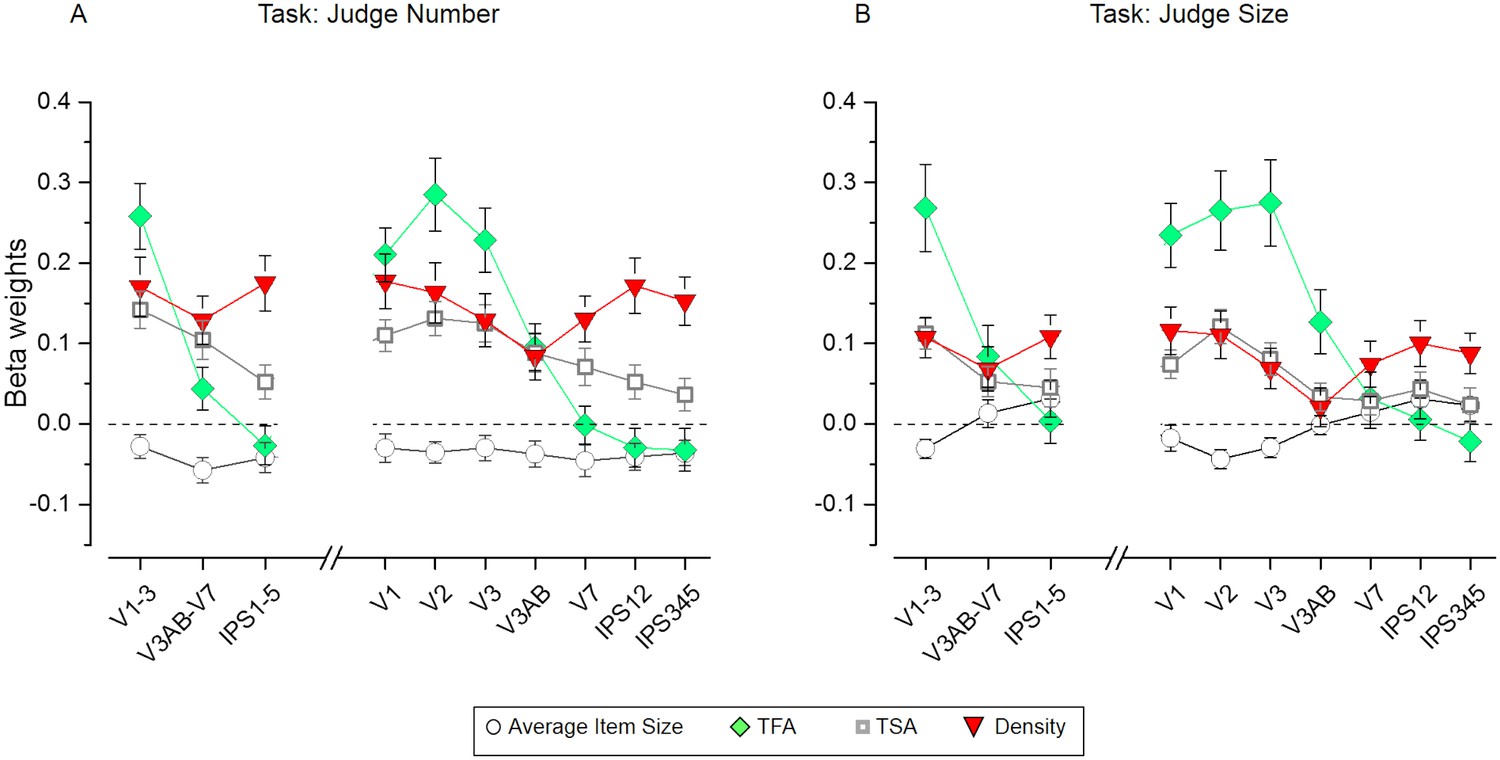
Results of the representational similarity analysis for a model including all the non-numerical dimensions only (i.e. average item size, total field area, total surface area and density).
Beta weights obtained from the RSA multiple regression for average item size (circles), total field area (TFA, diamonds), total surface area (TSA, squares) and density (Density, red triangles) for the number (A) and size (B) task. The beta estimates for these non-numerical features were not differentially affected by task across ROIs, as demonstrated by the not significant triple interaction between ROI, task and dimension both for the three large regions: (F(4.12,78.24) = 1.11, p = 0.36) as well as for the individual regions (F(5.66,107.50) = 0.88, p = 0.50). However the interaction between task and dimension was significant both for the three large regions: (F(2.13,40.42) = 3.65, p = 0.03) as well as for the individual regions (F(2.07,39.39) = 3.32, p = 0.04). When quantifying the changes in beta weights across ROIs and tasks for each dimension separately, the main effect of task was significant for average item size for the three large regions (F(1,19) = 7.02, p = 0.02) and but not for the individual regions (F(1,19) = 3.97, p = 0.06), however the near zero beta values estimated for this dimension make this result difficult to interpret. The main effect of task was significant for density for the three large regions (F(1,19) = 6.69, p = 0.02) and for the individual regions (F(1,19) = 7.13, p = 0.01). The main effect of task for the other dimensions was not significant for total field area (for the three large regions: F(1,19)=0.61, p = 0.44; for the individual regions: F(1,19) = 0.51, p = 0.48) and for total surface area (for the three large regions: F(1,19) = 2.04, p = 0.17; for the individual regions: F(1,19) = 2.66, p = 0.12). Data points show mean beta weights across subjects (n = 20) ± standard error of the mean (SEM). P-values testing the significance of the beta coefficients for each dimension and ROI are reported in Supplementary file 6.
Additional files
-
Supplementary file 1
Statistical results for the performance of the classifiers trained to discriminate between different numerosities.
The table reports t-values, degrees of freedom (Dof), p-values and confidence intervals of the two-tailed t-tests against 0.5 (chance level) used to evaluate the accuracies of number classification for every ROI and task.
- https://doi.org/10.7554/eLife.45160.013
-
Supplementary file 2
Statistical results for beta weights obtained from the RSA multiple regression.
The table shows t-values, degrees of freedom (Dof), p-values and confidence intervals of two-tailed t-tests against zero across subjects for every ROI and dimension (N: number, S: average item size, TFA: total field area, TSA: total surface area, D: density) for the number (left table) and size (right table) tasks.
- https://doi.org/10.7554/eLife.45160.014
-
Supplementary file 3
Statistical results for the performance of the classifiers trained to discriminate between tasks.
The table reports t-values, degrees of freedom (Dof), p-values and confidence intervals of the two-tailed t-tests against 0.5 (chance level) used to evaluate the significance of task classification for every ROI.
- https://doi.org/10.7554/eLife.45160.015
-
Supplementary file 4
Statistical results for the ROI IPS excluding IPS 0–5.
(a) Statistical results for the performance of the classifiers trained to discriminate between numerosities during the number (left table) and size (right table) task for the ROI IPS excluding IPS 0–5. The table reports the statistical results of the two-tailed t-tests against 0.5 (chance level). (b). Statistical results for the performance of the classifiers trained to discriminate between tasks for the ROI IPS excluding IPS 0–5. The table reports the statistical results of the two-tailed t-tests against 0.5 (chance level). (c) Statistical results for beta weights obtained from the RSA multiple regression for the ROI IPS excluding IPS 0–5. The table shows t-values, degrees of freedom (Dof), p-values and confidence intervals of two-tailed t-tests against zero across subjects for every dimension (N: number, S: average item size, TFA: total field area, TSA: total surface area, D: density) for the number (left table) and size (right table) tasks.
- https://doi.org/10.7554/eLife.45160.016
-
Supplementary file 5
Statistical results for beta weights obtained from the RSA multiple regression when including only number, average item size and total field area as regressors.
The table shows t-values, degrees of freedom (Dof), p-values and confidence intervals of two-tailed t-tests against zero across subjects for every ROI and dimension (N: number, S: average item size, TFA: total field area) for the number (left table) and size (right table) tasks.
- https://doi.org/10.7554/eLife.45160.017
-
Supplementary file 6
Statistical results for beta weights obtained from the RSA multiple regression when including only non-numerical dimensions as regressors (i.e., average item size, total field area, total surface area and density).
The table shows t-values, degrees of freedom (Dof), p-values and confidence intervals of two-tailed t-tests against zero across subjects for every ROI and dimension (S: average item size, TFA: total field area, TSA: total surface area, D: density) for the number (left table) and size (right table) tasks.
- https://doi.org/10.7554/eLife.45160.018
-
Transparent reporting form
- https://doi.org/10.7554/eLife.45160.019
Download links
A two-part list of links to download the article, or parts of the article, in various formats.
Downloads (link to download the article as PDF)
Open citations (links to open the citations from this article in various online reference manager services)
Cite this article (links to download the citations from this article in formats compatible with various reference manager tools)
Attentional amplification of neural codes for number independent of other quantities along the dorsal visual stream
eLife 8:e45160.
https://doi.org/10.7554/eLife.45160


