Thyroid hormone regulates distinct paths to maturation in pigment cell lineages
- University of Washington, United States
- University of Virginia, United States
- Washington University School of Medicine, United States
Figures
Figure 1
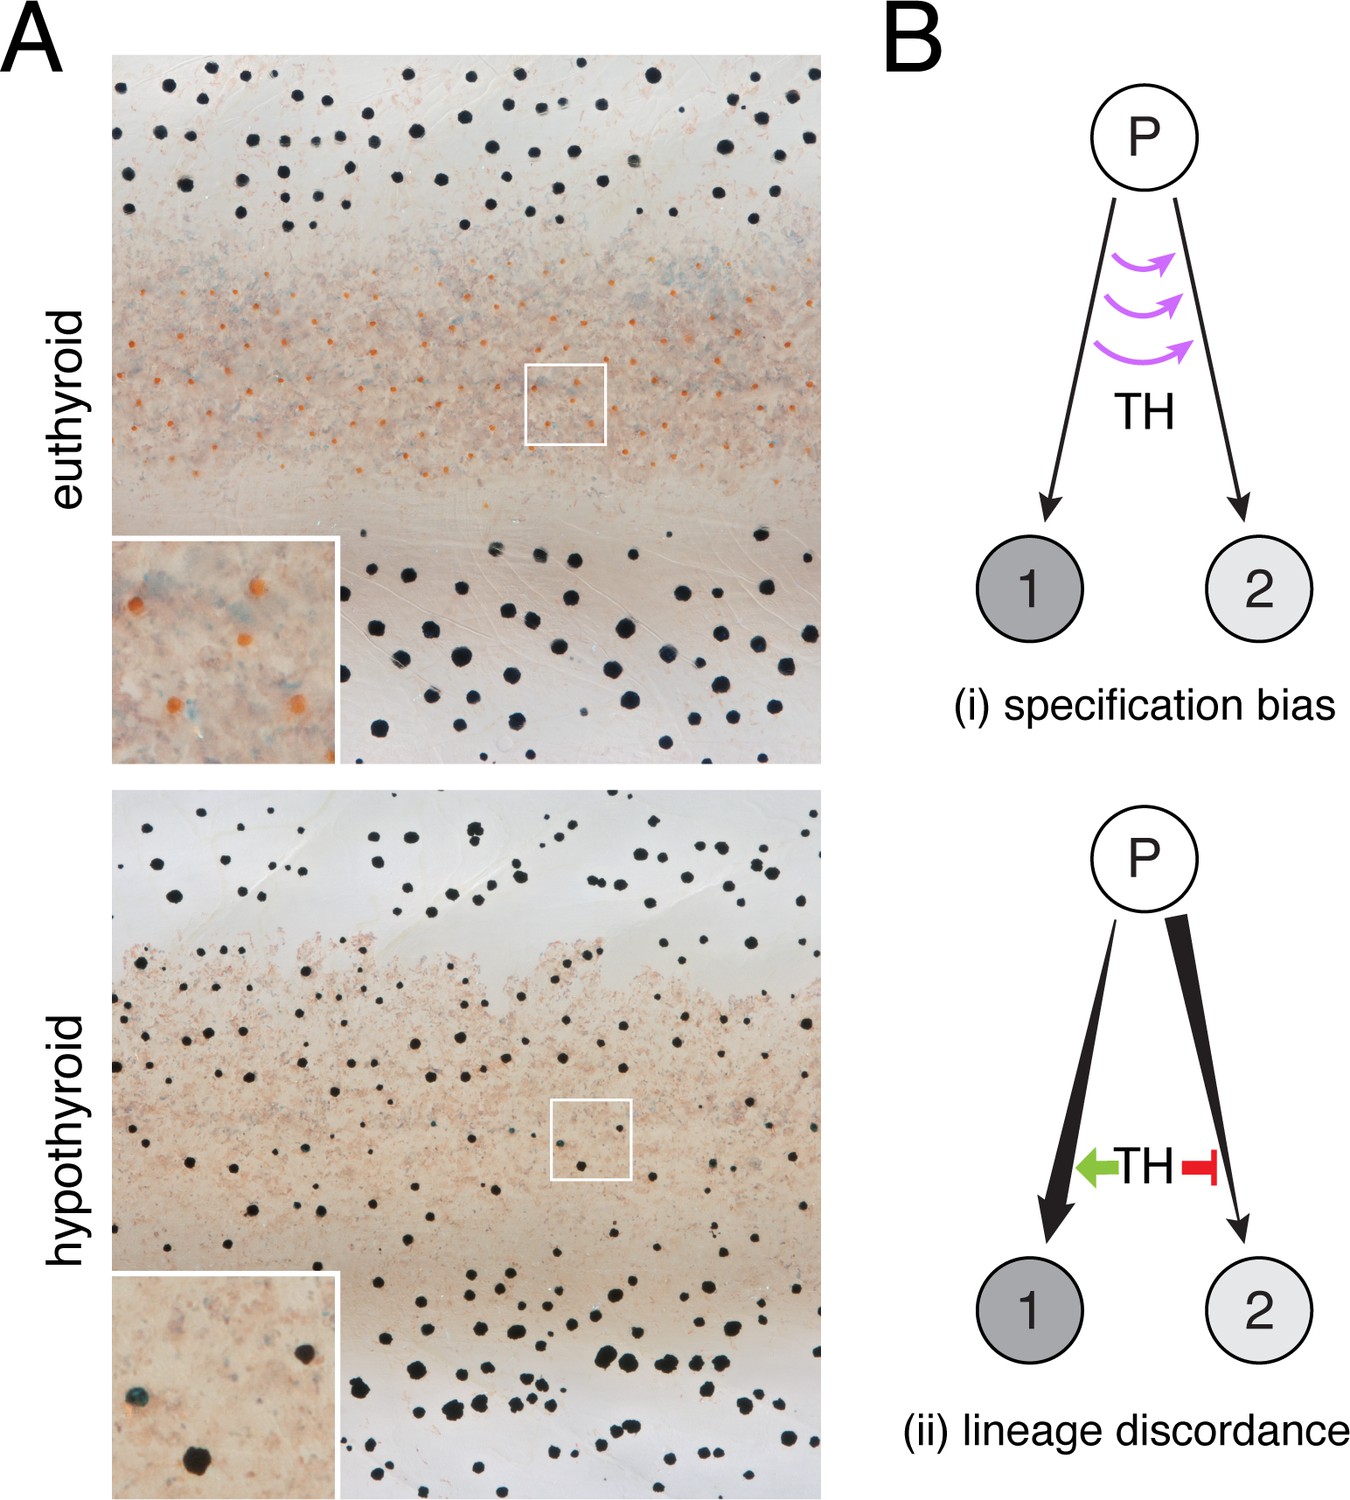
TH-dependent phenotypes and models for TH action.
(A) Euthyroid and hypothyroid zebrafish [stage 10 (mm) standardized standard length (SSL) (Parichy et al., 2009); ~21 d post-fertilization, dpf]. Insets, yellow/orange xanthophores of euthyroid fish and absence of these cells in hypothyroid fish. (B) Models for TH effects on alternative cell types derived from a common progenitor (P), by regulating: (i) cell fate specification; or (ii) amplification and restraint of committed cell-types by differential effects on morphogenesis or differentiation.
Figure 2 with 5 supplements
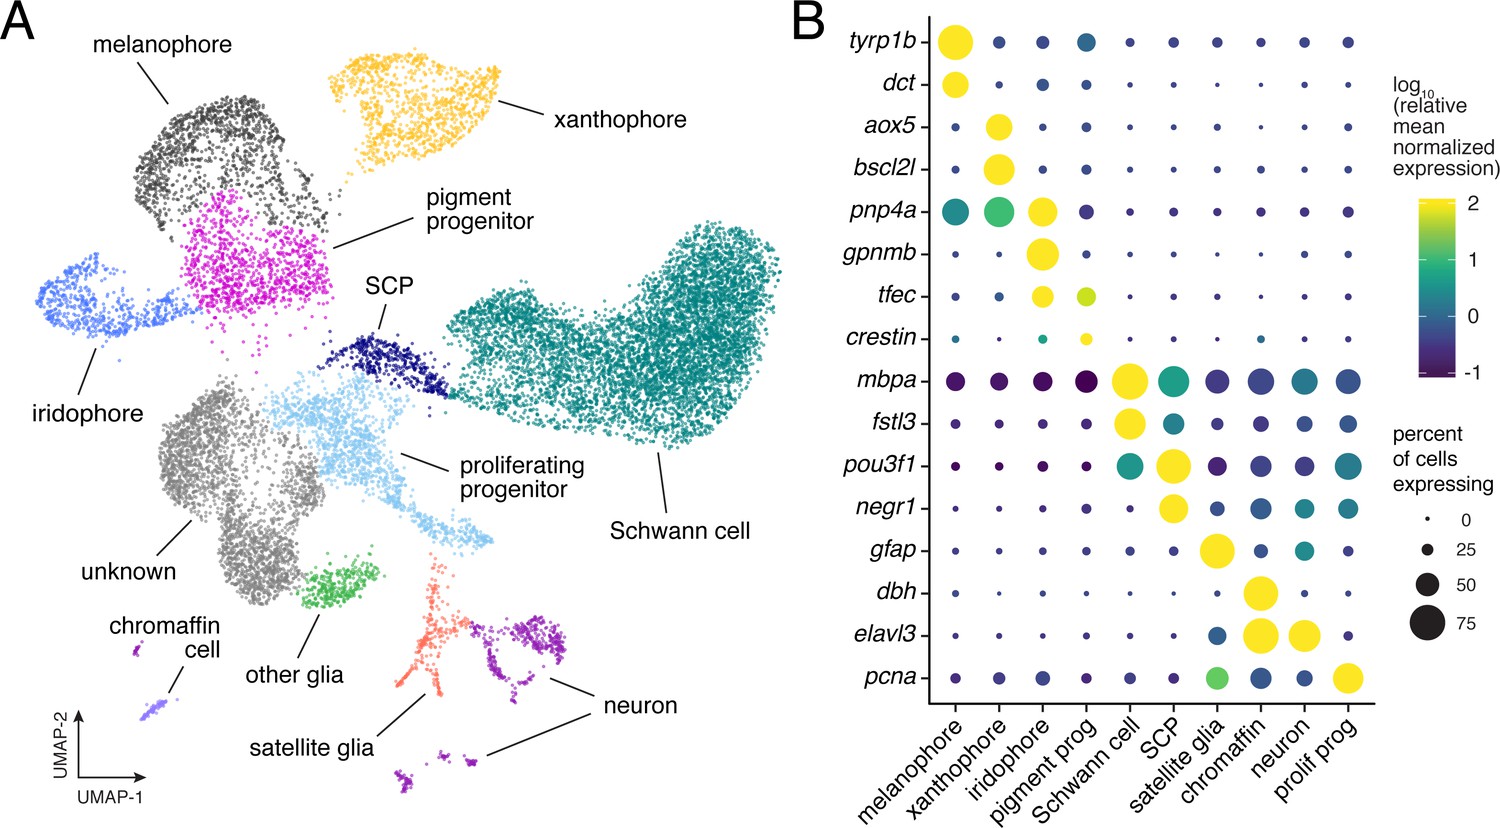
Single-cell transcriptomic identification of post-embryonic NC-derived cell types.
(A) Cell-type assignments for clusters of cells (n = 16,150) from euthyroid and hypothyroid fish. Cell types known to be of non-NC derivation are not shown (Figure 2—figure supplement 2D and E). (B) Known cell-type marker genes and new candidate markers (for cluster-specific genes, see Supplementary file 2—Table 1).
Figure 2—figure supplement 1
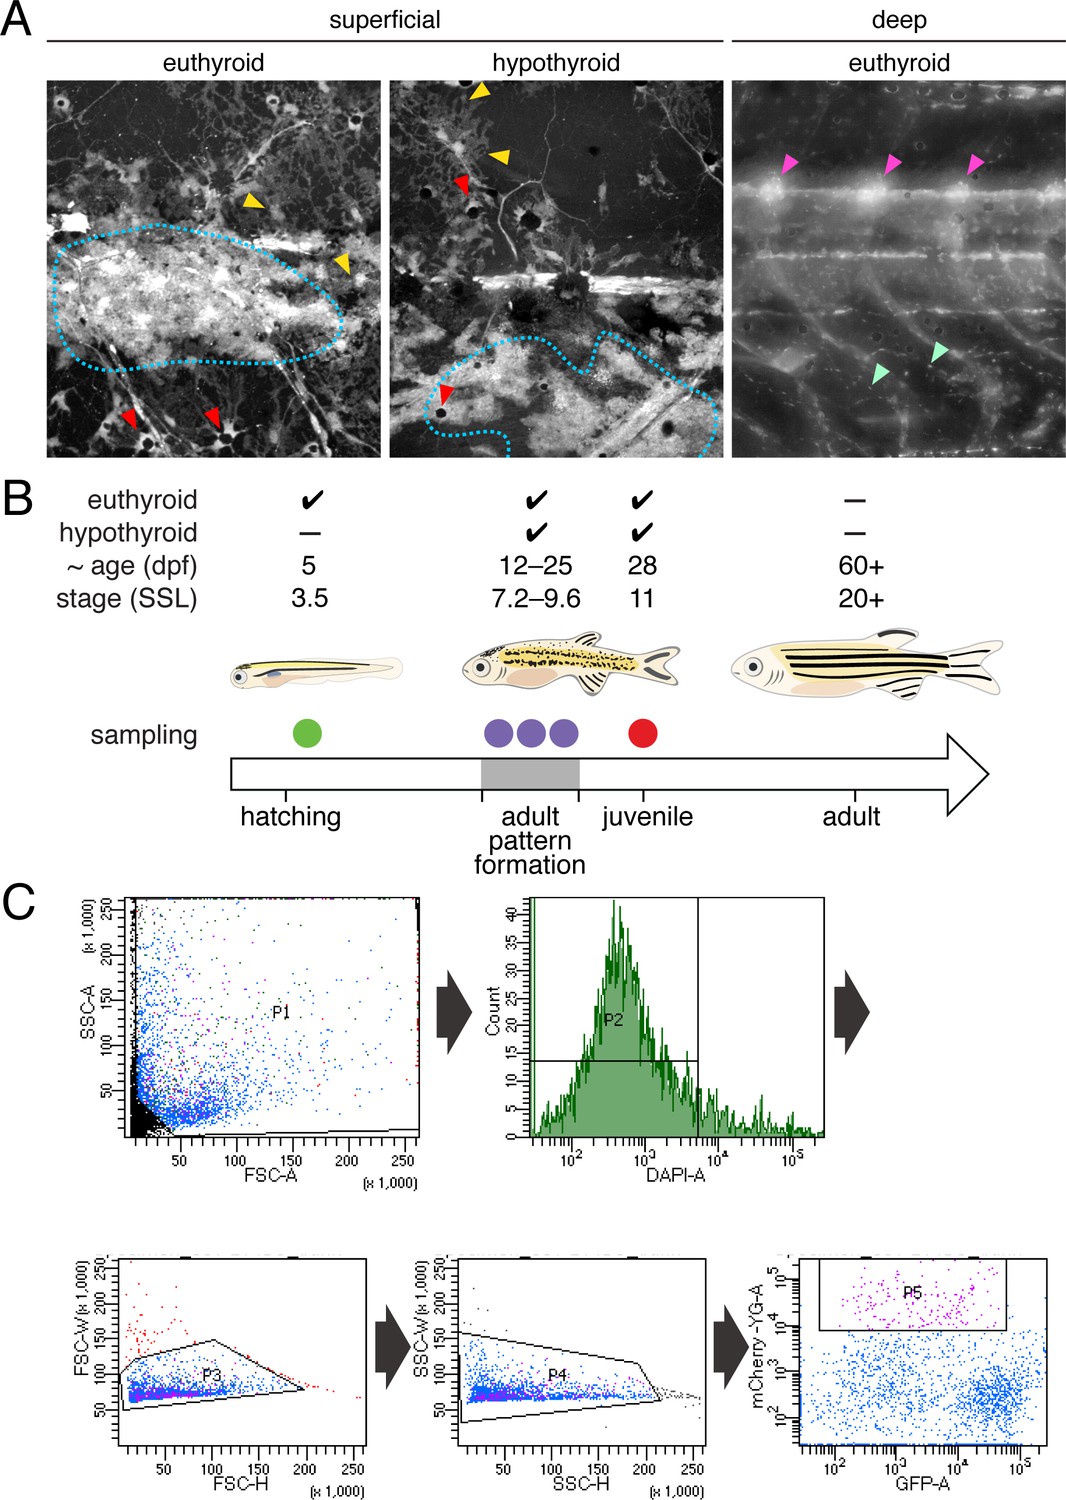
Experimental design and isolation of NC-derived cells from post-embryonic zebrafish.
(A) Fish transgenic for sox10:cre and ubi:loxP-EGFP-loxP-mCherry permanently and robustly expressed mCherry in NC-derived cells of both euthyroid and hypothyroid fish (Kague et al., 2012; Mosimann et al., 2011). At superficial layers, mCherry+ xanthophores (yellow arrowheads), melanophores (red arrowheads), and iridophores (blue dotted line) were apparent. At deeper layers, mCherry+ cells were found in dorsal root ganglia (magenta arrowheads) and other locations (e.g. mint arrowheads), potentially representing glia, neurons, progenitors and other cell types. mCherry+ cells of non-NC origin were evident as well (see Figure 2—figure supplement 2). Stage shown is 9.8 SSL (Parichy et al., 2009). (B) Single-cell RNA-Seq (scRNA-Seq) experimental design. To ensure that progenitors, cells at intermediate states of specification and commitment, and fully differentiated cells were captured, euthyroid and hypothyroid fish were collected at a range of stages encompassing adult pattern formation (7.2–9.8 SSL) and from juvenile fish (11 SSL) in which the first two adult stripes had fully formed. To compare transcriptomic signatures of NC-derived cells from embryonic–early larval and middle larval–juvenile stages, cells were additionally collected from euthyroid larvae at 5 dpf (3.5 SSL). (C) Representative FAC sort for NC-derived cells from post-embryonic skins and trunks. Single cells were isolated by sequentially gating cells according to their SSC-A vs. FSC-A, FSC-H vs. FSC-W, and SSC-H vs. SSC-W profiles according to standard flow cytometry practices. Cells with high levels of DAPI staining were excluded as dead or damaged. NC-derived cells were isolated by identifying cells with high fluorescence in the mCherry-A channel which describes expression of the ubi:loxP-EGFP-loxP-mCherry transgene after permanent conversion to ubi:mCherry upon exposure to sox10:Cre (see Figure 2—figure supplement 1A).
Figure 2—figure supplement 2
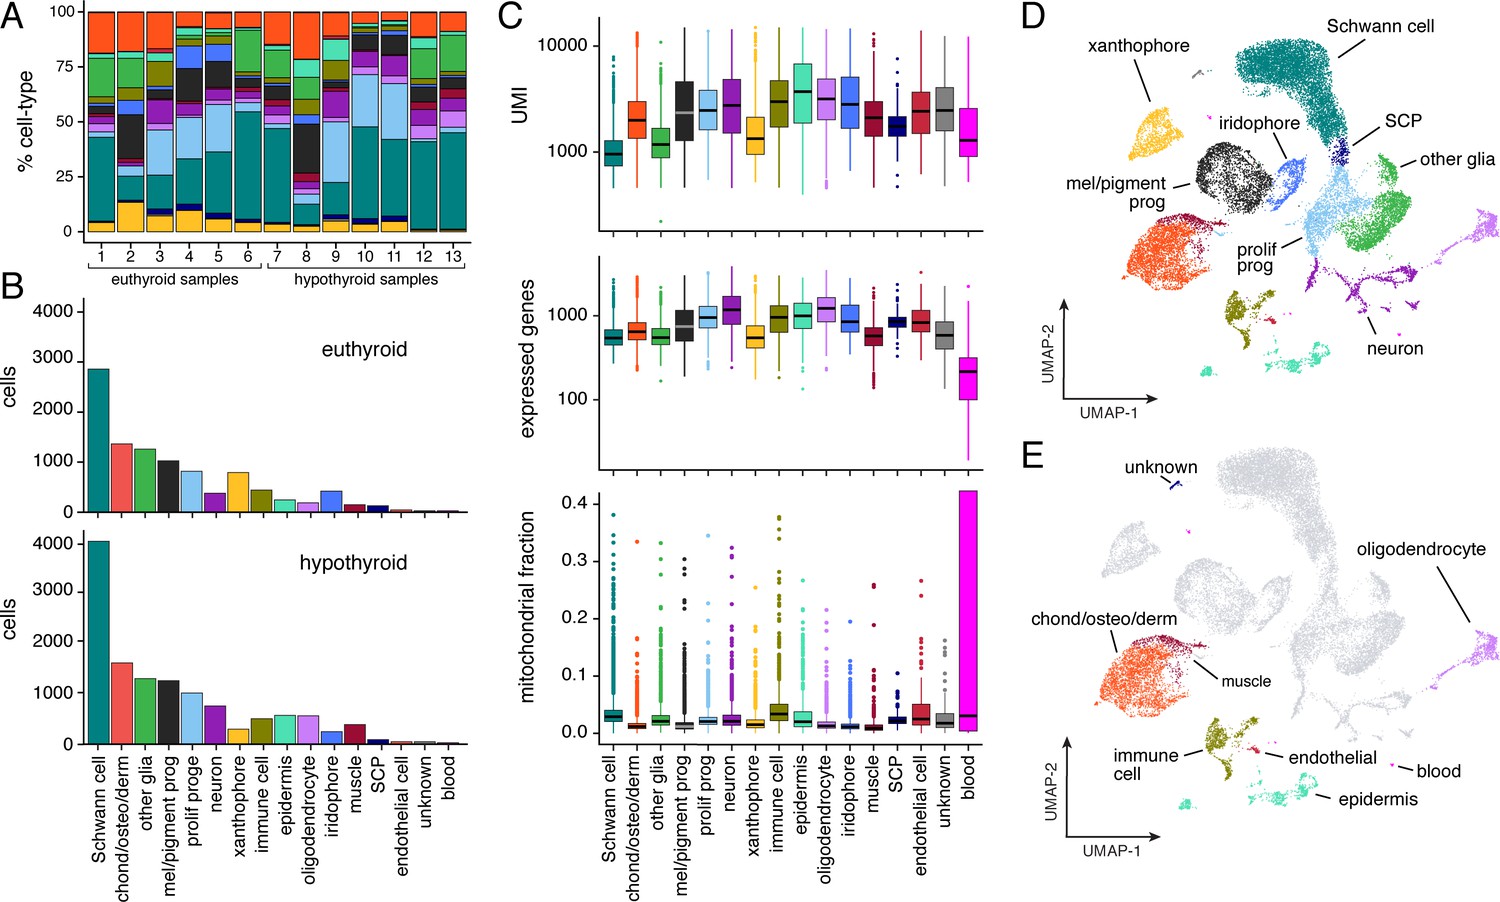
Population characteristics for full scRNA-Seq dataset from post-embryonic zebrafish.
(A) Percentages of cell types across samples (for details, see Supplementary file 2—Table 3). All cell types are represented in each sample in similar overall proportions. Colors correspond to cell types in (B–E). (B) Counts of cells by type captured from euthyroid and hypothyroid fish at post-embryonic stages (≥7.2 SSL). (C) Counts of unique molecular identifiers (UMI) and unique genes expressed, as well as fractions of mitochondrial reads by cell-type (shown are medians with boxes spanning interquartile ranges; vertical lines indicate farthest observations of data with outlier samples shown individually). Increased fractions of mitochondrially encoded genes may indicate broken cells (Ilicic et al., 2016). Consistent with this idea, Schwann cells—many of which are expected to be damaged owing to their concentrically layered morphology—exhibited one of the largest overall proportions of UMIs derived from mitochondrial genes. (D) Two-dimensional UMAP representation of all post-embryonic cells (≥7.2 SSL) captured in scRNA-Seq that passed quality thresholds (22,613 cells, 13 combined samples). (E) Same cells as in D, with presumptive NC-derivatives shown in gray and presumptive non-NC derived cells highlighted by type.
Figure 2—figure supplement 3
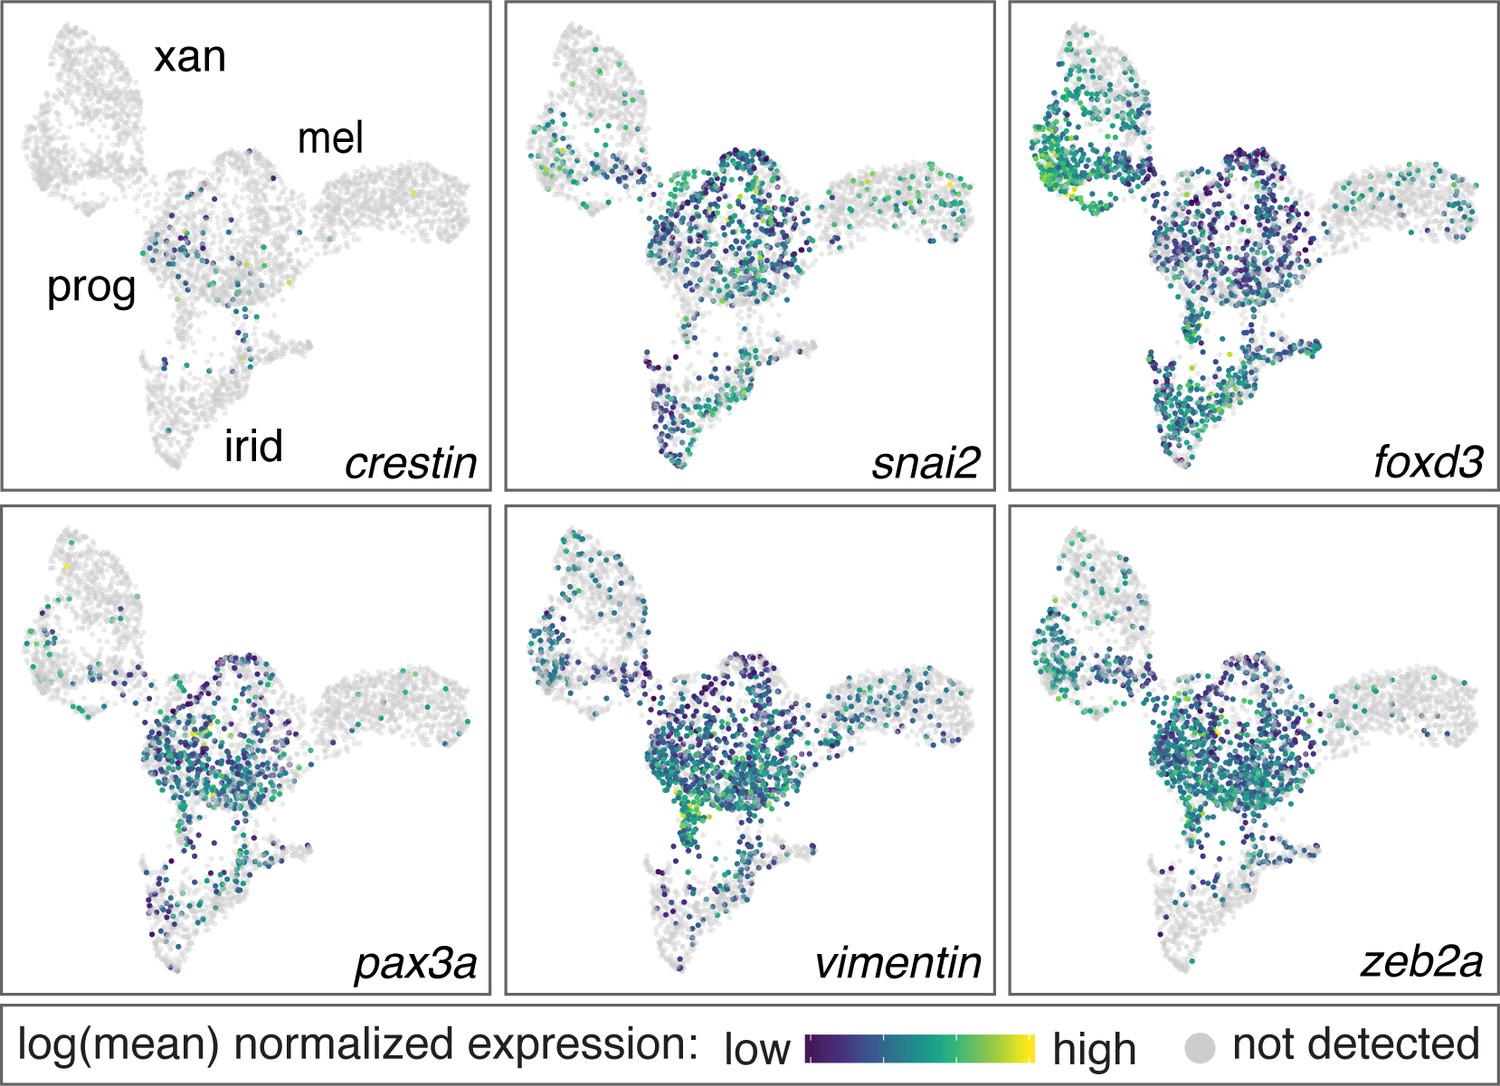
Genes enriched in pigment progenitor clusters include known markers of embryonic NC cells.
Genes enriched in the pigment progenitor cluster compared to differentiated pigment cells included loci expressed in embryonic, migratory NC cells of zebrafish and other species (crestin, snai2, foxd3, pax3a, vim, zeb2a) (Kaufman et al., 2016; Kelsh et al., 2000a; Luo et al., 2001; Minchin and Hughes, 2008; Thisse et al., 1995; Van de Putte et al., 2003; Ziller et al., 1983). Color indicates relative expression of each gene within individual cells (xan, xanthophores; mel, melanophores; irid, iridophores; prog, pigment progenitors).
Figure 2—figure supplement 4
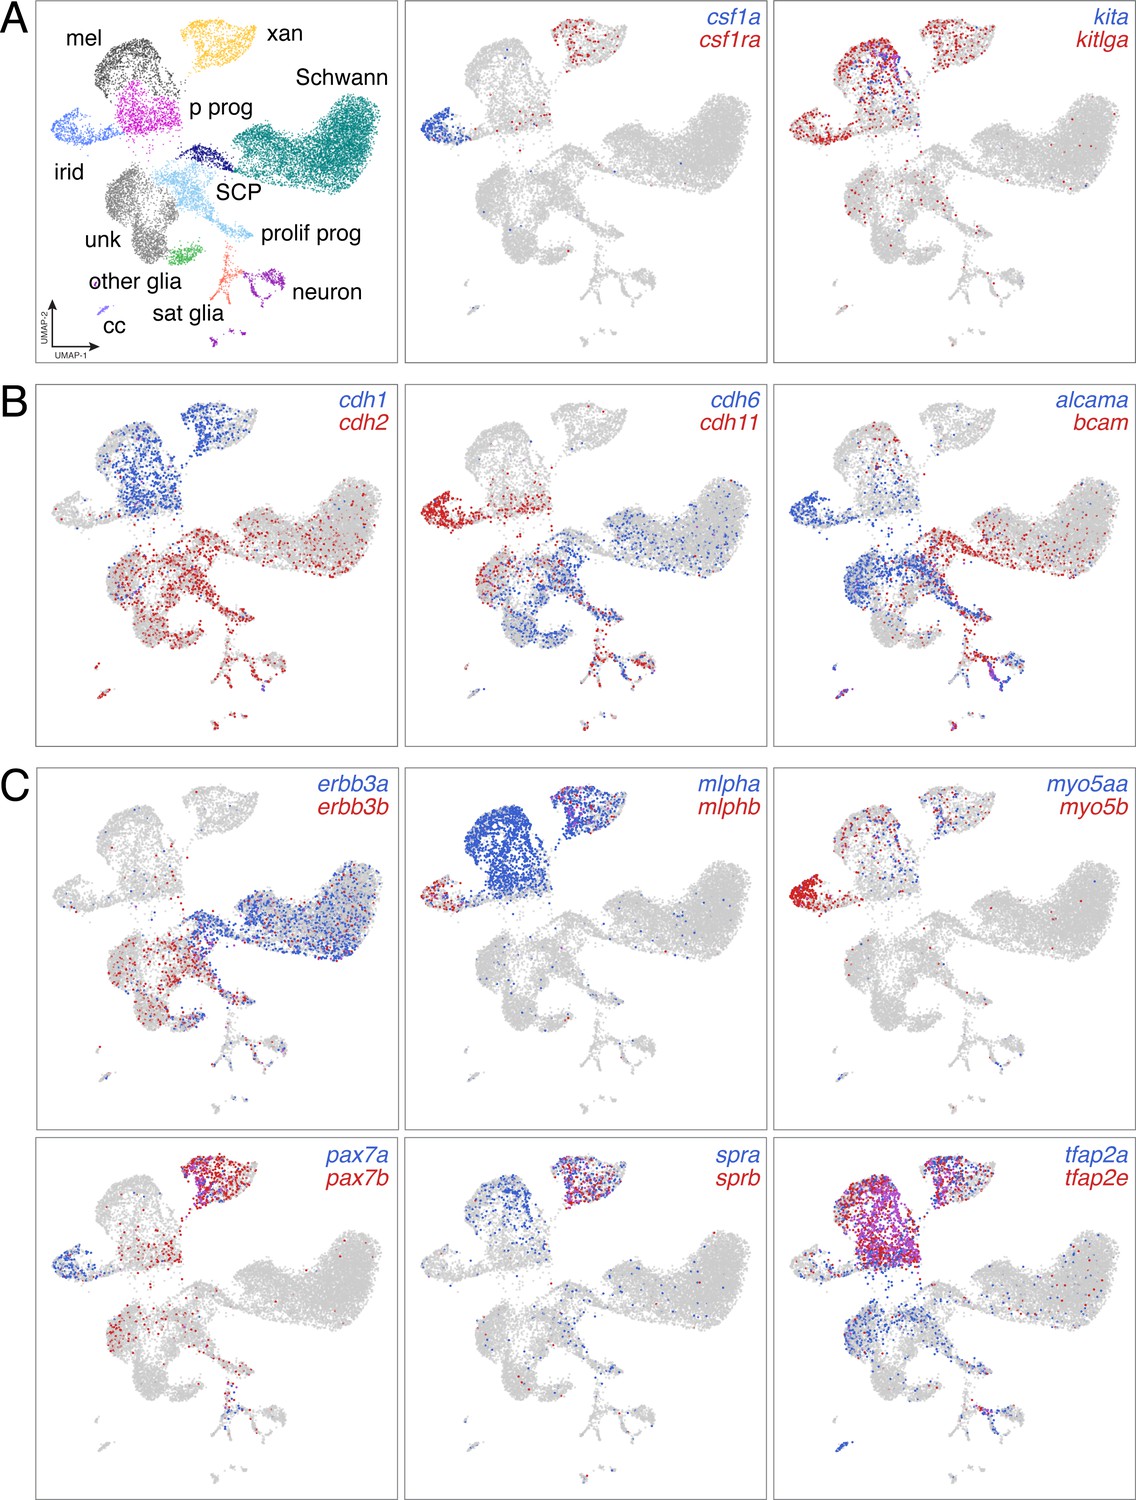
Distinct domains of gene expression across diverse NC derivatives.
(A) UMAP representation of major NC derivatives (left) with coordinate expression of two exemplar ligand–receptor gene pairs (middle and right). Xanthophores are known to express and require type III receptor tyrosine kinase (RTK) gene colony stimulating factor one receptor a (csf1ra) and to depend for their development on csf1a expressed by nearby iridophores (Parichy et al., 2000b; Patterson and Parichy, 2013). Melanophores require the type III RTK gene kita (Parichy et al., 1999) and ligand encoded by kitlga, expressed by skin (Hultman et al., 2007; Patterson and Parichy, 2013), but also pigment cells and progenitors revealed here by scRNA-Seq. (B) Pairs of cell adhesion molecules with distinct expression domains suggest differing morphogenetic requirements between pigment cell and other lineages (cdh1 vs. cdh2), and for specific cell types [e.g. cdh11 of iridophores, which form epithelium-like mats within adult interstripes (Singh et al., 2014; (Budi et al., 2011; Darzynkiewicz et al., 1980; McMenamin et al., 2014; Spiewak et al., 2018)]. (C) In teleosts, an ancient clade-specific genome duplication resulted in extra genes, allowing for subfunctionalization and retention of some paralogs (Braasch et al., 2015; Braasch et al., 2009). scRNA-Seq revealed different degrees to which paralog expression has been partitioned across NC-derived cell types. For example, proliferating progenitors and unknown (unk) cells were more likely to express receptor tyrosine kinase gene erbb3b, required for development of glia and adult melanophores (Budi et al., 2008), whereas Schwann cells and Schwann cell progenitors (SCP) were more likely to express erbb3a. Likewise, xanthophores express and require transcription factor genes pax7a and pax7b (Nord et al., 2016), but iridophores were also marked by pax7a expression, suggesting the possibility of functional significance to this cell type exclusive of pax7b activities (A–C, expression thresholds = 1).
Figure 2—figure supplement 5
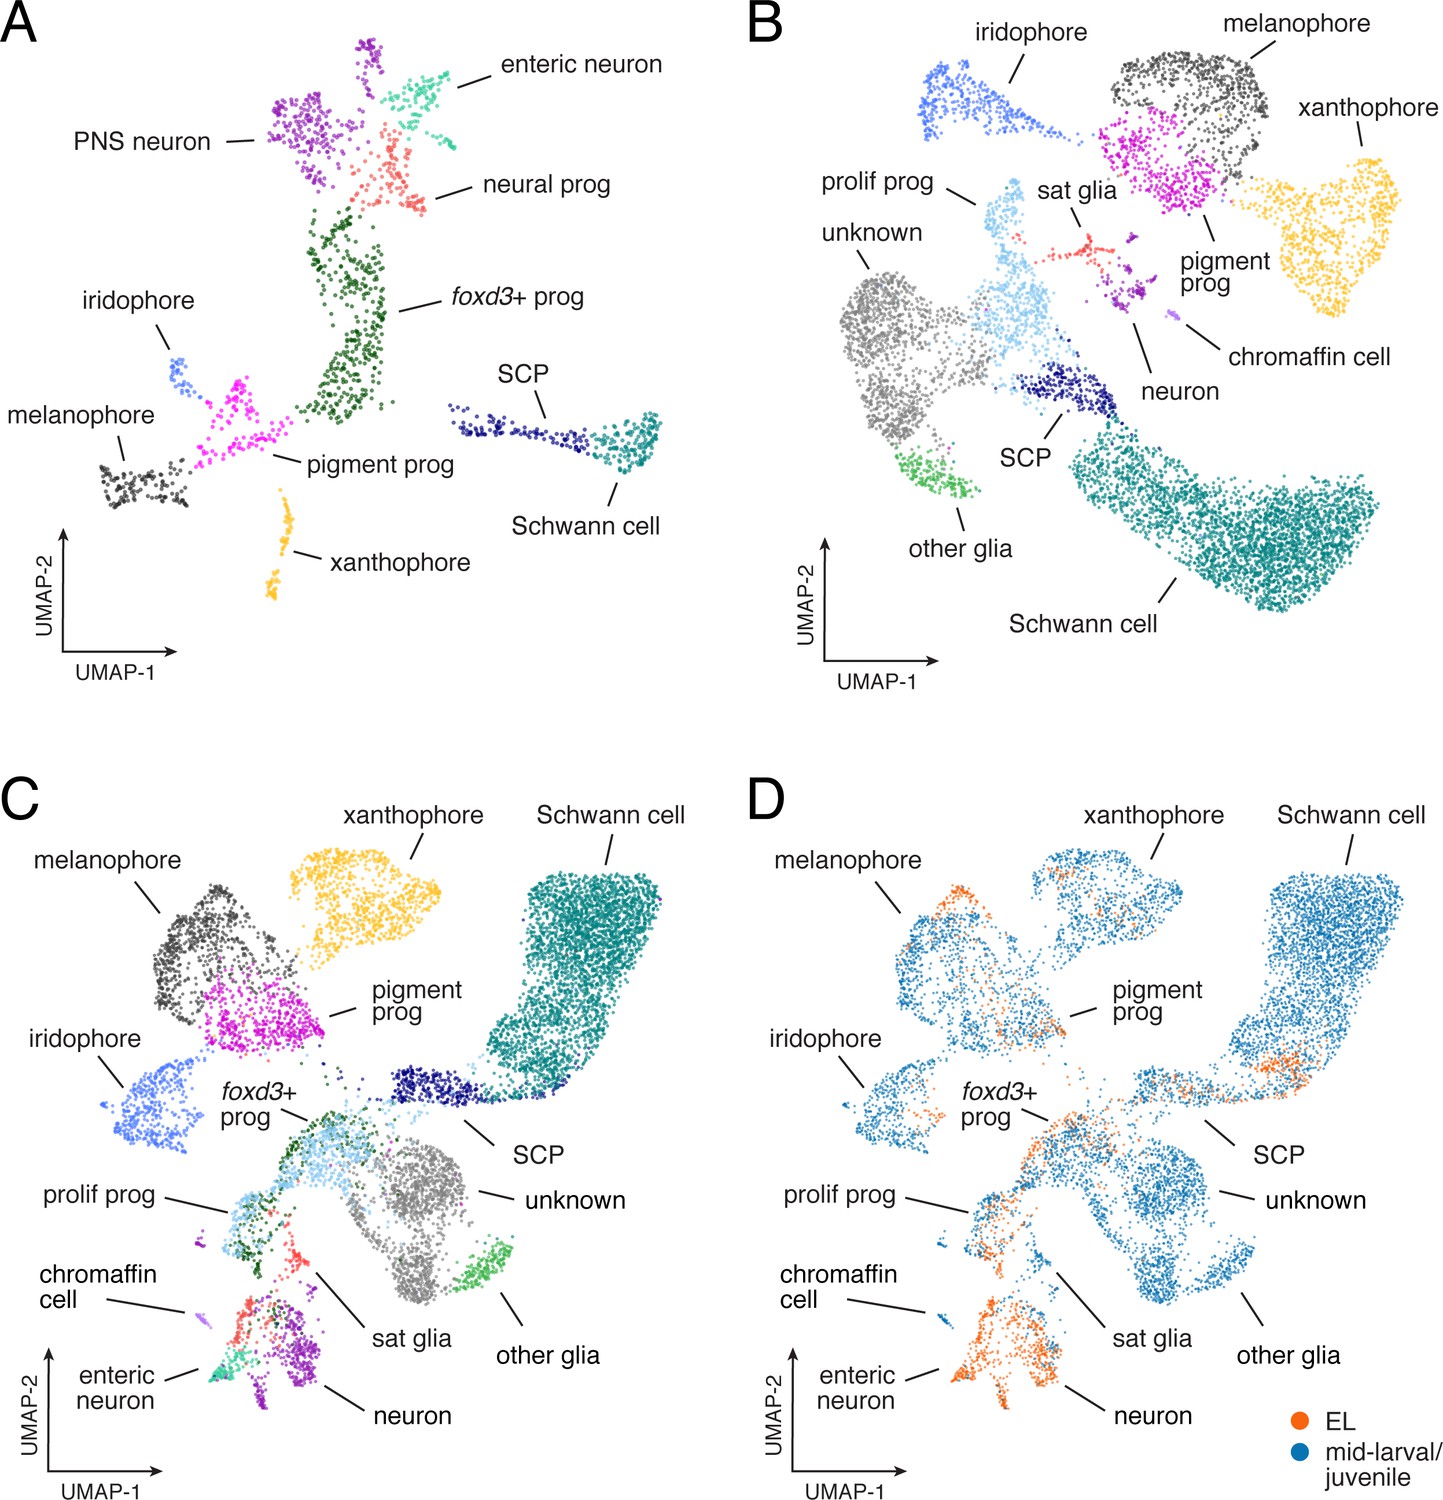
Similarities and differences between EL and adult gene expression programs.
(A) UMAP representation of EL NC-derived cells (n = 1,466) isolated from euthyroid 5 dpf fish (3.5 SSL; prog, progenitor; SCP, Schwann cell precursors; PNS, non-enteric peripheral nervous system). (B) Mid-larval and juvenile NC-derived cells from euthyroid fish (n = 7,611; from ≥7.2 SSL fish; sat, satellite). (C) Combined EL and euthyroid mid-larval/juvenile. (D) Comparison of EL (orange) and mid-larval/juvenile (blue) cell distributions revealed broadly overlapping domains of xanthophores in UMAP space, consistent with known derivation of most early adult xanthophores from EL xanthophores (McMenamin et al., 2014) [and see Main text].
Figure 3 with 5 supplements

Pigment cell subpopulations and dynamics of gene expression across pigment cell lineages.
(A) Established lineage relationships of embryonic (e) and post-embryonic pigment cells. Multipotent pigment cell progenitors (P) in the peripheral nervous system generate adult iridophores (I), melanophores (M) and some xanthophores (X). A few embryonic melanophores (Me) persist, whereas embryonic xanthophores (Xe) proliferate and lose their pigment to enter a cryptic phase (Xc), and then reacquire pigment late in pattern formation to form most adult xanthophores (McMenamin et al., 2014). (B) Sub-clusters of melanophores and xanthophores with distinct gene expression signatures. (C) Pigment cell clusters defined by markers for each cell-type. (D–E) Pseudotemporal ordering (D) and BEAM (E) revealed dynamics of gene expression over pseudotime for each pigment cell branch [q < 6.0E-11 for all genes except pax3a, starred, q = 0.03), expressed as anticipated during early pseudotime in each branch].
Figure 3—figure supplement 1
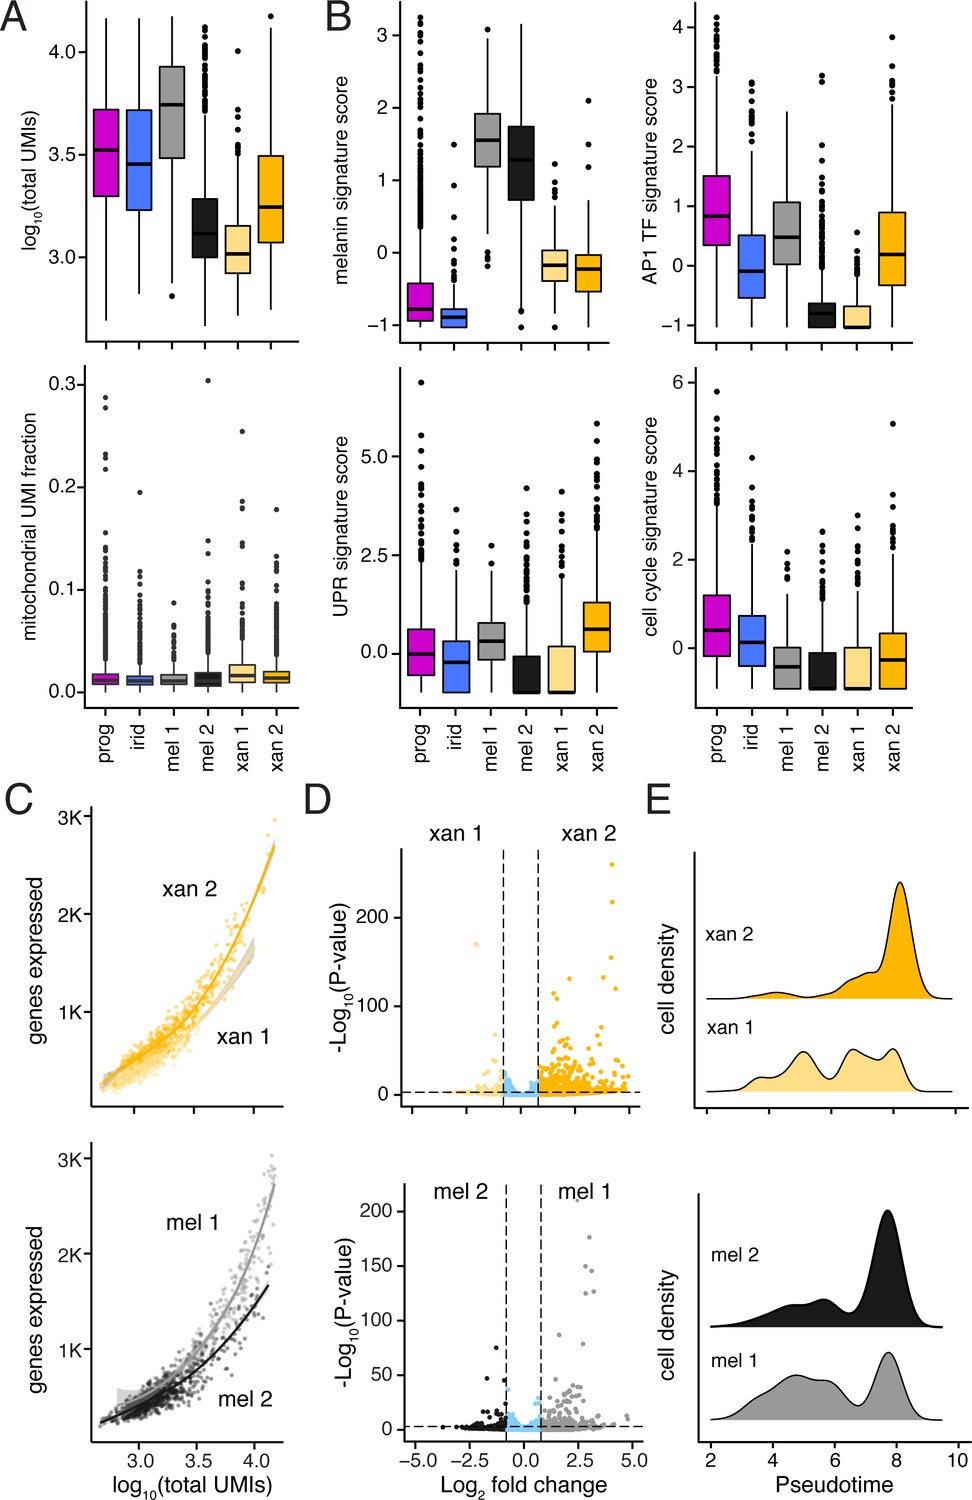
Differences between melanophore and xanthophore sub-populations revealed distinct levels and types of transcriptional activity.
(A) Median transcript numbers (unique molecular identifiers, UMIs; upper plot) differed across pigment cell subpopulations. Reduced total RNA content is associated with a G0 cell state (i.e. quiescence, replicative senescence, and/or terminal differentiation) (Coller et al., 2006; Darzynkiewicz et al., 1980); low median UMI counts in sub-clusters of melanophores and xanthophores (mel 2, xan 1) suggest alternative states within these differentiated cell populations. Mitochondrial read fraction (lower plot) was low and consistent across sub-clusters, suggesting that low median UMI counts (upper plot) were unlikely to reflect damage specifically incurred by particular cell types (Ilicic et al., 2016). (B) Both melanophore subclusters highly express genes associated with melanin synthesis, indicating that they are both represent true melanophores. However, cell clusters with lower median UMIs (mel 2, xan 1) exhibited gene expression trends indicative of curtailed transcriptional and translational activity, including reduced expression of AP-1 transcriptional complex members (AP1 TF signature score), and genes involved in unfolded protein response (UPR signature score), and proliferation (cell-cycle signature score) (Chinenov and Kerppola, 2001; Maurus et al., 2017; Patil and Walter, 2001; Riabowol et al., 1992) (for details of genes in signature scores, see Supplementary file 2—Table 4). (C) Melanophores and xanthophores in subclusters with lower total UMI counts (mel 2, xan 1) expressed fewer unique genes compared to cells in the other subcluster regardless of equivalent UMI counts, consistent with a more restricted gene expression profile of these populations (shaded areas indicate standard error bounds). (D) Differential expression of genes between pigment cell sub-clusters (xan1 vs. xan2; mel2 vs. mel1). These analyses revealed more genes, expressed at higher levels in xanthophore 2 compared to xanthophore 1, and in melanophore 1 compared to melanophore 2. These biases were consistent with xanthophore 2 and melanophore 1 representing more active cells, and xanthophore 1 and melanophore 2 representing less active cells. Genes compared were expressed by at least five cells in either cluster (log2 fold-change cutoff = 0.8, p<1e-3; xanthophores = 160, 36; melanophores = 125, 39. (E) Melanophore and xanthophore subclusters were differentially distributed along trajectory branches in Figure 3D, consistent with xanthophore 2 and melanophore 2 representing cells at later steps of maturation as compared to xanthophore 1 and melanophore 1.
Figure 3—figure supplement 2
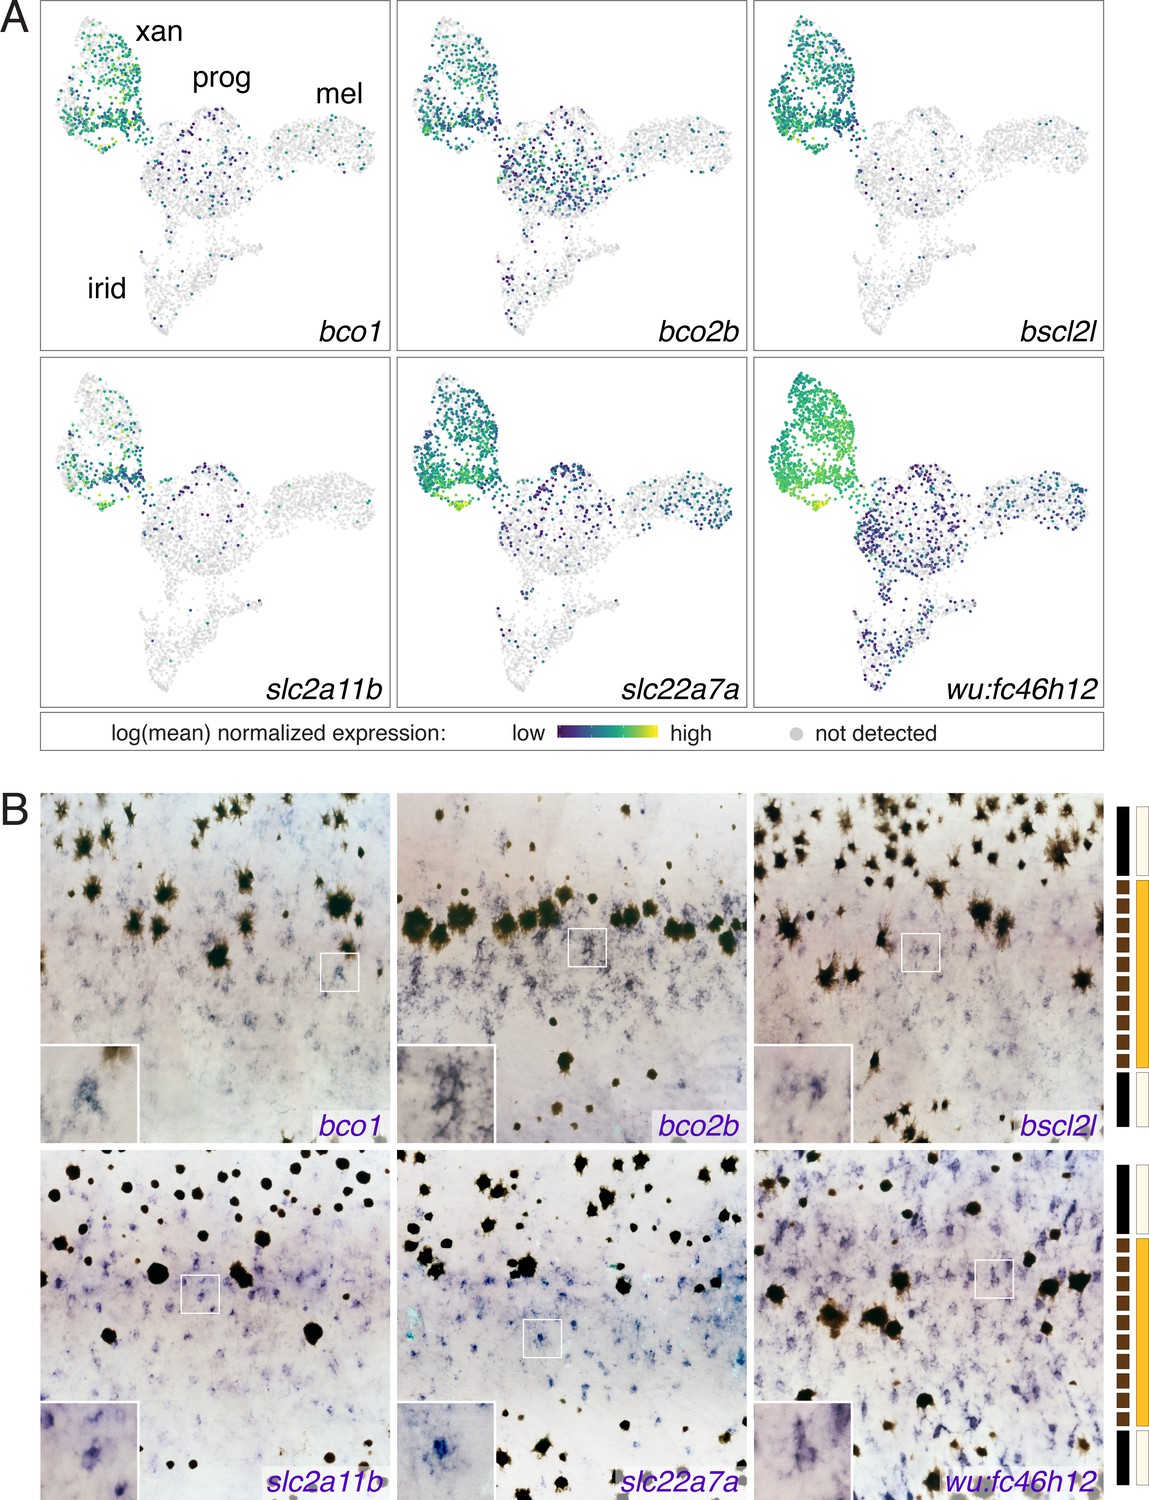
Xanthophore cluster-specific expression identifies novel xanthophore markers.
(A) UMAP plots of pigment cells colored by expression of xanthophore cluster-enriched genes (bco1, bco2b, bscl2l, slc2a11b, slc22a7a, wu:fc46h12). (B) Expression in xanthophores of genes shown in A, as revealed by whole-mount in situ hybridization patterns corresponding to those of known xanthophore lineage markers and localization of differentiated and cryptic xanthophores (Hamada et al., 2014; Lang et al., 2009; McMenamin et al., 2014; Parichy et al., 2000b). Insets show at higher magnification blue-stained cells of xanthophore lineage. Bars at right indicate cell positions relative to anatomy of final pattern: solid black, melanophores in prospective stripe regions; dashed black, melanophores transiently located in prospective interstripe region; light yellow, xanthophores likely to remain cryptically (unpigmented) within stripes; orange, xanthophores likely to develop pigmentation in the interstripe.
Figure 3—figure supplement 3
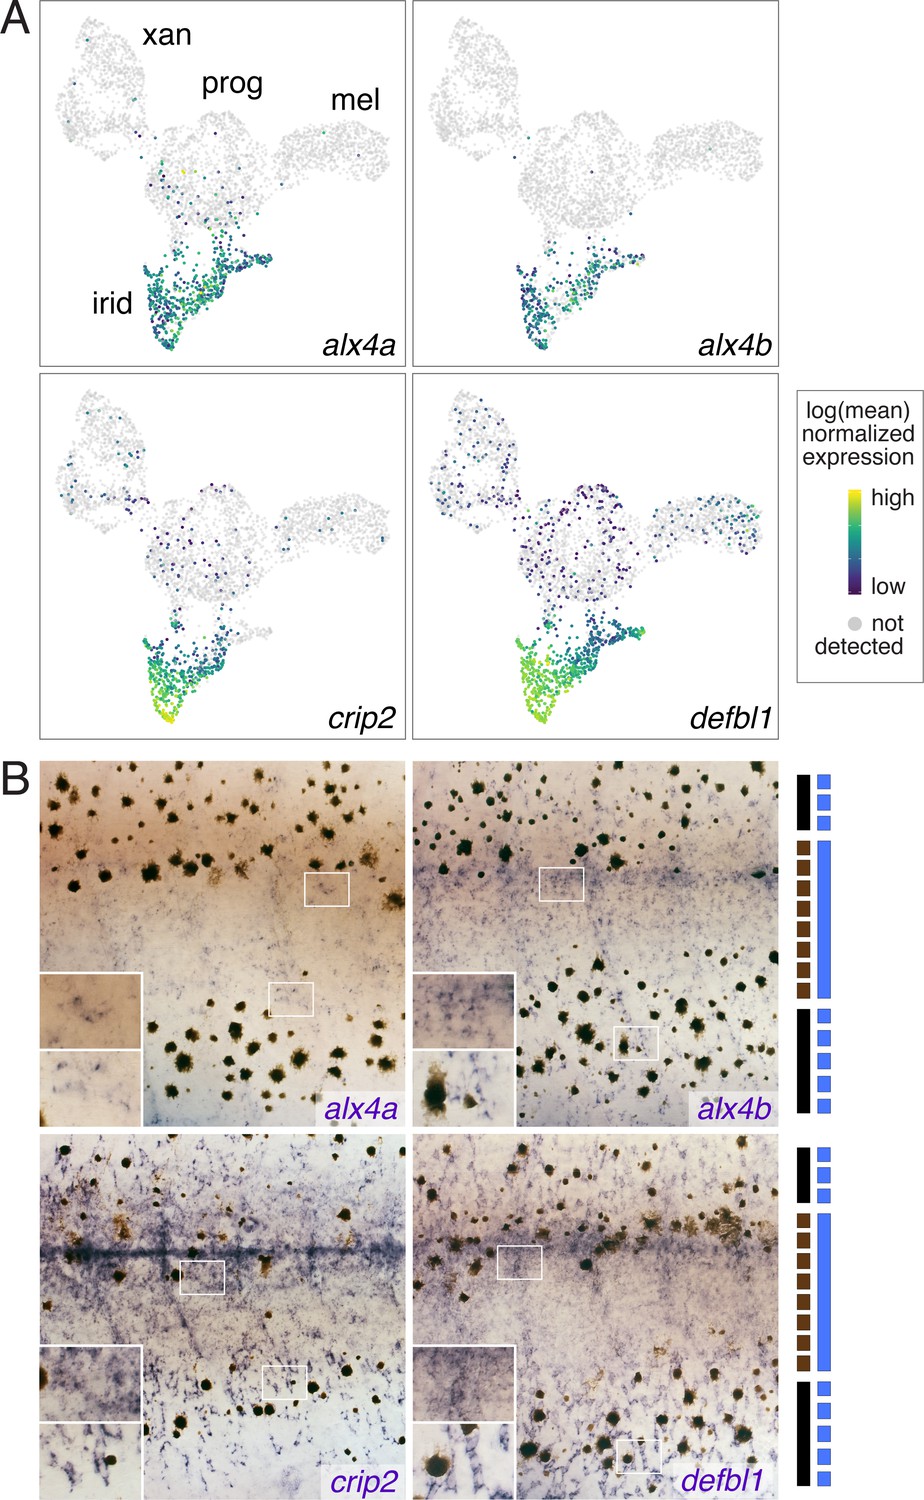
Iridophore cluster-specific expression identifies novel iridophore markers.
(A) UMAP plots of pigment cells colored by expression of iridophore cluster-specific genes (alx4a, alx4b, crip2, defbl1). (B) Whole-mount in situ hybridization of genes in A reveals patterns corresponding to previously described iridophore markers and locations (Lang et al., 2009; Patterson and Parichy, 2013; Spiewak et al., 2018). Insets, higher magnification views of blue-stained iridophores in the prospective interstripe (upper) and within or near prospective stripe (lower). Bars at right indicate cell positions relative to final pattern features: solid black, melanophores in prospective stripe regions; dashed black, melanophores in prospective interstripe; solid blue, dense iridophores of interstripe; dashed blue, sparse iridophores of stripe.
Figure 3—figure supplement 4
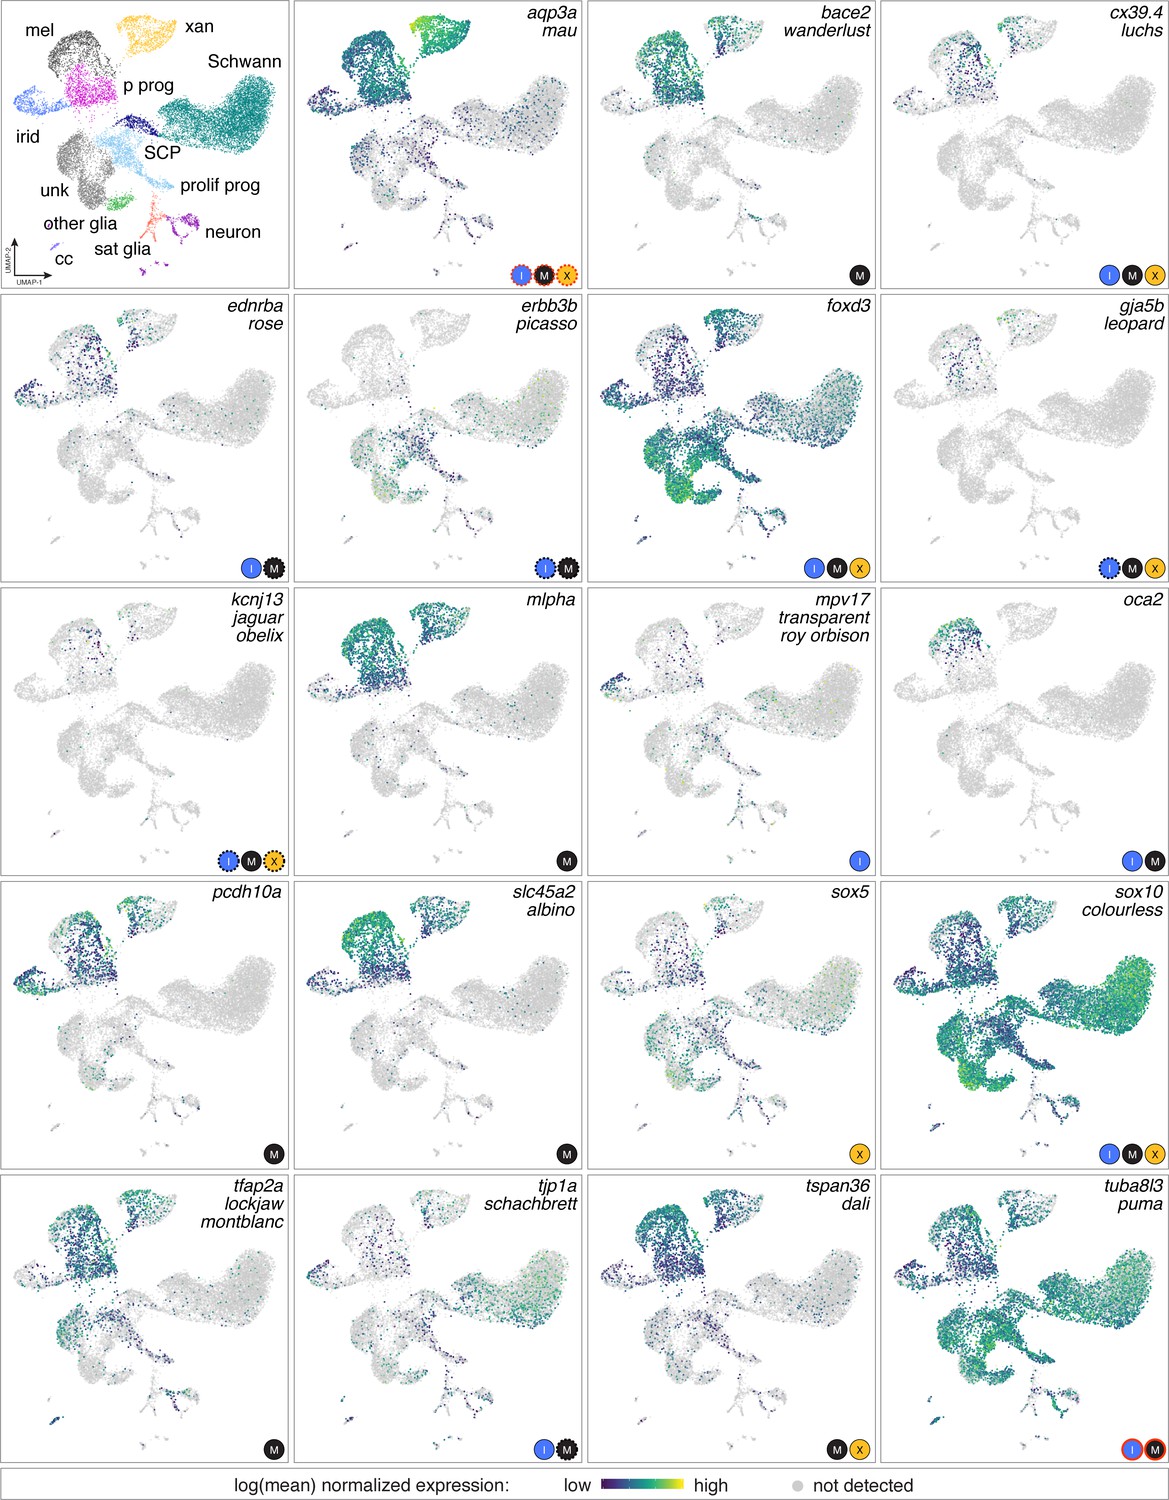
Genes identified as zebrafish pigmentation mutants often had expression domains beyond affected cell types.
Mutations affecting a variety of pigmentary traits have been recovered or induced and affect pigment deposition, specification or morphogenesis of one or more pigment cell classes, and pattern at EL, adult or both stages (Arduini et al., 2009; Barrallo-Gimeno et al., 2004; Beirl et al., 2014; Budi et al., 2008; D'Agati et al., 2017; Dooley et al., 2013b; Dutton et al., 2001; Eskova et al., 2017; Fadeev et al., 2015; Inoue et al., 2014; Irion et al., 2014; Iwashita et al., 2006; Knight et al., 2003; Krauss et al., 2013; Larson et al., 2010; Nagao et al., 2018; Parichy et al., 2000a; Sheets et al., 2007; Watanabe et al., 2006; Williams et al., 2018; Zhang et al., 2018). Shown are expression domains observed for affected genes in scRNA-Seq analyses of adult NC-derived cells (euthyroid and hypothyroid). Gene names are listed at upper right of each box, with corresponding mutant names indicated below for those loci identified in forward genetic screens (for mutants isolated independently in different screens more than one name is indicated). Logos at lower right of each panel are cell types reported to be affected. In some instances, only EL phenotypes have been reported (e.g. pcdh10a). Red outlines around cell type logos indicates neomorphic alleles (aqp3a, tuba8l3a); dashed lines indicate effects that are known to be non-autonomous to the affected pigment cell types (e.g. erbb3b). In many instances scRNA-Seq expression domains identified a more diverse array of cell types than would be expected from gross mutant phenotypes alone. For example, slc45a2 is required for melanization of melanophores but detected at lower levels in xanthophores and iridophores, whereas mlpha is required for melanosome dispersion but also expressed in xanthophores. Such instances raise the possibility of cell-type specific expression that is not functionally significant (e.g. if other pathway members are not themselves expressed), unanticipated functions that result in only subtle loss-of-function phenotypes not yet identified, or amelioration of functional deficiencies by cell-type-specific mechanisms of genetic compensation. Conversely, genes not expressed in affected cell types are consistent with non-autonomous functions or requirements in a common progenitor [e.g., erbb3b (Budi et al., 2008), oca2 (Beirl et al., 2014)]. Genes for some well-studied mutants [e.g. kita/sparse (Johnson et al., 1995; Parichy et al., 1999 were expressed at levels too low to be detected by scRNA-Seq.
Figure 3—figure supplement 5
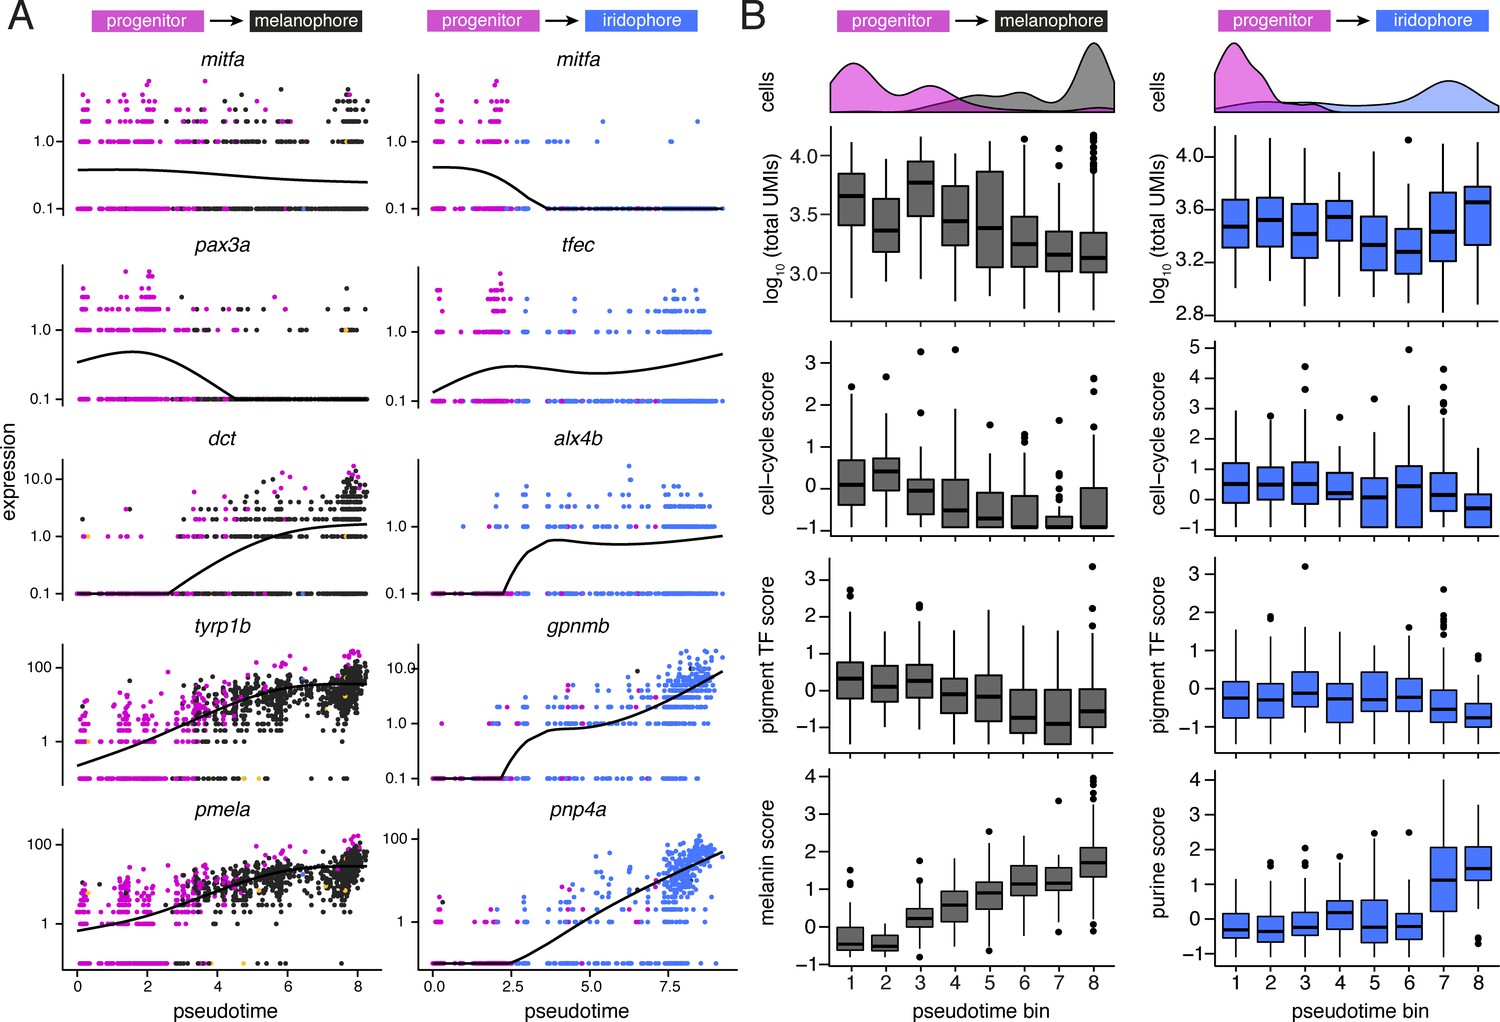
Dynamics of gene expression over pseudotime recapitulated distinct melanophore and iridophore differentiation programs.
(A) Expression of genes over pseudotime reflect predicted kinetics for melanophores and iridophores. Solid lines indicate smoothed expression curves for all cells in the branch. mitfa expression declined only marginally with melanophore differentiation yet decreased markedly with a transition from progenitor to iridophore as expected (Curran et al., 2010). pax3a was expressed in pigment progenitors (magenta) and decreased across pseudotime in melanophores, whereas expression of tfec, a transcription factor expressed in iridophores (Lister et al., 2011), increased over pseudotime. Melanin synthesis enzyme genes, dct and tyrp1b, as well as pmel, encoding a melanosome-associated transmembrane protein, all increased over pseudotime in melanophores. In iridophores, gpnmb and pnp4a showed elevated expression late in pseudotime, as expected (Curran et al., 2010; Higdon et al., 2013). (B) Trends of total transcript UMI counts, scores of expressed cell-cycle (e.g. ccnd1, pcna), pigment cell transcription factors (e.g. mitfa, tfec, pax7b, tfap2a), and pigment synthesis-related genes (e.g. impdh1b, gart, and atic for purine processing in iridophores; tyrp1b, pmela, and tyr for melanin synthesis in melanophores) in bins across pseudotime for melanophore and iridophore trajectory branches (for all score-associated genes, see Supplementary file 2—Table 4). Histograms indicate cell-type specific densities across pseudotime for each branch. For melanophores, total transcript number per cell decreased over pseudotime and expression levels of melanin synthesis genes increased. In iridophores, mRNA levels stayed relatively constant whereas expression of purine synthesis genes increased. The expression score for cell-cycle genes was greater for iridophores than melanophores at the terminal step of pseudotime (p<0.0002; Wilcoxon; pseudotime bin 8; n = 91 iridophores, 319 melanophores), consistent with iridophores continuing to proliferate even after differentiation, and melanophores normally failing to do so (Budi et al., 2011; Darzynkiewicz et al., 1980; McMenamin et al., 2014; Spiewak et al., 2018).
Figure 4
TH biased pigment cell lineages toward later steps of pseudotime.
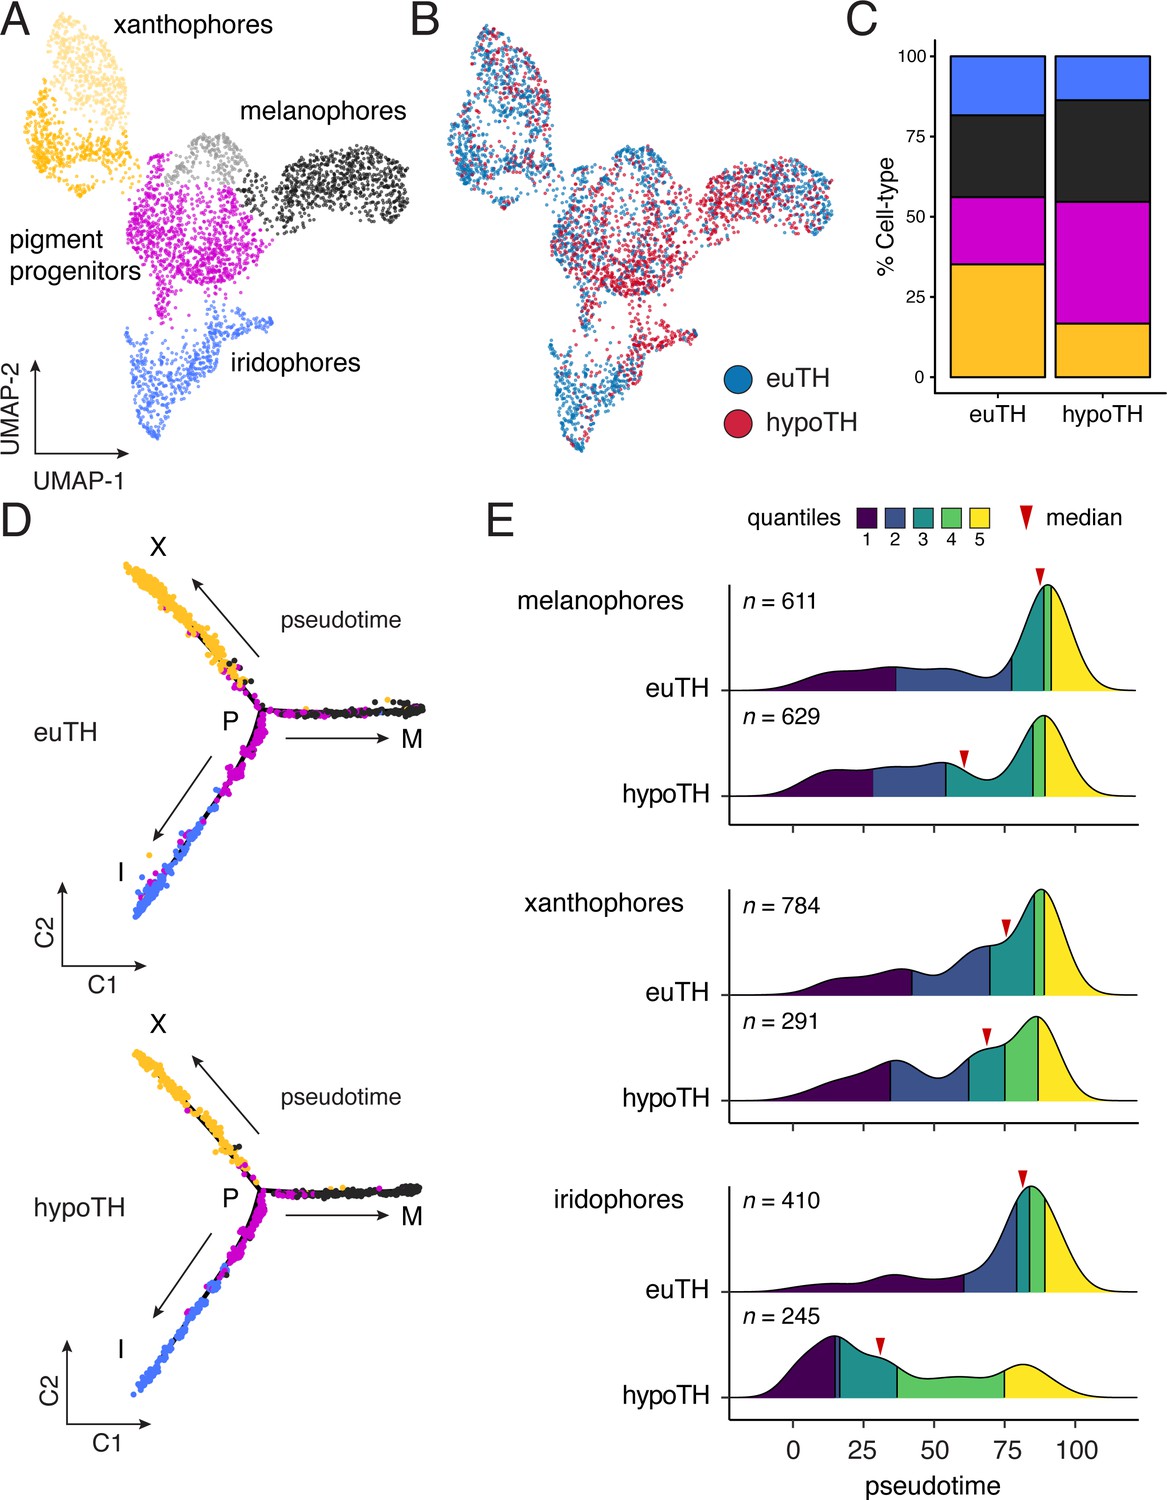
(A) UMAP dimensionality reduction of euthyroid and hypothyroid pigment cells and pigment progenitors. Sub-clustering revealed two xanthophore and two melanophore clusters (indicated by different shades of yellow and gray, respectively). (B) Pigment cells colored by TH status. Euthyroid and hypothyroid cells were generally intermixed with some biases apparent within melanophore and iridophore clusters. (C) Percentages of each pigment cell class by TH-status. Colors are consistent with other pigment cell plots. Of cells captured, a higher proportion of pigment cells from euthyroid fish were xanthophores and iridophores compared to those from hypothyroid fish. (D) Trajectories for euthyroid and hypothyroid pigment cells. Broad differences in trajectory topologies were not apparent between the two conditions. (E) Distributions of each pigment cell-type across pseudotime by condition. For each trajectory branch (mel, xan, irid), hypoTH cells were biased toward early pseudotime (Wilcoxon signed-rank tests, mel: Z = −6.54, p<0.0001, xan: Z = −4.54, p<0.0001, irid: Z = −13.55, p<0.0001). Median is indicated by red arrowhead and different colors demarcate quartiles over pseudotime.
Figure 5 with 1 supplement
TH promoted melanophore maturation by measures of transcriptomic state and cellular phenotype.
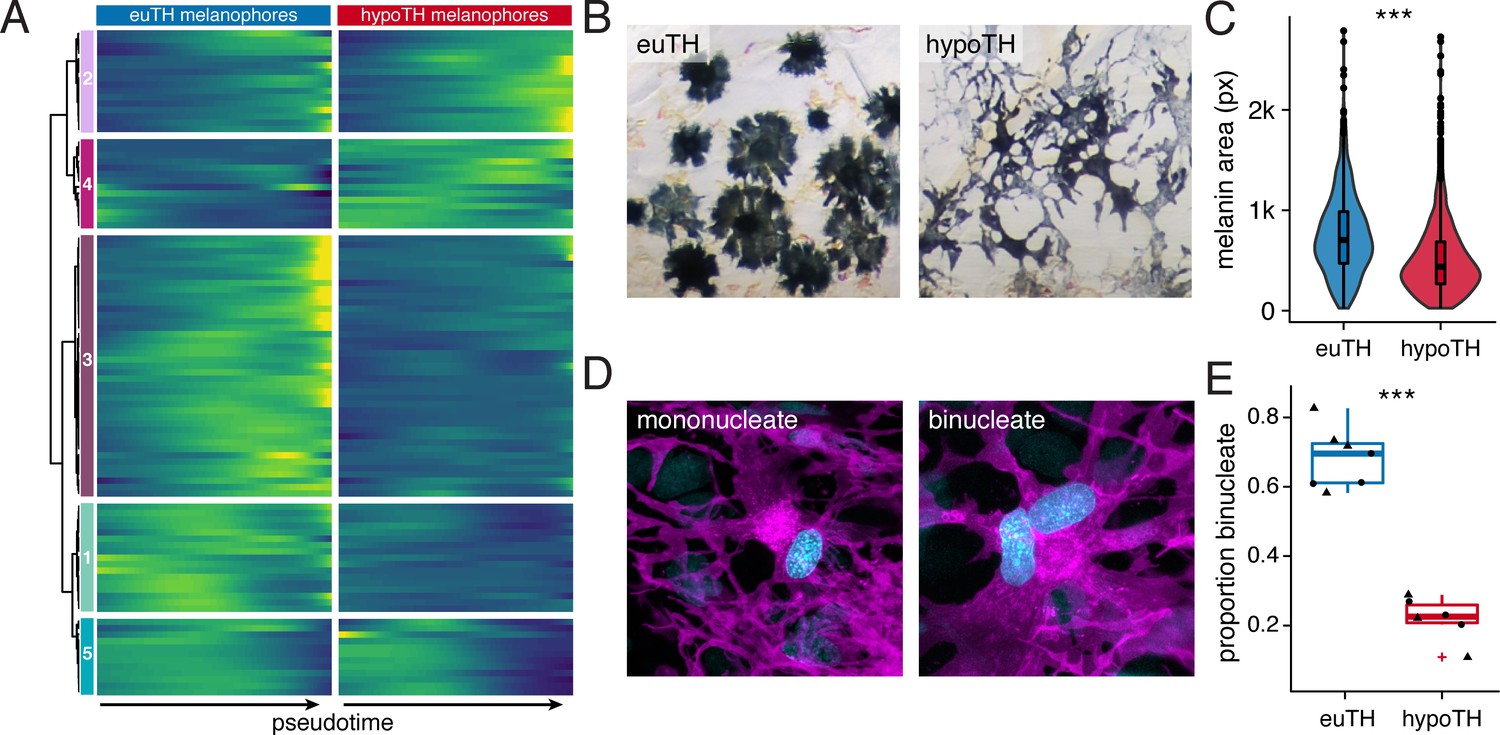
(A) Gene expression differences between melanophores over pseudotime by TH-status (q < 1E-7, genes expressed in >10% of melanophores). Heatmap is hierarchically clustered by row (method, Ward D2). The largest cluster (#3) contains 41% of the genes and represents loci expressed late in pseudotime of euthyroid melanophores but downregulated in hypothyroid melanophores (e.g. tfap2a and tyrp1b), identifying novel candidate genes for roles in melanophore maturation (see Supplementary file 2—Table 6, in which published melanophore-related genes are highlighted) (Baxter et al., 2019). (B) Euthyroid melanophores tended to be highly melanized and stellate, whereas hypothyroid melanophores were variably melanized and often dendritic. (C) Quantification of melanin contents per cell, as estimated by area of pixels (px) having melanin following contraction of melanin granules in response to epinephrine (e.g. Figure 1A). Melanophores of euthyroid fish contained more melanin than those of hypothyroid fish (F1,2710=271.2, p<0.0001), after controlling for individual variation among fish within TH conditions (F10,2710=8.5, p<0.0001; sample sizes: n = 1180 cells from five euthyroid fish, n = 1542 cells from five hypothyroid fish). If planar areas of concentrated melanin granules are assumed spherical, then euthyroid melanophores had on average ~1.7 x the total melanin content of hypothyroid melanophores. (Data in supplementary file Figure 5—source data 1) (D) Fully differentiated melanophores of zebrafish are often binucleate (Usui et al., 2018). Left panel shows a binucleate stripe melanophore in a euthyroid fish (12 SSL). Right panel shows a mononucleate melanophore in a hypothyroid fish at the same stage. Magenta, membrane labeling of melanophores by tyrp1b:palm-mCherry. Blue, nuclei revealed by tuba8l3:nEosFP. (E) Euthyroid fish had proportionally more binucleate melanophores than hypothyroid fish (χ2=230.3, d.f. = 1, p<0.0001) after controlling for a higher incidence of binucleation in developmentally more advanced fish overall (11.5–13 SSL; χ2 = 5.5, d.f. = 1, p<0.05). Individual points indicate proportions of binucleate melanophores observed in dorsal stripes (circles) and ventral stripes (diamonds), which did not differ significantly (p=0.8; sample sizes: n = 383 melanophores in four euthyroid fish, n = 706 melanophores in three hypothyroid fish). (Data in supplementary file Figure 5—source data 2).
-
Figure 5—source data 1
Melanin content data corresponding to Figure 5C.
- https://doi.org/10.7554/eLife.45181.021
-
Figure 5—source data 2
Melanophore binucleation incidence data corresponding to Figure 5E.
- https://doi.org/10.7554/eLife.45181.022
Figure 5—figure supplement 1
Metrics of melanophore maturation in response to TH.
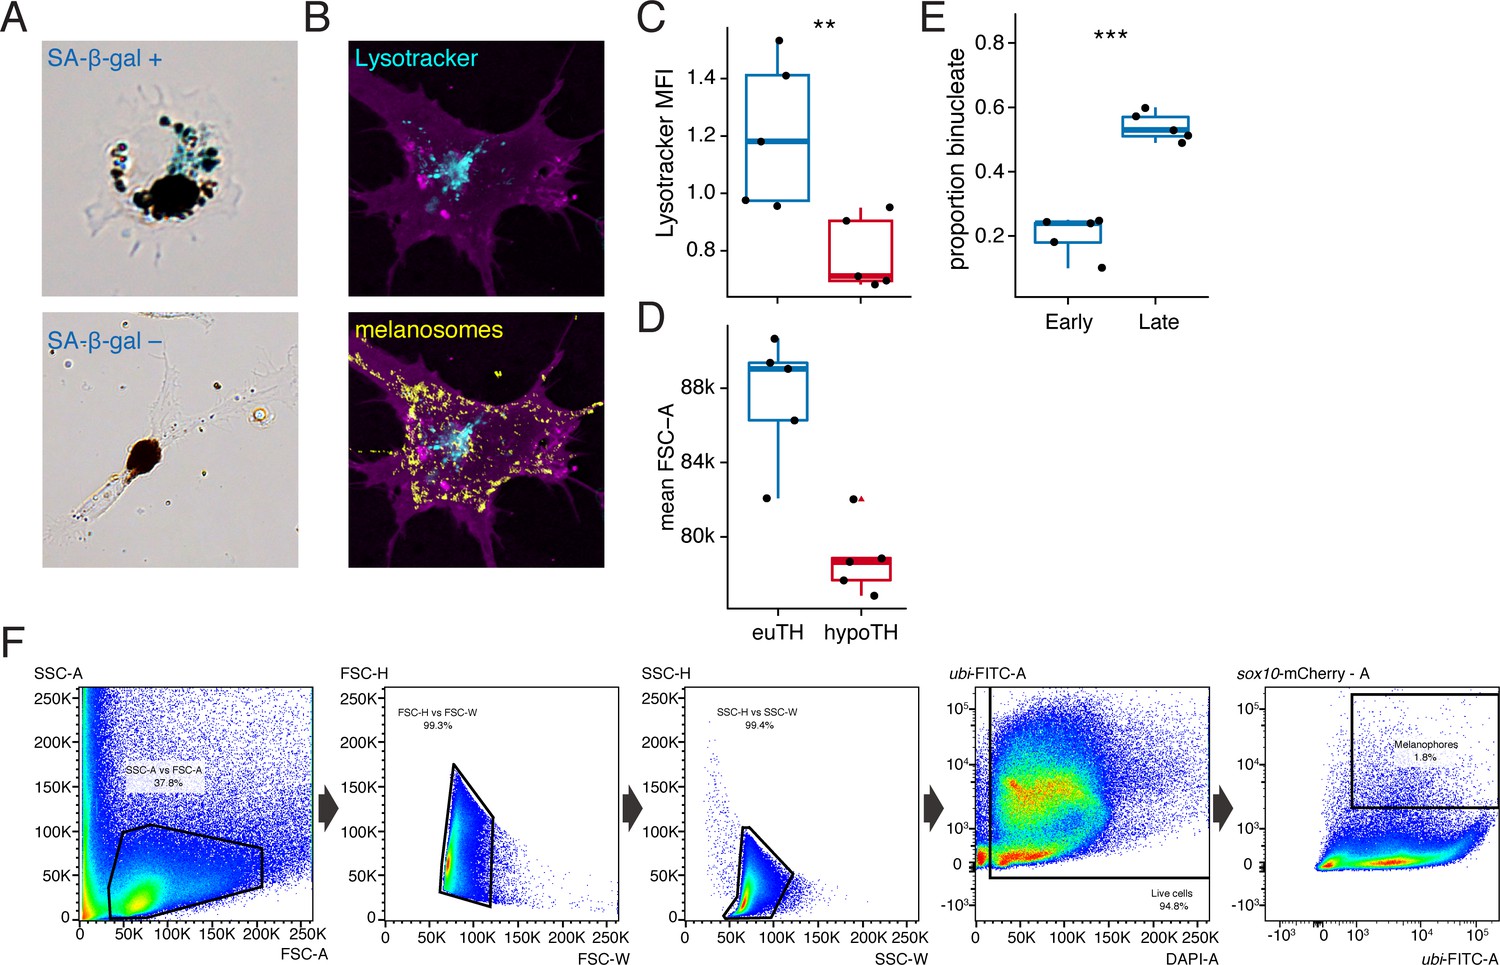
(A) Melanophores plated ex vivo from fish at terminal stages of stripe development had diverse morphologies and some exhibited senescence-associated β-galactosidase staining (SA-β-gal; blue precipitate, upper panel), though relative intensities of staining were difficult to score, precluding a quantitative assessment. Xanthophores plated ex vivo did not exhibit SA-β-gal staining. (B) Lysosomes were revealed in tyrp1b:palm-mCherry+ (magenta) melanophores by Lysotracker dye (cyan), which did not stain melanosomes (yellow) despite some similarities between these organelles (Raposo et al., 2007). Melanosomes were visualized in bright field and an inverted and pseudocolored overlay is shown here. (C) Lysosomal content revealed significantly greater normalized mean fluorescence intensity (MFI) of Lysotracker dye in melanophores from euthyroid fish as compared to hypothyroid fish (euthyroid, 20,423 melanophores from 10 fish; hypothyroid, 87,252 melanophores from 10 fish; p<0.01, Wilcoxon). (D) FSC-A values were higher for euthyroid compared to hypothyroid cells overall [p<0.001; cells are the same as in (C) ], consistent with an overall difference in cell size. (C and D data in supplementary file Figure 5—figure supplement 1—source data 1). (E) Euthyroid fish at a later stage of pattern formation exhibited a higher proportion of binucleate melanophores compared to those at earlier stages (early, 7.2 SSL: n = 153 in five fish; late, 11 SSL: n = 477 melanophores in five fish; p<0.001). (Data in supplementary file Figure 5—figure supplement 1—source data 2). (F) Sequential FACS gating strategy (left to right) used in determining Lysotracker normalized MFI. For details, see Materials and methods. (SSC, side scatter; FSC, forward scatter; W, width; H, height; A, area).
-
Figure 5—figure supplement 1—source data 1
Lysotracker FACS data corresponding to Figure 5—figure supplement 1C and D.
- https://doi.org/10.7554/eLife.45181.019
-
Figure 5—figure supplement 1—source data 2
Melanophore binucleation incidence data corresponding to Figure 5—figure supplement 1E.
- https://doi.org/10.7554/eLife.45181.020
Figure 6 with 4 supplements
TH promotes xanthophore maturation via scarb1-dependent carotenoid uptake.
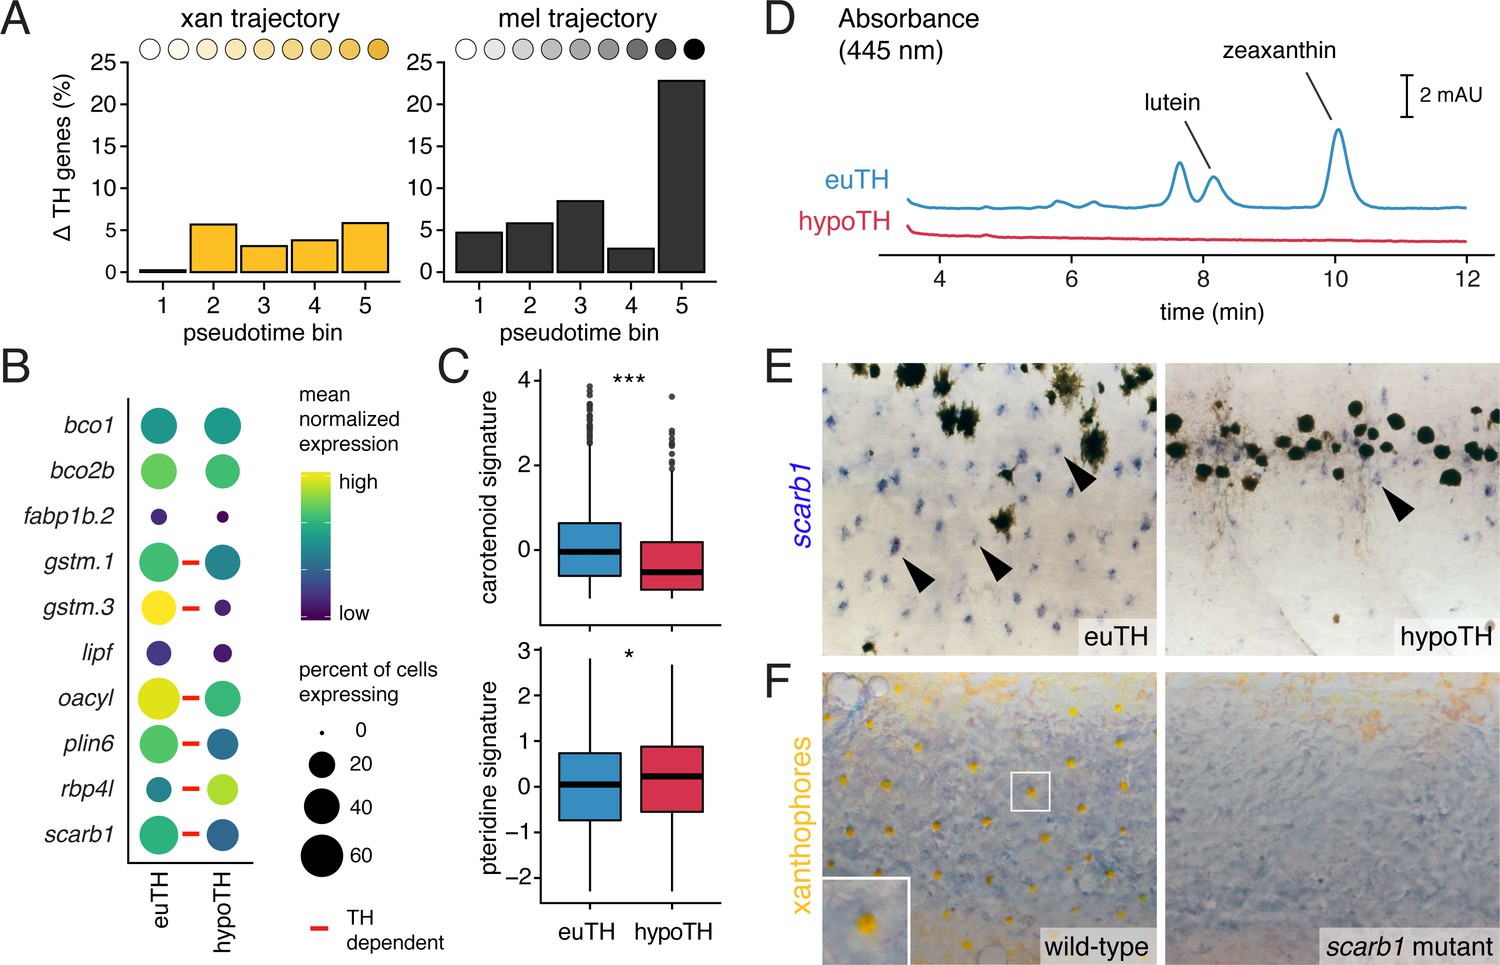
(A) Proportions of differentially expressed genes in euthyroid and hypothyroid cells across pseudotime bins. Xanthophores expressed fewer TH-dependent genes than melanophores (expressed gene cutoff = 2% of bin expressing, DEGs are genes with q < 0.05 and fold change >1.5X). Of 160 xanthophore DEGs and 519 melanophore DEGs, only 58 were found to be overlapping. (B) TH-dependent expression of genes related to carotenoid pigmentation in xanthophores. Red bars: q < 0.05, log2 fold-change ≥2.0. (C) Carotenoid pathway gene expression score was higher in xanthophore lineage cells of euthyroid fish compared to hypothyroid fish (p=1.5E-15, Wilcoxon). By contrast, pteridine pathway gene expression was marginally lower in cells from euthyroid fish (p=0.01). Box-and-whisker plots represent scores across groups (center line, median; box limits, upper and lower quartiles; whiskers, 1.5x interquartile range; points, outliers). (D) Carotenoids were detected by HPLC in skin containing xanthophores of euthyroid but not hypothyroid fish (11 SSL). (E) scarb1 expression in euthyroid and hypothyroid zebrafish (10 SSL). (F) scarb1 mutants lacked mature, yellow xanthophores (12 SSL).
Figure 6—figure supplement 1
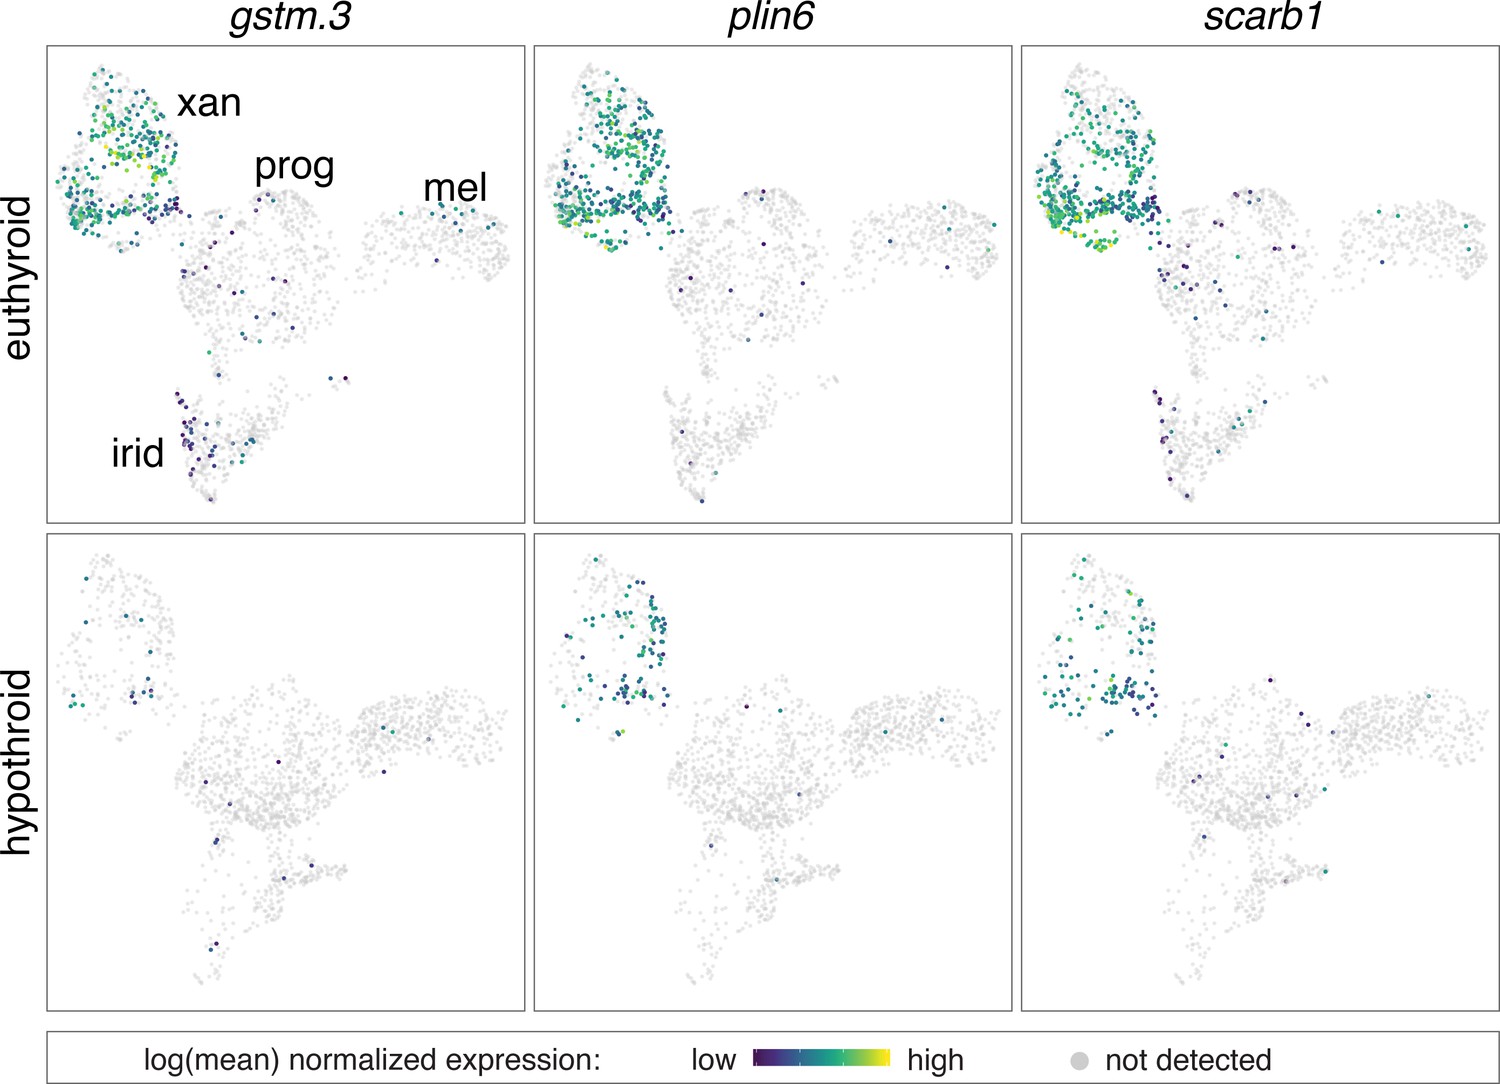
Expression of multiple carotenoid-related genes in xanthophores are affected by TH.
UMAP plots of pigment cell clusters colored by expression of TH-dependent genes in xanthophores: gstm.3 (q = 6.9E-99, log2fold-change = 4.3), plin6 (q = 1.9E-13, log2fold-change = 1.3), scarb1 (q = 3.5E-11, log2fold-change = 1.2).
-
Figure 6—figure supplement 1—source data 1
Xanthophore lipid droplet incidence corresponding to Figure 6—figure supplement 2A.
- https://doi.org/10.7554/eLife.45181.025
Figure 6—figure supplement 2
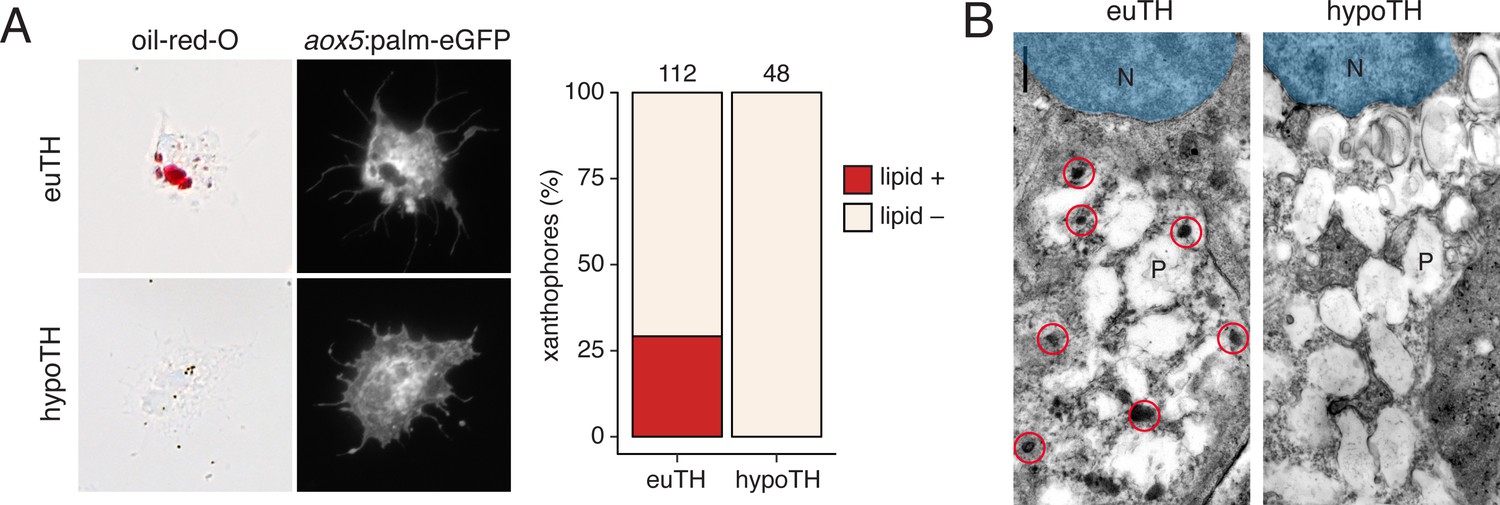
TH promotes development of lipid-filled carotenoid droplets in xanthophores.
(A) Carotenoid pigments are normally localized to lipid droplets, the presence of which can be revealed by Oil-red-O staining. Here, a proportion of aox5:palmEGFP+ xanthophores stained ex vivo from euthyroid fish (n = 112 cells) contained lipid (red), whereas xanthophores from hypothyroid fish (n = 48 cells) were never observed to have such lipid contents. (Incidence data in supplementary file Figure 6—figure supplement 1—source data 1.) (B) Ultrastructurally, carotenoids and lipids are detectable as electron-dense carotenoid vesicles (red circles) (Djurdjevič et al., 2015; Granneman et al., 2017; Obika, 1993), which were observed in xanthophores from euthyroid but not hypothyroid fish. N, nucleus. P, pterinosome—the pteridine-containing organelle of xanthophores (Bagnara et al., 1968; Hirata et al., 2003; Matsumoto, 1965; Obika, 1993).
Figure 6—figure supplement 3
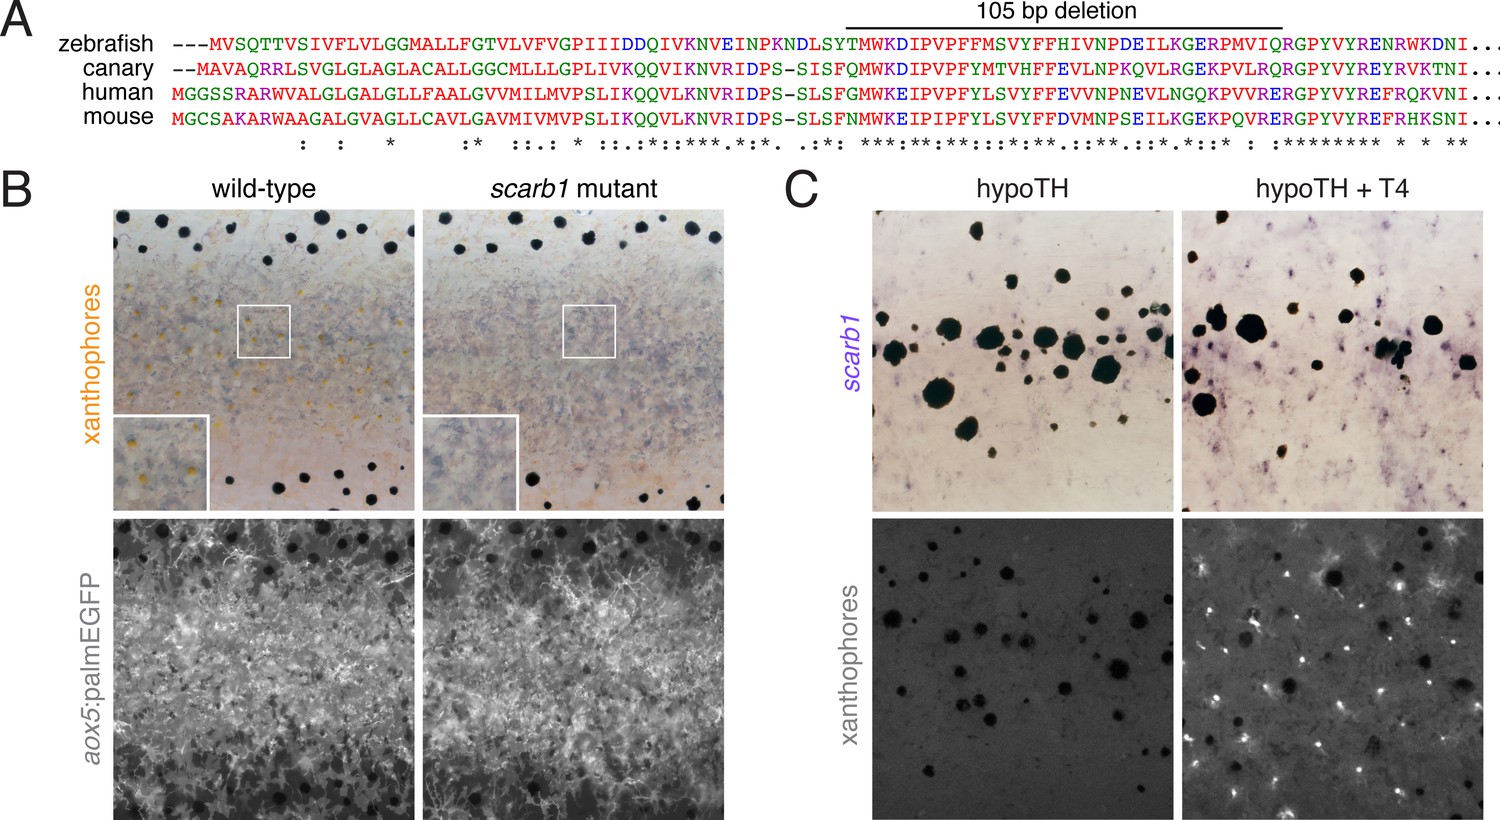
scarb1 is specifically involved in xanthophore maturation and is induced by TH.
(A) Scarb1 protein alignment. Zebrafish scarb1 mutants had a 105 bp, in-frame deletion in a conserved region of the protein. (B) scarb1 mutants lacked mature, interstripe xanthophores but had normal stripes and aox5:palmEGFP expression, suggesting that patterning and unpigmented xanthophores were normal. (C) In hypothyroid fish treated with exogenous TH (T4), scarb1 expression was rescued within ~1 d (upper) and carotenoid autofluorescence of xanthophores was recovered within ~2 d (lower).
Figure 6—figure supplement 4
Xanthophores switch yellow pigmentation programs during the larval-to-adult transition.
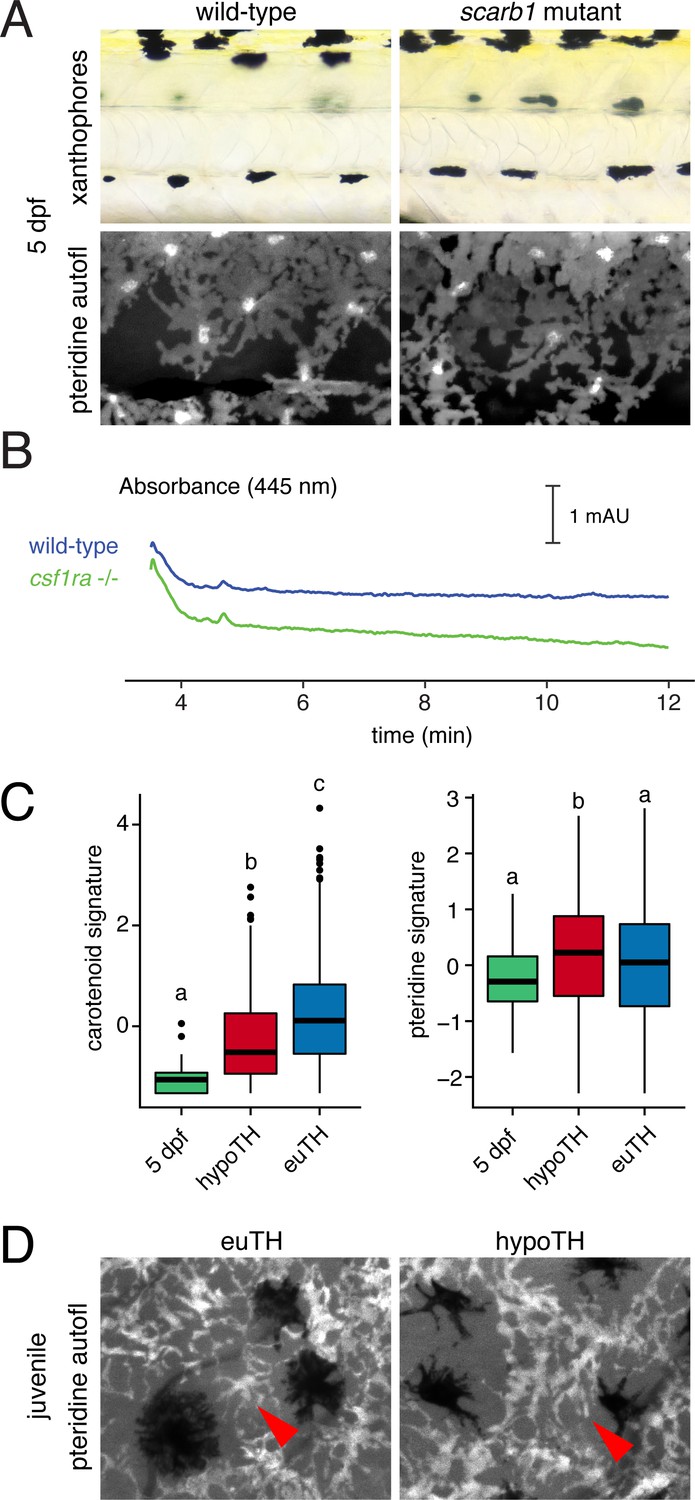
(A) At 5 dpf, scarb1 mutants had yellow larval xanthophores with wild-type levels of pteridines. (B) Carotenoids were not detectable in EL zebrafish (5 dpf, wild-type; compare to Figure 3D); csf1ra mutants, which lack xanthophores, had HPLC profiles indistinguishable from wild-type. (C) Carotenoid and pteridine pathway signature scores for xanthophores in euthyroid EL and euthyroid and hypothyroid adult scRNA-Seq data sets. Box plots as in Figure 3 with different letters above data indicating significant differences in post hoc comparisons (carotenoid, p<2e-16; pteridine, p=0.01; Tukey HSD). Pteridine signatures between EL, hypothyroid, and euthyroid xanthophores were more similar than carotenoid signatures. (D) Ammonia-induced pteridine fluorescence was present in adult xanthophores of both euthyroid and hypothyroid fish (red arrowheads).
Figure 7 with 1 supplement
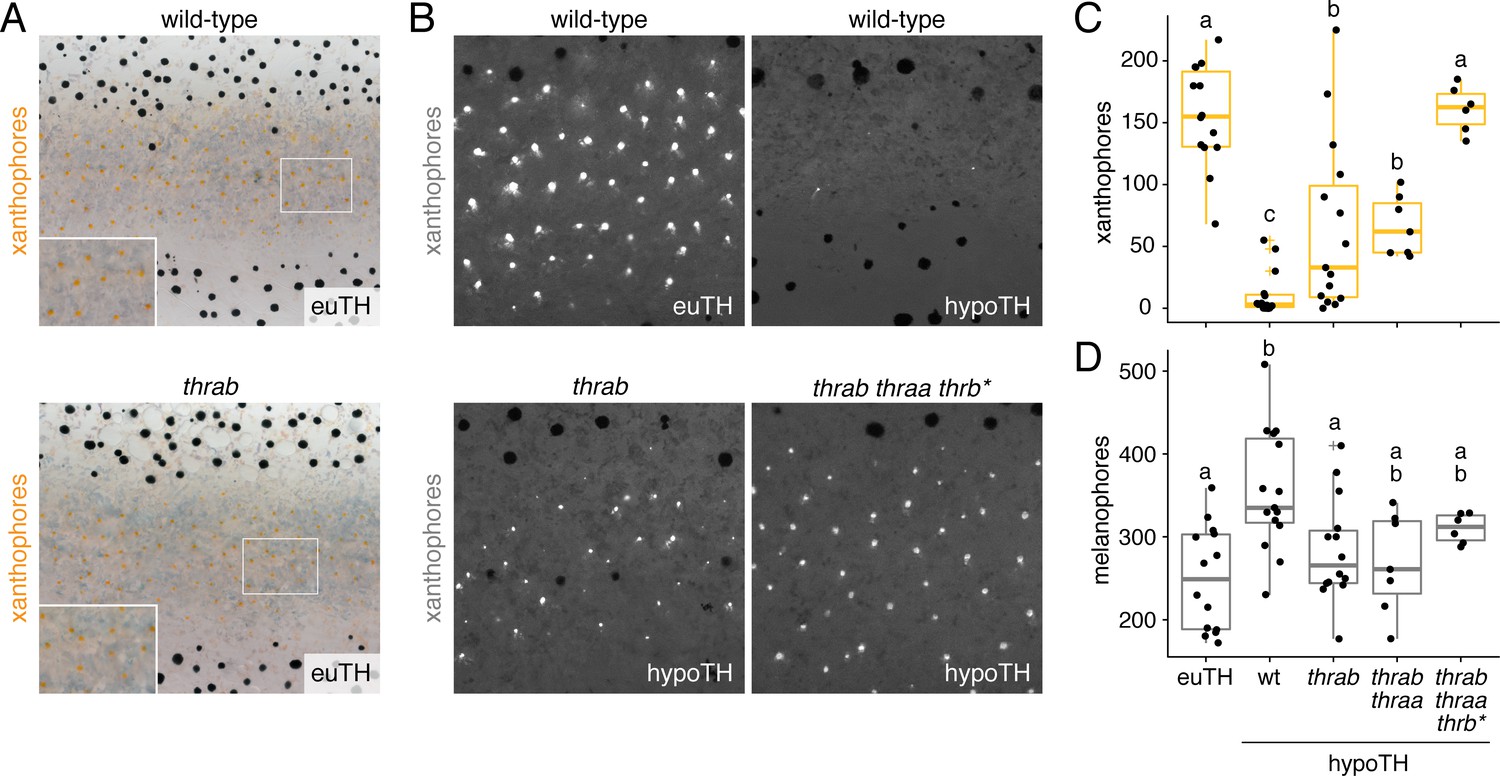
TH receptors repress developmental progression of pigment cell lineages.
(A) In euthyroid fish, homozygous TR mutants singly and in combination resembled wild-type; shown is thrab. (B) Euthyroid fish wild-type for TRs exhibited numerous autofluorescing, carotenoid-containing xanthophores (upper left), whereas hypothyroid fish wild-type for TRs lacked nearly all these cells (upper right). By contrast, hypothyroid fish mutant for TRs developed substantial complements of these cells. Shown here are representative individuals homozygous for thrab mutation (lower left) and homozygous thrab individuals with somatically induced mutations for thraa (*) as well as doubly thraa and thrab individuals with somatically induced mutations for thrb (thrb*; lower right). Fish are 11.5 SSL. (C, D) Homozygous thrab mutation partially rescued numbers of pigmented xanthophores and more fully rescued numbers of melanophores in hypothyroid fish. Somatic mutagenesis of thraa in fish homozygous mutant for thrab mutants (thrab thraa*) did not significantly enhance the rescue of xanthophore maturation or melanophore numbers. By contrast somatic mutagenesis of thrb in fish doubly homozygous mutant for thraa and thrab (thrab thraa thrb*) rescued xanthophore maturation to wild-type levels in the absence of TH. Numbers of visible xanthophores and melanophores were not distinguishable between euthyroid fish wild-type or homozygous mutant for TR mutations either singly or in combination (p>0.1) and are shown combined here. Box plots as in Figure 6C with different letters above data indicating significant differences in post hoc comparisons (Tukey HSD, p<0.05). (Cell counts in supplementary file Figure 7—source data 1.).
-
Figure 7—source data 1
Counts for xanthophores and melanophores corresponding to Figure 7C and D.
- https://doi.org/10.7554/eLife.45181.031
Figure 7—figure supplement 1
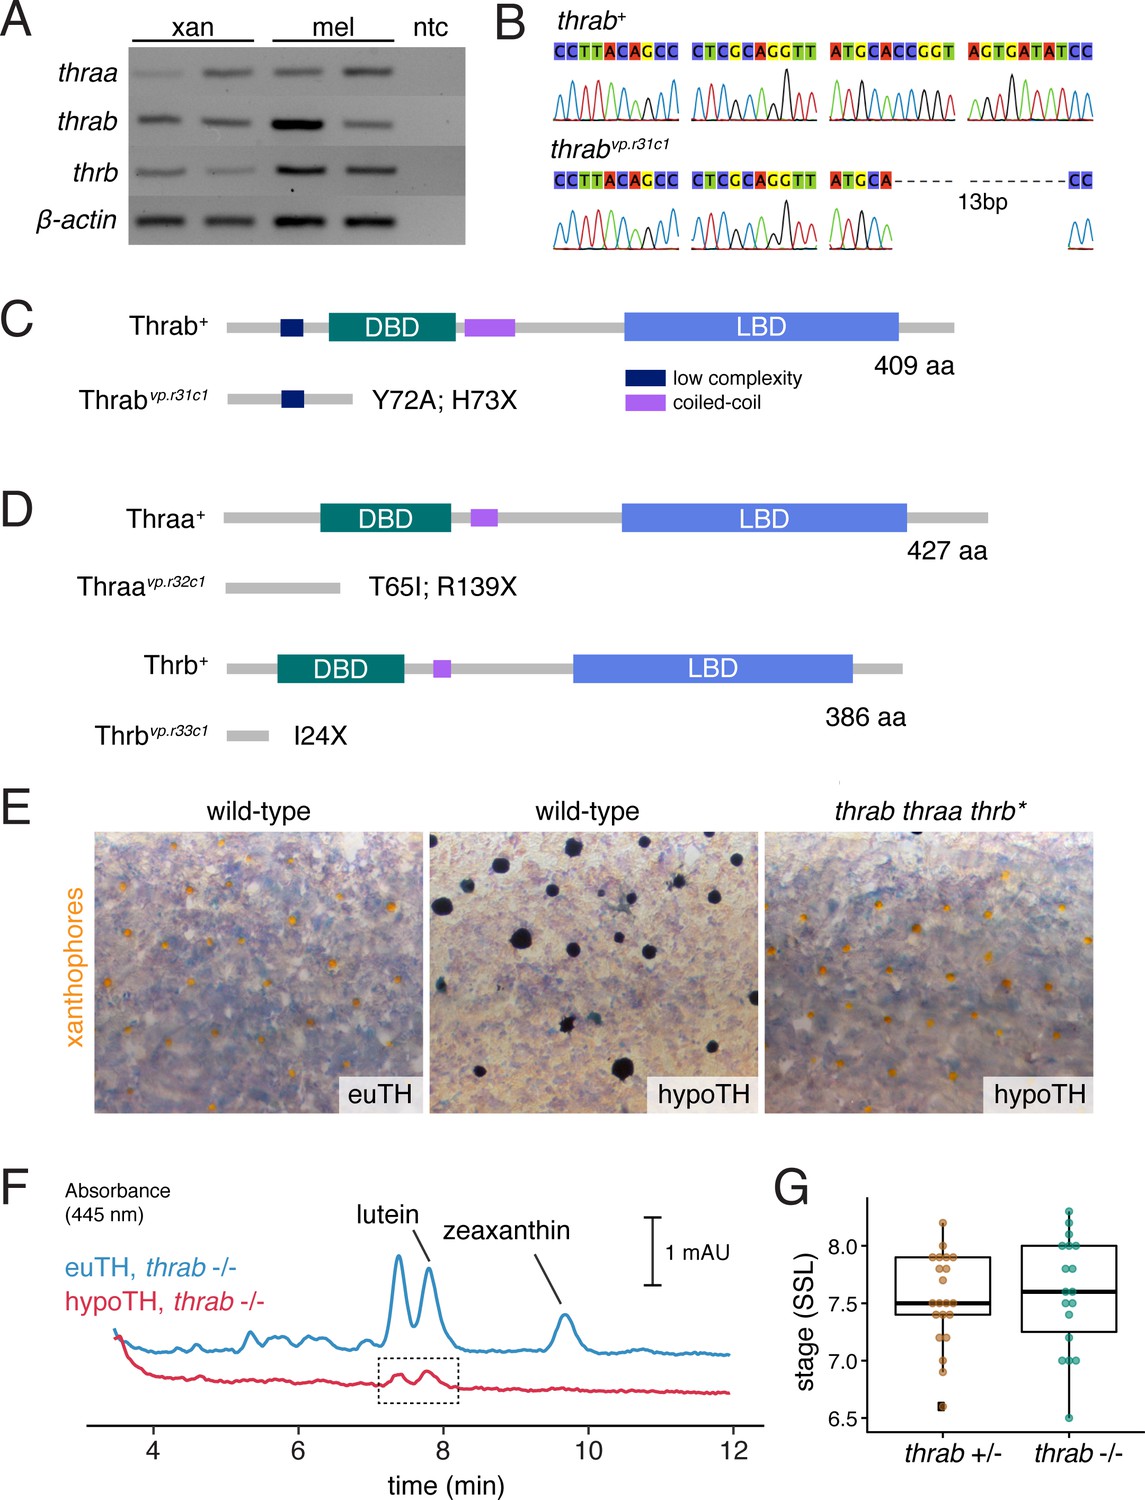
Zebrafish TR gene expression and mutants.
(A) RT-PCR for thraa, thrab, and thrb in xanthophores and melanophores sorted by FACS for aox5:palmEGFP and tyrp1b:palm-mCherry, respectively. (B) Sanger sequencing of CRISPR/Cas9-induced mutant allele of thrab revealed a 13 bp deletion. (C) Schematic of Thrab wild-type and mutant proteins illustrating introduction of a novel amino acid followed by a premature stop codon at position 73. DBD, DNA-binding domain; LBD, ligand binding domain. (D) Additional CRISPR/Cas9 mutant alleles for thraa and thrb had phenotypes indistinguishable from wild-type or thrab (Figure 7A). (E) Xanthophore color phenotypes of euthyroid and hypothyroid wild-type fish, and rescue of xanthophore color in hypothyroid fish upon TR mutation (thrab thraa thrb*). (F) HPLC revealed persisting carotenoids in hypothyroid fish mutant for thrab (boxed region), in contrast to the absence of detectable carotenoids in hypothyroid fish that were wild-type for thrab (Figure 6D). (G) Stage of first xanthophore appearance did not differ significantly (p=0.7) between euthyroid fish that were heterozygous or homozygous wild-type for thrab mutation.
Figure 8
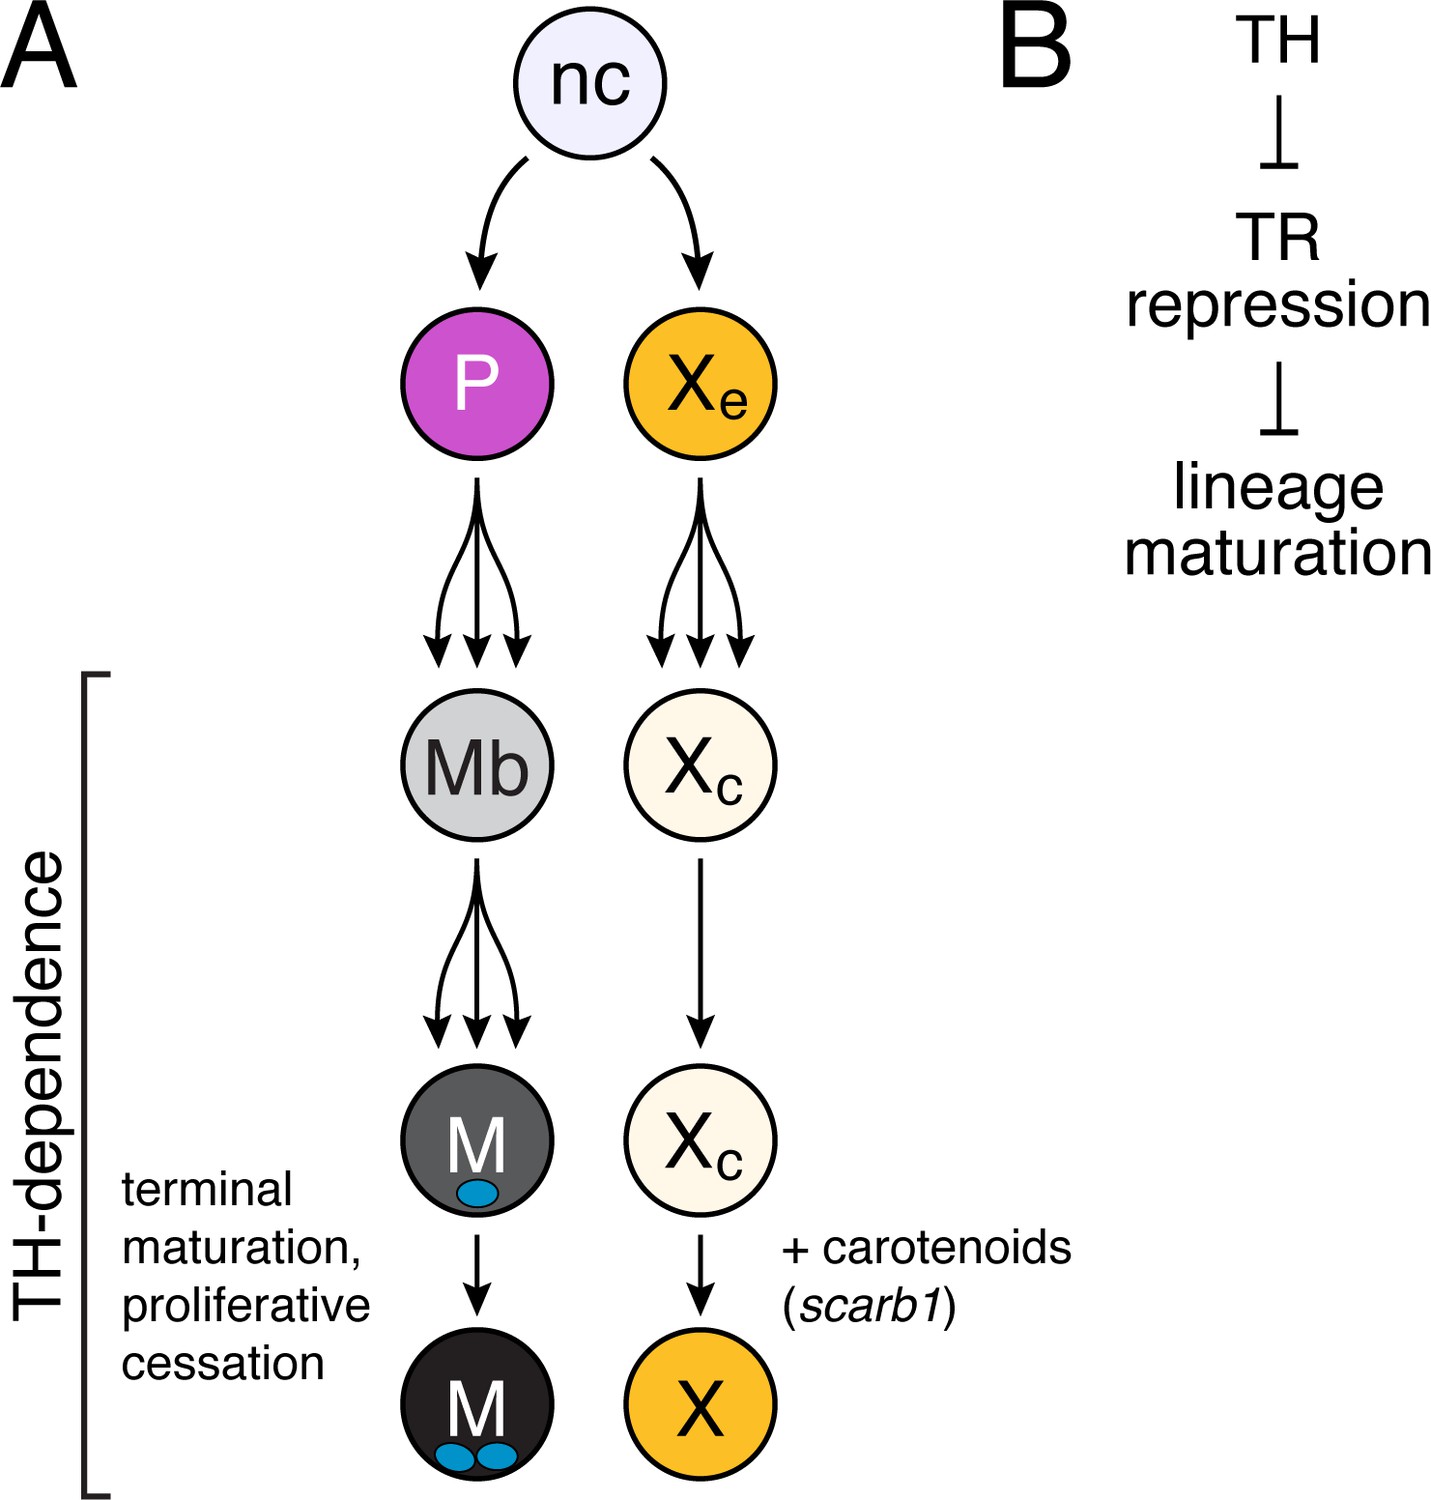
Model of TH dependence in zebrafish pigment cell lineages.
(A) Post-embryonic progenitor-derived, specified adult melanoblasts (Mb) that expand their population and differentiate to a state of proliferative cessation (McMenamin et al., 2014), binucleate state, and EL-derived cryptic xanthophores that redifferentiate as carotenoid-containing yellow/orange adult xanthophores. Disparate cell-type-specific outcomes in fish lacking TH reflect differences in events required for maturation between sublineages. (B) TH-dependent lineage maturation involves a double negative gate, with essential repressive effects of unliganded TR.
Tables
Key resources table
| Reagent type (species) or resource | Designation | Source or reference | Identifiers | Additional information |
|---|---|---|---|---|
| Gene (Danio rerio) | bco1 | this paper | NCBI_Reference_Sequence:NM_001328495.1 | Amplified from cDNA |
| Gene (Danio rerio) | bco2b | this paper | NCBI_Reference_Sequence:NM_001040312.1 | Amplified from cDNA |
| Gene (Danio rerio) | bscl2l | this paper | NCBI_Reference_Sequence:NM_001013553.2 | Amplified from cDNA |
| Gene (Danio rerio) | slc2a11b | this paper | NCBI_Reference_Sequence:NM_001114430.1 | Amplified from cDNA |
| Gene (Danio rerio) | slc22a7a | this paper | NCBI_Reference_Sequence:M_001083861.1 | Amplified from cDNA |
| Gene (Danio rerio) | wu:fc46h12 | this paper | NCBI_Reference_Sequence:NM_001291347.1 | Amplified from cDNA |
| Gene (Danio rerio) | alx4a | this paper | NCBI_Reference_Sequence:XM_001340930 | Amplified from cDNA |
| Gene (Danio rerio) | alx4b | this paper | NCBI_Reference_Sequence:NM_001310078.1 | Amplified from cDNA |
| Gene (Danio rerio) | crip2 | this paper | NCBI_Reference_Sequence:NM_001005968.1 | Amplified from cDNA |
| Gene (Danio rerio) | defbl1 | this paper | NCBI_Reference_Sequence:NM_001081553.1 | Amplified from cDNA |
| Strain, strain background (Danio rerio) | Tg(tg:nVenus-v2a-nfnB) | PMID:25170046 | NA | NA |
| Strain, strain background (Danio rerio) | WT(ABb) | PMID:23737760 | NA | NA |
| Strain, strain background (Danio rerio) | Tg(aox5:palmEGFP)wp.rt22 | PMID:25170046 | NA | NA |
| Strain, strain background (Danio rerio) | Tg(tyrp1b:palm-mCherry)wp.rt11 | PMID:25170046 | NA | NA |
| Strain, strain background (Danio rerio) | Tg(−28.5Sox10:Cre)zf384 | Gift. PMID:23155370 | NA | NA |
| Strain, strain background (Danio rerio) | Tg(−3.5ubi:loxP-eGFP-loxP-mCherry)cz1701 | Gift. PMID:21138979 | NA | NA |
| Strain, strain background (Danio rerio) | Tg(tuba8l3:nEosFP)vp.rt17 | this paper | NA | NA |
| Strain, strain background (Danio rerio) | thraavp33rc1 | this paper | NA | NA |
| Strain, strain background (Danio rerio) | thrabvp31rc1 | this paper | NA | NA |
| Strain, strain background (Danio rerio) | thrbvp34rc1 | this paper | NA | NA |
| Strain, strain background (Danio rerio) | scarb1vp32rc1 | this paper | NA | NA |
| Strain, strain background (Danio rerio) | tyrvp35rc1 | this paper | NA | NA |
| Antibody | anti-Dig-AP, sheep polyclonal Fab fragments | Millipore-Sigma | SKU_millipore-sigma:11093274910 | 1:5000 overnight at 4°C |
| Antibody | anti-GFP rabbit polyclonal antibody | Thermo Fisher | CatalogNo_A-11122 | 1:1000 overnight at 4°C |
| Commercial assay or kit | Lysotracker Far Red | Thermo Fisher | CatalogNo_L12492 | 75 nM |
| Commercial assay or kit | Vybrant DyeCycle Violet stain | Thermo Fisher | CatalogNo_V35003 | 5 μM |
| Commercial assay or kit | Senescence associated β-Galactosidase Staining Kit | Cell Signaling Technologies | CatalogNo_9860 | NA |
| Chemical compound, drug | Metronidazole | Acros Organics | CatalogNo_210341000 | NA |
| Chemical compound, drug | Oil Red O | Millipore-Sigma | CatalogNo_3125–12 | 5 mM |
| Software, algorithm | Cellranger | 10X Genomics | v2.0.2 | |
| Software, algorithm | Monocle | NA | v2.9.0 and v2.99.1 | https://github.com/cole-trapnell-lab/monocle-release.git |
Additional files
-
Supplementary file 1
Interactive three-dimensional UMAP representation of transcriptomic space.
Cells are colored by type corresponding to Figure 2A.
- https://doi.org/10.7554/eLife.45181.033
-
Supplementary file 2
scRNA seq analyses.
- https://doi.org/10.7554/eLife.45181.034
-
Transparent reporting form
- https://doi.org/10.7554/eLife.45181.035
Download links
A two-part list of links to download the article, or parts of the article, in various formats.
Downloads (link to download the article as PDF)
Open citations (links to open the citations from this article in various online reference manager services)
Cite this article (links to download the citations from this article in formats compatible with various reference manager tools)
Thyroid hormone regulates distinct paths to maturation in pigment cell lineages
eLife 8:e45181.
https://doi.org/10.7554/eLife.45181


