Conformational switches control early maturation of the eukaryotic small ribosomal subunit
- The Rockefeller University, United States
Figures
Figure 1 with 3 supplements
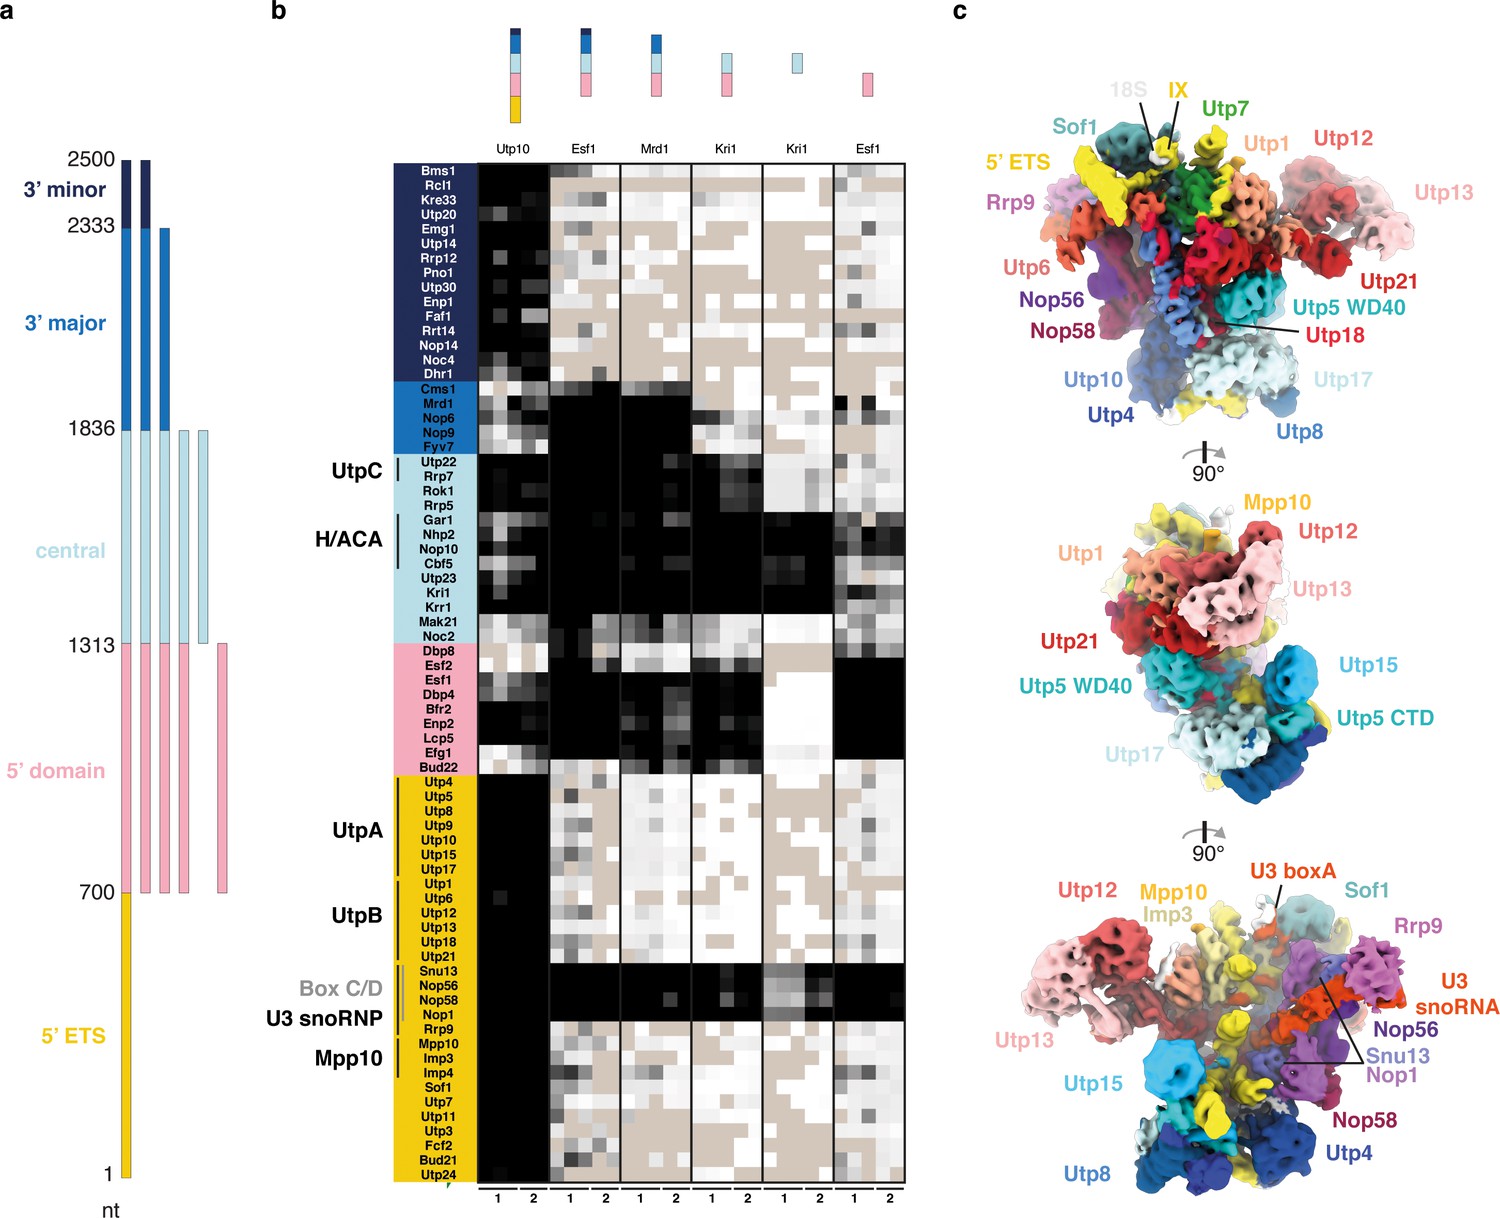
The 18S rRNA domains recruit assembly factors independent of the 5’ ETS.
(a) Schematics of rRNA mimics with color-coded rRNA domains. (b) Bait-normalized (MS2-protein) iBAQ based heat-map (proteins not detected in light brown, low abundance to high abundance in gradient from white to black) of ribosome biogenesis factors co-purified with pre-rRNA constructs shown in (a). Each biological replicate (n = 2) is labeled at the bottom and all technical replicates (n = 3, n = 2) are shown. (c) Three 90° related views of the cryo-EM structure of the 5’ ETS RNP lowpass-filtered to 5 Å with density colored according to subunits. Subunits of UtpA (shades of blue), UtpB (shades of red) and U3 snoRNP (shades of purple with U3 snoRNA in red) are shown.
Figure 1—figure supplement 1
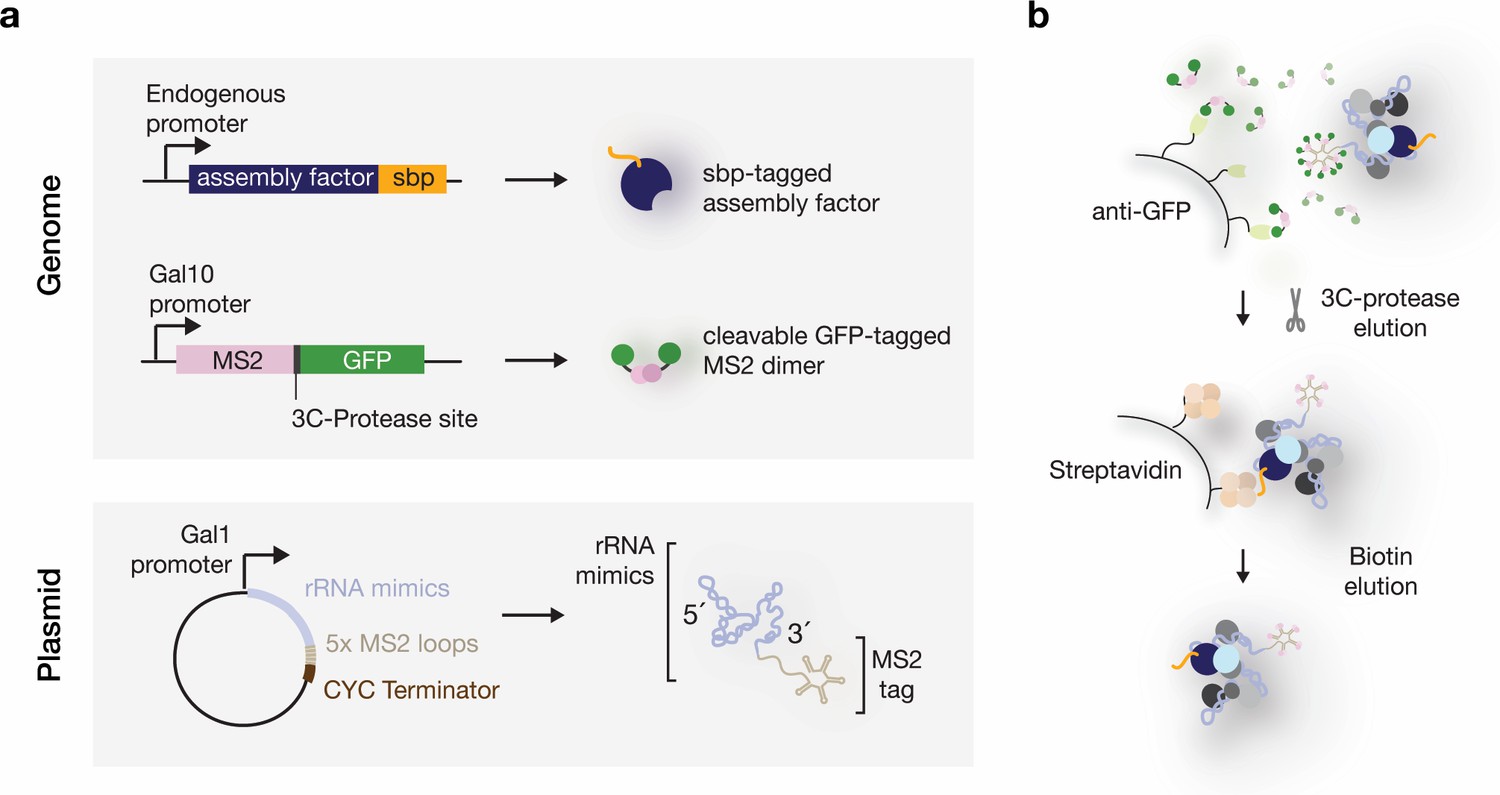
Expression and purification system used to isolate RNPs containing defined rRNA mimics.
(a) Schematic overview of the genetic components in yeast strains used to purify rRNA mimics and associated proteins. rRNA mimics (light-blue) tagged at their 3’ ends with five MS2-aptamer stem-loops (beige) are expressed from a plasmid. A galactose inducible promoter (Gal1) and a CYC terminator are used to control the RNA polymerase-II-driven expression of the pre-rRNA sequences. A single galactose-inducible copy of the GFP (green) tagged MS2 protein (pink) is integrated in the yeast genome. Endogenous ribosome assembly factors (dark-blue) are tagged with a streptavidin binding peptide (sbp) (orange). (b) In vivo, the galactose induced rRNA mimics recruit endogenous ribosome assembly proteins and the MS2-3C-GFP dimers. The RNPs are immobilized on anti-GFP nanobody (light-green) covered beads through the MS2-3C-GFP moiety. 3C-protease cleavage elutes the particles, which are then subjected to a second affinity purification step on streptavidin (light-orange) coated beads. Biotin elutes the RNPs.
Figure 1—figure supplement 2
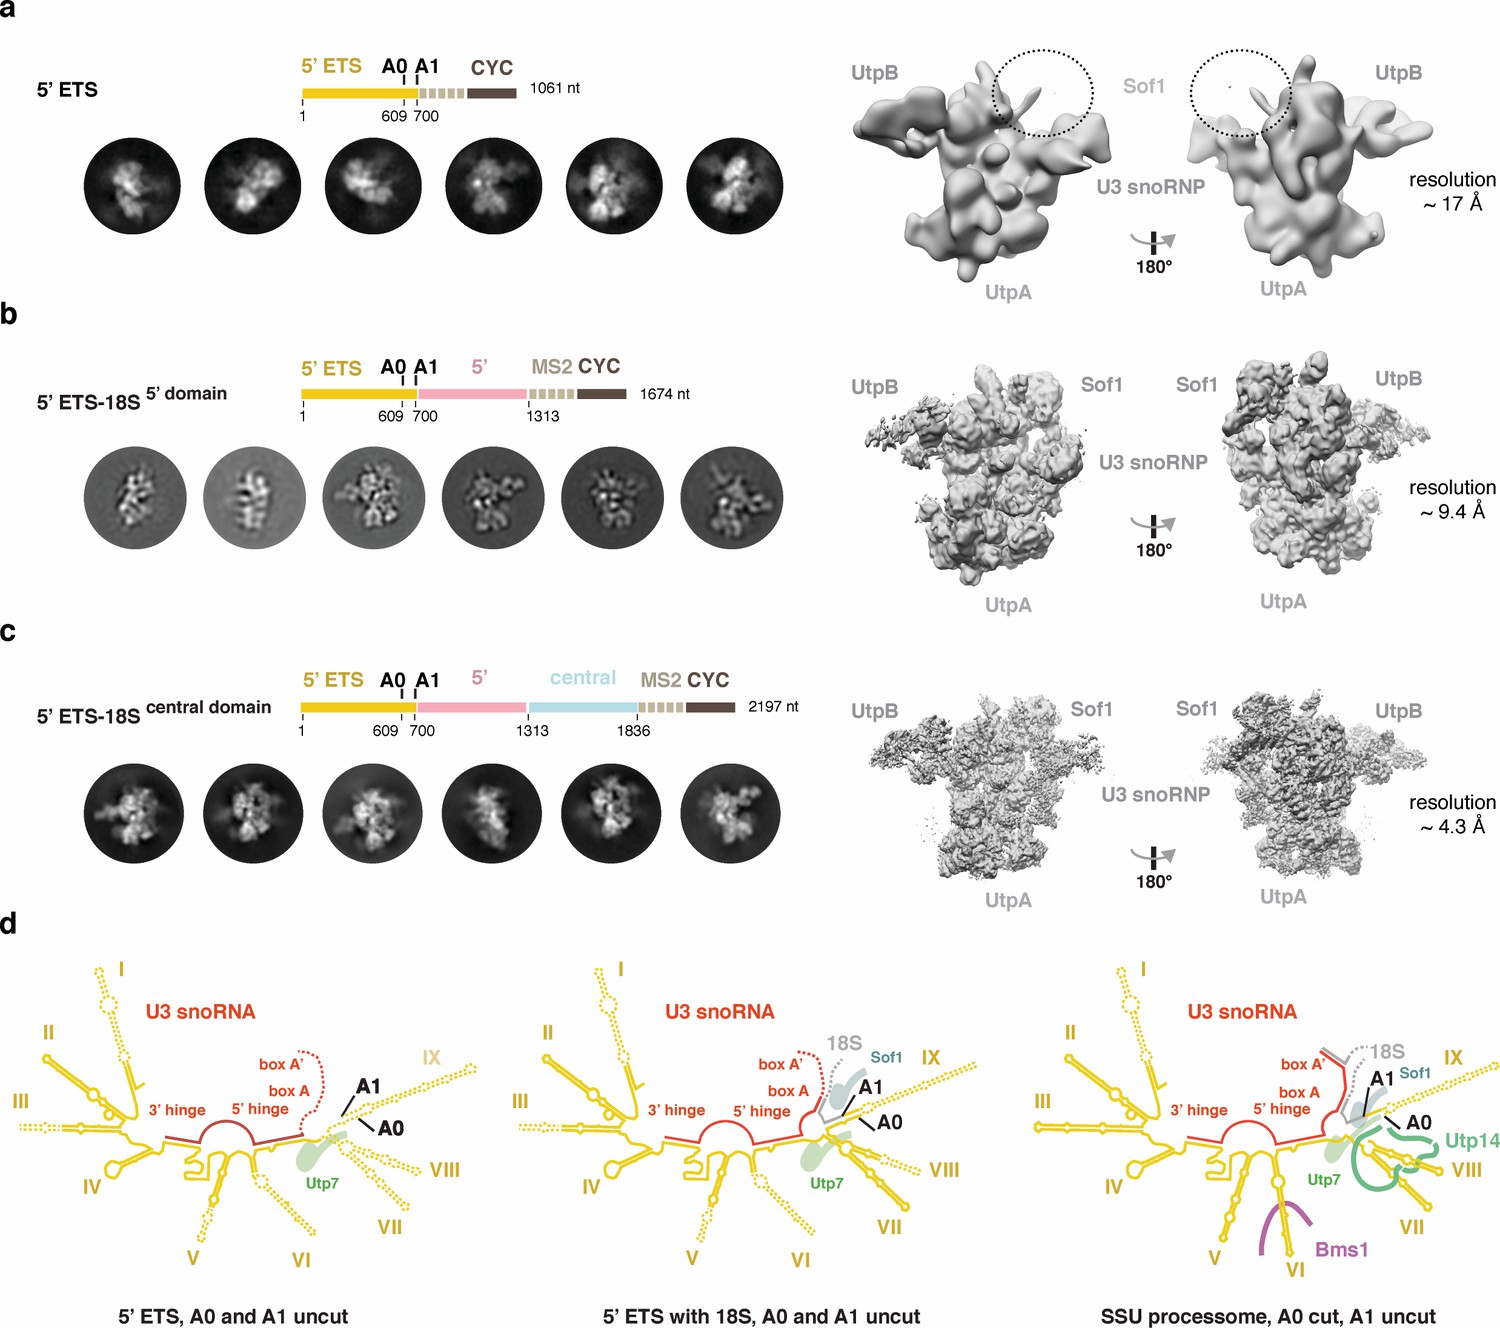
Cryo-EM analyses of the 5’ ETS RNP in different pre-ribosomal intermediates.
(a-c) 2D class averages and 3D reconstructions obtained from cryo-EM datasets of the 5’ ETS alone (a), 5’ ETS with 5’ domain (b), and the 5’ ETS with the 5’- and central domains (c). A schematic drawing above the 2D class averages represents the pre-rRNA content of the particles. Estimated overall resolutions of all three cryo-EM reconstructions are indicated as well as the position of architectural landmark proteins and complexes. A dashed circle highlights the position of Sof1, which is disordered in the reconstruction containing the 5’ ETS alone (a). (d), Schematic representation of the secondary structure of the 5’ ETS (yellow) and its interaction with U3 snoRNA (red) and the 18S pre-rRNA (gray) in the context of two 5’ ETS RNP-containing particles and the SSU processome. Regions disordered in the 5’ ETS RNA and the U3 snoRNA are indicated with dashes and selected proteins interacting with nearby pre-rRNA are shown.
Figure 1—figure supplement 3

Cryo-EM data processing strategy, overall and local resolution estimation of the 5’ ETS RNP.
(a) Representative micrograph and (b) 2D class averages of the 5’ ETS RNP. (c) Manual inspection of 2’750 collected micrographs resulted in 2’592 micrographs of good quality used to extract 275’080 particles picked with gautomatch. These particles were subjected to 3D classification with varying numbers of classes. Particles from boxed out classes (180’275 particles combined) were used for 3D refinement. A subsequent 3D classification with seven classes resulted in a single class (52’629 particles) with better-resolved features in the periphery of the RNP, which yielded a reconstruction at 4.3 Å. (d) Overall and local resolution estimation of the 5’ ETS RNP. An FSC value of 0.143 is indicated. RELION-3 (Zivanov et al., 2018) was used to estimate local resolution. A volume filtered to the local resolution is shown. (e) UtpB model (left) with subunits colored and labeled, and the corresponding density fit of the model with local resolution color-coded (right).
Figure 2 with 1 supplement
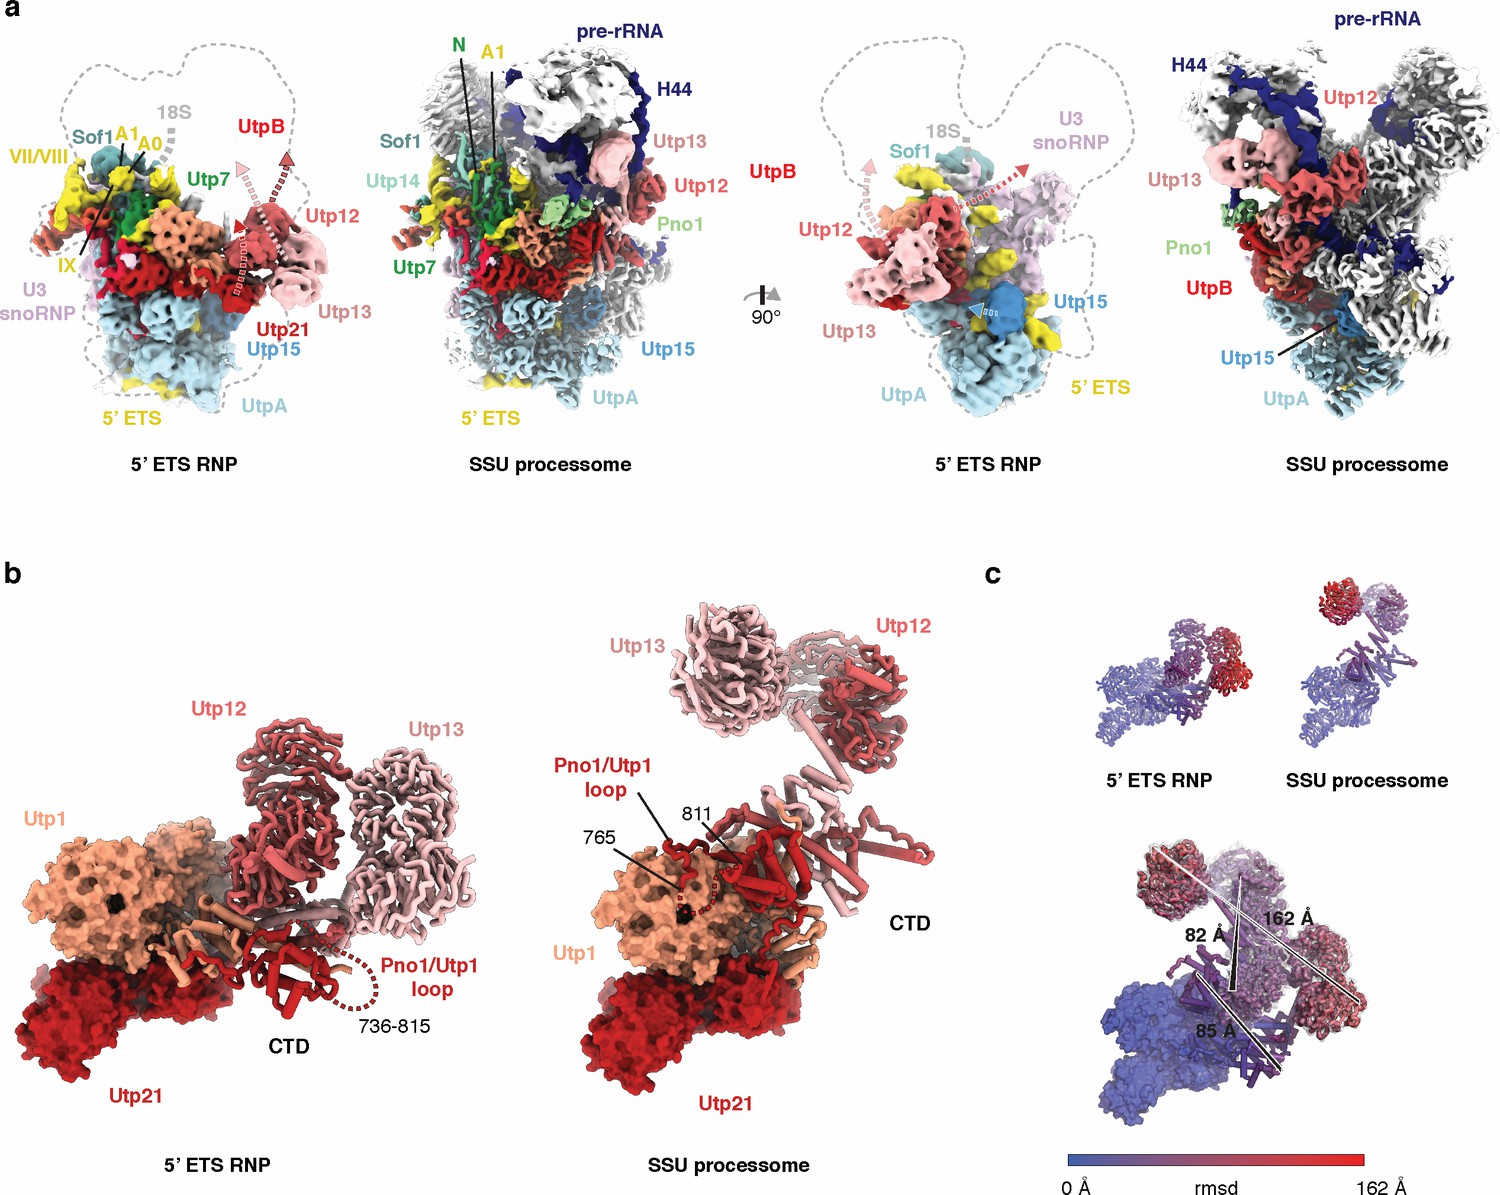
Conformational differences of UtpB in the context of the 5’ ETS RNP and the SSU processome.
(a) Two views of the 5 Å lowpass-filtered cryo-EM density of the 5’ ETS RNP (left) and the SSU processome (Barandun et al., 2017) (right) (EMD-8859). Subunits and dashed arrows indicating conformational changes upon SSU processome formation are color-coded. (b) UtpB conformations with its subunits colored in shades of red as in (a) in the context of 5’ ETS RNP and the SSU processome. (c) UtpB conformations in the context of the ETS RNP, the SSU processome and both superimposed, colored according to root mean square deviation (rmsd) between the two conformations. The largest conformational differences are indicated with a black line and the distances between the two positions are labeled.
Figure 2—video 1
A conformational change in UtpB creates binding sites for late assembly factors.
https://doi.org/10.7554/eLife.45185.007
Figure 3 with 1 supplement

Conformational switches in the 5’ ETS RNP coordinate the timing of maturation factor recruitment.
(a, b) UtpB (shades of red) in the SSU processome (a) and the 5’ ETS RNP (b). Interaction partners of UtpB and Utp15 (UtpA) in the SSU processome are shown and labeled. (c, d) UtpB in its SSU processome conformation (c) and 5’ ETS RNP conformation (d). UtpB, colored as in (a) is shown as surface with direct interaction partners visualized as cartoon (c, top panel). Protein and RNA interaction interfaces (Krissinel and Henrick, 2007) of UtpB within the SSU processome are color-coded according to (a) onto the surface of UtpB in its SSU processome conformation (c, lower panel) or in its 5’ ETS RNP conformation (d). (e, f) Utp15 (UtpA) in context of the SSU processome (e) and the 5’ ETS RNP (f). Movement of Utp15 is indicated with an arrow and a red star. (c–f) Interaction interfaces are colored as the interacting factor in (a) and labeled in italics.
Figure 3—figure supplement 1

Peptides associated with the 5’ ETS RNP and their subsequent interaction interfaces.
(a) Density map of the 5’ ETS RNP (white) superimposed with selected assembly factors from the structure of the SSU processome (PDB 5WLC) that are anchored in the 5’ ETS RNP and become ordered in the SSU processome. (b) Same view of the 5’ ETS RNP as in (a) with assembly factors colored according to the domain interaction partner (RNA or protein; obtained from EBI PISA; Krissinel and Henrick, 2007) that these factors have in the SSU processome (PDB 5WLC).
Figure 4 with 3 supplements
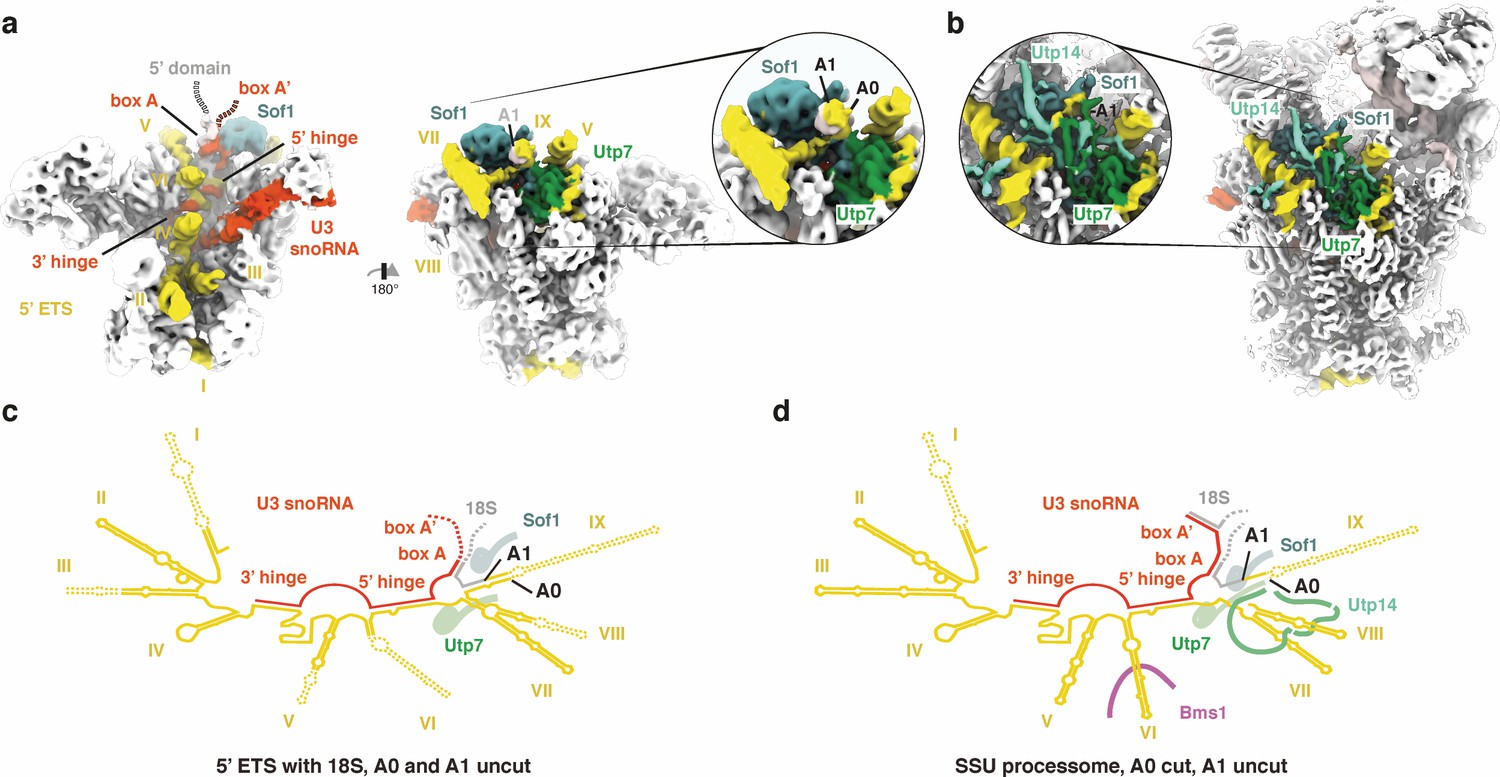
A0 cleavage creates a binding site for Utp14.
(a, b) 5’ ETS, U3 snoRNA and sites A0/A1 in the cryo-EM volume of (a) the 5’ ETS RNP and (b) the SSU processome (EMD-8859). Insets highlight the approximate positions of sites A0/A1. (c, d) Secondary structure of the 5’ ETS (yellow), the U3 snoRNA (red) and the 18S rRNA (gray) as observed in (a) and (b). Disordered regions are indicated by dashed lines.
Figure 4—figure supplement 1

Purification of 18S-rRNA domain-containing particles used for mass spectrometry analysis.
(a) A schematic of the 5’ ETS (black) and 18S rRNA (gray) is shown with pre-rRNA processing sites (A0, A1, D) indicated. The MS2 (beige) tagged constructs used in pulldowns of individual 18S rRNA domains (5’ domain in pink, central domain in light-blue, 3’ major domain in blue and 3’ minor domain in dark-blue) are indicated below with nucleotide positions labeled. (b) Northern blotting analysis of total RNA extracted from yeast strains expressing the constructs in (a) using a MS2-aptamer binding probe. A common degradation product is indicated on the right. (c) Analysis of the purified RNPs by SDS-PAGE stained with SYPRO Ruby.
Figure 4—figure supplement 2
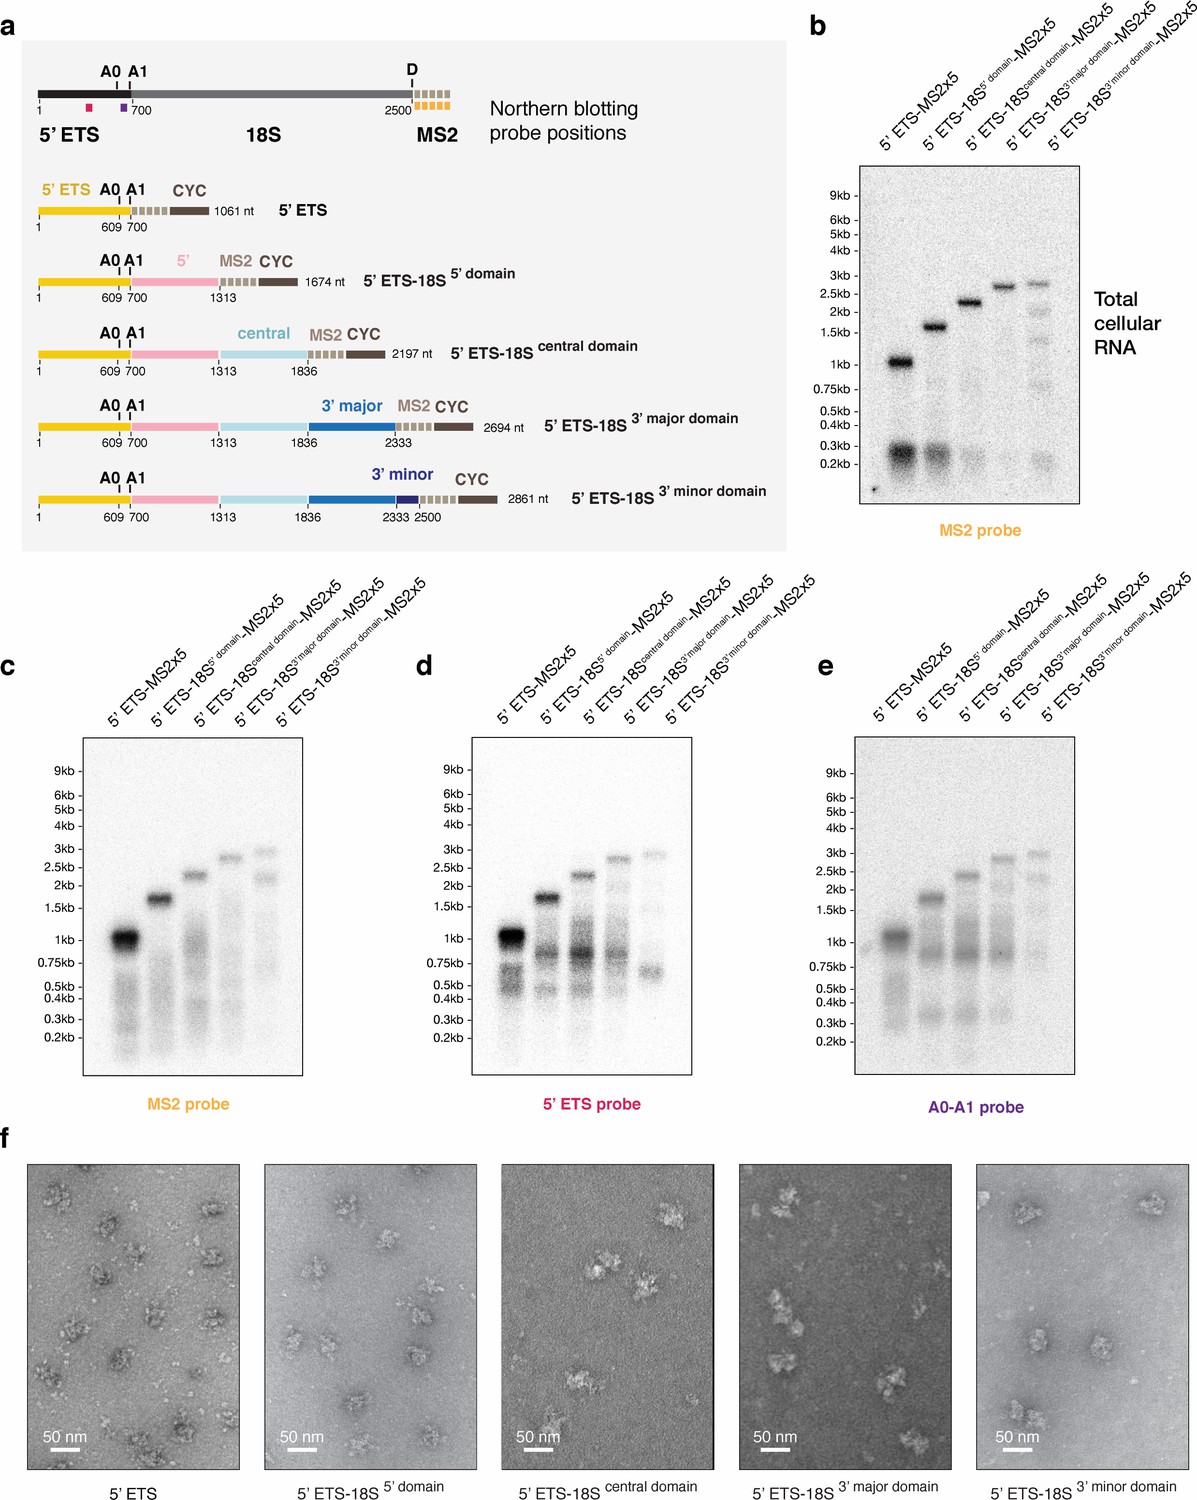
Biochemical characterization of small subunit assembly stages preceding SSU processome formation.
(a) Schematic representation of the pre-rRNA constructs expressed in (b) and used for purification of assembly stages preceding the SSU processome. On top, the positions of the Northern blot probes used in (b–e) are indicated and color-coded on a pre-rRNA schematic. rRNA processing sites in the 5’ ETS (A0, A1) and on the 18S (d) are shown above each drawing if applicable. Nucleotide numbers are labeled below the border of each pre-rRNA domain (5’ ETS, 5’ domain, central domain, 3’ major domain, 3’ minor domain) and cleavage sites. (b) Northern blot analysis of total cellular RNA extracted from yeast cells overexpressing truncated, MS2 tagged constructs mimicking transcription of pre-rRNA. (c–e) Comparative Northern blotting analysis of RNA extracted from purified pre-ribosomal particles. The particles were isolated from cells expressing the MS2-tagged RNA constructs in (a) using the purification strategy shown in (Figure 1—figure supplement 1). Probes used in each blot are indicated below and color-coded according to (a). (f) Purified pre-ribosomal particles containing the respective pre-rRNA constructs shown in (a) were visualized by negative stain EM. An approximate size bar is shown in the lower left corner of each cropped micrograph.
Figure 4—figure supplement 3

Analysis of degradation products in early assembly intermediates.
(a) Schematic representation of the pre-rRNA construct expressed in (b) and used for purification of the corresponding SSU processome precursor. The positions of the Northern blot probes used in (b) are indicated and color-coded on a pre-rRNA schematic. rRNA processing sites in the 5’ ETS (A0, A1) are shown above the drawing. Nucleotide numbers are indicated below the border of each pre-rRNA domain (5’ ETS, 5’ domain, central domain) and cleavage sites. The detailed view around the A1 site indicates the precise location of the A1 probe downstream of the A1 site. (b) Comparative Northern blotting analysis of RNA extracted from purified pre-ribosomal particles. The particles were isolated from cells expressing the MS2-tagged RNA construct in (a) using the purification strategy shown in (Figure 1—figure supplement 1). Probes used in each blot are indicated below and color-coded according to (a). The gray asterisk indicates a degradation product that contains the 5’ ETS, A0, and A1 sites.
Figure 5
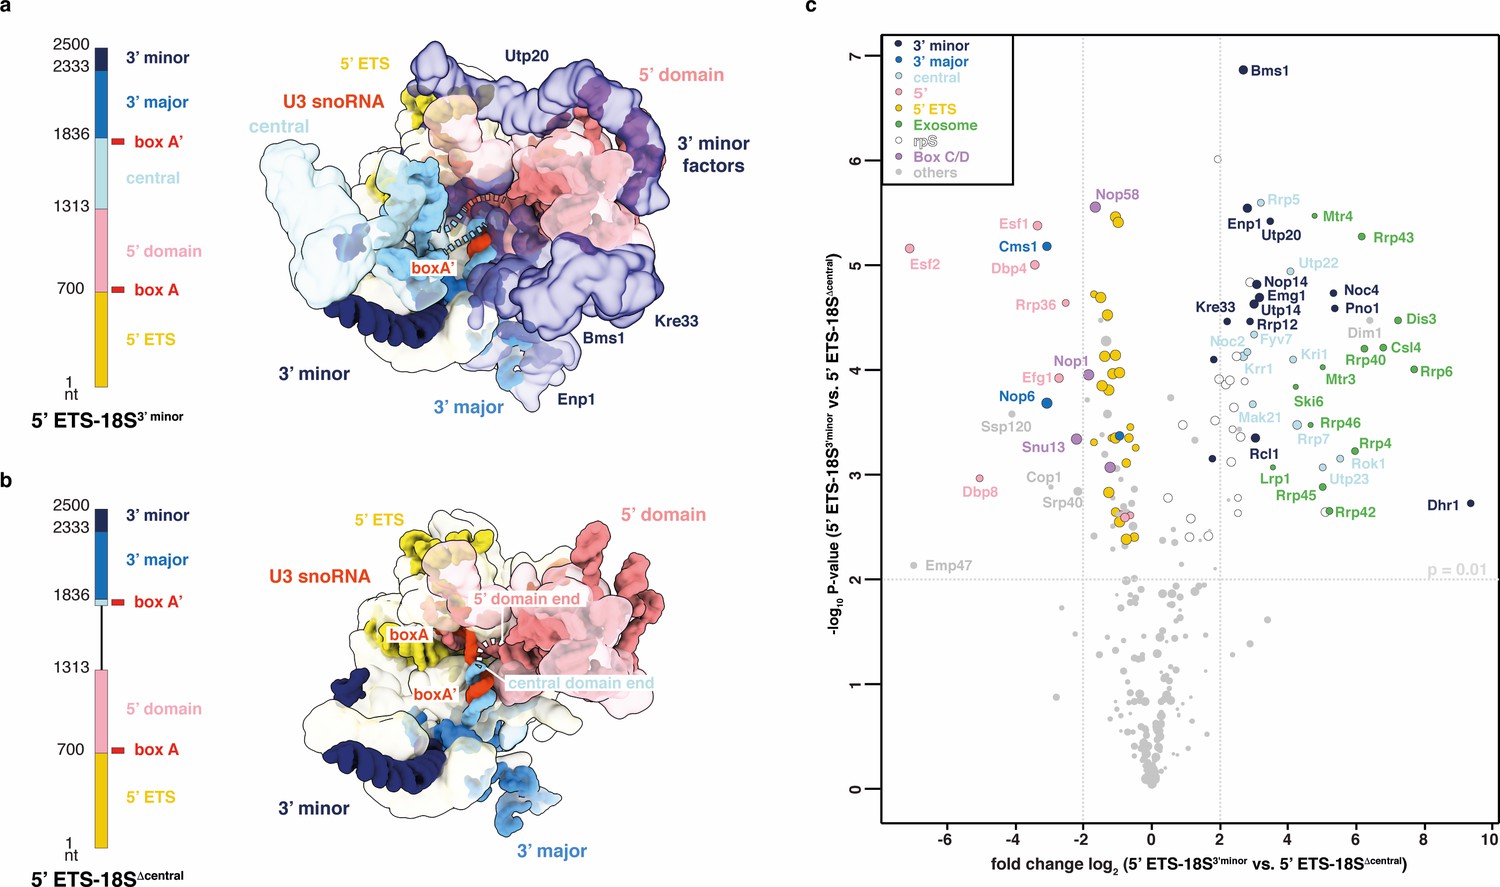
Compaction as SSU processome quality control checkpoint.
(a, b) rRNA transcripts used in (c) with individual pre-rRNA domain boundaries and U3 snoRNA base-pairing sites (box A, A’). Top view of the SSU processome (PDB 5WLC) (a) and a theoretical model of the same particle without the central domain (b). pre-rRNA domains and the proteins (transparent) they recruit are color-coded. Dotted lines indicate connections between pre-rRNA domains. (c) Volcano plot showing the label-free quantification (LFQ) comparison for proteins identified in 5’ ETS-18S3’ minor vs. 5’ ETS-18SΔ central. Log-transformed fold changes (x-axis) and p-values (y-axis). Proteins are color-coded and their relative abundance indicated by sphere size.
Figure 6
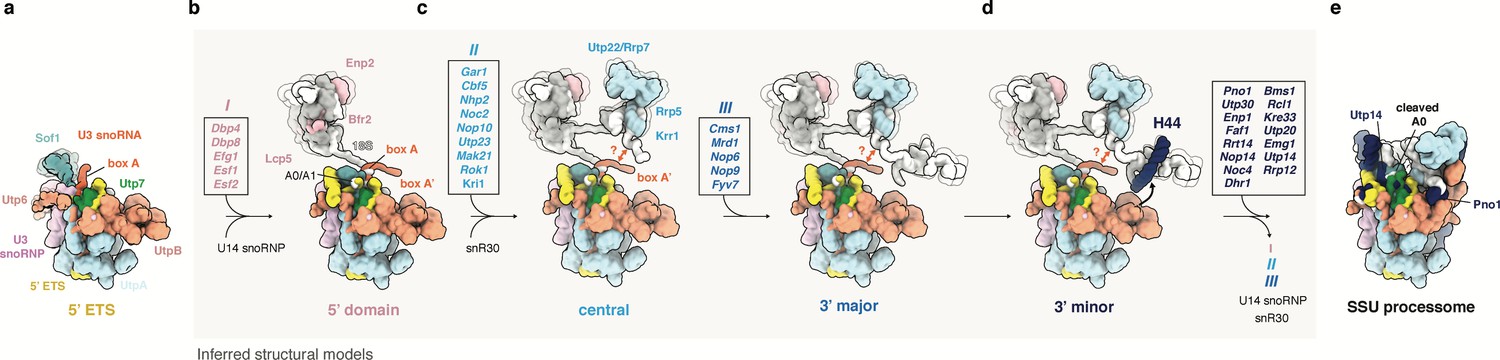
Model of SSU processome formation.
(a) The 5’ ETS recruits UtpA (blue), UtpB (light red), U3 snoRNP (pink, RNA red) and additional factors such as Utp7 (green) and Sof1 (blue). Parts of Utp7 and Sof1 are flexible in the absence of the 18S rRNA and UtpB adopts a retracted conformation as shown by the presented cryo-EM structure of the 5’ ETS RNP. (b–d) The 5’ ETS RNP forms a separate module during the transcription and independent maturation of the 18S rRNA domains (5’, central, 3’major, 3’minor). Individual 18S rRNA domains can independently recruit assembly factors. The inferred structures of subsequent assembly intermediates (b–d) are based on the structure of the 5’ ETS RNP and individual rRNA domains and associated factors as seen in the fully assembled SSU processome (e, PDB 5WLC). Assembly factors transiently associated with a particular assembly stage are boxed and labeled (I, II, III). Factors in these boxes (I, II, III) together with U14, snR30 and others leave the maturing particle before SSU processome formation as indicated by an arrow in (d). (d) UtpB acts as a sensor for the 3’ end of the 18S rRNA by recognizing elements in the 3’ minor domain (H44, dark blue). A conformational change in UtpB and the recruitment of 3’ minor factors (dark-blue, boxed) lead to the formation of the SSU processome. (e) In the fully assembled SSU processome (PDB 5WLC) the 5’ ETS is cleaved at site A0. Pno1 is stabilized by the interaction with the rotated UtpB CTD tetramer and Utp14 occupies a binding site obstructed by a 5’ ETS RNA linker in the 5’ ETS RNP.
Tables
Table 1
Cryo-EM data collection, refinement and validation statistics.
https://doi.org/10.7554/eLife.45185.016| Structure of the 5’ ETS RNP PDB 6ND4 EMD-0441 | |
|---|---|
| Data collection and processing | |
| Voltage (kV) | 300 |
| Pixel size (Å) | 1.6 |
| Electron exposure (e- / Å2) | 31.25 |
| Defocus range (um) | 1–3.5 |
| Symmetry imposed | C1 |
| Initial particle images | 275’080 |
| Final particle images | 52’629 |
| Resolution (Å) | 4.3 |
| FSC threshold | 0.143 |
| Map sharpening B-Factor (Å2 ) | −64.77 |
| Refinement | |
| Initial model used | 5WLC |
| Model composition | |
| Non hydrogen atoms | 64,019 |
| Protein residues | 10309 |
| RNA bases | 569 |
| Ligands | 0 |
| R.m.s. deviations | |
| Bond length (Å) | 0.01 |
| Angles (°) | 1.25 |
| Validation | |
| MolProbity score | 1.71 |
| Clashscore | 5.26 |
| Poor rotamers (%) | 0.0 |
| Good sugar puckers (%) | 98.7 |
| Ramachandran | |
| Favored (%) | 93.39 |
| Allowed (%) | 6.56 |
| Outliers (%) | 0.05 |
Additional files
-
Supplementary file 1
Mass spectrometry analysis of pre-ribosomal particles.
- https://doi.org/10.7554/eLife.45185.017
-
Supplementary file 2
Proteins identified by mass spectrometry analysis of purified 5’ ETS, 5’ ETS-18S5’-domain, 5’ ETS-18Scentral-domain particles used for structural studies shown in Figure 1—figure supplement 2.
Proteins associated with the 5’ ETS (yellow), 5’ domain (pink), central domain (light blue) are highlighted in bold.
- https://doi.org/10.7554/eLife.45185.018
-
Supplementary file 3
Primers, Northern blotting probes, yeast strains and plasmids used in this study.
- https://doi.org/10.7554/eLife.45185.019
-
Transparent reporting form
- https://doi.org/10.7554/eLife.45185.020
Download links
A two-part list of links to download the article, or parts of the article, in various formats.
Downloads (link to download the article as PDF)
Open citations (links to open the citations from this article in various online reference manager services)
Cite this article (links to download the citations from this article in formats compatible with various reference manager tools)
Conformational switches control early maturation of the eukaryotic small ribosomal subunit
eLife 8:e45185.
https://doi.org/10.7554/eLife.45185


