TEADs, Yap, Taz, Vgll4s transcription factors control the establishment of Left-Right asymmetry in zebrafish
- University of Virginia, United States
- CNRS/INSERM/Université de Strasbourg, France
- Institut de Biologie Moléculaire et Cellulaire, France
- University of Georgia, United States
Figures
Figure 1 with 3 supplements
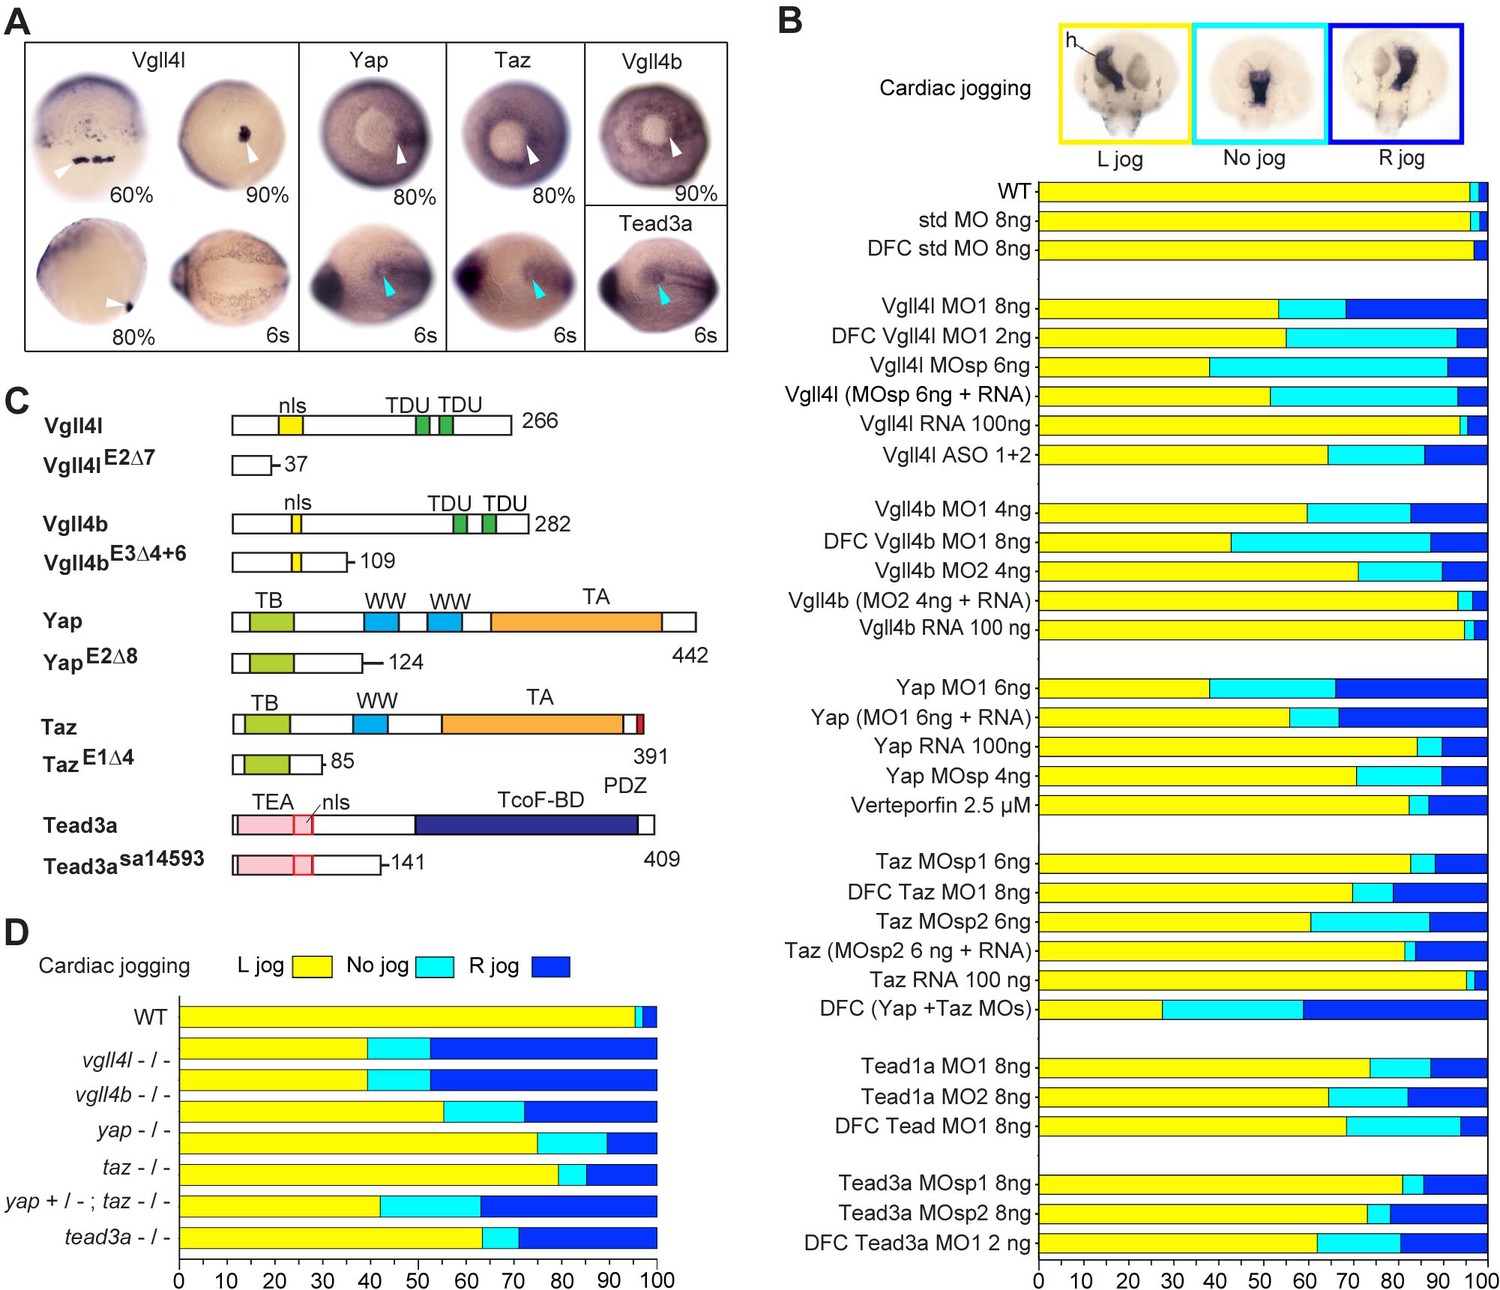
Hippo TFs/TcoFs are essential for establishing the left-right asymmetry.
(A) Whole-mount in situ hybridization for vgll4l, yap, taz, vgll4b and tead3a at gastrula and at the 6-somite stage. Vgll4l is expressed in DFCs at 60% (dorsal view), 80% (lateral view) and 90% epiboly (vegetal pole view) but is not expressed in the KV at the 6-somite stage (vegetal pole view). Yap and Taz are shown at 80% epiboly and at the 6-somite stage in vegetal pole view, Vgll4b at gastrula stage and Tead3a at the 6-somite stage in vegetal pole views. Tead1a that is constitutively expressed is not presented. White arrowheads point to DFCs, blue arrowheads point to the KV. (B) Cardiac jogging analyzed at 25 hr post fertilization (hpf). Graphs indicate the percentage of embryos with normal Left jog (L jog - yellow), Right jog (R jog – dark blue) or no jog (light blue), visualized by in situ hybridization (top, h: heart) with a myosin light chain 7 (myl7) probed at 25 hpf in: wild-type (WT) embryos; embryos injected with standard (std) MO or with Vgll4l, Vgll4b, Yap, Taz, Yap and Taz, Tead1a or Tead3a MOs; embryos injected with ASO; rescue experiments of morphant phenotypes by injection of MO insensitive RNA; incubation with 2.5 µM of Verteporfin, a Yap inhibitor. For each experiment the name of gene, name and amount of MO and/or RNA injected are indicated on the left. For double Yap/Taz MO-KD, 4 ng Yap MOsp and 4 ng Taz MOsp2 have been injected. DFC ‘name of the gene’ MO indicates DFC-targeted knockdown experiment (Wang et al., 2013). (MO + RNA) stands for rescue experiment of the indicated MO together with 100 ng of the corresponding, MO insensitive, mRNA. (C) Schematic of functional domains present in WT and in Vgll4l, Vgll4b, Yap, Taz and Tead3a mutants. nls: nuclear localization signal, PDZ: PDZ-binding motif, TA: transcription activation domain, TB: TEAD binding domain, TcoF-BD: transcription cofactor binding domain, TEA: DNA-binding TEA/ATTS domain, TDU: TONDU domain, WW: WW domain. Numbers indicate the position of the last amino-acid of each peptide. (D) Laterality defects of homozygous mutant embryos and of embryos homozygous mutant for Taz, heterozygous for Yap, analyzed as described in (B) for their cardiac jogging at 25 hpf. Numerical data for (B) and (D) are provided in Figure 1—source data 1.
-
Figure 1—source data 1
Numerical data for Figure 1B, C, and D.
- https://doi.org/10.7554/eLife.45241.007
Figure 1—figure supplement 1
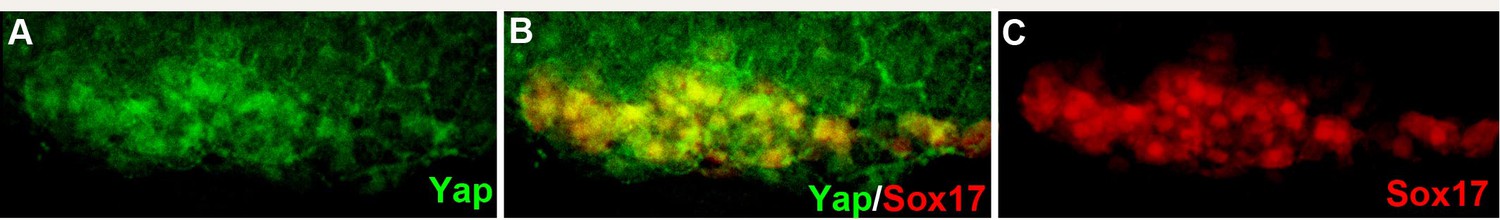
Immunodetection of Yap protein in nuclei of DFCs.
(A) Yap protein is present in nuclei of dorsal marginal cells at 75% epiboly. (B) Double labeling for Yap and Sox17 identifying these cells to be DFCs. (C) Sox17 immunolabeling revealing the DFCs.
Figure 1—figure supplement 2
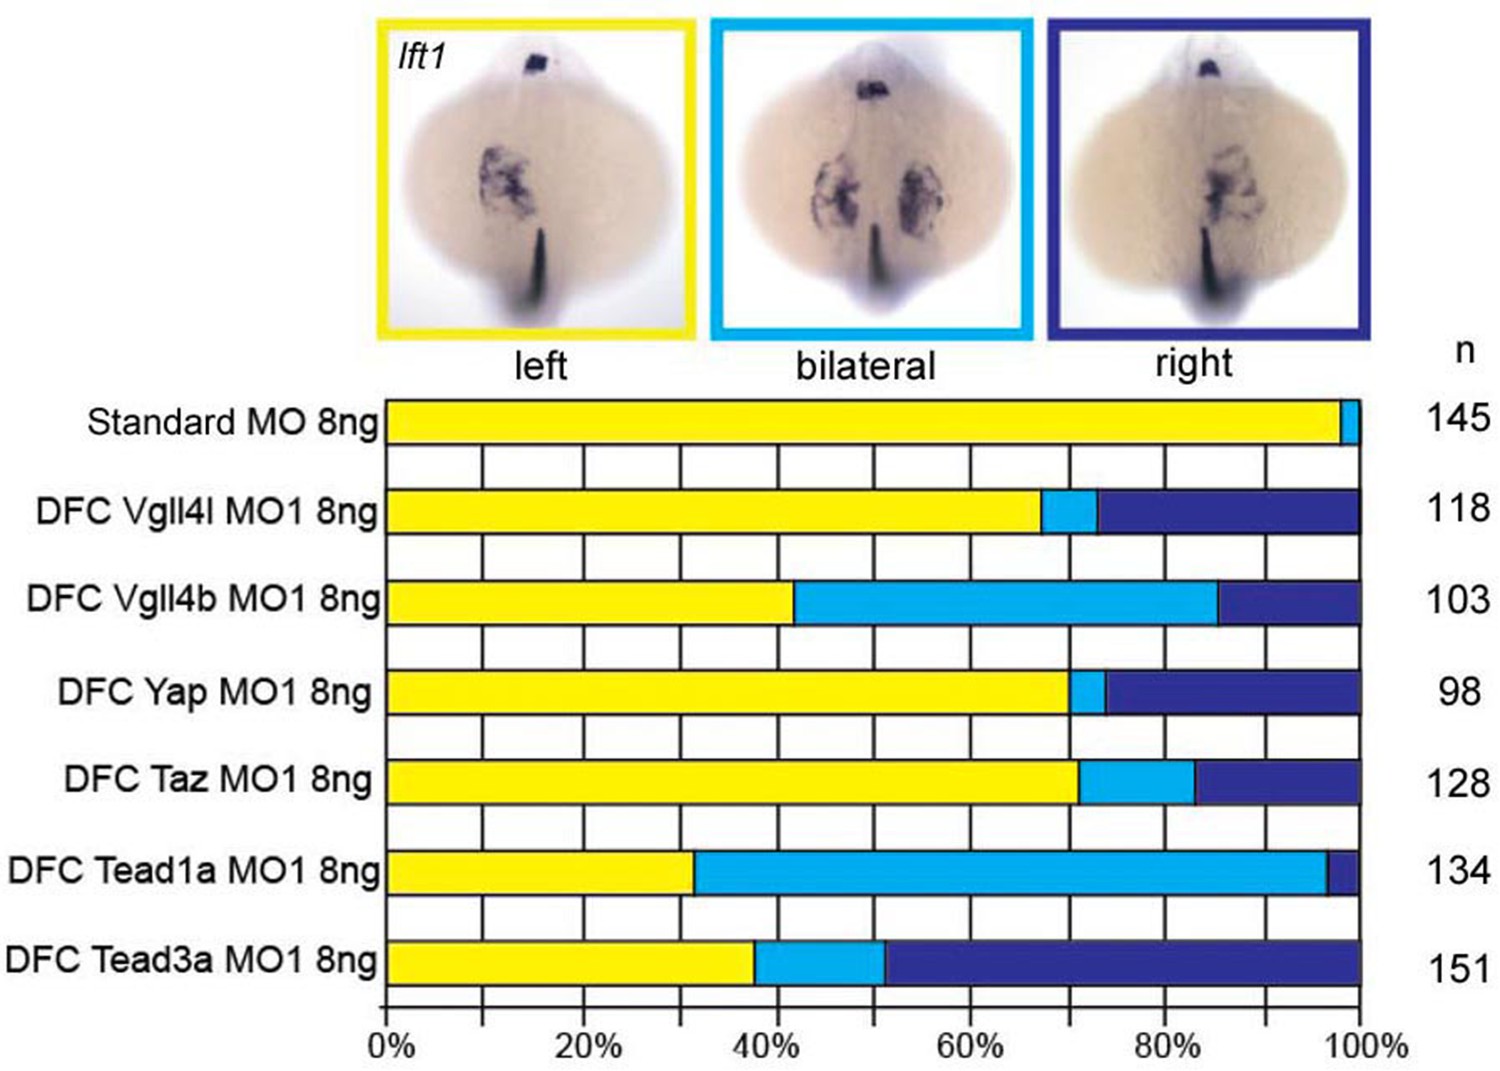
Expression of lefty1 (lft1) at 20 hpf in embryos depleted in their DFCs (DFC specific loss-of-function) in Vgll4l, Vgll4b, Yap, Taz, Tead1a and Tead3a morphants.
Graphs indicate the percentage of embryos with normal expression of lft1 in the left heart primordium and the left dorsal diencephalon (yellow), with abnormal bilateral lft1 expression in the two heart primordia and in left and right dorsal diencephalon (light blue) and with situs inversus with lft1 expression in the right heart primordium and in the right dorsal diencephalon (dark blue). n: number of embryos analyzed. Numerical data for (B) and (D) are provided in Figure 1—figure supplement 2—source data 1.
-
Figure 1—figure supplement 2—source data 1
Numerical data for Figure 1—figure supplement 2.
- https://doi.org/10.7554/eLife.45241.005
Figure 1—figure supplement 3
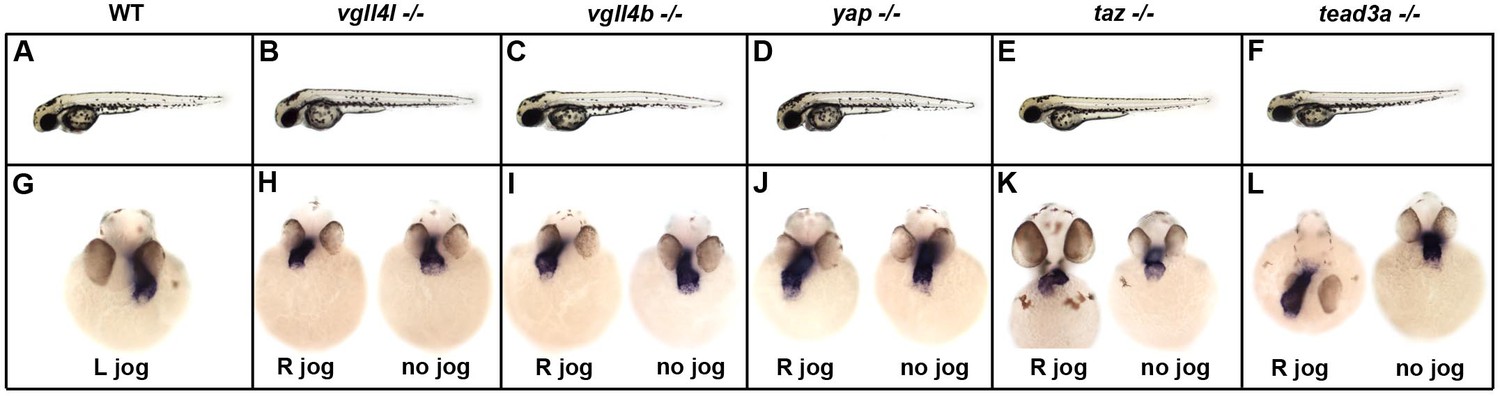
Phenotype of vgll4l, vgll4b, yap,taz and tead3a homozygous mutant embryos.
(A–F) Side view of live WT embryo (A) and of embryos homozygous (-/-) mutant for vgll4l (B), vgll4b (C), yap (D), taz (E) and tead3a (F) at 2 days of development showing that the global morphology of the embryo is not affected by loss of function of these TFs/TcoFs. (G–L) Cardiac jogging at 25 hr post fertilization (hpf) in (G) WT (L jog: left jog) and in homozygous mutants visualized by in situ hybridization with myosin light chain 7 (myl7) probed at 25 hpf for vgll4l (H), vgll4b (I), yap (J), taz (K) and tead3a (L) mutants. Embryos with abnormal laterality (R jog - right jog or no jog) are presented. Embryos are in front view except in (L), R jog) presented in dorsal view.
Figure 2 with 2 supplements
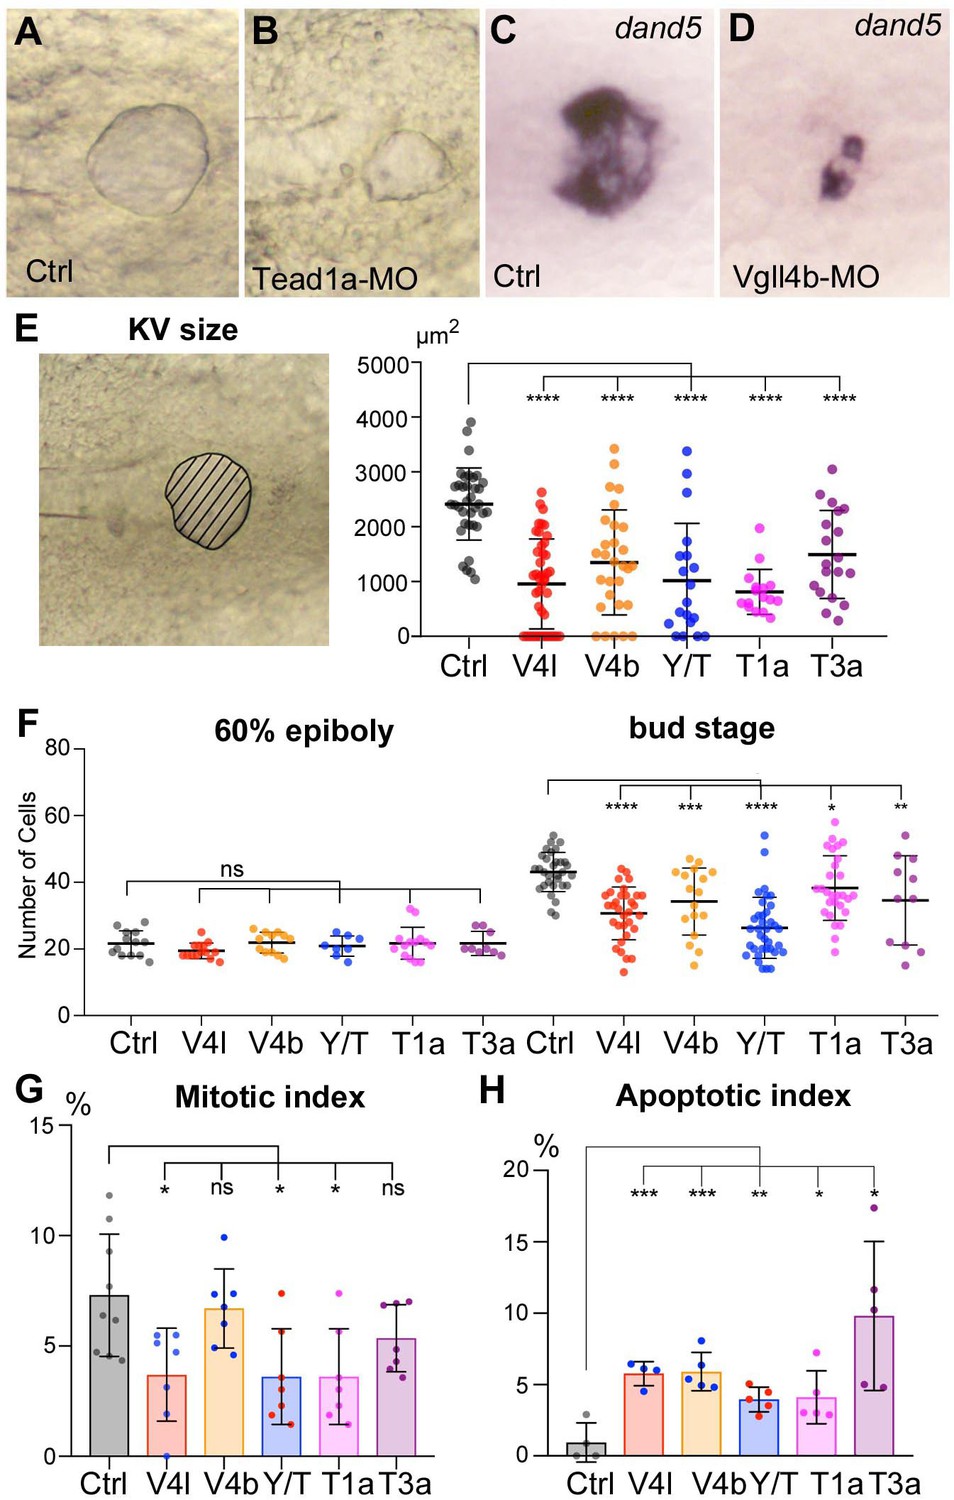
Loss of function of Hippo TFs/TcoFs affects the formation of the Left-Right Organizer.
(A–D) Illustration of the strong decrease in the size of the KV at the 12-somite stage in loss-of-function conditions shown in brightfield for (A) a control embryo (Ctrl) and for (B) a TEAD1a morphant embryo (Tead1a-MO) and by in situ hybridization using a dand5 probe in (C) Ctrl and in (D) Vgll4b morphant embryo (Vgll4b-MO). (E–H) Effect of Vgll4l (V4l), Vgll4b (V4b), Tead1a (T1a), Tead3a (T3a) loss of function and of Yap/Taz (Y/T) double loss of function on: (E) the size of the KV (expressed as the area of the planar projection of its lumen), (F) the number of DFCs present at early gastrula stage (60% epiboly) and at the end of gastrulation (bud stage), (G) the proliferation of the DFCs measured as their mitotic index at 75% of epiboly, (H) the survival of DFCs measured as their apoptotic index at 90% epiboly. In all cases control (Ctrl) embryos were injected with 8 ng of Standard MO. Graph indicates the mean of each experiment, error bars indicate standard deviation and dots indicate the individual measurement for DFC groups or individual KV in control and loss of function conditions. Statistical significance between controls and the different loss-of-function conditions: two-tailed unpaired t-test. *p≤0.05, **p≤0.01, ***p≤0.001, ****p≤0.0001. ns: not significant. Numerical data for (E–H) and details of statistical analysis are provided in Figure 2—source data 1.
-
Figure 2—source data 1
Numerical data for Figure 2E, F, G and H.
- https://doi.org/10.7554/eLife.45241.012
Figure 2—figure supplement 1
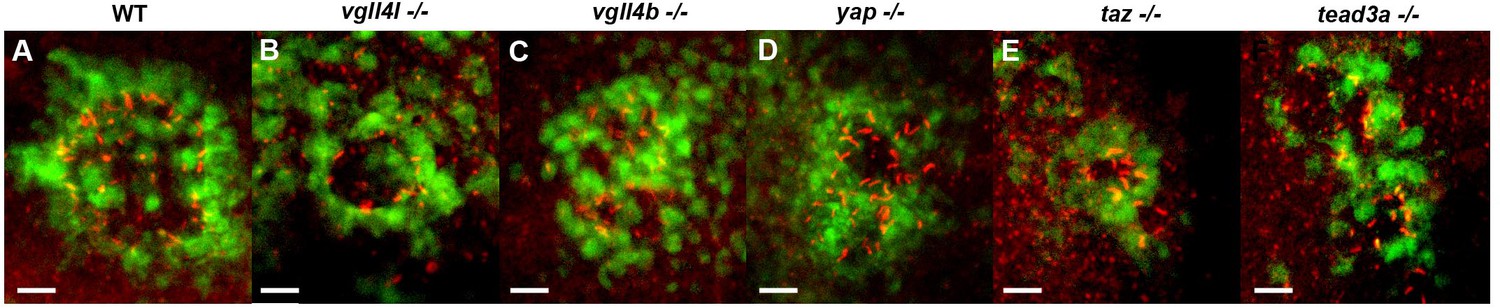
KV defects in homozygous vgll4l, vgll4b, yap, taz and tead3a mutants.
(A–F) Dorsal view of the KV of the Tg(sox17:GFP)s870 line. KV cilia (red) are detected by immunolabelling using an anti-acetylated tubulin antibody in (A) WT embryo of the Tg(sox17:GFP)s870 line and in homozyous mutant (-/-) embryos of (B) vgll4lva1/va1; s870Tg, (C) vgll4bva2/va2; s870Tg, (D) yapva3/va3; s870Tg, (E) taz/wwtr1va4/va4 and (G) tead3asa14593/sa14593; s870Tg lines. Scale bars: 20 µm.
Figure 2—figure supplement 2
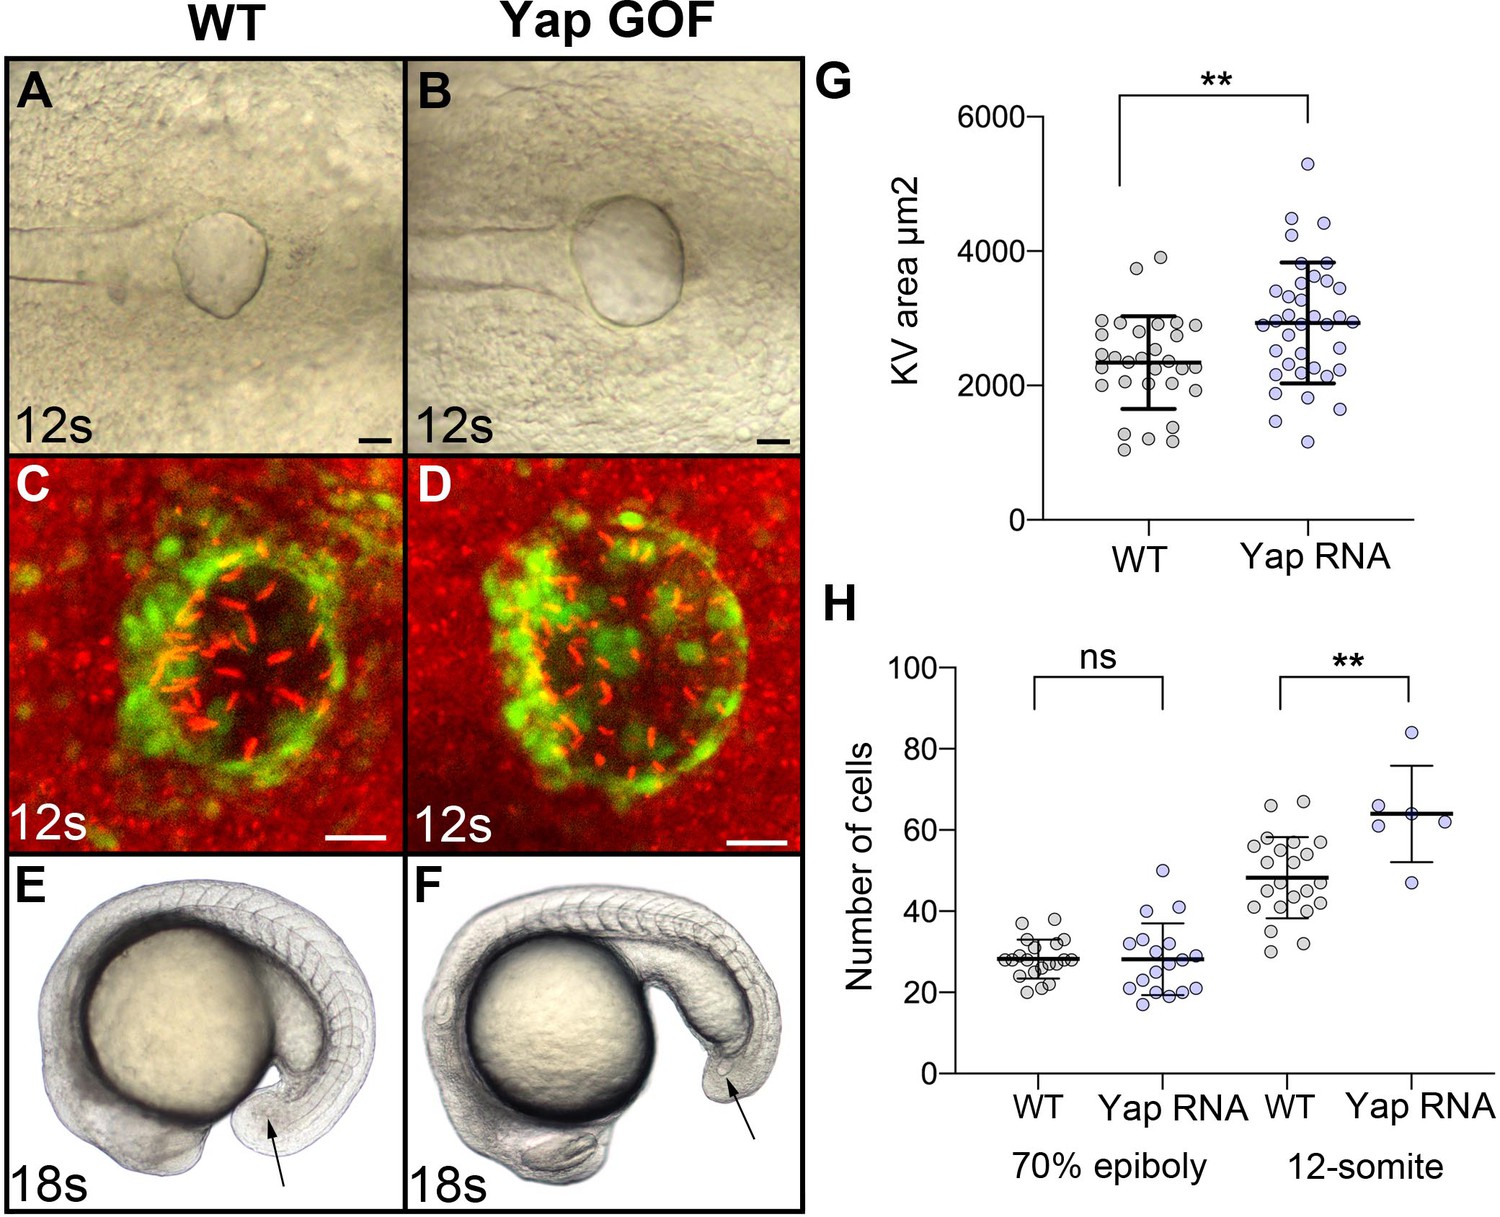
Gain of function of Yap results in the formation of a larger KV.
(A, B) Brightfield view of the KV in (A) WT and (B) an embryo overexpressing Yap in DFCs at the 12-somite stage (12 s). (C, D) Visualization of the KV (green) and of KV cilia (red – immunolabeling using an anti-acetylated tubulin antibody) at the 12-somite stage in (C) WT embryos of the Tg(sox17:GFP)s870 line and (D) embryo of the same line overexpressing Yap in DFCs. Scale bars 20 µm. (E–F) lateral view of (E) a WT embryo and (F) an embryo overexpressing Yap in the DFCs at the 18-somite stage (18 s). Arrows point to the KV. (G) Quantification of the size of the KV (expressed as the area of the planar projection of its lumen) in WT and in Yap gain of function. (H) Quantification of the number of cells present in the DFCs at early gastrula stage and in the KV at the 12-somite stage. Numerical data for (G–H) and details of statistical analysis are provided in Figure 2—figure supplements 2—source data 1.
-
Figure 2—figure supplement 2—source data 1
Numerical data for Figure 2—figure supplement 2G and H.
- https://doi.org/10.7554/eLife.45241.011
Figure 3
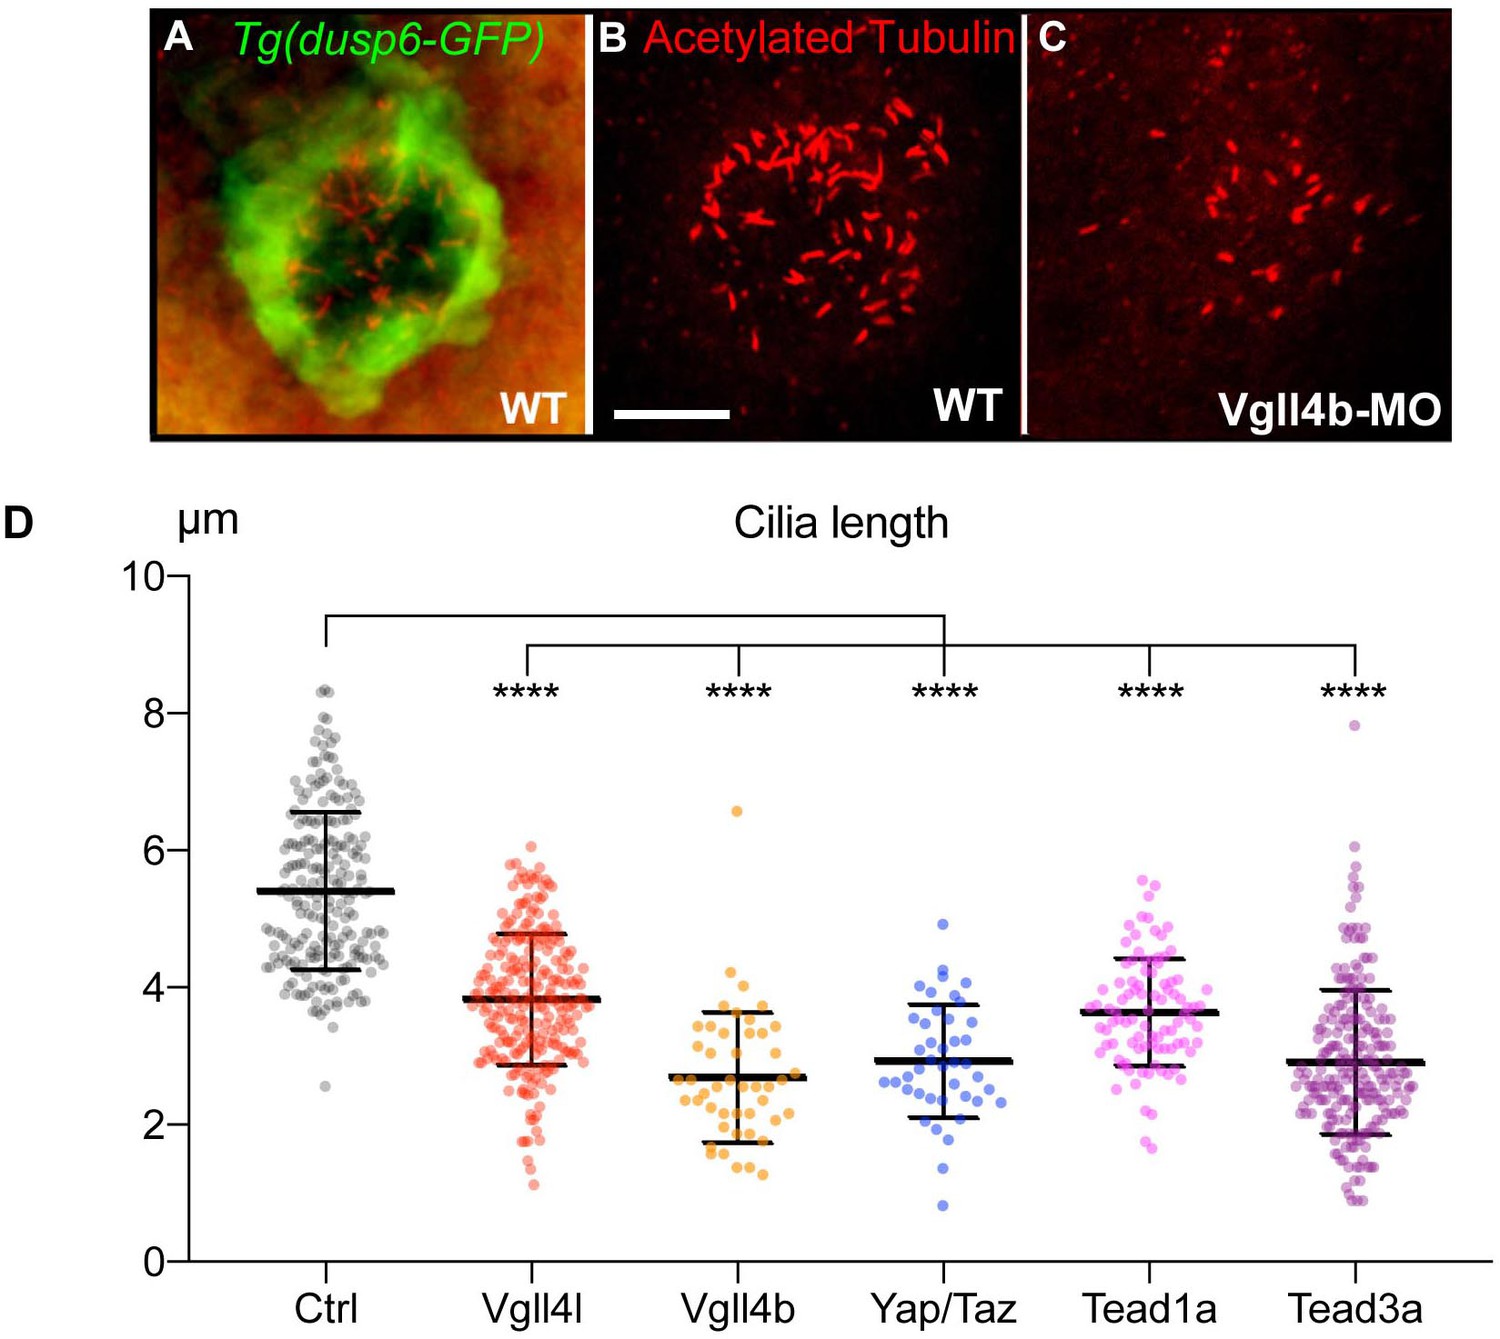
Loss of function of Hippo TFs/TcoFs leads to a reduction of the length of motile cilia of the KV.
(A–C) Visualization of KV cilia at the 10-somite stage using an anti-acetylated tubulin antibody in (A) control embryos of the WT Tg(dusp6:GFP) line showing both KV cells (green) and cilia (red) or (B) only cilia. (C) cilia in Vgll4b morphant. Scale bar: 40 µm. (D) Length of KV cilia in Control (Ctrl) embryos and in Vgll4l, Vgll4b, Yap/Taz, Tead1a and Tead3a morphant embryos. Control (Ctrl) embryos were injected with 8 ng of Standard MO. Graph indicates the mean of cilia length, error bars the standard deviation. Statistical significance between controls and different loss-of-function conditions: two-tailed unpaired t-test. ****p≤0.0001. Numerical data and details of statistical analysis are provided in Figure 3—source data 1.
-
Figure 3—source data 1
Numerical data for Figure 3D.
- https://doi.org/10.7554/eLife.45241.014
Figure 4 with 2 supplements
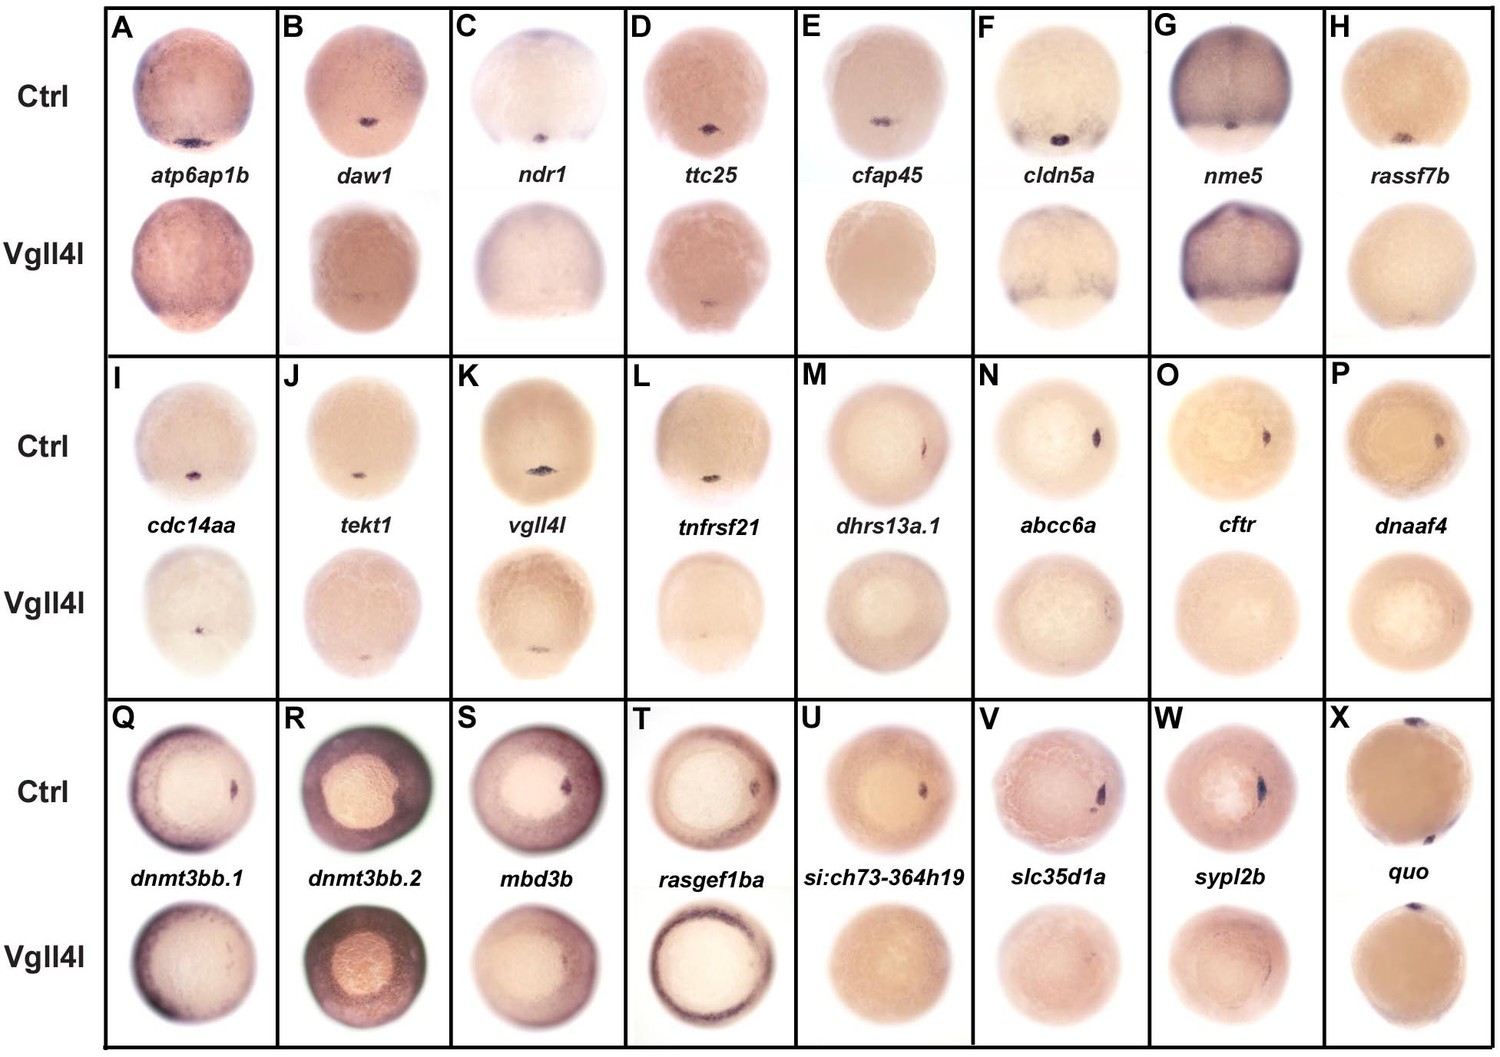
DFC specific genes downregulated in Vgll4l loss of function.
Whole-mount in situ hybridization for genes that are expressed in DFCs at 70–90% epiboly in control (Ctrl) embryos and that are strongly downregulated in Vgll4l MO knockdown. Embryos are in dorsal view, animal pole to the top (A–L), in vegetal pole view dorsal to the right (M–W) and in lateral view anterior to the top dorsal to the right (X). Name of the genes probed is indicated in between control (top) and Vgll4l loss of function embryos (bottom).
Figure 4—figure supplement 1
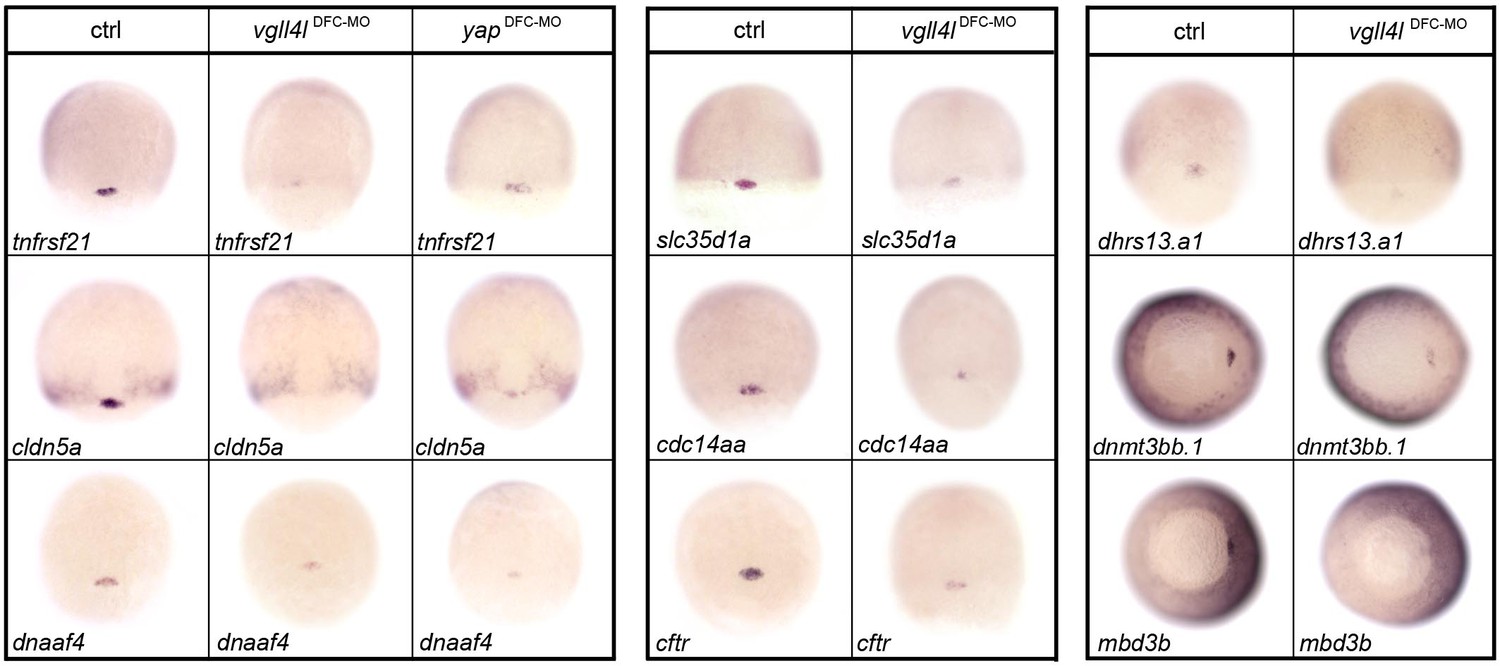
Effect of DFC specific MO knockdowns on the expression of a selection of DFC specific genes.
DFC specific MO knockdown for Vgll4l (Vgll4lDFC-MO, 8 ng Vgll4l MOsp), Yap (YapDFC-MO, 8 ng of Yap MOsp) and DFC targeted injection of control morpholino (ctrl, 8 ng std MO) analyzed by in situ hybridization for the expression of DFC specific genes. The name of the genes probed is indicated in the lower left corner of each panel. Embryos are in dorsal view animal pole to the top except dnmt3bb.1 and mbd3b that are in a vegetal pole view dorsal to the right.
Figure 4—figure supplement 2
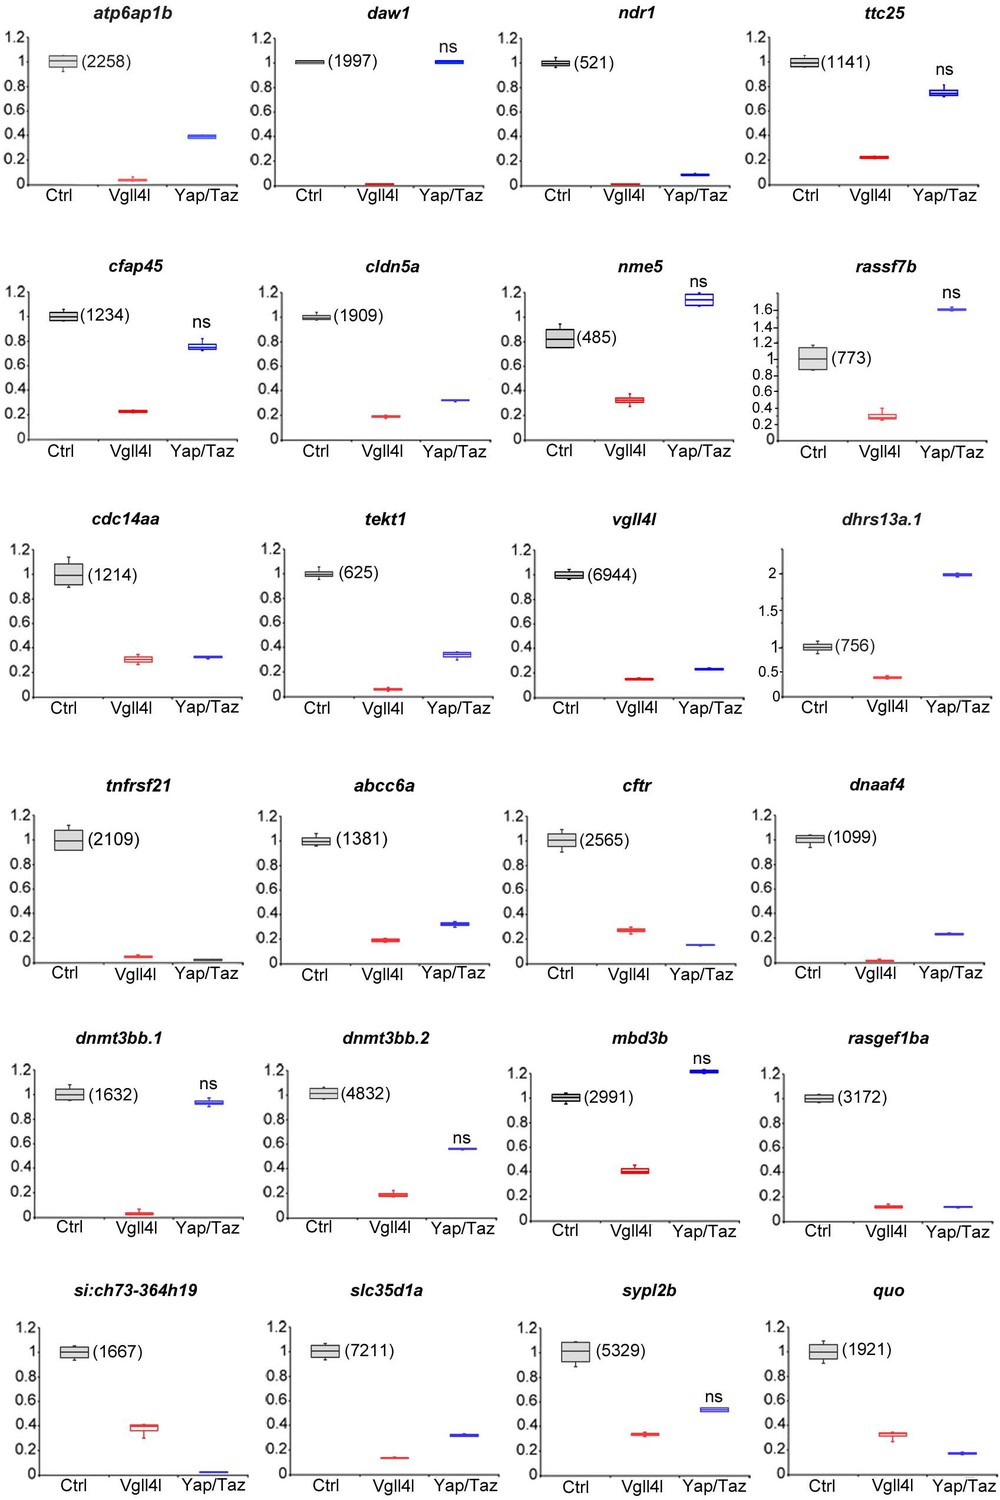
Differential expression at late gastrulation of the genes analyzed by in situ hybridization in Vgll4l depleted embryos.
Box plots of the expression of the genes presented in Figure 4 in Control embryos (Ctrl - gray), in Vgll4 (red) and in Yap/Taz (blue) loss-of-function conditions. Gene expression in control samples was normalized to one and the amount of transcripts (expressed as normalized counts) is indicated for the control. For Vgll4l loss of function the 24 genes analyzed are differentially expressed (|log2FoldChange| > 1, adjusted p-value<0.05). This is also the case for Yap/Taz loss-of-function except when mentioned otherwise: ns (not significant). Numerical data and adjusted p-value for all conditions are available is Supplementary file 1. Adjusted p-value is <0.0001 for all differentially downregulated genes in Vgll4l or Yap/Taz loss-of-function conditions. The box in box-plots indicates the first and third quantile and the black horizontal bar within the box illustrates the median (or second quantile). The ends of the whiskers are set at 1.5*Interquartile range (IQR) above the third quartile (Q3) and 1.5*IQR below the first quartile (Q1).
Figure 5
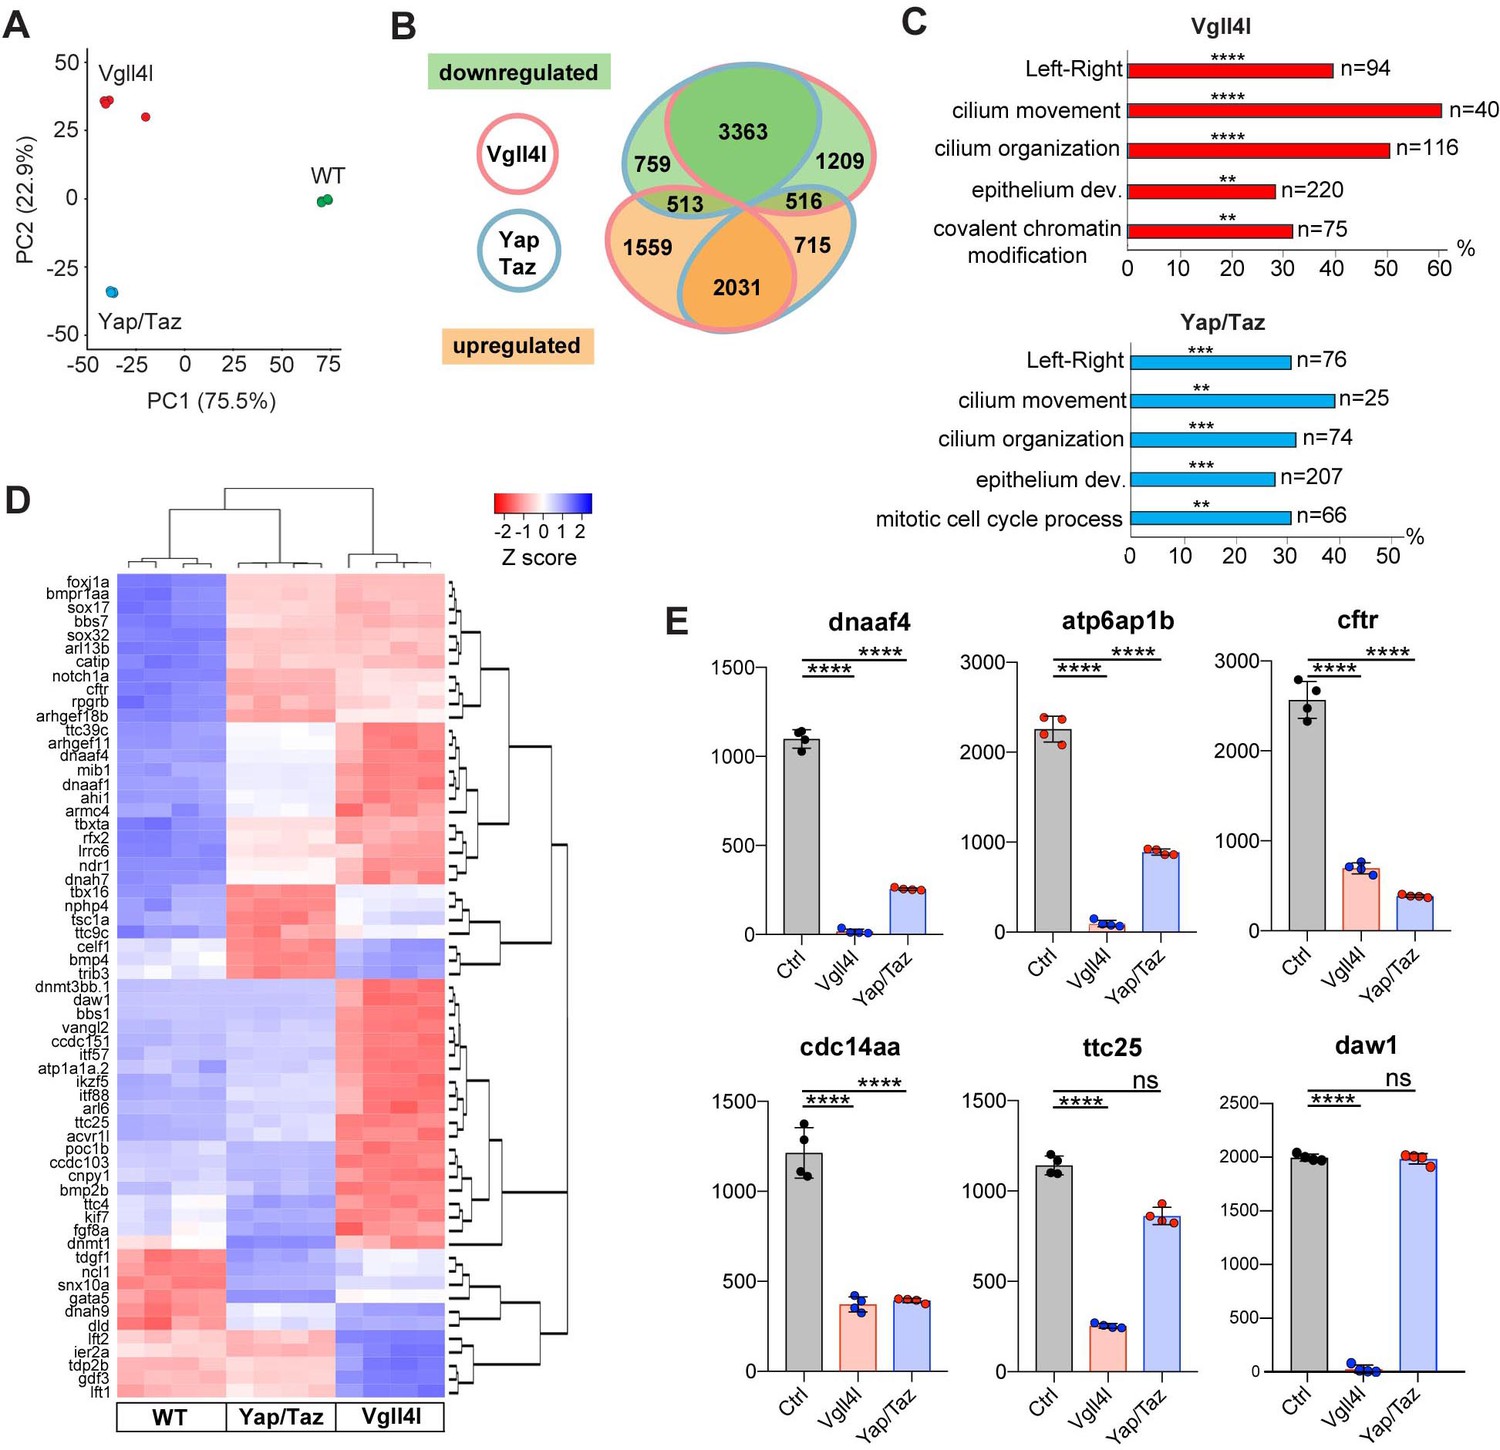
Transcriptome analysis of DFCs lacking Vgll4l or Yap/Taz function.
(A) Principal component analysis (PCA) of DFC transcriptomes for Vgll4l morphants (red), Yap/Taz double morphants (blue) and control (green) showing that the four experimental replicates were highly reproducible and strongly clustered while each experimental condition segregated in distinct groups. (B) Venn diagram illustrating overlaps of differentially expressed genes (DEGs) between groups of DFCs lacking activity of Vgll4l (red line) or Yap/Taz (blue line). Downregulated genes (green), upregulated genes (orange). (C) Significant DEGs for Vgll4l (top, red) and for Yap/Taz (bottom, blue) were analyzed for selected biological processes. Bars represent the percentage of associated genes assigned to an unique GO term with the absolute number of associated genes located at the end of the bars (p-value corrected with Benjamini-Hochberg : **p≤0.01, ***p≤0.001, ****p≤0.0001). (D) Heatmap of DEGs whose loss of function is associated with DFCs and/or KV phenotypes. (E) Examples of genes downregulated in Vgll4l or in Yap/Taz depleted embryos: dnaaf4 which is required for cilia movement (Tarkar et al., 2013), atp6ap1b known to mediate DFC proliferation (Gokey et al., 2015); cftr that controls KV lumen expansion (Navis et al., 2013); cdc14aa that contributes to ciliogenesis (Clément et al., 2011). ttc25 that is critical for cilia formation and function (Xu et al., 2015) is downregulated in both Vgll4l and Yap/Taz loss of function but is not a DEG for Yap/Taz. Finally daw1 that is essential for dynein assembly and ciliary motility (Gao et al., 2010) is downregulated only in Vgll4l loss of function. Graph bars indicate the mean expression expressed in normalized counts, the error bars the standard deviation and the dots, the value of each biological replicate. Statistical significance between controls and the different loss of function conditions: two-tailed unpaired t-test. ****p≤0.0001. ns: not significant (either p>0.05 and/or |log2FoldChange| < 1). Numerical data for (E) are available in Supplementary file 1.
Figure 6

Regulation by Vgll4l or by Yap/Taz of critical genes from major signaling pathways controlling the formation of the KV.
(A) Strong downregulation of nodal related 1 (ndr1) expression in Vgll4l and Yap/Taz morphants. For Vgll4l, loss of Ndr1 transcripts is associated with a strong decrease of the expression of smad2a, a R-smad known to transduce Nodal signaling, as well as to a strong upregulation of the expression of Nodal feedback antagonists, lefty1 (lft1) and lefty2 (lft2). In Yap/Taz loss of function, the strong decrease in ndr1 expression is associated with a decrease in expression of smad3a, another R-Smad transducing Nodal signaling, but not with an upregulation of ltf1/2. (B) There is a strong downregulation of expression of ligand (Wnt11) and receptors (Fzd8a and Fzd10 for Vgll4l, Fzd8a for Yap/Taz) of the non-canonical Wnt pathway. (C) Expression of ligands (Fgf8a and Fgf1a for Vgll4l; Fgf1a for Yap/Taz) and receptor (Fgfr1a) of the FGF signaling pathway is strongly downregulated in both Vgll4l and Yap/Taz loss-of-function conditions. Transcripts of the positive regulator (Cnpy1) are strongly decreased in Vgll4l loss of function. (D) The expression of ligands (Dla, Jag2b) and receptors (Notch1a, Notch1b and Notch3) of the Notch pathway is downregulated in DFCs lacking either Vgll4l or Yap/Taz. Bar graphs depict the mean expression of genes in DFCs of control (gray), Vgll4l (red) and Yap/Taz (blue) loss of function expressed as normalized counts with error bars indicating standard deviation. Dots indicate the individual value of each biological replicate (n = 4). Statistical significance between controls and the different loss-of-function conditions: two-tailed unpaired t-test. *p≤0.05, **p≤0.01, ***p≤0.001, ****p≤0.0001. ns: not significant (either p>0.05 or |log2FoldChange| < 1). Numerical data are available in Supplementary file 1.
Figure 7
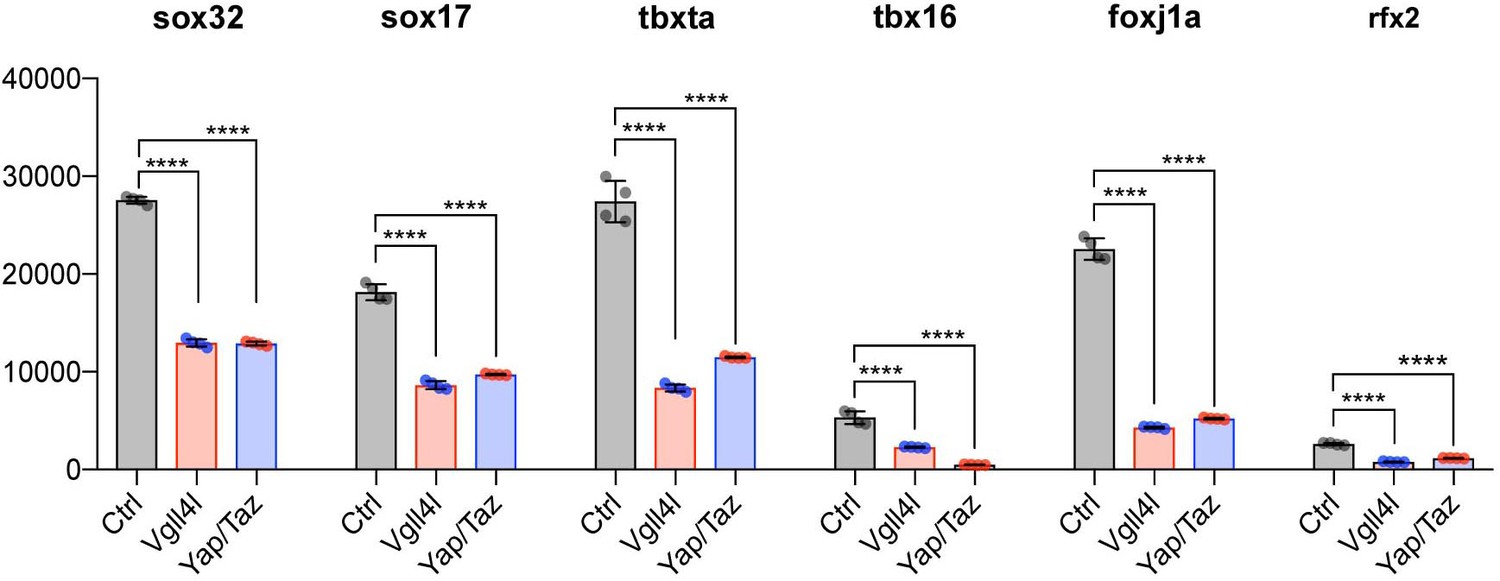
Vgll4l and Yap/Taz regulate expression of TFs required for KV formation.
Transcripts of Sox32, Sox17, Tbxta, Tbx16, Foxj1a and Rfx2 are expressed in DFCs and are all significantly downregulated in Vgll4l and Yap/Taz morphants. The bar graphs depict the mean expression of genes in DFCs of control (gray), Vgll4l (red) and Yap/Taz (blue) loss of function expressed as normalized counts with error bars indicating standard deviation. Dots indicate the individual value of each biological replicate (n = 4). Statistical significance between controls and loss of function conditions: two-tailed unpaired t-test. *p≤0.05, **p≤0.01, ***p≤0.001, ****p≤0.0001. ns: not significant (p>0.05 and/or |log2 fold change| < 1). Numerical data are available in Supplementary file 1.
Figure 8
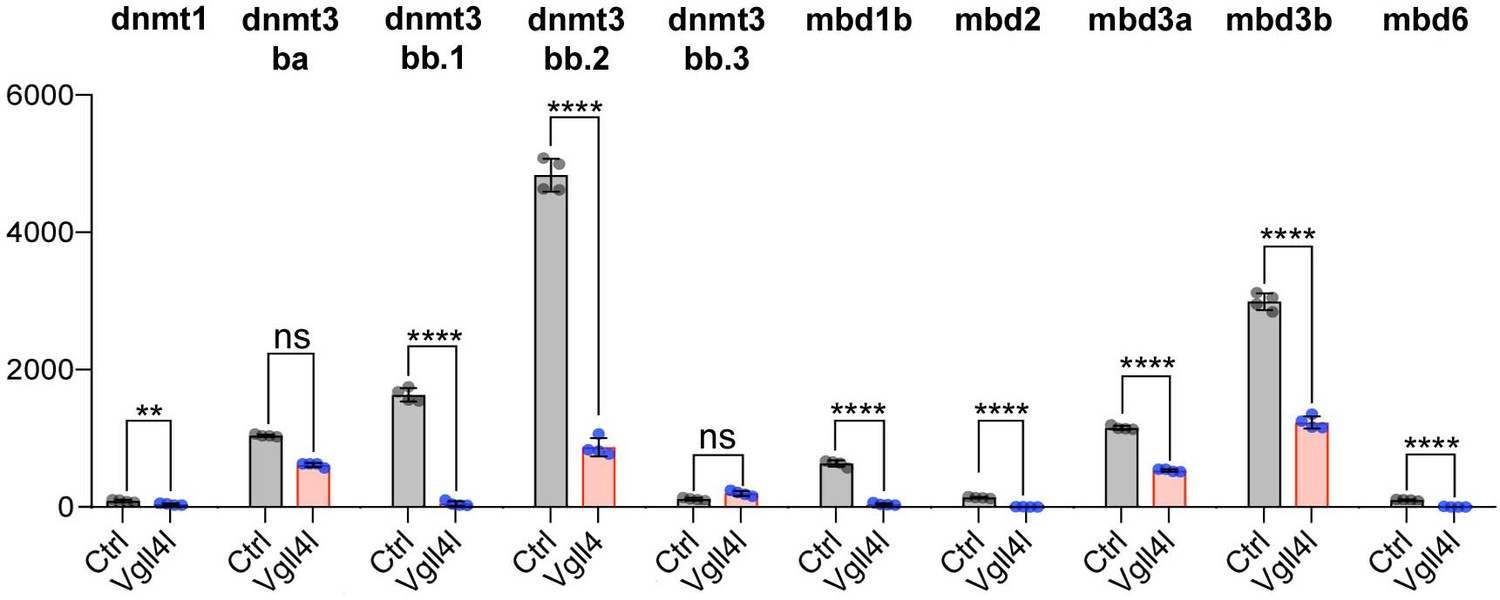
Vgll4l regulates expression of epigenetic factors writers and readers of DNA methylation marks.
The bar graphs depict the mean expression of genes in DFCs of control (gray), Vgll4l (red) loss of function expressed as normalized counts with error bars indicating standard deviation. Dots indicate the individual value of each biological replicate (n = 4). Statistical significance between controls and loss of function conditions: two-tailed unpaired t-test. *p≤0.05, **p≤0.01, ***p≤0.001, ****p≤0.0001. ns: not significant (p>0.05 and/or |log2 fold change| < 1). Numerical data are available in Supplementary file 1.
Figure 9
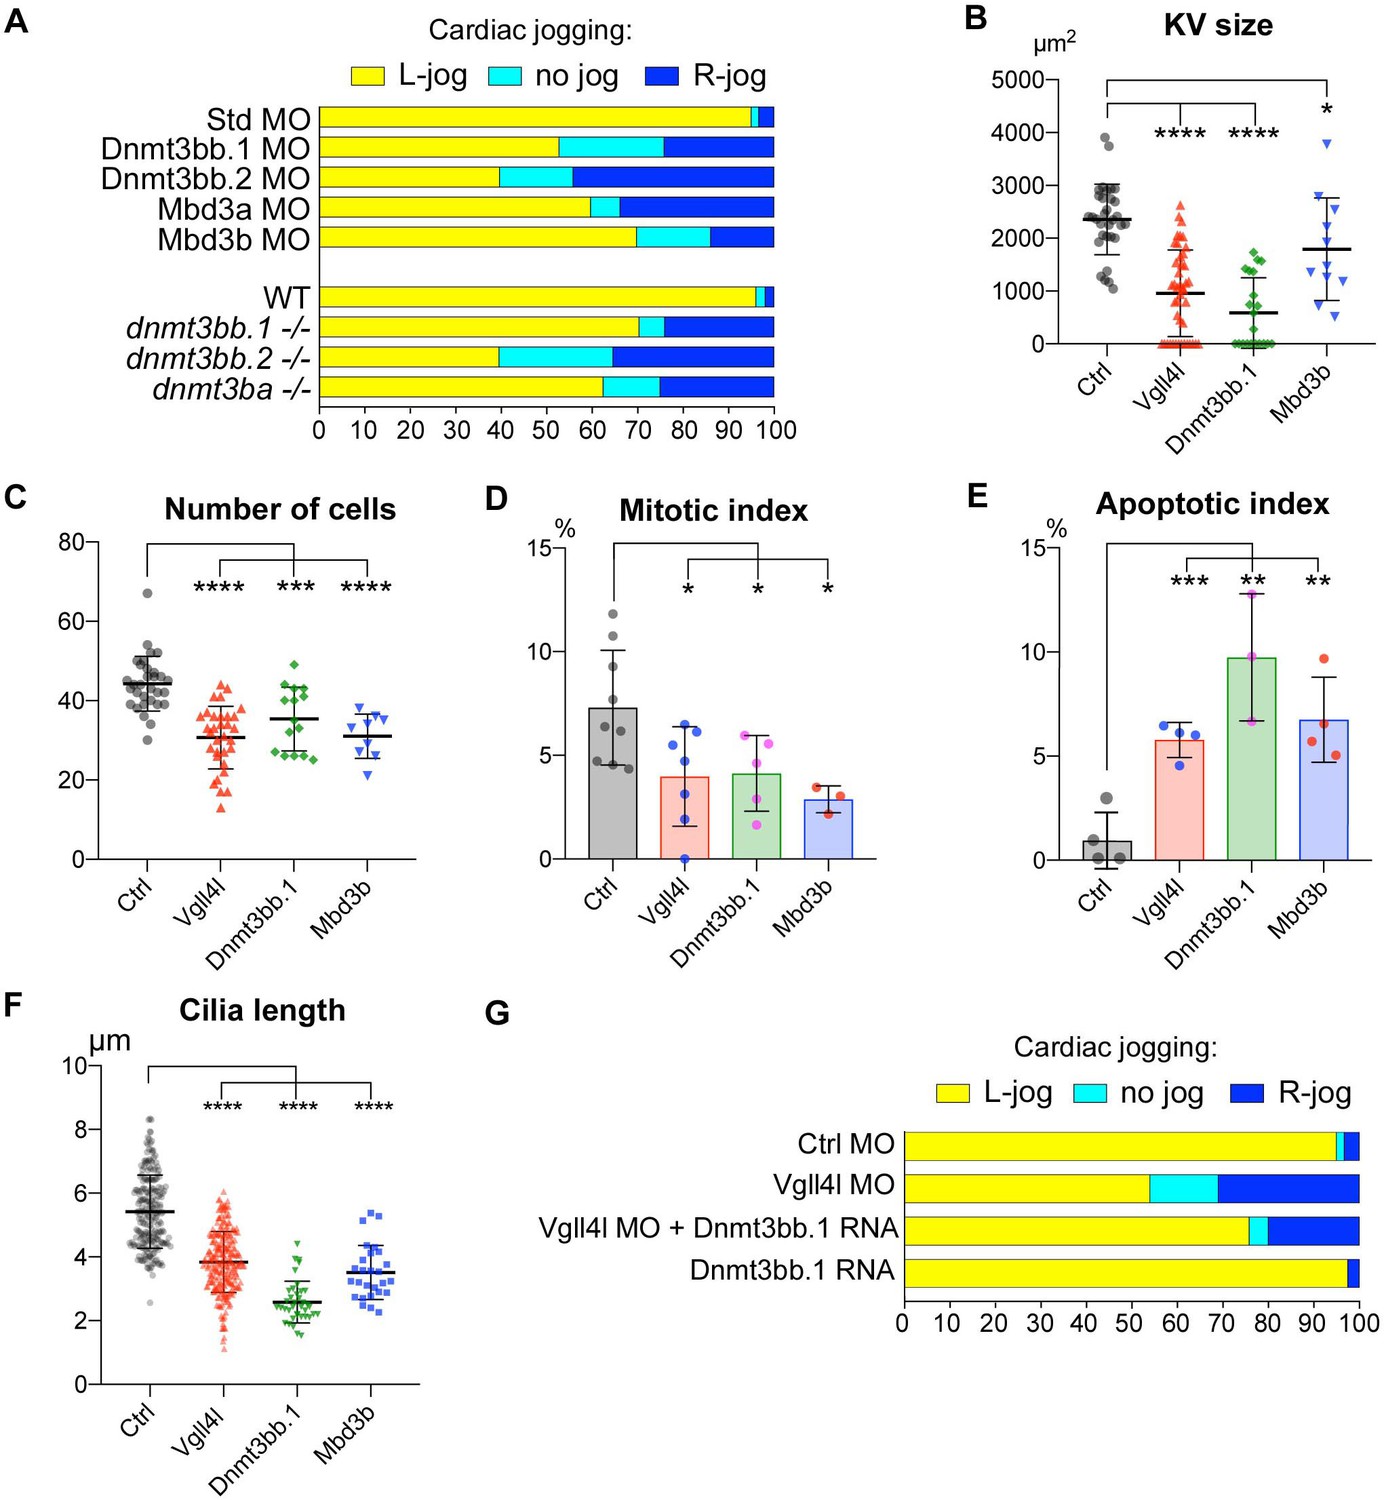
Similarity between phenotypes of Dnmt3bs, Mbd3s and Vgll4l loss of function in DFCs.
(A) Loss of function of writers (dnmt3s) and readers (mbds) of DNA methylation marks strongly disrupt embryo laterality, analyzed by examining cardiac jogging at 25 hpf. Graphs indicate the percentage of embryos with normal Left jog (L jog - yellow), Right jog (R jog – dark blue) or no jog (light blue), at 25 hpf in control embryos (injected with 8 ng Standard - Std - MO), MO KDs (8 ng each MO) or in homozygous mutant embryos (-/-). (B–F) Phenotype analysis of LRO defects in morphants. (B) Size of the KV expressed in surface area of the planar projection of its lumen, (C) number of DFCs at the end of gastrulation, (D) Mitotic index at 80% epiboly, (E) Apoptotic index at gastrulation and (F) Length of KV cilia in : control (Ctrl) embryos (gray), Vgll4l (red), Dnmt3bb.1 (green) or Mbd3b (blue) MO knockdowns. Statistical significance between controls and loss of function conditions: two-tailed unpaired t-test. *p≤0.05, **p≤0.01, ***p≤0.001, ****p≤0.0001. Numerical data (A–H) and details of statistical analysis for (B–F) are provided in Figure 9—source data 1. (G) Injection of 100 ng of in vitro synthesized Dnmt3bb.1 RNA partially rescues laterality defects of Vgll4l morphants (8 ng Vgll4l MO), scored on cardiac jogging at 25 hpf.
-
Figure 9—source data 1
Numerical data for Figure 9A, B, C, D, E, F and G.
- https://doi.org/10.7554/eLife.45241.023
Figure 10
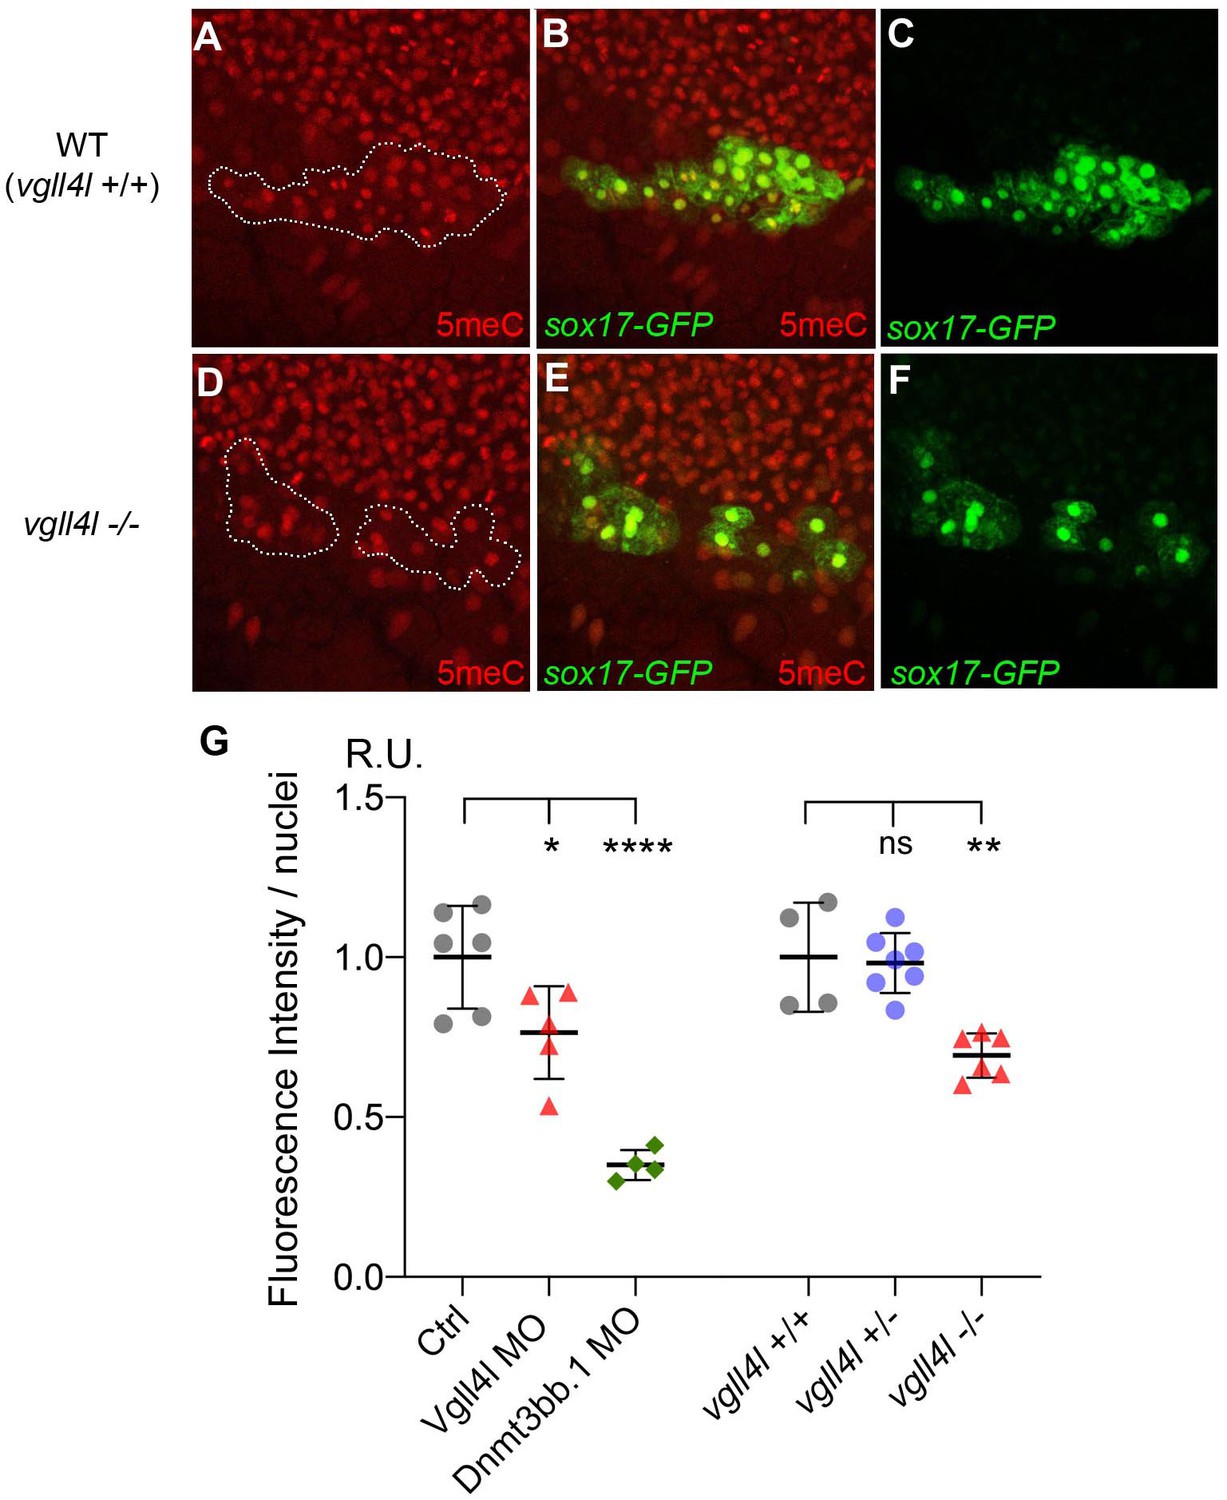
Effect of Vgll4l and Dnmt3bb.1 loss of function on DNA methylation in DFC nuclei.
(A–F) Immunolabeling of DFC nuclei of embryos of the Tg(Sox17:GFP) strain with antibodies to five methyl Cytosine (5meC) in (A–C) WT and (D–F) vgll4l homozygous mutant. Dotted lines delimit the DFC clusters. (G) Quantification of DNA methylation measured by immunofluorescence intensity. The values on the graph correspond to the mean of 5meC fluorescence intensity per nuclei (FI/nuclei) quantified with the ImageJ software on all nuclei of DFC clusters in morphants for Vgll4l and Dnmt3bb.1 and in embryos from a cross between two heterozygous Vgll4l mutants that have been individually genotyped after measurement of FI/nuclei of their DFCs. Fluorescence intensity per nuclei is expressed in relative units (R.U.). Statistical significance between controls (standard MO or vgll4l +/+) and loss of function conditions: two-tailed unpaired t-test. ns, not significant (p>0.05), *p≤0.05, **p≤0.01, ***p≤0.001, ****p≤0.0001. Numerical data and details of statistical analysis for (G) are provided in Figure 10—source data 1.
-
Figure 10—source data 1
Numerical data for Figure 10G.
- https://doi.org/10.7554/eLife.45241.025
Tables
Table 1
Name, sequence and amount of MO used in knockdown and in DFC targeted knockdown.
https://doi.org/10.7554/eLife.45241.026| MO name | Sequence | References | Amounts injected for knockdown | Amounts injected for DFC targeted knockdown |
|---|---|---|---|---|
| Vgll4l MO1 | TGTAGTGGAAATTAGTGACCGCCAT | This study | 8 ng | |
| Vgll4l MOsp | TTGGGCTGTCCTGTGAAAAGATGAG | This study | 6 ng | |
| Vgll4b MO1 | ACAGGTCCATTTTGGTAAAAAGCAT | (Melvin et al., 2013) | 4 ng | 8 ng |
| Vgll4b MO2 | AATCGCAGAAAGAGCAGCTTCTCTT | This study | 4 ng | |
| Yap MO1 | CTCTTCTTTCTATCCAACAGAAACC | (Hu et al., 2013; Jiang et al., 2009) | 6 ng | |
| Yap MOsp | AGCAACATTAACAACTCACTTTAGG | (Skouloudaki et al., 2009) | 4 ng | |
| Taz MO1 | CTGGAGAGGATTACCGCTCATGGTC | (Hong et al., 2005) | 8 ng | |
| Taz MOsp1 | TGTATGTGTTTCACACTCACCCAGG | This study | 6 ng | |
| Taz MOsp2 | ATGTGACTGCACAACAAACACAGAA | This study | 6 ng | |
| Tead1a MO1 | CATGGCAATGGATGTGATCTCAGAG | This study | 8 ng | |
| Tead1a MO2 | TGAGCCTGGAGAACTCAAGGCACAC | This study | 8 ng | |
| Tead3a MO1 | CGTCCATTCCGGTTTTGTCCATCCC | This study | 2 ng | |
| Tead3a MOsp1 | CAGCTTTCTGTTACTCACCATACAT | This study | 8 ng | |
| Tead3a MOsp2 | GGGTCTGAAATACTCACTCCTGAGA | This study | 8 ng | |
| Dnmt3bb.1 MO1 | TTATTTCTTCCTTCCTCATCCTGTC | (Huang et al., 2013; Shimoda et al., 2005) | 8 ng | 8 ng |
| Dnmt3bb.1 MOsp | CTCTCATCTGAAAGAATAGCAGAGT | (Gore et al., 2016) | 6 ng | 6 ng |
| Dnmt3bb.2 MO1 | CTCCGATCTTTACATCTGCCACCAT | (Huang et al., 2013; Shimoda et al., 2005) | 6 ng | 6 ng |
| Dnmt3bb.2 MOsp | GCACCTGAAAAAGTGTAAACACCAT | This study | 6 ng | 6 ng |
| Mbd3a MO | CCACCTTTTCCTCTCCATGATTTTC | (Huang et al., 2013) | 8 ng | 4 ng |
| Mbd3b MO | TCGTTTTTCTCCATCTCGCATTCTC | This study | 8 ng | 4 ng |
| Standard control MO | CCTCTTACCTCAGTTACAATTTATA | Gene tools | 8 ng | 8 ng |
Author response table 1
| Gene | Ctrl | Yap/Taz | Yap/Taz FC | ref | ||
| 1 | igfbp3 | 278 | 0 | -9.8 | 6 | activated by Yap/Taz in DFCs |
| 2 | F3 | 127 | 0 | -9.4 | 6 | |
| 3 | crim1 | 60 | 0 | -8.3 | 6 | |
| 4 | Diaph3 | 57 | 0 | -7.6 | 9 | |
| 5 | rbms3 | 47 | 0 | -7.4 | 6 | |
| 6 | Cdc42ep3 | 21 | 0 | -6.9 | 9 | |
| 7 | ccdc80 | 27 | 0 | -6.6 | 6 | |
| 8 | nuak2 | 251 | 16 | -3.9 | 6 | |
| 9 | ptgs2a | 110 | 11 | -3.2 | 4 | |
| 10 | anln | 908 | 182 | -2.3 | 9 | |
| 11 | gpatch4 | 262 | 73 | -1.8 | 10 | |
| 12 | lmnb2 | 3219 | 1385 | -1.2 | 10 | |
| 13 | amotl2a | 912 | 394 | -1.2 | 6 | |
| 14 | dock5 | 11 | 4 | -1.2 | 6 | |
| 15 | myof | 1037 | 428 | -1.2 | 6 | |
| 1 | ddit4 | 1235 | 2830 | 1.1 | 8 | repressed by Yap/Taz in DFCs |
| 2 | txn | 767 | 4574 | 2.5 | 5 | |
| 3 | Thbs1 | 2 | 17 | 2.8 | 9 | |
| 4 | ankrd1a | 0 | 59 | 6.8 | 1 | |
| 5 | ankrd1a | 0 | 59 | 6.8 | 6 | |
| 6 | gadd45ab | 1 | 202 | 7 | 6 | |
| 7 | Plaua | 0 | 77 | 7.3 | 7 | |
| 8 | Serpine1 | 0 | 201 | 8.6 | 9 | |
| 1 | ankrd1b | 0 | 0 | NS | 1 | not regulated by Yap/Taz in DFCs |
| 2 | cat | 106 | 88 | NS | 2 | |
| 3 | ptgs2b | 0 | 0 | NS | 4 | |
| 4 | wsb2 | 0 | 0 | NS | 10 | |
| 5 | cyr61 | 0 | 0 | NS | 6 | |
| 6 | ctgfa | 0 | 0 | NS | 6 | |
| 7 | ctgfb | 0 | 0 | NS | 6 | |
| 8 | amotl2b | 21 | 12 | NS | 6 | |
| 9 | ankrd1b | 0 | 0 | NS | 6 | |
| 10 | last2 | 157 | 267 | NS | 6 | |
| 11 | gadd45aa | 0 | 0 | NS | 6 | |
| 12 | tgfb2 | 0 | 0 | NS | 6 | |
| 13 | nt5e | 0 | 0 | NS | 6 | |
| 14 | foxf2 | 0 | 0 | NS | 6 | |
| 15 | asap1 | 0 | 0 | NS | 6 | |
| 16 | Plaub | 0 | 0 | NS | 7 | |
| 17 | Wtip | 0 | 1 | NS | 9 |
Additional files
-
Supplementary file 1
Transcriptome of DFCs at 80% epiboly in Control (Ctrl), Vgll4l and Yap/Taz loss-of-function.
- https://doi.org/10.7554/eLife.45241.027
-
Supplementary file 2
Regulation of the expression by Vgll4l and Yap/Taz of zebrafish homologs of Yap direct target genes in mammals.
Table summarizing the variation of expression (fold change) of genes differentially expressed (normalized counts > 1, llog2foldchangel ≥ 1, adjusted P value ≤ 0,05) between control and Vgll4l or Yap/Taz morphants for 143 zebrafish homologs of Yap direct target genes in mammals. Reference source for the set of Yap direct target genes: (1) (Zanconato et al., 2015), (2) (Wang et al., 2018), (3) (Lin et al., 2015)
- https://doi.org/10.7554/eLife.45241.028
-
Supplementary file 3
Expression of genes known to be required for DFCs and/or KV development in control and in Vgll4l or Yap/Taz loss-of-function condition.
- https://doi.org/10.7554/eLife.45241.029
-
Supplementary file 4
Expression of genes coding for proteins involved in ciliogenesis and known to be required for proper function of the LRO in control and in Vgll4l or Yap/Taz loss-of-function condition.
- https://doi.org/10.7554/eLife.45241.030
-
Supplementary file 5
Sequence of primers used to generate sgRNAs and for screening Crispr/Cas9 mutants.
- https://doi.org/10.7554/eLife.45241.031
-
Supplementary file 6
Position of MO, ASO target sequences and of mutations in vgll4l, vgll4b, yap, taz, tead1a and tead3a.
- https://doi.org/10.7554/eLife.45241.032
-
Supplementary file 7
Sequences of mutations in vgll4l, vgll4b, yap, taz, tead1a and tead3a.
- https://doi.org/10.7554/eLife.45241.033
-
Supplementary file 8
Position of MO target sequences and mutations in dnmt3bb.1, dnmt3bb.2, dnmt3ba, mbd3a and mbd3b.
- https://doi.org/10.7554/eLife.45241.034
-
Supplementary file 9
Sequence of dnmt3bb.1, dnmt3bb.2 and dnmt3ba mutants.
- https://doi.org/10.7554/eLife.45241.035
-
Transparent reporting form
- https://doi.org/10.7554/eLife.45241.036
Download links
A two-part list of links to download the article, or parts of the article, in various formats.
Downloads (link to download the article as PDF)
Open citations (links to open the citations from this article in various online reference manager services)
Cite this article (links to download the citations from this article in formats compatible with various reference manager tools)
TEADs, Yap, Taz, Vgll4s transcription factors control the establishment of Left-Right asymmetry in zebrafish
eLife 8:e45241.
https://doi.org/10.7554/eLife.45241


