The molecular architecture of engulfment during Bacillus subtilis sporulation
- University of California, San Diego, United States
Figures
Figure 1 with 3 supplements

Visualizing the 3D architecture of engulfment during sporulation in B. subtilis.
(A) Schematic illustrating the process of polar septation, chromosome translocation, engulfment and spore maturation. Membranes (red), PG (gray), chromosomes (blue), SpoIIIE (orange) and coat proteins (shades of brown) are highlighted. Outward arrows in the stage IIii forespore indicate increased turgor pressure due to chromosome translocation. (B) Revised engulfment model (Ojkic et al., 2016): new PG (purple) is synthesized ahead of the leading edge of the engulfing membrane by forespore-associated PG biosynthetic enzymes (blue) and is subsequently degraded by DMP (yellow pacman), making room for the engulfing membrane to advance. The coordinated synthesis and degradation of PG at the leading edge of the engulfing membrane can move the junction between the septum (pink) and the lateral cell wall (gray) around the forespore. (C) Schematic illustrating cryo-FIB-ET methodology for bacterial samples (see Materials and methods). (D–I) Slices through cryo-electron tomograms representing different stages of engulfment: (D) flat polar septum (Stage IIi), (F) curved septum (Stage IIii) and (H) engulfing septum (Stage IIiii). Scale bar for (D,F,I): 200 nm. The corresponding forespore membrane (green) and the mother cell membrane (yellow) are annotated in (E,G,I) respectively. n indicates the number of tomograms acquired for each cell type. Scale bars have been omitted for (E,G,I) as cells are shown in perspective views . (J–N) Zoomed-in slices through cryo-electron tomograms showing (J) a large ellipsoidal complex adjacent to the forespore membrane (black arrow), (K) a putative SpoIIIE channel (brown arrow) and (L) another putative channel (brown arrow), (L,M) coat filaments (green arrows), (M) basement coat layer (maroon arrow) and (N) amorphous coat proteins (purple arrow). Scale bar for (J-N): 50 nm.
Figure 1—figure supplement 1
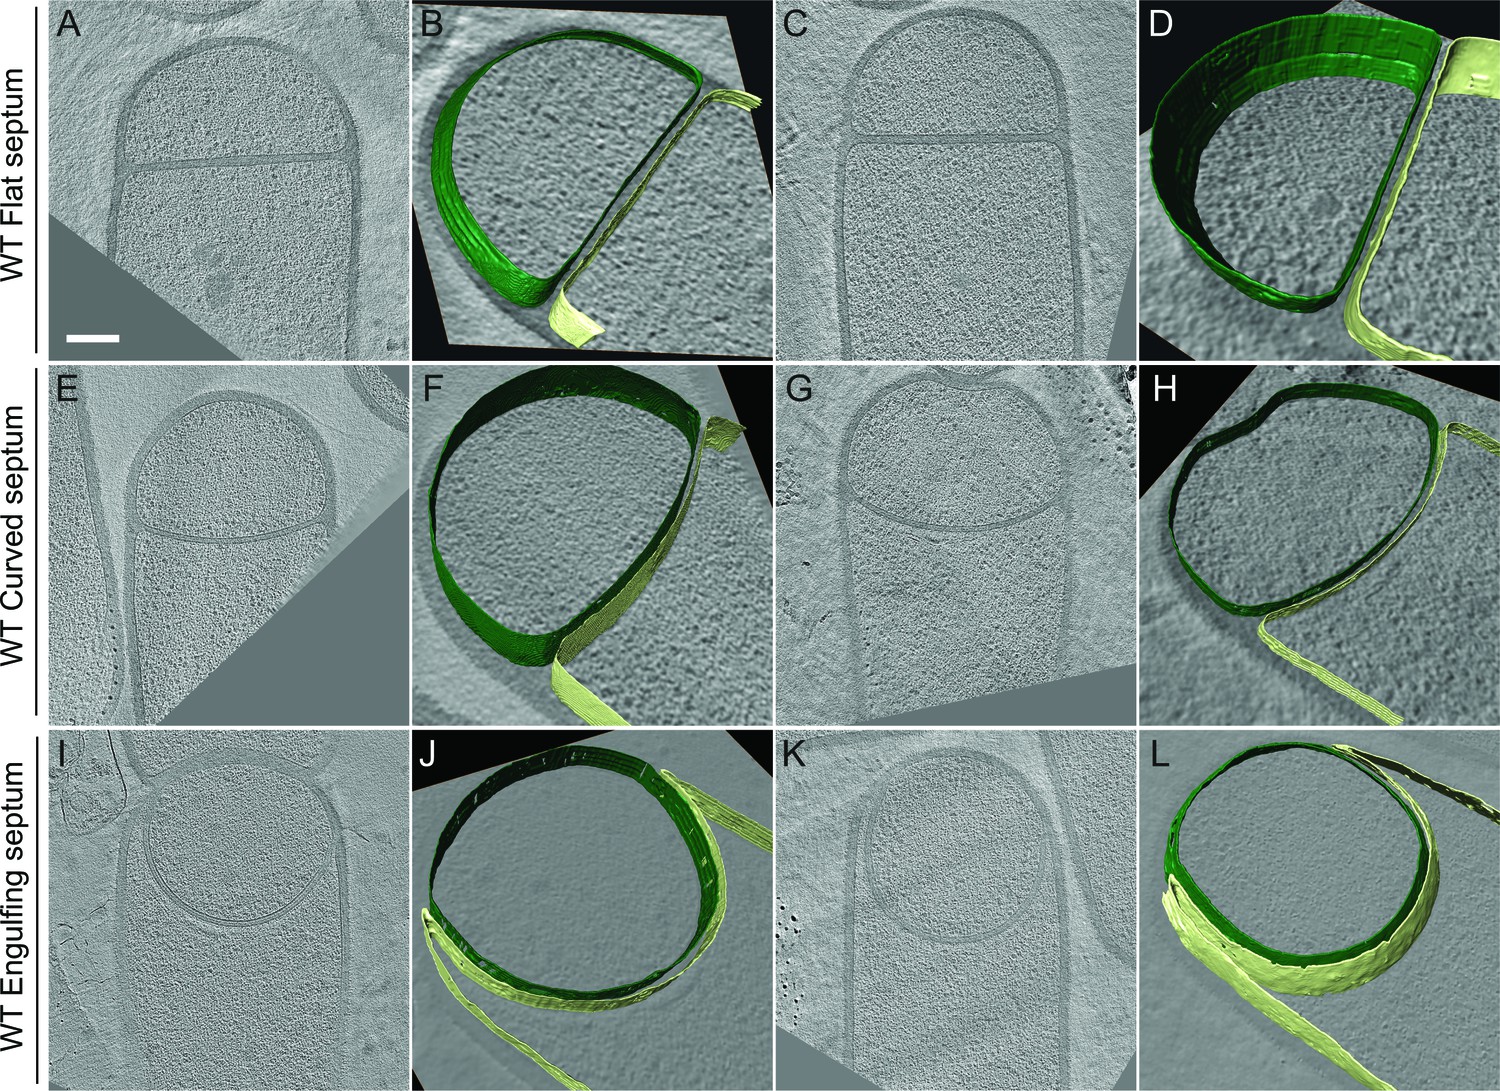
Slices through cryo-electron tomograms representing different stages of engulfment in wild type sporulating B. subtilis cells.
The forespore (green) and the mother cell (yellow) membranes are annotated and shown adjacent to each tomogram. (A–D) represent flat septum (Stage IIi) sporangia, (E–H) represent curved septum (Stage IIii) sporangia and (I–L) represent engulfing septum (Stage IIiii) sporangia. Scale bar for the tomogram slices (A,C,E,G,I,K): 200 nm. Scale bars have been omitted for all segmented images as cells are displayed in perspective mode.
Figure 1—figure supplement 2
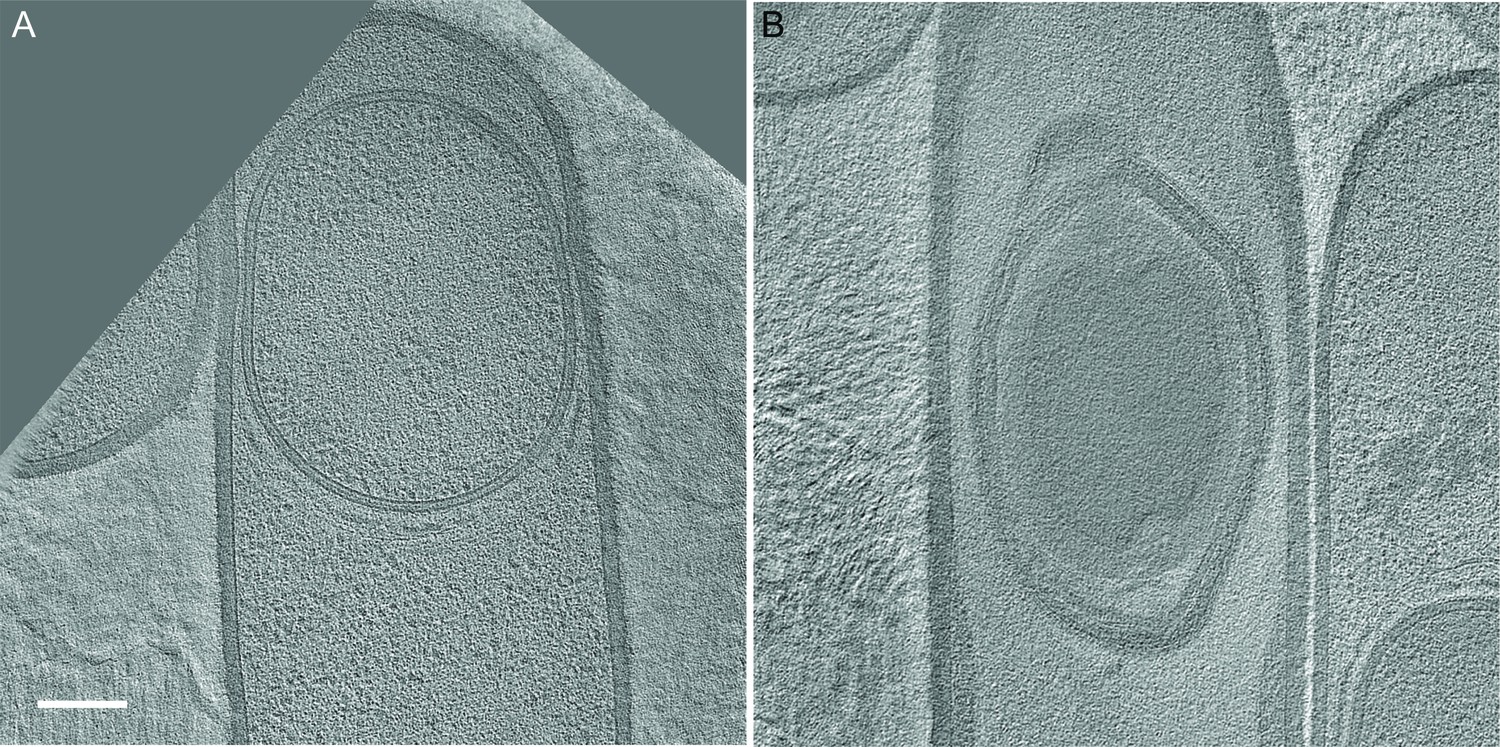
Slices through cryo-electron tomograms representing later stages of sporulation when the forespore is completely inside the mother cell.
(A) represents an earlier stage than (B). A dense spore with coat and cortex layers is observed in (B). Scale bar: 200 nm.
Figure 1—figure supplement 3
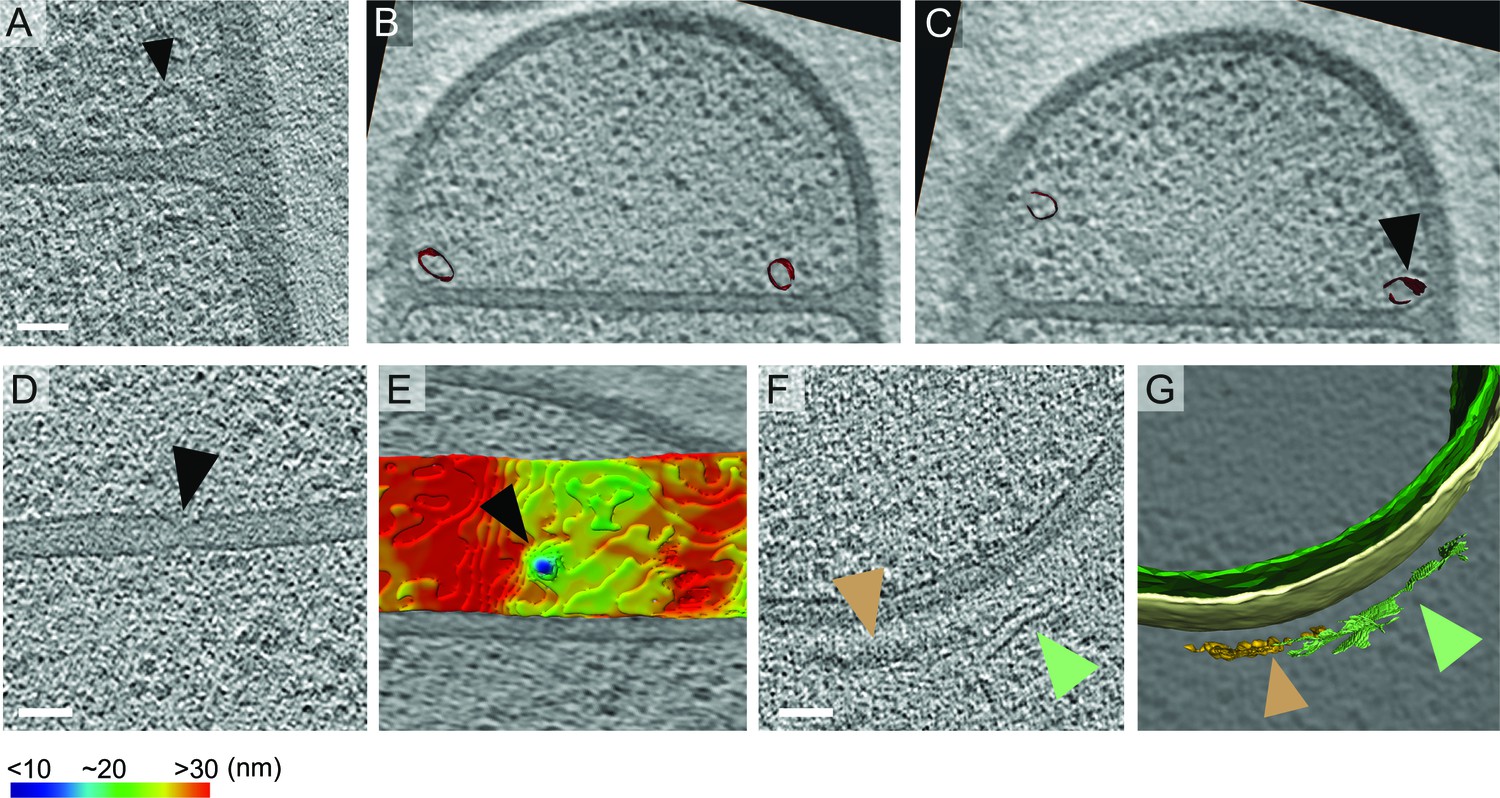
Unidentified complexes during sporulation in B. subtilis.
(A) Ellipsoidal structure (black arrow) seen in the forespore shortly after septum formation as shown in Figure 1J. Scale bar: 50 nm. (B,C) 2 different slices through the same cryo-electron tomogram shown in (A) depicting the 3D annotation of the ellipsoidal structures (maroon). The structure highlighted in (A) in black arrow is pointed out at in (C). (D) Slice through a cryo-electron tomogram with putative SpoIIIE channel (black arrow) highlighted as in Figure 1K and (E) shows the corresponding color-coded distance of the forespore membrane from the mother cell membrane. The putative channel corresponds to a septal thickness of ~14 nm. (F) Slice through a cryo-electron tomogram with coat filaments (green arrow) and amorphous dense coat layer (orange arrow) highlighted. (G) shows the corresponding 3D annotations of the filaments (green) and the coat layer (orange), along with the forespore membrane (green) and the mother cell membrane (yellow). Scale bar for (D,F): 50 nm. Scale bars have been omitted for all segmented images as cells are displayed in perspective mode.
Figure 2 with 2 supplements
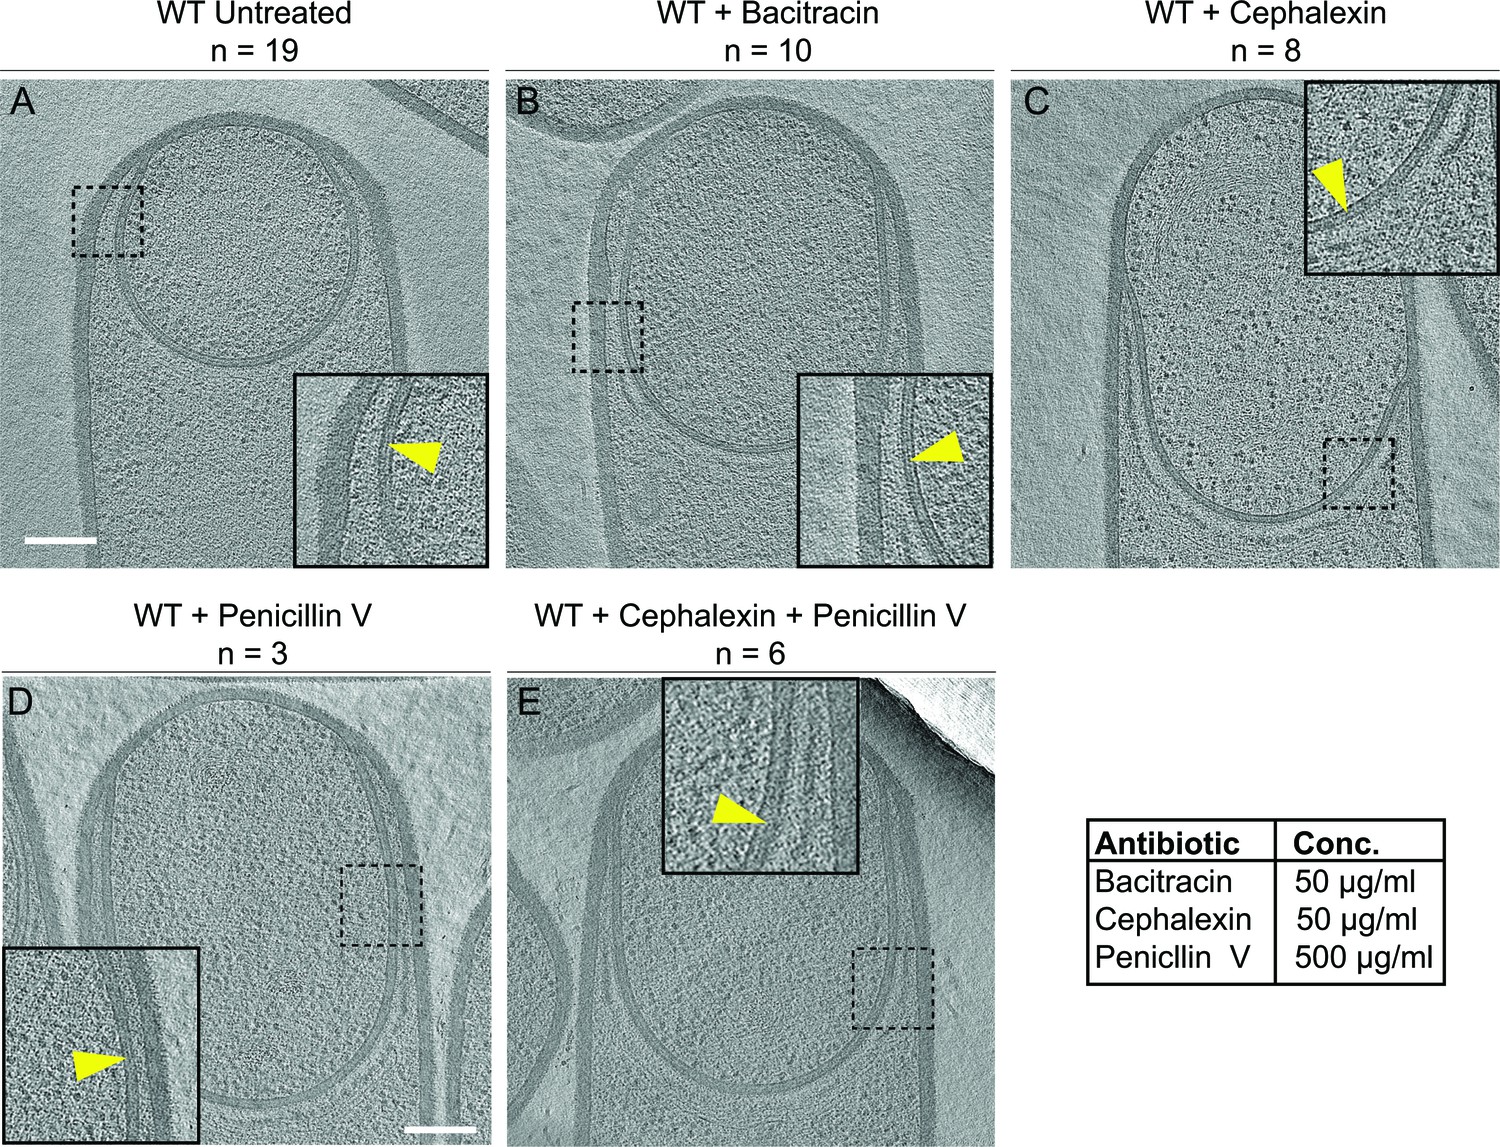
Septal PG is not completely degraded at the onset of engulfment.
(A–C) Slices through cryo-electron tomograms of wild type engulfing sporangia that are (A) untreated, (B) bacitracin-treated, (C) cephalexin-treated, (D) penicillin V-treated and (E) penicillin V- and cephalexin-treated. The thin layer of septal PG is indicated by yellow arrows in the zoom-in panels for each of the tomographic slices. n indicates the number of tomograms acquired for each cell type. Antibiotic concentrations used for the experiments are indicated in the bottom right. Scale bar: 200 nm.
Figure 2—figure supplement 1
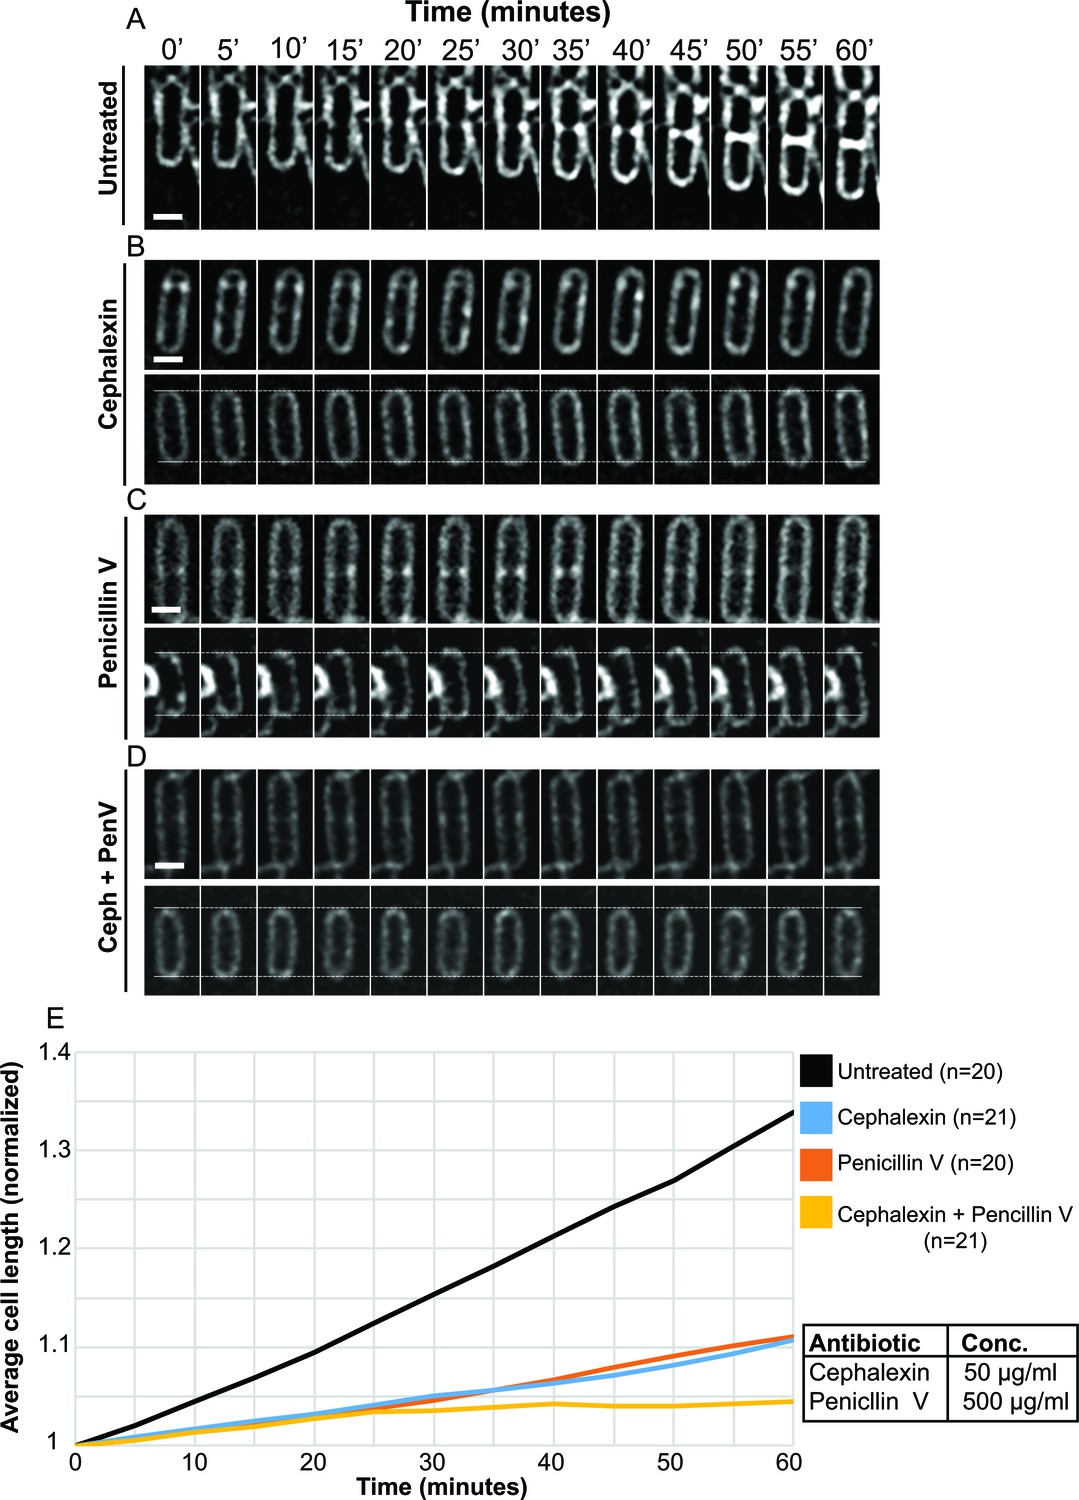
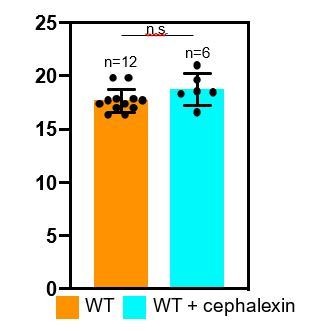
Quantification of cell length upon antibiotic treatment.
(A–D) Time-lapse microscopy showing the growth of wild type vegetative B. subtilis cells that are (A) untreated, (B) cephalexin-treated, (C) penicillin V-treated and (D) treated with a combination of cephalexin and penicillin V. The cells at the top in panels (B–D) had initiated septation before imaging, but the formation of the septum is interrupted upon exposure to the antibiotics, indicating that the blockage of PG synthesis happens on a time scale of a few minutes. An abortive polar septum close to the upper cell pole is observed in the cell in top panel (B), and abortive vegetative septa in the middle of the cell are observed in top panels (C) and (D). The cells at the bottom in panels (B–D) have dotted lines plotted along the lower and the upper pole of the cell from where the time-lapse experiment starts (0 min time point) to provide visual cue for the change in cell length over the course of time. Scale bars for (A–D): 1 μm. (E) Average length of vegetative cells (normalized) plotted as a function of time for untreated and different antibiotic-treated cases. n indicates the number of cells analyzed for each case and antibiotic concentrations used in the study are indicated alongside.
Figure 2—figure supplement 2
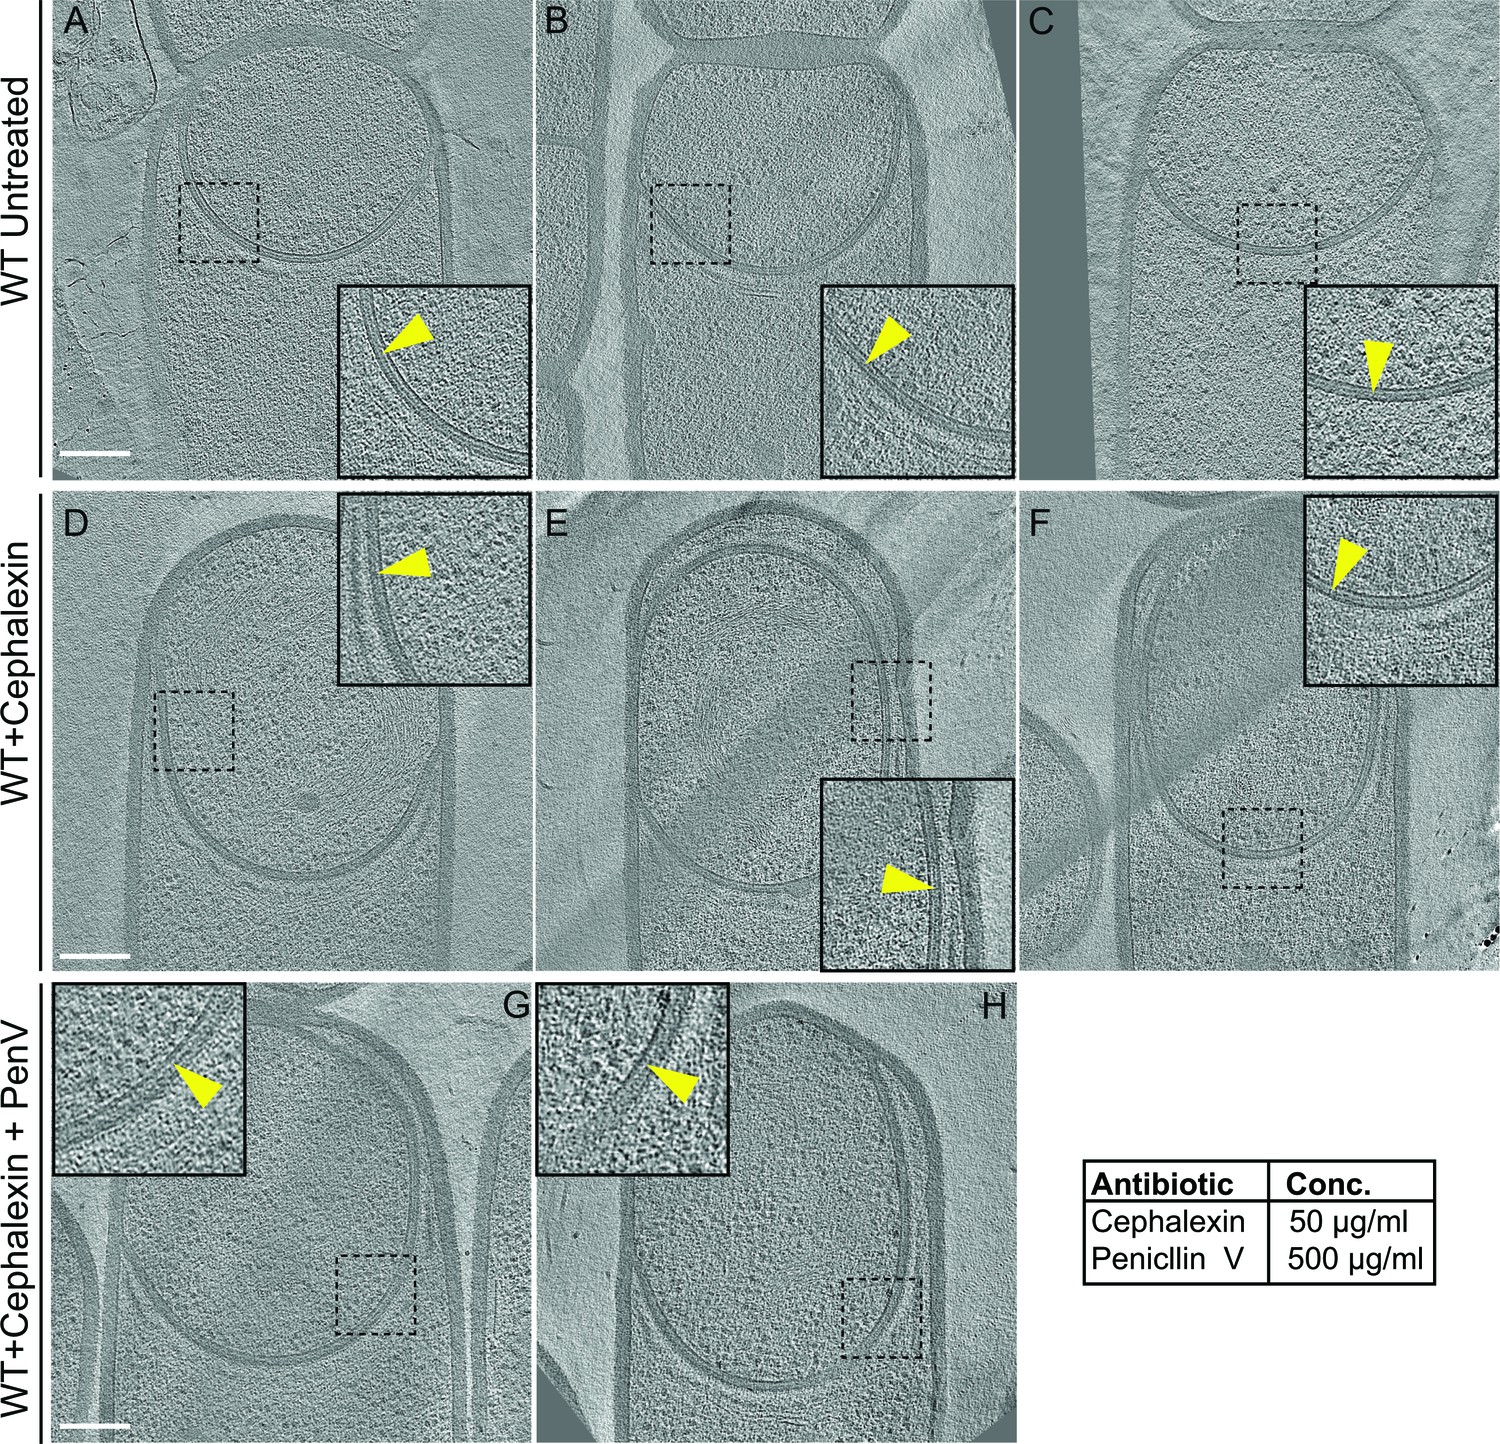
Thin layer of septal peptidoglycan persists in wild type and antibiotic-treated sporangia.
(A–C) Slices through cryo-electron tomograms of wild type untreated B. subtilis sporangia, (D–F) cephalexin-treated) sporangia, and (G,H) cephalexin- and penicillin V-treated sporangia. The thin layer of PG between the forespore and the mother cell membranes is indicated by yellow arrows in the zoom-in panels for each tomographic slice. Antibiotic concentrations used are indicated in the bottom right. Scale bars for (A–H): 200 nm.
Figure 3 with 4 supplements
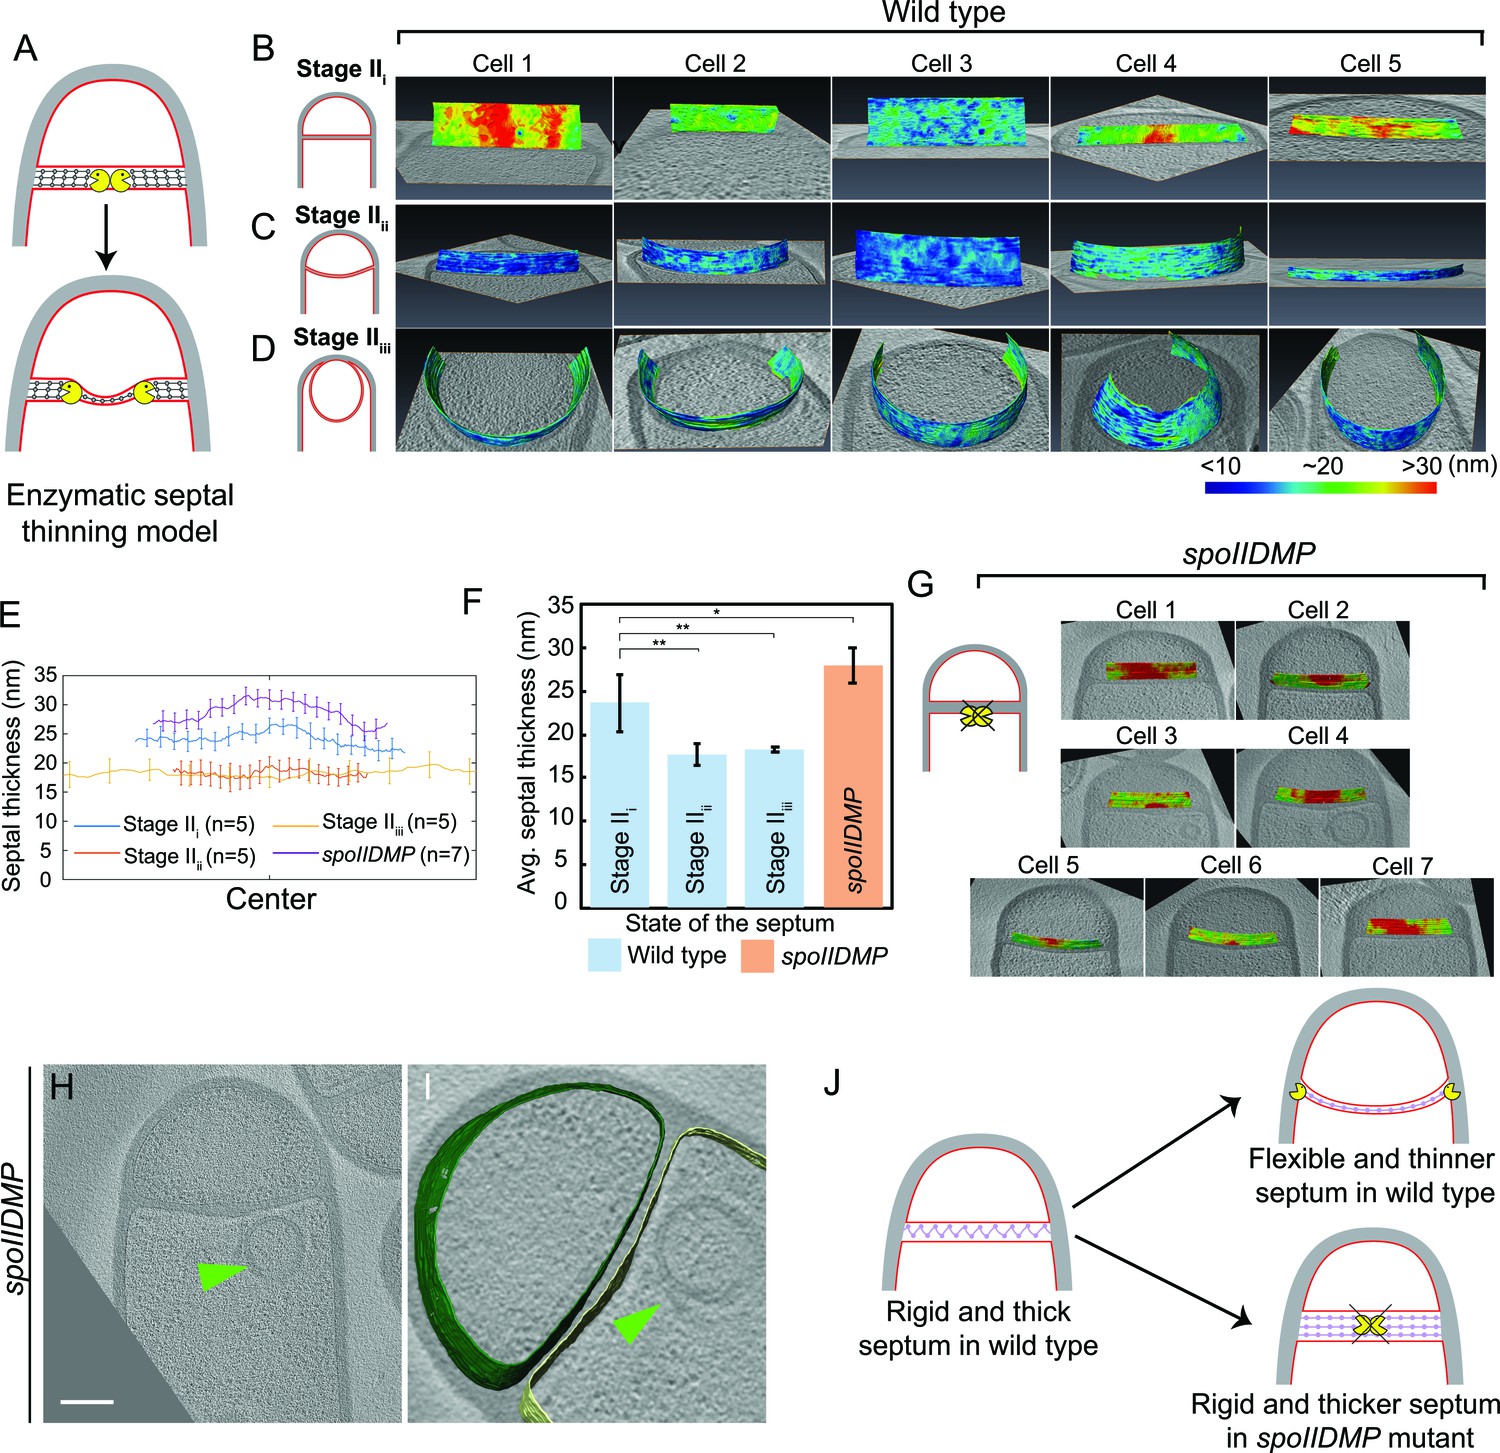
Septum is uniformly and only slightly thinned during engulfment and SpoIIDMP is required to maintain a thin flexible septum.
(A) Schematic illustrating the model of septal thinning driven by septal PG (black meshwork) degradation by the DMP complex (yellow pacman) with membranes (red) and lateral PG (gray) highlighted. (B–D) Septal disc is color-coded according to the distance between the forespore and the mother cell membranes in five wild type sporangia with (B) flat, (C) curved and (D) engulfing septa. Schematic representing the morphology of each cell type is shown on the far left. (E) Average thickness of the septum across the forespore surface for the cells shown in (B–D,G). Error bars indicate standard deviation. n indicates the number of tomograms used for calculating septal distances in each case. (F) Average septal thickness for wild type flat (Stage IIi), curved (Stage IIii) and engulfing (Stage IIiii) sporangia and spoIIDMP mutant sporangia. Error bars indicate standard deviation (n.s.: p>0.05; *: p≤0.05; **: p≤0.01; ***: p≤0.001, unpaired t-test). (G) Septal disc is color-coded according to the distance between the forespore and the mother cell membranes in seven spoIIDMP mutant sporangia. Scale bars have been omitted in distance plots as perspective views are shown. (H) Slice through a cryo-electron tomogram of spoIIDMP mutant sporangia. Scale bar: 200 nm. (I) Annotated forespore (green) and mother cell (yellow) membranes for the tomogram in (H). Excess membrane accumulation is highlighted by green arrows. (J) Schematic representing the role of DMP (yellow pacman) in septal thinning with membranes (red), lateral PG (gray) and septal PG (pink) highlighted. The rigid and thick septum in wild type can curve into the mother cell during engulfment but that of DMP becomes even thicker and does not curve into the mother cell.
-
Figure 3—source data 1
Raw data of septal distances in wild type B. subtilis sporangia and sporangia of engulfment-defective mutants used to plot the bar graph in Figure 3F.
- https://doi.org/10.7554/eLife.45257.022
Figure 3—figure supplement 1
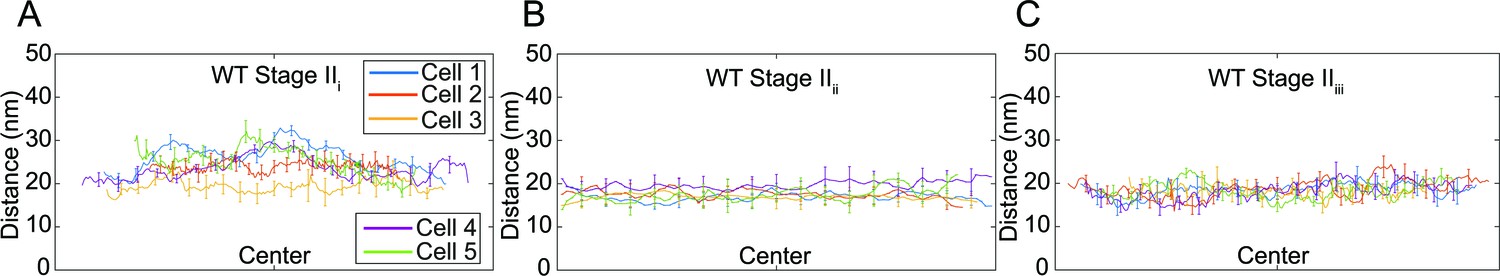
Septal thickness during engulfment in wild type B. subtilis.
(A) Average thickness of the septum across the forespore surface for five wild type Stage IIi sporangia shown in Figure 3B. (B) Average thickness of the septum across the forespore surface for five wild type Stage IIii sporangia shown in Figure 3C. (C) Average thickness of the septum across the forespore surface for five wild type Stage IIiii sporangia shown in Figure 3D.
Figure 3—figure supplement 2
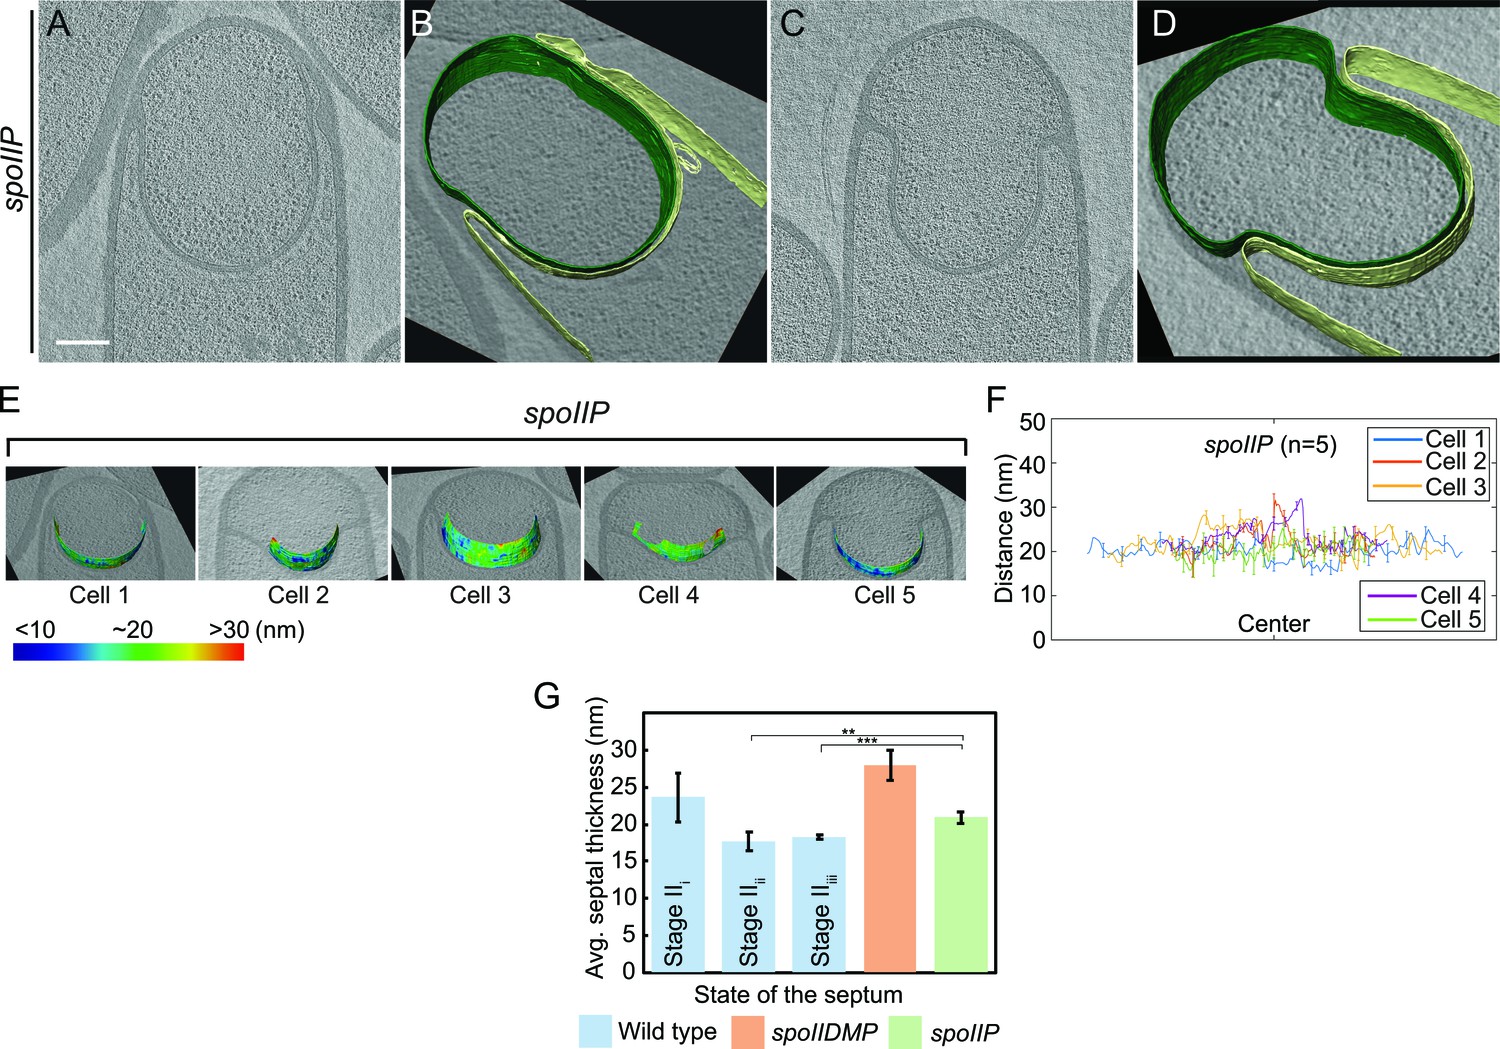
Septal thickness in spoIIP mutant sporangia.
(A–D) Slices through cryo-electron tomograms of spoIIP sporangia with annotations of the forespore membrane (green) and the mother cell membrane (yellow) adjacent to each tomogram. Scale bars for tomogram slices in (A,C): 200 nm. Scale bars have been omitted in segmented images owing to their perspective nature. The septum of spoIIP sporangia typically contains a bulge in the middle, and a thicker, flat region at the edges that does not bulge towards the mother cell. The distance between the membranes was only determined for the part of the setum that bulges towards the mother cell, but not for the thicker part at the edges that does not bulge. (E) Color-coded distance of the forespore membrane from the mother cell membrane along the length of the septum for spoIIP mutant sporangia. (F) Average thickness of the septum across the forespore surface for five spoIIP mutant sporangia shown in (E). (G) Average septal thickness for wild type stages IIi-iii and spoIIDMP and spoIIP mutant sporangia. Error bars indicate standard deviation (n.s.: p>0.05; *: p≤0.05; **: p≤0.01; ***: p≤0.001, unpaired t-test).
Figure 3—figure supplement 3
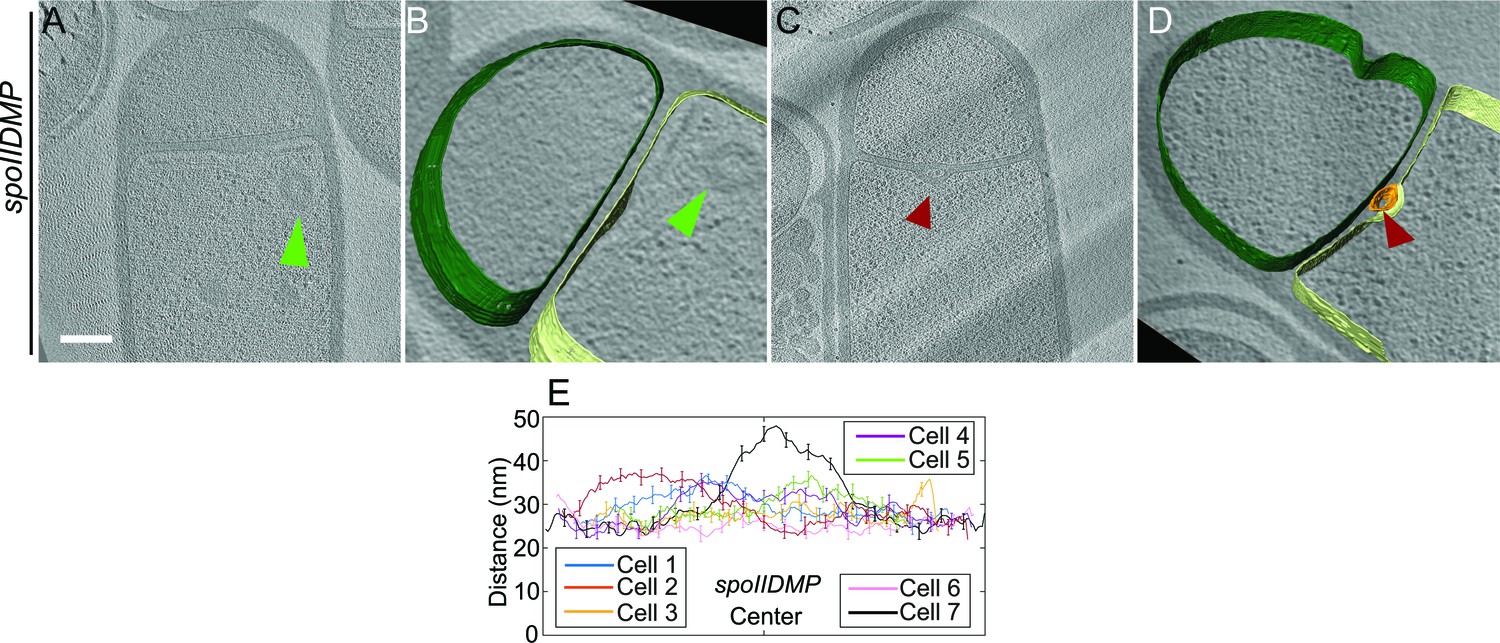
Septal thickness in spoIIDMP sporangia.
(A–D) Slices through cryo-electron tomograms of spoIIDMP mutant sporangia with annotations of the forespore membrane (green) and the mother cell membrane (yellow) adjacent to each tomogram. Bulges are indicated by green arrows in (A,B) and in red arrows in the middle of the septum in (C,D). Scale bars for tomogram slices in (A,C): 200 nm. Scale bars are omitted for all segmented images due to their perspective nature. (E) Average thickness of the septum across the forespore surface for seven spoIIDMP sporangia shown in Figure 3G.
Figure 3—figure supplement 4
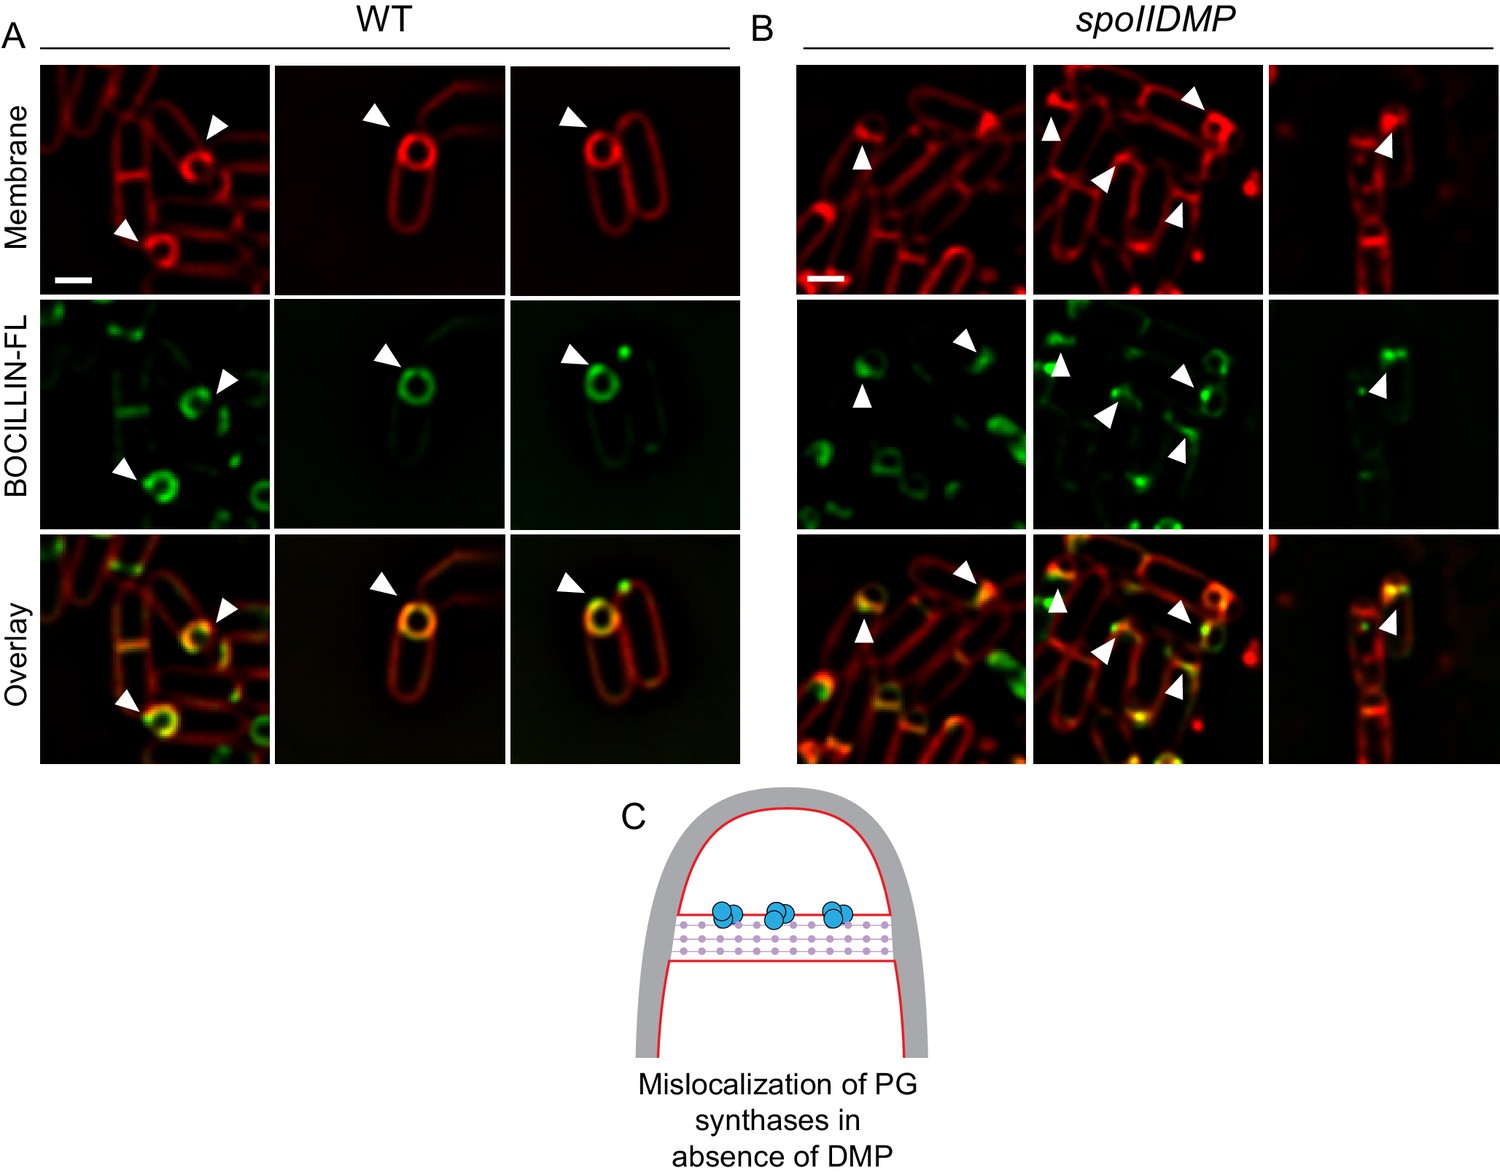
Observing peptidoglycan synthesis using BOCILLIN-FL.
(A) Wild type sporulating cells stained with a green fluorescent derivative of penicillin V (BOCILLIN-FL). Membranes were stained with FM 4–64 (red). White arrows indicate cells with enhanced fluorescent signal at the leading edges of the engulfing membrane. (B) spoIIDMP mutant sporangia stained with BOCILLIN-FL (green). Membranes were stained with FM 4–64 (red). White arrows indicate cells with enhanced fluorescent signal in variable regions of the septum. Scale bars: 1 μm. (C) Schematic to explain accumulation of PG synthases in the septum (blue circles) in the absence of DMP as opposed to being localized near the leading edges in wild type sporangia. Membranes (red), lateral PG (gray) and septal PG (pink circles) are also highlighted.
Figure 4 with 6 supplements
Architecture of the leading edge of the engulfing membrane.
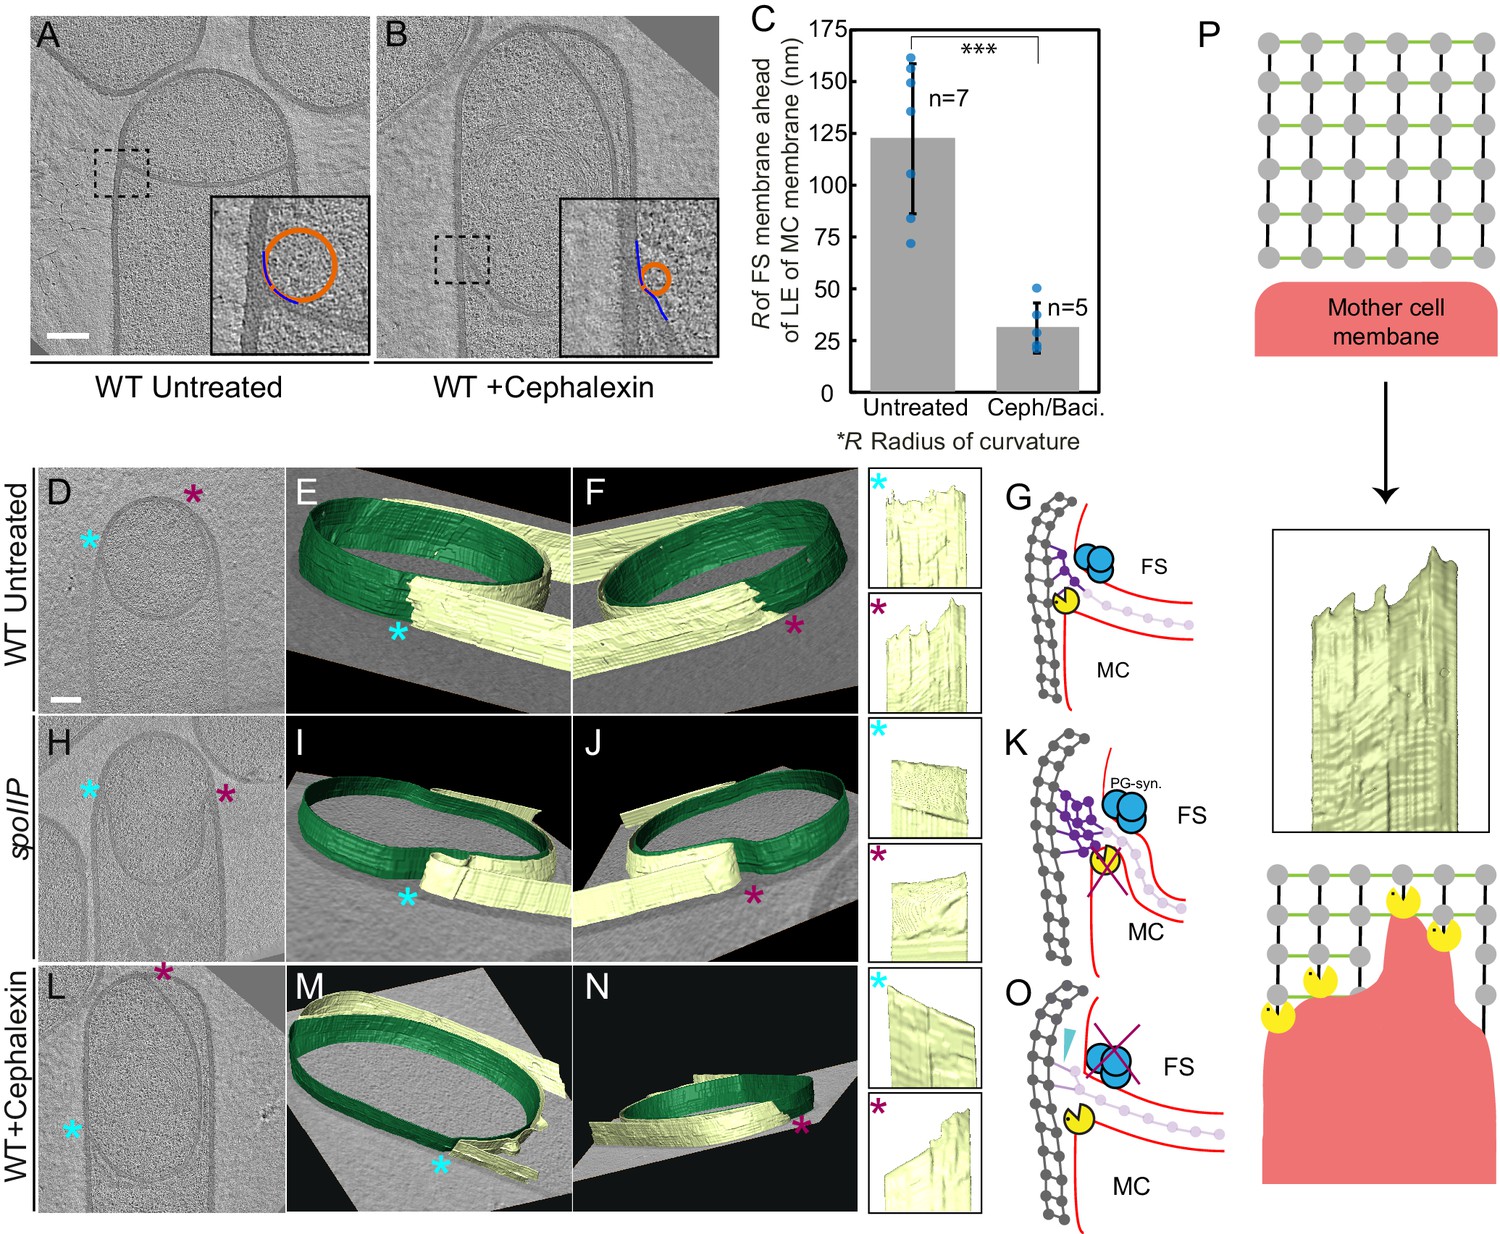
(A,B) Slices through cryo-electron tomograms of wild type (A) untreated and (B) cephalexin-treated sporangia. The radius of curvature (orange circle) of the forespore membrane (blue spline) ahead of the leading edge of the engulfing membrane is highlighted in the respective insets. (C) Plot showing the average radius of curvature (nm) of the forespore membrane ahead of the leading edge of the engulfing membrane for untreated and antibiotic-treated sporangia. Blue dots indicate individual data points (as also indicated by n); black bars indicate the standard deviation (***: p<0.001, unpaired t-test). (D) Slice through a cryo-electron tomogram of wild type B. subtilis sporangium. (E,F) Annotated forespore (green) and mother cell (yellow) membranes for the tomogram shown in (D) as viewed from both the left (blue asterisk) and the right (maroon asterisk) sides respectively, with insets of zoomed-in views of the leading edge of the engulfing membrane of both sides. Similar labeling scheme is followed through (H–N). (G) Schematic showing the localization of DMP PG degradation machinery (yellow pacman) and PG synthases (blue circles). Membranes (red), lateral PG (gray), septal PG (pink) and new PG (purple) are also highlighted. (H) Slice through a cryo-electron tomogram of spoIIP mutant sporangium. (I,J) Annotated membranes for the tomogram shown in (H) with insets of zoomed-in views of the leading edge of the engulfing membrane of both sides. (K) Schematic representing a cell in which the DMP complex (yellow pacman) does not assemble. (L) Slice through a cryo-electron tomogram of cephalexin-treated sporangium. (M,N) Annotated membranes for the tomogram shown in (L) with insets of zoomed-in views of the leading edge of the engulfing membrane of both sides. (O) Schematic representing a cell in which PG synthesis (blue circles) has been inhibited. Scale bar for (D,H,L): 200 nm. Scale bars have been omitted for surface rendered images owing to their perspective nature. (P) Model for mother cell membrane migration. DMP complexes (yellow pacman) present at different positions on the mother cell membrane (red) tether the membrane to the PG (gray) synthesized ahead. Due to a limited number of DMP complexes, the engulfing membrane may move forward in finger-like projections. This is indicated by a representative annotated mother cell membrane (yellow) from Figure 4F.
Figure 4—figure supplement 1
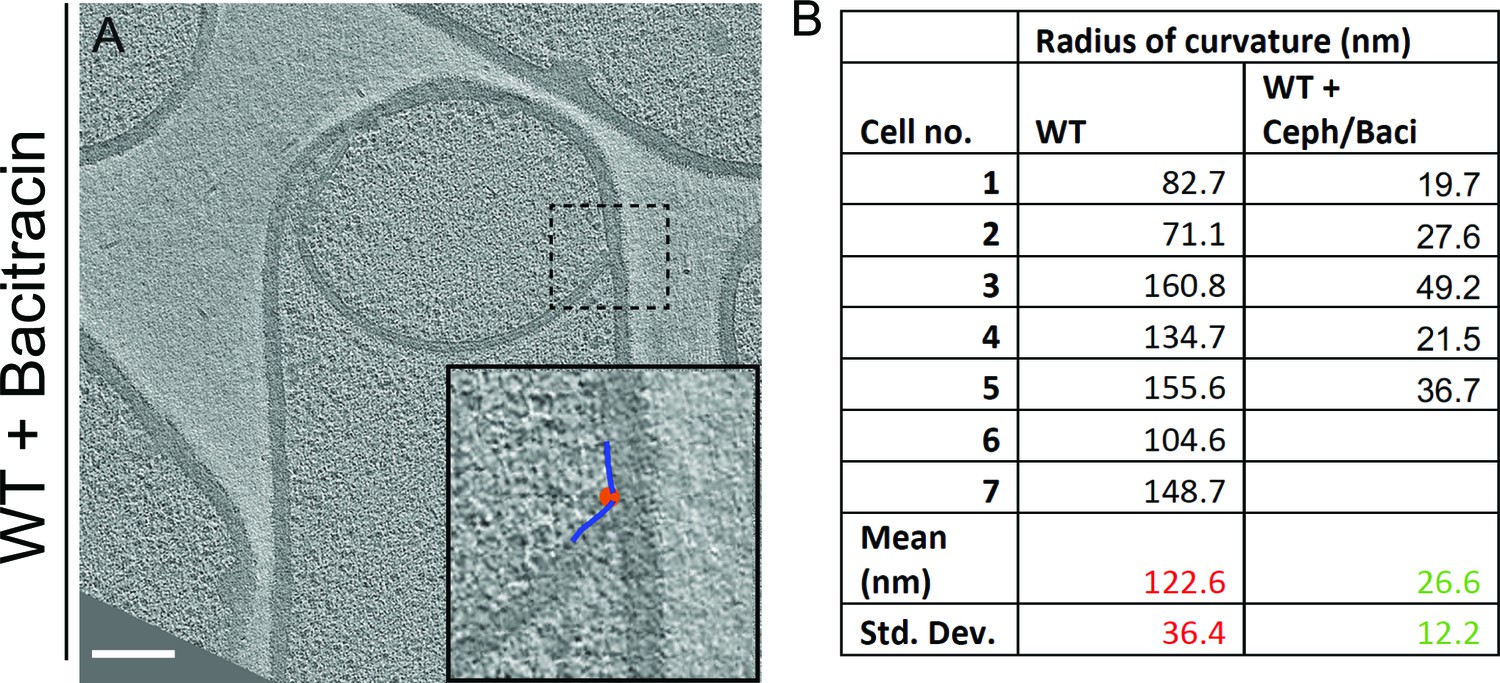
Quantification of radius of curvature of the forespore membrane.
(A) Slice through a cryo-electron tomogram of a wild type sporangium treated with bacitracin (50 μg/ml) with the radius of curvature of the forespore membrane ahead of the leading edge of the engulfing membrane highlighted. Scale bar: 200 nm. (B) Raw data for radius of curvature of the forespore membrane of wild type sporangia and antibiotic (cephalexin and bacitracin) treated sporangia with mean and standard deviation indicated.
Figure 4—figure supplement 2
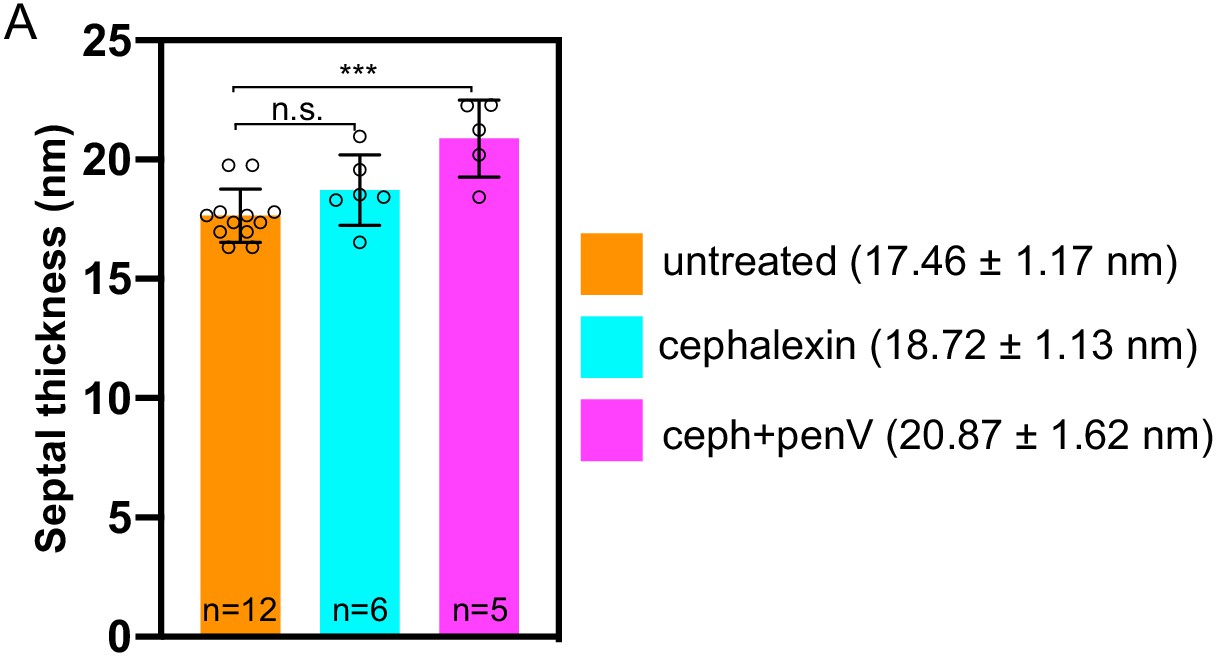
Graph depicting the septal thickness of wild type untreated and antibiotic-treated sporangia (cephalexin and a combination of cephalexin and penicillin V) according to concentrations specified in Figure 2—figure supplement 1.
n indicates the number of tomograms analysed. The mean and standard deviation for each case is indicated.
Figure 4—figure supplement 3
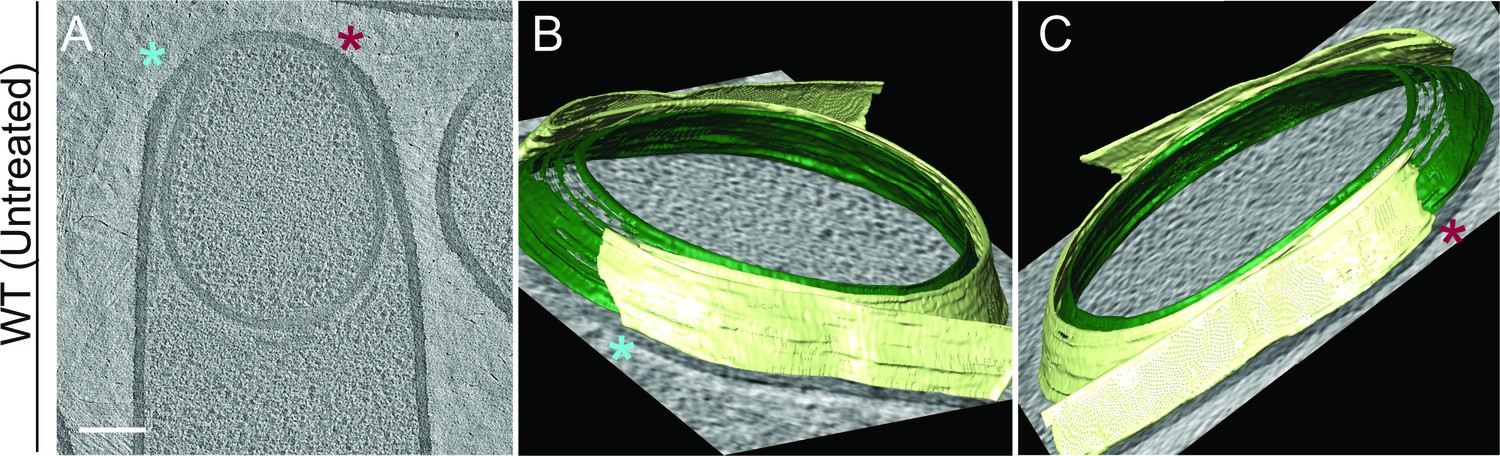
Membrane architecture in wild type.
(A) Slice through a cryo-electron tomogram of a wild type sporangium. (B,C) Annotation of membranes for the tomogram shown in (A). Forespore membrane is shown in green and mother cell membrane in yellow and both sides of the engulfing mother cell membrane are indicated by blue and maroon asterisks respectively. Scale bar for (A): 200 nm. Scale bars are omitted for annotated panels that are shown in perspective mode.
Figure 4—figure supplement 4
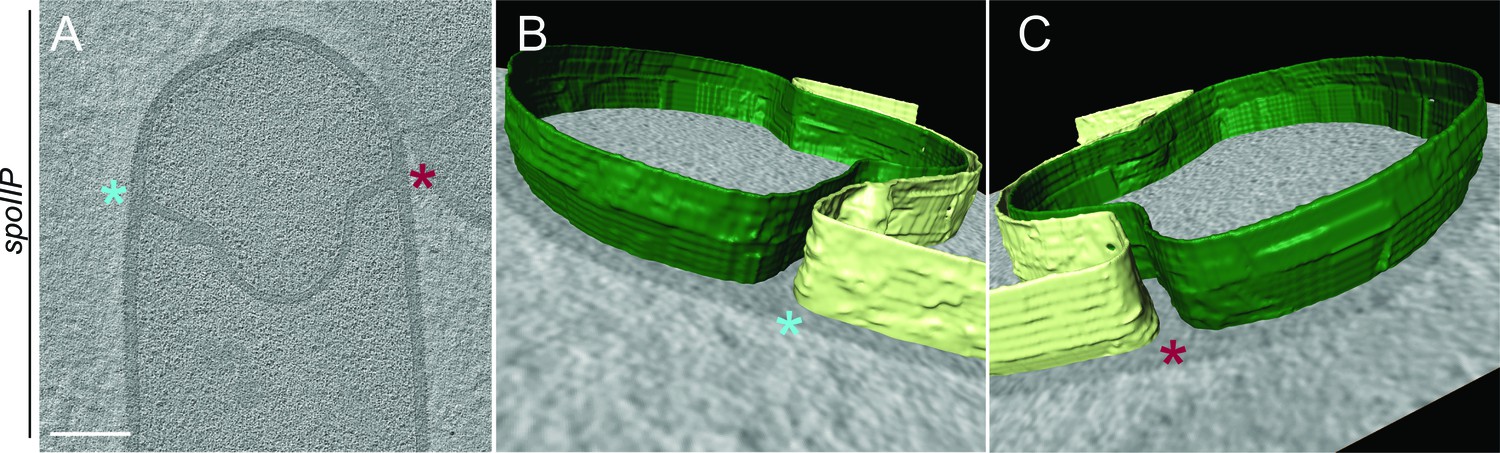
Membrane architecture in spoIIP sporangia.
(A) Slice through a cryo-electron tomogram of a spoIIP sporangium. (B,C) Annotation of membranes for the tomogram shown in (A). Forespore membrane is shown in green and mother cell membrane in yellow and both sides of the engulfing mother cell membrane are indicated by blue and maroon asterisks respectively. Scale bar for (A): 200 nm. Scale bars are omitted for annotated panels that are shown in perspective mode.
Figure 4—figure supplement 5
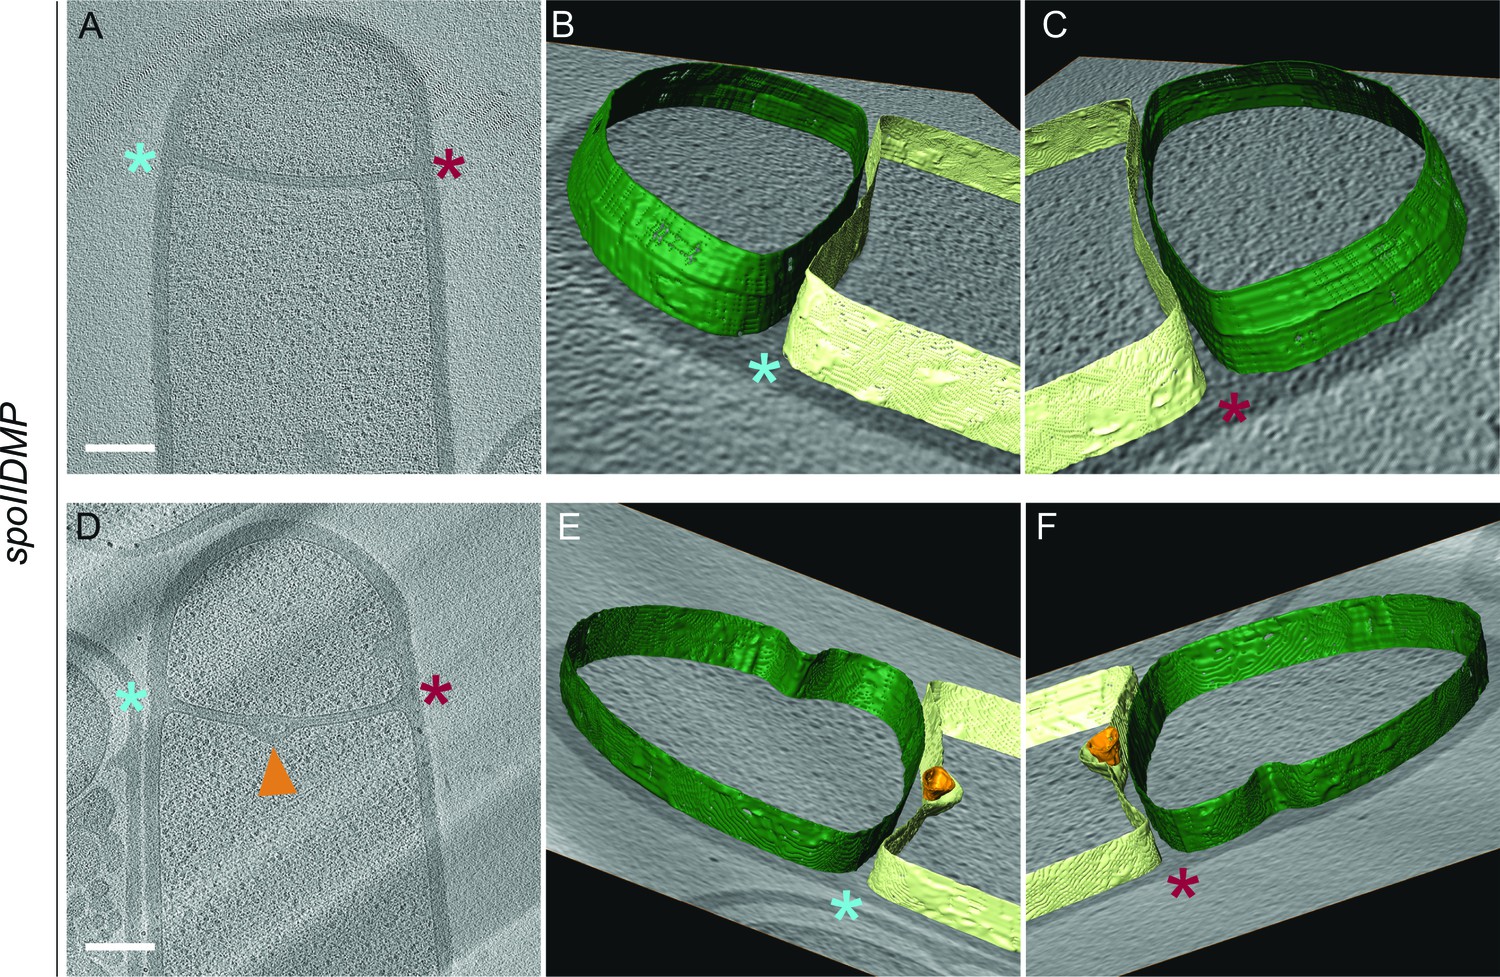
Membrane architecture in spoIIDMP sporangia.
(A,D) Slices through cryo-electron tomograms of spoIIDMP sporangia. (B,C) Annotation of membranes for the tomogram shown in (A). (E,F) Annotation of membranes for the tomogram shown in (D). Forespore membrane is shown in green and mother cell membrane in yellow and both sides of the engulfing mother cell membrane are indicated by blue and maroon asterisks respectively. A bulge in the middle of the septum (orange arrow) in (D) is highlighted in orange in (E) and (F). Scale bars for (A,D): 200 nm. Scale bars are omitted for annotated panels that are shown in perspective mode.
Figure 4—figure supplement 6
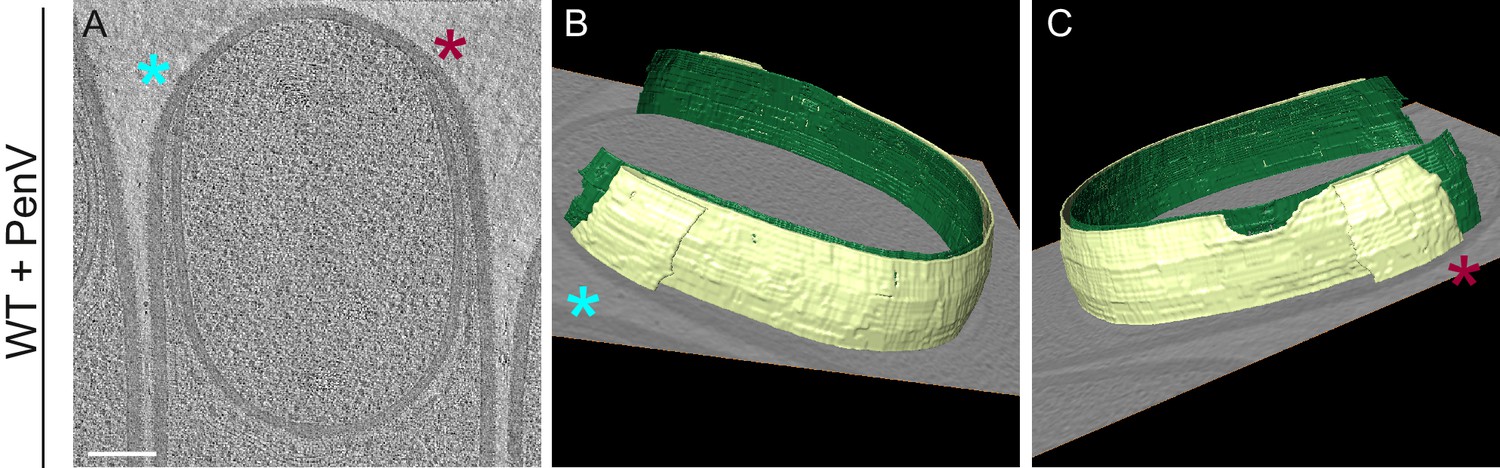
Membrane architecture in antibiotic-treated sporangium.
(A) Slice through a cryo-electron tomogram of a wild type sporangium treated with penicillin V. (B,C) Annotation of membranes for the tomogram shown in (A). Forespore membrane is shown in green and mother cell membrane in yellow and both sides of the engulfing mother cell membrane are indicated by blue and maroon asterisks respectively. Scale bar for (A): 200 nm. Scale bars are omitted for annotated panels that are shown in perspective mode.
Figure 5
Model for septal thinning and membrane migration.
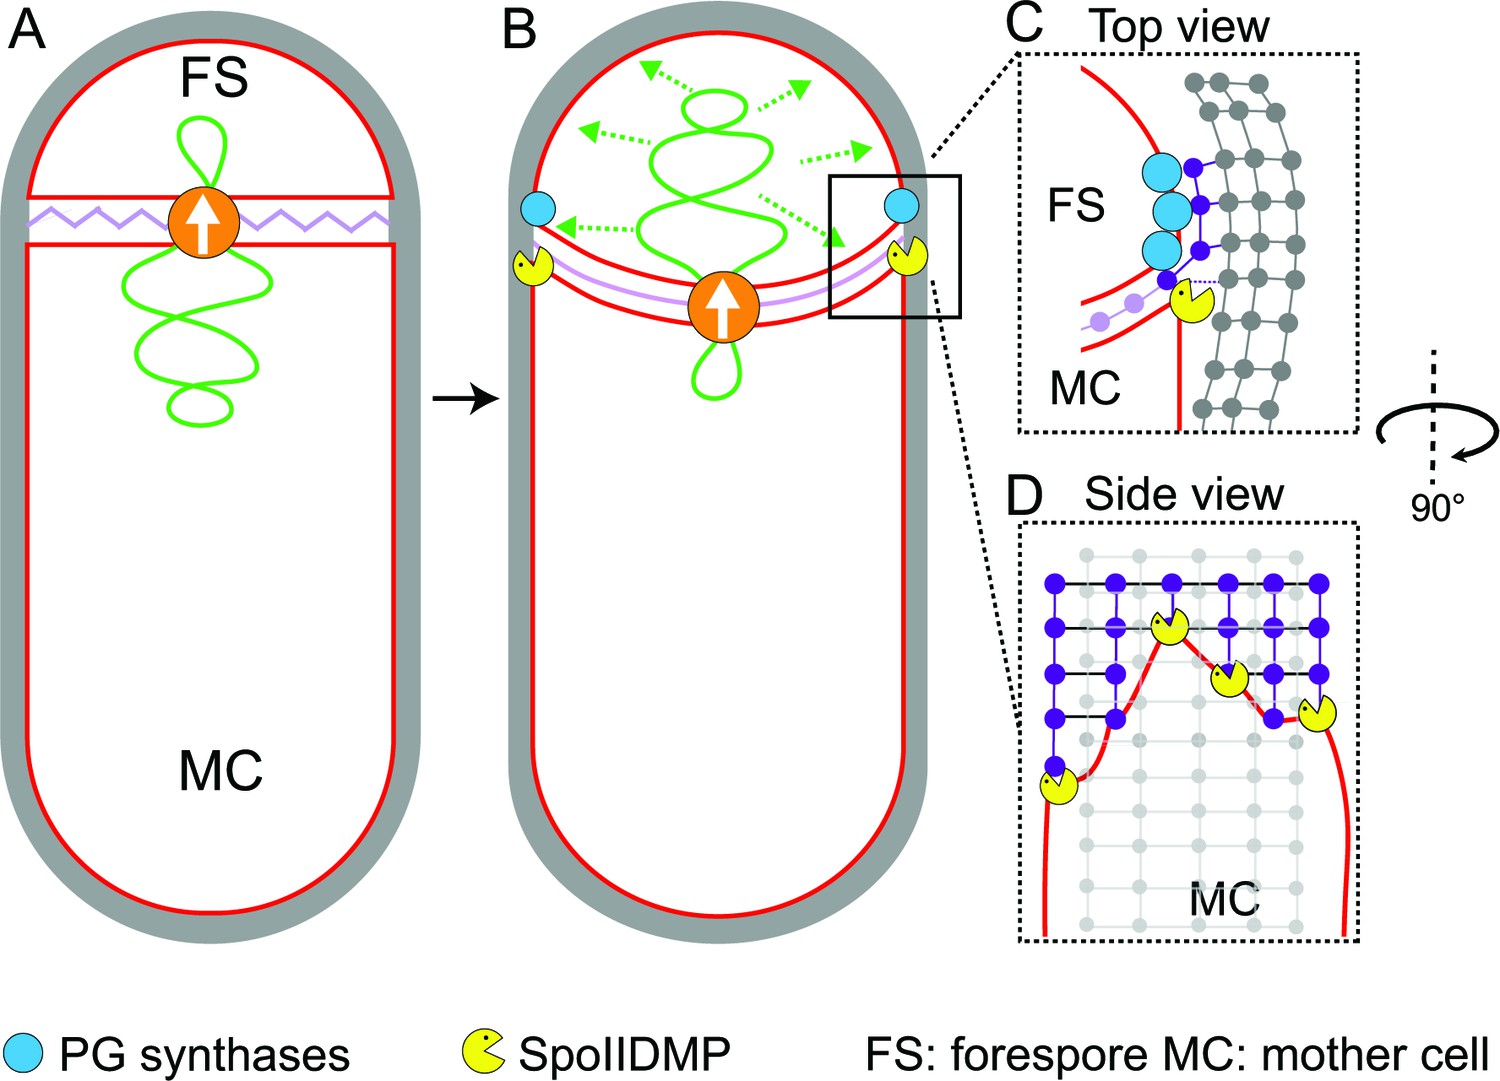
(A) Schematic of a sporulating cell with a flat septum and relaxed septal PG (pink). Membranes (red), lateral PG (gray), SpoIIIE (orange) and forespore chromosome (green) are also highlighted. (B) As SpoIIIE translocates the chromosome to the forespore, the septal PG is stretched which may contribute to septal thinning. (C) Top view of the sporulating cell wherein coordinated PG degradation by DMP (yellow pacman) and PG synthesis by PG biosynthetic enzymes (blue) at the leading edge provide room for the engulfing mother cell membrane migration. (D) Side view depicting the proposed membrane migration model with mother cell membrane (red), PG synthesized ahead of the membrane (purple) and lateral PG (gray) highlighted. During engulfment, DMP complexes present at different locations on the mother cell membrane may move forward by degrading the PG ahead and their rate-limiting activity may lead to the formation of tiny finger-like projections. FS: Forespore; MC: mother cell.
Author response image 1
Videos
Video 1
Movie showing slices through a cryo-electron tomogram of B. subtilis wild type sporangium (flat septum, Stage IIi) shown in Figure 1D.
https://doi.org/10.7554/eLife.45257.007
Video 2
Movie showing slices through a cryo-electron tomogram of B. subtilis wild type sporangium (curved septum, Stage IIii) shown in Figure 1F.
https://doi.org/10.7554/eLife.45257.008
Video 3
Movie showing slices through a cryo-electron tomogram of B. subtilis wild type sporangium (engulfing septum, Stage IIiii) shown in Figure 1H.
https://doi.org/10.7554/eLife.45257.009
Video 4
Time-lapse microscopy of untreated sporulating B. subtilis cells stained with the membrane dye FM4-64.
Pictures were taken every 5 minutes for 2 hours (related to Figure 2—figure supplement 1).
Video 5
Time-lapse microscopy of penicillin V-treated (500 μg/ml) sporulating B. subtilis cells stained with the membrane dye FM4-64.
Pictures were taken every 5 minutes for 2 hours (related to Figure 2—figure supplement 1).
Video 6
Time-lapse microscopy of cephalexin-treated (50 μg/ml) sporulating B. subtilis cells stained with the membrane dye FM4-64.
Pictures were taken every 5 minutes for 2 hours (related to Figure 2—figure supplement 1).
Video 7
Time-lapse microscopy of cephalexin- (50 μg/ml) and penicillin V- (500 μg/ml) treated sporulating B. subtilis cells stained with the membrane dye FM4-64.
Pictures were taken every 5 minutes for 2 hours (related to Figure 2—figure supplement 1).
Video 8
Movie showing slices through a cryo-electron tomogram of spoIIDMP mutant sporangium shown in Figure 3—figure supplement 3C.
https://doi.org/10.7554/eLife.45257.023
Video 9
Movie showing slices through a cryo-electron tomogram of spoIIP mutant sporangium shown in Figure 4H.
https://doi.org/10.7554/eLife.45257.031
Video 10
Movie showing slices through a cryo-electron tomogram of wildtype B. subtilis sporangium treated with cephalexin shown in Figure 4L.
https://doi.org/10.7554/eLife.45257.032Tables
Key resources table
| Reagent type (species) or resource | Designation | Source or reference | Identifiers | Additional information |
|---|---|---|---|---|
| Strain, strain background (Bacillus subtilis PY79) | PY79 | (Youngman et al., 1984) | Tax. ID:1415167 | Wild type |
| Strain, strain background (Bacillus subtilis PY79) | ΔspoIIP::tet | (Frandsen and Stragier, 1995) | KP513 | |
| Strain, strain background (Bacillus subtilis PY79) | spoIID298, spoIIM-mls, ΔspoIIP::tet | (Broder and Pogliano, 2006) | KP4188 | |
| Chemical compound, drug | FM4-64 | Thermo Fisher Scientific | Cat#T13320 | |
| Chemical compound, drug | Bacitracin | MilliporeSigma | Cat#B0125 | Conc. used: 50 μg/ml |
| Chemical compound, drug | Penicillin V | MilliporeSigma | Cat#1504489 | Conc. used: 500 μg/ml |
| Chemical compound, drug | Cephalexin | MilliporeSigma | Cat#C4895 | Conc. used: 50 μg/ml |
| Software, algorithm | JFilament | (Smith et al., 2010) | http://athena.physics.lehigh.edu/jfilament/ | |
| Software, algorithm | IMOD | (Mastronarde, 1997) | http://bio3d.colorado.edu/imod/; RRID: SCR_003297 | |
| Software, algorithm | TomoSegMemTV | (Martinez-Sanchez et al., 2014) | https://sites.google.com/site/3demimageprocessing/tomosegmemtv | |
| Software, algorithm | Amira | Commercial software by Thermo Scientific (formerly FEI) | https://www.fei.com/software/amira-3d-for-life-sciences/; RRID: SCR_014305 | |
| Software, algorithm | SerialEM | (Mastronarde, 2005) | http://bio3d.colorado.edu/SerialEM/ | |
| Software, algorithm | Matlab code to calculate septal distances of sporangia | This paper; Source code 1 | ||
| Software, algorithm | Matlab code to calculate cell length using fluorescence microscopy images | This paper; Source code 2 |
Additional files
-
Source code 1
Matlab code to calculate septal distances of sporangia.
- https://doi.org/10.7554/eLife.45257.034
-
Source code 2
Matlab code to calculate cell length using fluorescence microscopy images.
- https://doi.org/10.7554/eLife.45257.035
-
Transparent reporting form
- https://doi.org/10.7554/eLife.45257.036
Download links
A two-part list of links to download the article, or parts of the article, in various formats.
Downloads (link to download the article as PDF)
Open citations (links to open the citations from this article in various online reference manager services)
Cite this article (links to download the citations from this article in formats compatible with various reference manager tools)
The molecular architecture of engulfment during Bacillus subtilis sporulation
eLife 8:e45257.
https://doi.org/10.7554/eLife.45257


