Binding and transport of D-aspartate by the glutamate transporter homolog GltTk
- University of Groningen, The Netherlands
Figures
Figure 1

Binding and transport of D-aspartate by GltTk.
(A) ITC analysis of D-aspartate binding to GltTk in presence of 300 mM NaCl (Kd of 0.47 ± 0.17 µM). Insets show no D-aspartate binding in absence of NaCl. (B) Sodium and aspartate binding stoichiometry. Logarithmic plot of Kd values (nM) for L-aspartate (black squares; slope is −2.8 ± 0.4; taken for reference from Guskov et al., 2016) and D-aspartate (gray circles; slope is −2.9 ± 0.2) against logarithm of NaCl concentration (mM). The negative slope of the double logarithmic plot (red line) in the limit of low sodium concentrations indicates the number of sodium ions that bind together with aspartate. Error bars represent the ±SD from at least three independent measurements. (C) GltTk transport rate of D-aspartate in presence of 100 mM NaCl. The solid line reports the fit of the Michaelis-Menten model to the data revealing a Km value of 1.1 ± 0.11 µM. Error bars represent the ±SD from duplicate experiments. (D) Determination of Na+ : aspartate coupling stoichiometry in GltTk using equilibrium potential measurement. The uptake or efflux of radiolabeled aspartate was determined by comparing the lumenal radioactivity associated with the liposomes after 2 min of incubation with the radioactivity initially present (Δcpm). Gray circles and black squares show the measurements for D- and L-aspartate, respectively. The solid and dashed lines are the best linear regression for the D- and L-aspartate data, respectively. The 95% confidence interval for D-aspartate is displayed by gray curves. Numbers in parentheses are the coupling stoichiometries expected to give zero flux conditions for each membrane voltage. Error bars represent the ± SD obtained in five replicates.
-
Figure 1—source data 1
Final concentrations of internal and external buffer used in each reversal potential experiment after diluting the proteoliposomes.
Proteoliposomes were loaded with 20 mM HEPES/Tris, pH 7.5, 200 mM NaCl, 10 μM L- or D-aspartate, 50 mM KCl and diluted 20 fold in buffer containing 20 mM HEPES/Tris, pH 7.5, 200 mM NaCl, 35.0/26.4/19.2 mM CholineCl, 0/11.1/18.4 mM KCl in the presence of 3 µM valinomycin.
- https://doi.org/10.7554/eLife.45286.003
Figure 2 with 3 supplements

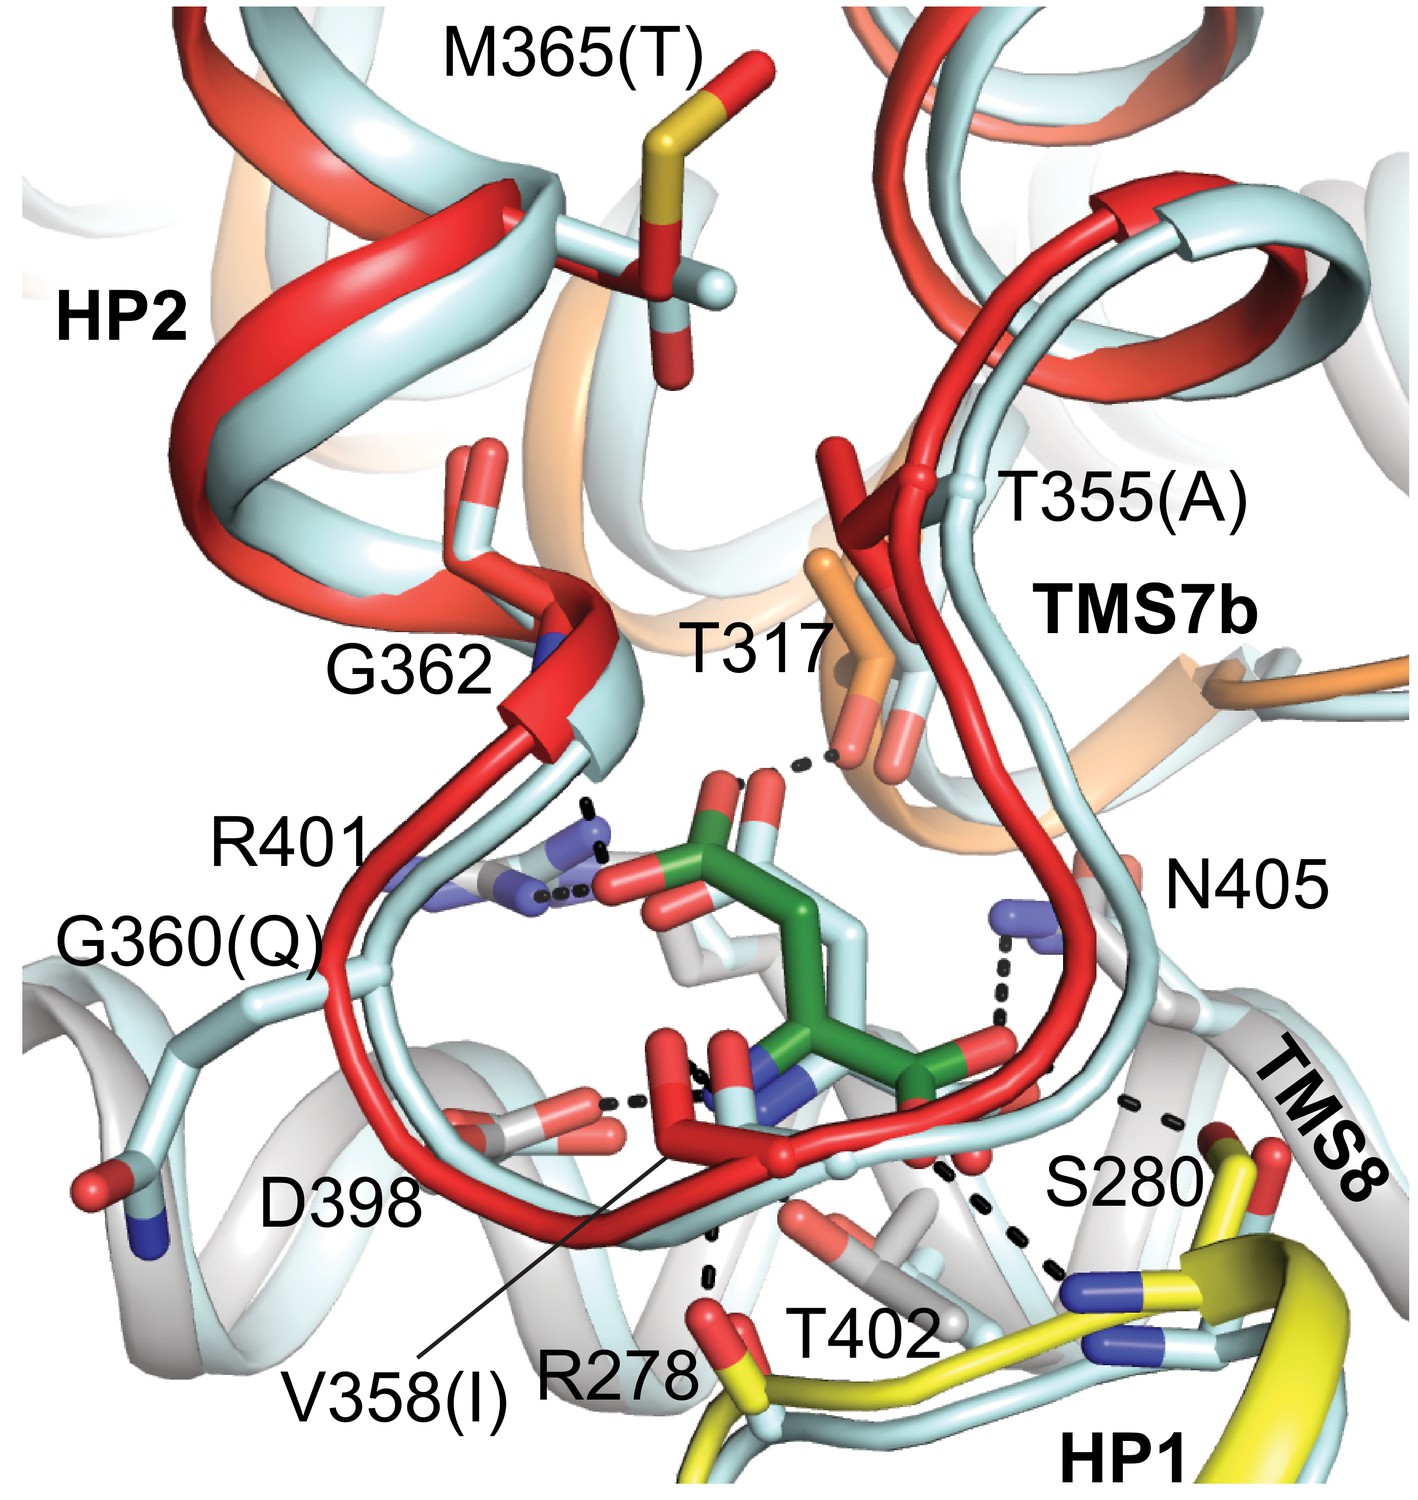
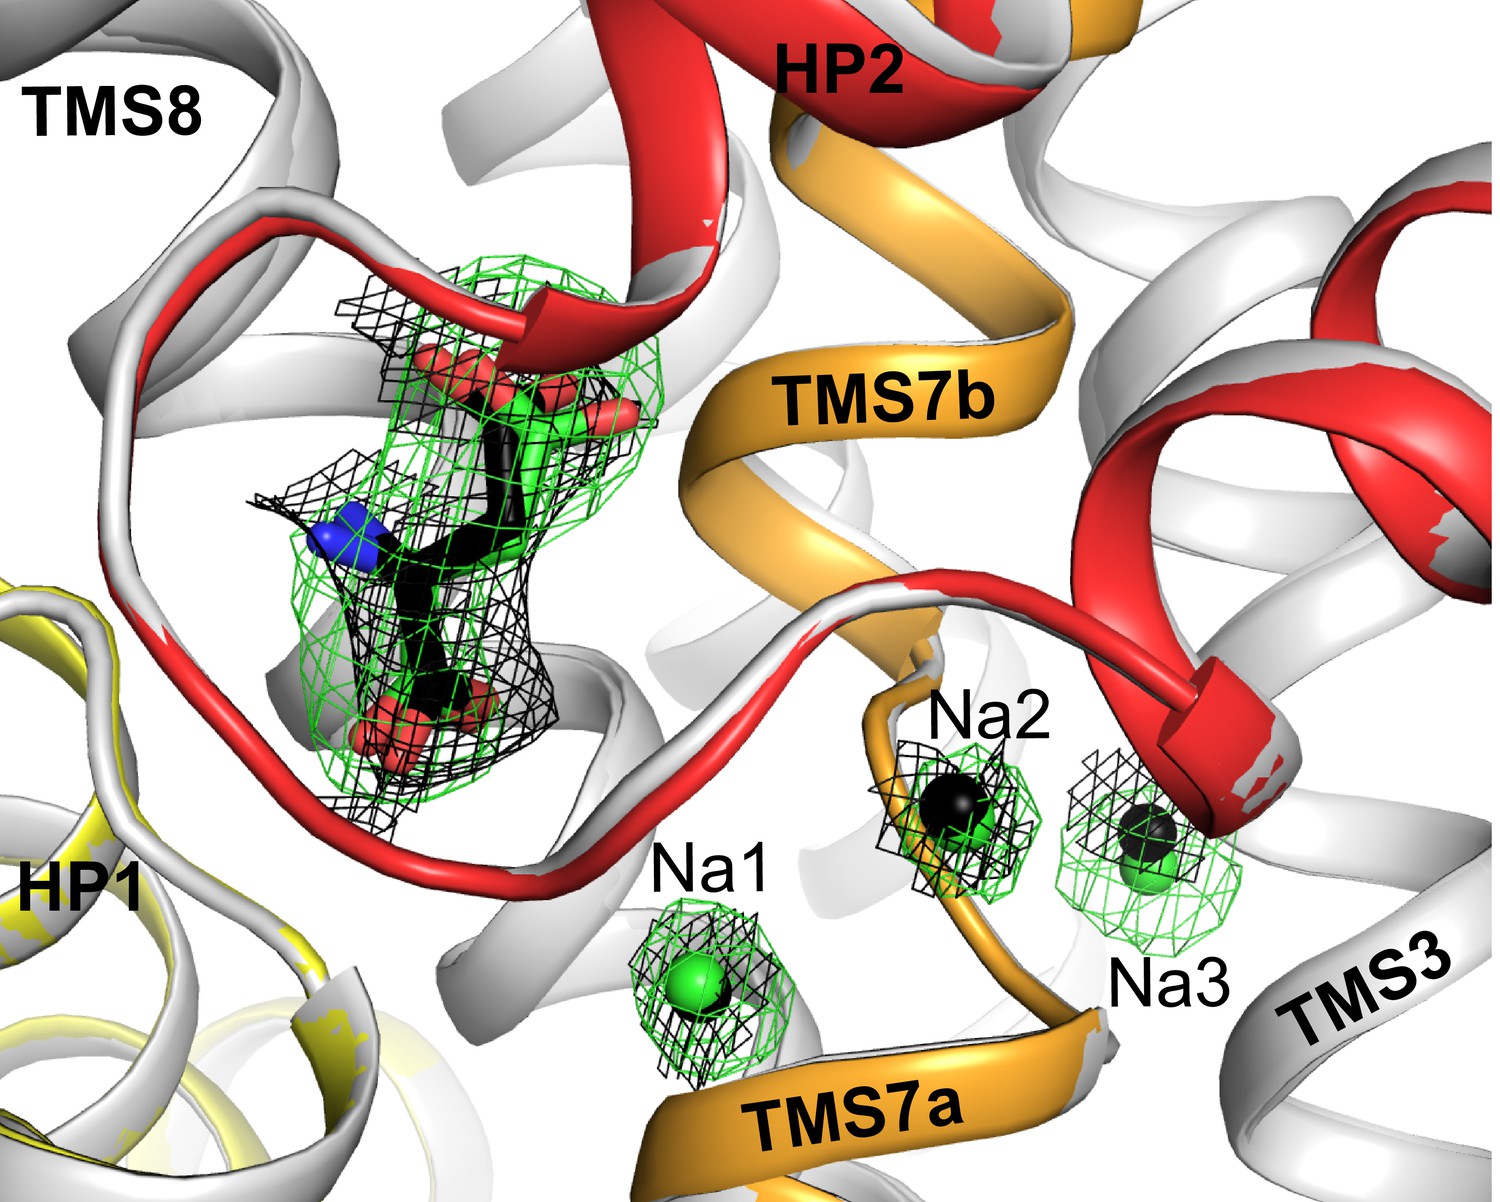
The crystal structure of GltTk with D-aspartate.
The model contains one protein molecule in the asymmetric unit with the substrate present in each protomer of the homotrimer. (A) Cartoon representation of the homotrimer viewed from the extracellular side of the membrane. Lines separate protomers. Each protomer consists of the scaffold domain (pale green) and the transport domain. In the transport domain HP1 (yellow), HP2 (red), TMS7 (orange) are shown. D-aspartate is shown as black sticks and Na+ ions as purple spheres. Like in most GltPh structures a part of the long flexible loop 3–4 between the transport and scaffold domain is not visible. It is indicated by a dashed connection. (B) A single protomer is shown in the membrane plane. (C) Comparison of the substrate-binding site of GltTk in complex with L-aspartate (gray; PDB code 5E9S) and D-aspartate (black). Cartoon representation; substrates and contacting amino acid residues are shown as sticks; hydrogen bonds are shown as dashed lines. The GltTk structures with D- and L-aspartate can be aligned with Cα-RMSD = 0.38 Å for the three transport domains. (D) Composite omit map (cyan mesh) for D-aspartate (contoured at 1σ) and sodium ions (2σ) calculated using simulated annealing protocol in Phenix (Terwilliger et al., 2008). Color coding in all panels is the same.
Figure 2—figure supplement 1
Superposition of substrate-binding sites of L-aspartate bound GltTk and thermostabilized human EAAT1.
All side chains involved in L-aspartate binding are highly conserved and identical in GltTk (PDB code 5E9S; L-aspartate is shown as green sticks) and EAAT1 (PDB code 5LM4; pale cyan). GltTk numbering. Different corresponding side chains of EAAT1 are shown in parentheses. In the GltTk structure (gray cartoon) HP1, HP2 and TMS7 are shown in yellow, red and orange, respectively.
Figure 2—figure supplement 2
Superposition of substrate and sodium binding sites in L-aspartate and D-aspartate bound GltTk.
Substrate and sodium ions are shown as sticks and spheres in green for L-aspartate structure (PDB code 5E9S; gray cartoon) and black for D-aspartate structure (HP1, HP2, TMS7 are shown in yellow, red and orange, respectively). The composite omit map for L-aspartate and sodium ions is shown as green mesh contoured at 3σ; the black mesh represents map for D-aspartate (contoured at 1σ) and corresponding sodium ions (2σ). The composite omit maps are calculated using the simulated annealing protocol in Phenix (Terwilliger et al., 2008).
Figure 2—figure supplement 3
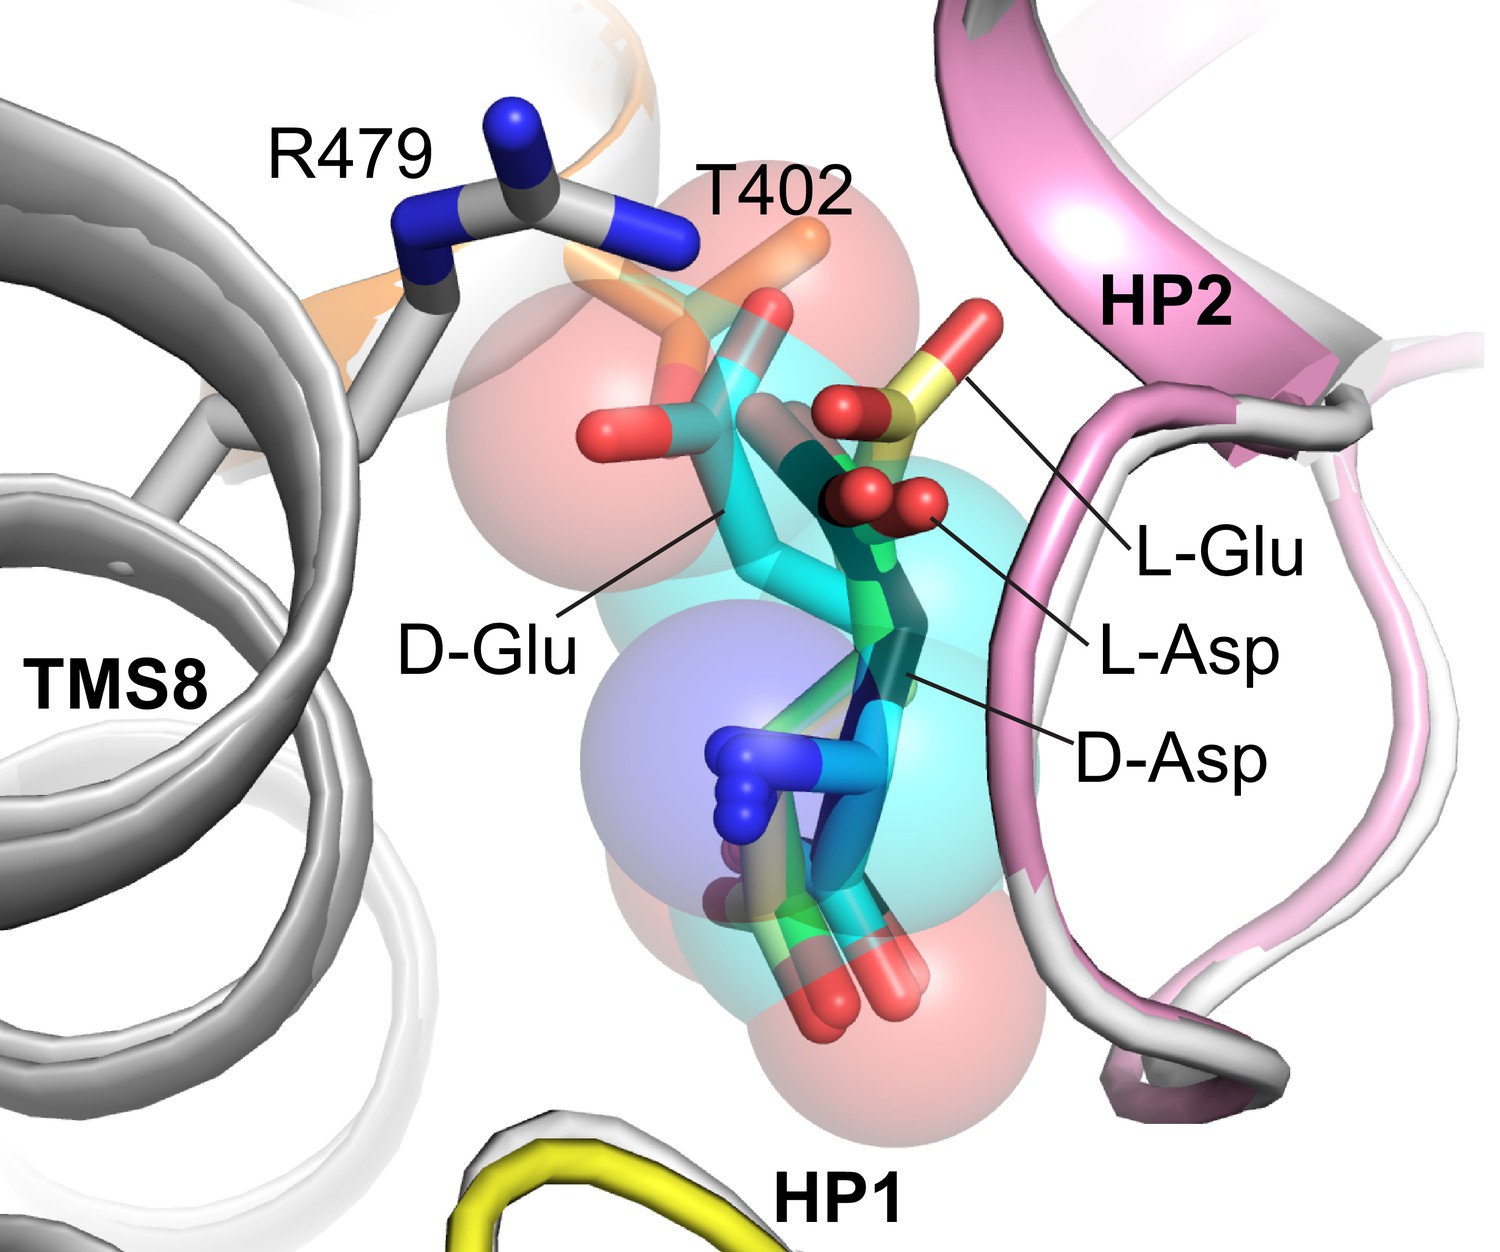
Model of glutamate binding in EAAT1.
Superimposed structures of EAAT1 with L-aspartate (gray cartoon and green sticks; PDB code 5LLU) and GltTk with D-aspartate (black sticks). D-glutamate (cyan sticks and semi-transparent spheres) and L-glutamate (yellow sticks) were modeled in such a way that Cα, amino group and α carboxyl of D- and L-glutamate were superimposed with corresponding atoms of D- or L-aspartate in GltTk and EAAT1 structures, respectively. The model shows that D-glutamate might clash with highly conservative T402 (NMDGT motif of TMS7; T317 in GltTk) and R479 (TMS8; R401 in GltTk) of EAAT1 that both coordinate Cβ carboxyl group of L-aspartate. In contrast L-glutamate might be placed with orientation similar to L-aspartate, preventing clashes. Modeling was performed using COOT (Emsley et al., 2010).
Author response image 1
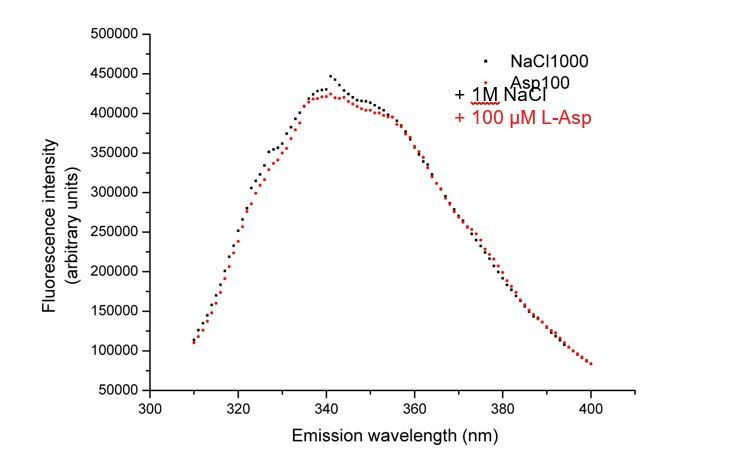
No change in tryptophan fluorescence of GltTk double mutant F275W/W428F observed upon addition of L-aspartate.
Fluorescence emission spectra of the protein after the addition of addition of 1M NaCl (black squares) followed by 100 µM L-aspartate (red circles).
Tables
Table 1
Thermodynamic parameters of D- and L-aspartate binding at high (300 mM) and low (75 mM) Na+ concentration.
https://doi.org/10.7554/eLife.45286.004| Substrate/ Na+ | Kd (µM) | ΔH (cal mol−1) | ΔS (cal mol−1 K−1) |
|---|---|---|---|
| L-aspartate/300 mM NaCl | 0.12 ± 0.04 | −1.61 (±0.08) x 104 | −22.1 ± 2.2 |
| D-aspartate/300 mM NaCl | 0.47 ± 0.17 | −1.48 (±0.11) x 104 | −20.6 ± 3.6 |
| L-aspartate/75 mM NaCl | 1.04 ± 0.39 | −1.22 (±0.13) x 104 | −13.2 ± 5.2 |
| D-aspartate/75 mM NaCl | 5.66 ± 1.59 | −1.14 (±0.41) x 104 | −14.3 ± 14.3* |
-
*At low Na+ concentrations high errors prevented accurate measuring of ΔS values.
Key resources table
| Reagent type (species) or resource | Designation | Source or reference | Identifiers | Additional information |
|---|---|---|---|---|
| Gene | TK0986 | UniProt database | Q5JID0 | |
| Strain, strain background (E. coli) | MC1061 | Casadaban and Cohen, 1980 | ||
| Biological sample (Thermococcus kodakarensis KOD1) | ATCC BAA-918/JCM 12380/KOD1 | |||
| Recombinant DNA reagent | pBAD24-GltTk-His8 | Jensen et al., 2013 | Expression plasmid for C-terminally His8-tagged GltTk. | |
| Chemical compound | D-Asp | Sigma-Aldrich | 219096–25G | ReagentPlus99% |
| Software | Origin 8 | OriginLab | ||
| Other | GltTk-D-aspartate coordinate file and structural factors | This paper | accession number PDB ID code 6R7R | Crystal structure of the glutamate transporter homologue GltTk in complex with D-aspartate |
Table 2
Data collection and refinement statistics.
https://doi.org/10.7554/eLife.45286.009| GltTk D-Asp | |
|---|---|
| Data collection | |
| Space group | P3221 |
| Cell dimensions | |
| a, b, c (Å) | 116.55, 116.55, 314.77 |
| α, β, γ (°) | 90.00, 90.00 120.00 |
| Resolution (Å) | 48.06-2.80 (2.87-2.80)* |
| Rmeas | 0.11 (>1) |
| CC1/2 | 99.9 (11.7) |
| I / σI | 8.40 (0.98) |
| Completeness (%) | 99.3 (98.9) |
| Redundancy | 5 (4) |
| Refinement | |
| Resolution (Å) | 2.80 |
| No. reflections | 301,077 |
| Rwork/Rfree (%)s | 23.4/27.2 |
| No. of atom | |
| Protein | 9262 |
| PEG/detergent | 181/33 |
| Ligand/ion | 27/9 |
| Water | - |
| B-factors | |
| Protein | 127 |
| PEG/detergent | 147/174 |
| Ligand/ion | 114/117 |
| Water | - |
| R.m.s. deviations | |
| Bond lengths (Å) | 0.008 |
| Bond angles (°) | 1.162 |
-
*Values in parentheses are for the highest-resolution shell.
Additional files
-
Transparent reporting form
- https://doi.org/10.7554/eLife.45286.010
Download links
A two-part list of links to download the article, or parts of the article, in various formats.
Downloads (link to download the article as PDF)
Open citations (links to open the citations from this article in various online reference manager services)
Cite this article (links to download the citations from this article in formats compatible with various reference manager tools)
Binding and transport of D-aspartate by the glutamate transporter homolog GltTk
eLife 8:e45286.
https://doi.org/10.7554/eLife.45286


