Genetic transformation of the dinoflagellate chloroplast
- University of Cambridge, United Kingdom
- King Abdullah University of Science and Technology (KAUST), Saudi Arabia
- Sunway University, Malaysia
- University College London, United Kingdom
Figures
Figure 1
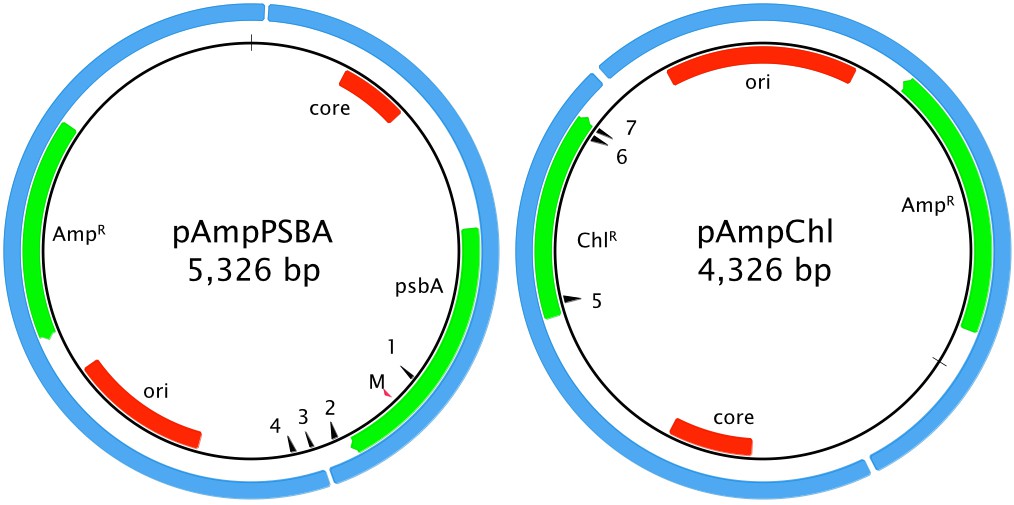
Artificial minicircle design.
Left, pAmpPSBA. Right, pAmpChl. Origins of replication (ori for E. coli plasmid, core region for A. carterae minicircle) are shown in red. Protein-coding genes (encoding ampicillin resistance, chloramphenicol resistance or PsbA) are shown in green. The blue shows the original source of of the genetic material (E. coli plasmid and A. carterae minicircle). The red arrow showing the position of the mutation in psbA that confers resistance to atrazine is marked with ‘M’. Primer sites pAmpPSBA 1: MC-pG-F-II, 2: MC-pG-F, 3: MC-pG-R-II, 4: MC-pG-R; pAmpChl: 5: CAT-R, 6: CAT-F, 7: CAT-FSS. CAT-F-Nest and CAT-R-Nest are immediately adjacent to CAT-F and CAT-R, respectively.
Figure 2
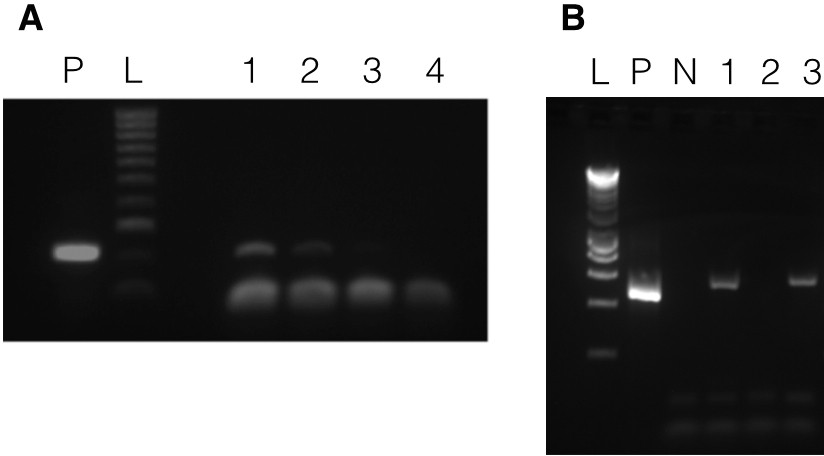
Presence of vectors in transformed A. carterae.
Panel A shows results with pAmpPSBA. DNA was isolated from cells putatively transformed with pAmpPSBA, and a PCR reaction performed to amplify a ~ 200 bp region in the plasmid. Lane P, positive control (PCR with plasmid only), Lane L, Hyperladder 100 bp (Bioline) marker, Lane 1, transformed cell line A5.1 (strong band), Lane 2, transformed cell line A5.2 (faint band), Lane 3, transformed cell line A5.1 but without cells being broken open prior to DNA extraction (no band), Lane 4, wild type (i.e. untransformed cells, no band)). Panel B shows results with pAmpChl. DNA was isolated from cells putatively transformed with pAmpChl, and a PCR reaction performed to amplify a 580 bp region in the plasmid. Lane L, Hyperladder 1 kb (Bioline) marker, Lane P, positive control (PCR with plasmid only), Lane N, negative control (no template), Lane 1, transformed cell line C1A.1, Lane 2, transformed cell line C1A.2, Lane 3, transformed cell line C1A.3. Apparent differences in mobility between bands in lanes P, 1 and 3 are due to gel loading.
Figure 3

Relative copy number of psbA and pAmpChl minicircles.
DNA was isolated from cells transformed with pAmpChl, and a PCR reaction performed to amplify either psbA or CAT. Lane L, Hyperladder 1 kb (Bioline) marker, Lane 1, wildtype cells (amplifying psbA only), Lane 2 pAmpChl line (amplifying psbA (top band) and CAT (lower band)).
Figure 4
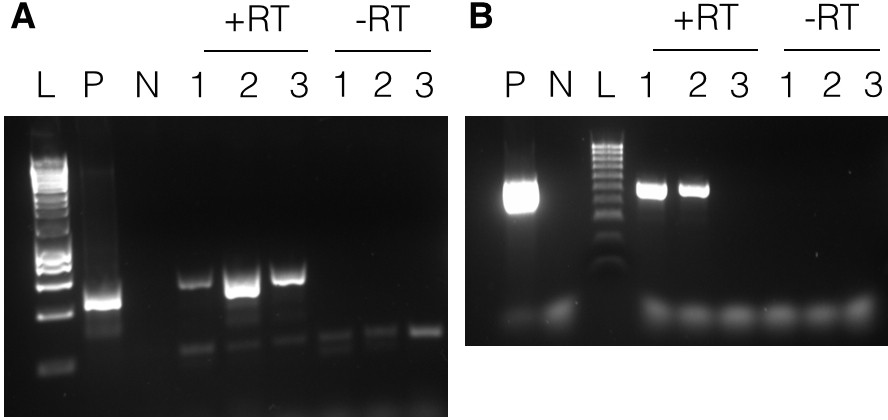
Transcription of minicircles.
Panel A shows results with pAmpPSBA. RNA was extracted from cells putatively transformed with pAmpPSBA, and RT-PCR performed to amplify a ~ 500 bp region. Lane L, Hyperladder 1 kb (Promega), Lane P, positive control (PCR from plasmid DNA), Lane N, negative control (no template), Lanes 1–3 show products with RNA from three different pAmpPSBA-transformed cell lines (A6.1, A6.2 and A6.3) shown with reverse transcriptase (+RT) and without (-RT). Panel B shows results with pAmpChl. RNA was extracted from cells putatively transformed with pAMPChl, and RT-PCR performed to amplify a 580 bp region. Lane L, Hyperladder 100 bp (Bioline), Lane P, positive control (PCR from plasmid DNA), Lane N, negative control (no template), Lanes 1–3 show products with three different pAmpChl-transformed cell lines (C3.1, C3.2 and C3.3) with reverse transcriptase (+RT) or without (-RT).
Figure 5
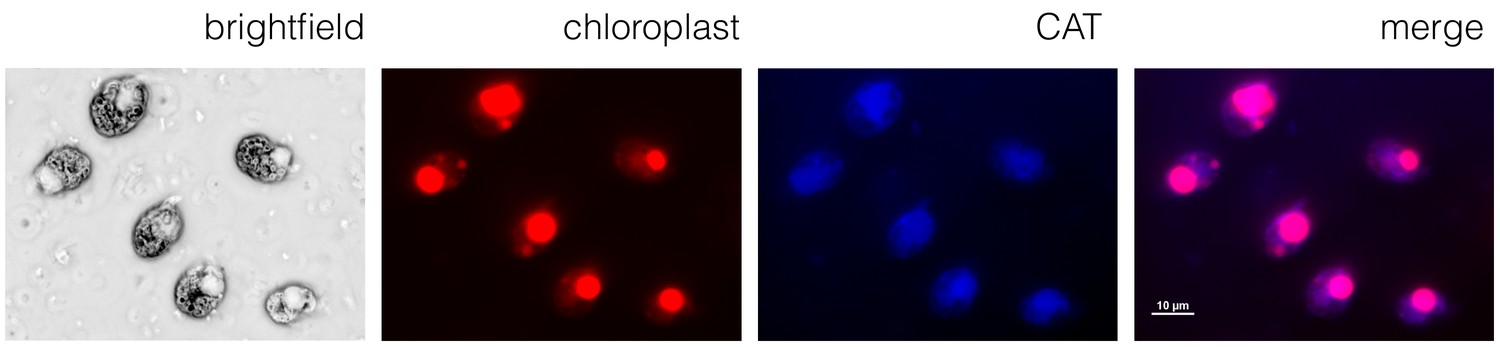
A chloroplast localization for chloramphenicol acetyl transferase.
Immunofluorescence microscopy using the A. carterae pAmpChl line. Cells (brightfield) showed significant autofluorescence in the chloroplast (red). A primary antibody specific for CAT with a secondary Alexa Fluor 405 antibody (blue) showed localization of CAT to the chloroplast (indicated by the overlay image labeled merge).
Figure 6

Long-term stability of transformation.
DNA was isolated from cells putatively transformed with pAmpPSBA or pAmpChl and maintained under selection 3 months (Experiments A9 and C4). Panel A shows PCR to amplify a 200 bp region of pAmpPSBA. Lane L, Hyperladder 100 bp (Bioline) marker, Lane N, untransformed cells, Lane 1, transformed cell line A9.1, Lane 2, transformed cell line A9.2, Lane 3, transformed cell line A9.3. Panel A shows PCR to amplify a 560 bp region of pAmpChl. Lane L, Hyperladder 100 bp (Bioline) marker, Lane P, positive control (pAmpChl), Lane N, untransformed cells, Lane 1, transformed cell line C4.1, Lane 2, transformed cell line C4.2, Lane 3, transformed cell line C4.3.
Tables
Table 1
Biolistic transformation of A. carterae with pAmpPSBA.
Each experiment was carried out in triplicate, thus producing three potentially transformed lines. In addition, one line of cells was subjected to biolistic bombardment, but without the pAmpPSBA (‘untransformed’). Note that cultures from experiments 5–9 were harvested for genetic analysis, and thus the listed survival time is the day of harvesting, labeled with *.
| Experiment | Rupture disk (p.s.i.) | Atrazine concentration (µg ml−1) | Survival untransformed (days) | Mean survival pAmpPSBA (days) |
|---|---|---|---|---|
| A1 | 1100 | 2.5 | 13 | 13 |
| A2 | 1350 | 2.5 | 13 | 16 |
| A3 | 1350 | 2.5 | 13 | 15 |
| A4 | 1550 | 2.5 | 13 | 17 |
| A5 | 1550 | 2.5 | 12 | 20* |
| A6 | 1550 | 2 | 7* | 7* |
| A7 | 1550 | 2 | 13 | 13* |
| A8 | 1550 | 2 | 12 | 15* |
| A9 | 1550 | 1 | 3 months* | 3 months* |
Table 2
Biolistic transformation of A. carterae with pAmpChl.
Each experiment was carried out in triplicate, thus producing three potentially transformed lines. In addition, one line of cells was subjected to biolistic bombardment, but with gold particles lacking the pAmpChl (‘untransformed’). For experiment 1, cells from each plate (three shot with gold particles carrying the plasmid and one with gold particles only) were divided into five separate samples, each incubated at a different chloramphenicol concentration. Note that cultures from experiments C1A, C2, and C3, were harvested for genetic analysis, and thus the listed survival time of lines still alive at that point is the day of harvesting, labeled with *. Experiment C4 was still alive at 57 weeks and is thus marked with +.
| Experiment | Rupture disk (p.s.i.) | Chloramphenicol concentration (µg ml−1) | Survival untransformed (days) | Mean survival pAmpChl (days) |
|---|---|---|---|---|
| C1A | 1550 | 10 | 15 | 35* |
| C1B | 1550 | 20 | 15 | 17 |
| C1C | 1550 | 30 | 15 | 15 |
| C1D | 1550 | 40 | 15 | 15 |
| C1E | 1550 | 50 | 13 | 15 |
| C2 | 1550 | 10 | 13 | 13* |
| C3 | 1550 | 10 | 14* | 14* |
| C4 | 1550 | 20 | 16 | 57 weeks + |
Key resources table
| Reagent type (species) or resource | Designation | Source or reference | Identifiers | Additional information |
|---|---|---|---|---|
| Cell line (Amphidinium carterae) | A. carterae CCMP1314 | Culture Collection of Marine Phytoplankton | CCMP1314 | |
| Genetic reagent (vector) | pAmpChl | this paper, synthesized by GeneArt | Full sequence provided in supplemental data. | |
| Genetic reagent (vector) | pAmpPSBA | this paper | Full sequence provided in supplemental data. | |
| Antibody | Rabbit anti-Chloramphenicol-acetyl-transferase, polyclonal | Antibodies-Online | Antibodies-Online Cat# ABIN285051, RRID:AB_10781219 | 1:500 in f/2 medium with 5% BSA, 1 hr. |
| Antibody | Goat anti-Rabbit IgG (H + L) Cross-Adsorbed Secondary Antibody, Alexa Fluor 405, polyclonal | ThermoFisher | Thermo Fisher Scientific Cat# A-31556, RRID:AB_221605 | 1:1000 in f/2 medium with 5% BSA, 1 hr. |
| Commercial assay or kit | DNAdelTM Gold Carrier Particles Optimized for Plasmid Delivery | Seashell Technology | Seashell Technology Cat# S550d |
Additional files
-
Supplementary file 1
Primer sequences and vector sequences.
- https://doi.org/10.7554/eLife.45292.010
-
Transparent reporting form
- https://doi.org/10.7554/eLife.45292.011
Download links
A two-part list of links to download the article, or parts of the article, in various formats.
Downloads (link to download the article as PDF)
Open citations (links to open the citations from this article in various online reference manager services)
Cite this article (links to download the citations from this article in formats compatible with various reference manager tools)
Genetic transformation of the dinoflagellate chloroplast
eLife 8:e45292.
https://doi.org/10.7554/eLife.45292


