Mapping sequence structure in the human lateral entorhinal cortex
- Max Planck Institute for Human Cognitive and Brain Sciences, Germany
- Norwegian University of Science and Technology, Norway
- Donders Institute for Brain, Cognition and Behaviour, Radboud University, Netherlands
- Ruhr University Bochum, Germany
Figures
Figure 1 with 2 supplements
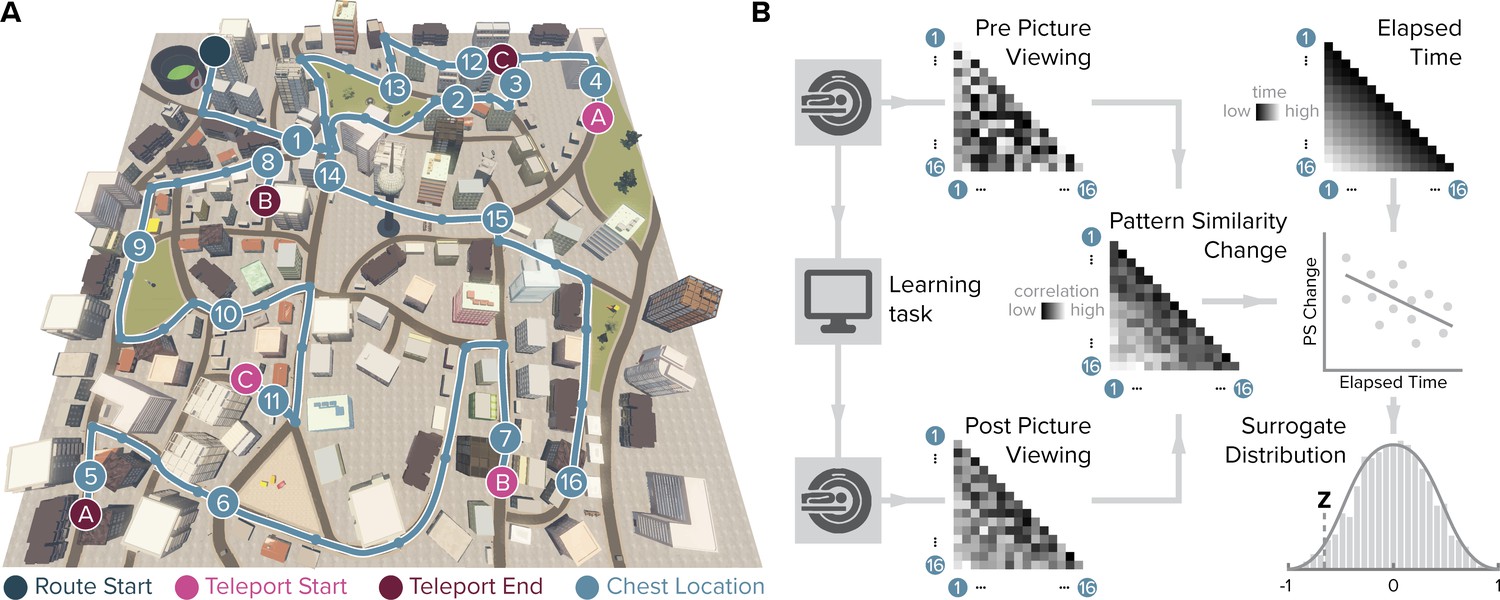
Design and analysis logic.
(A) During the spatio-temporal learning task, which took place in between two identical runs of a picture viewing task (Figure 1—figure supplement 1), participants repeatedly navigated a fixed route (blue line, mean ± standard deviation of median time per lap 264.6 ± 47.8 s) through the virtual city along which they encountered objects hidden in chests (numbered circles) (Deuker et al., 2016). Temporal (median time elapsed) and spatial (Euclidean and geodesic) distances between objects were dissociated through the use of three teleporters (lettered circles) along the route (Figure 1—figure supplement 2), which instantaneously changed the participant’s location to a different part of the city. (B) In the picture viewing tasks, participants viewed randomly ordered images of the objects encountered along the route while fMRI data were acquired. We quantified multi-voxel pattern similarity change between pairwise object comparisons from before to after learning the temporal and spatial relationships between objects in subregions of the entorhinal cortex. We tested whether pattern similarity change reflected the structure of the event sequence, by correlating it with the time elapsed between objects pairs (top right matrix shows median elapsed time between object encounters along the route averaged across participants). For each participant, we compared the correlation between pattern similarity change and the prediction matrix to a surrogate distribution obtained via bootstrapping and used the resulting z-statistic for group-level analysis (see Materials and methods).
Figure 1—figure supplement 1

Overview of experimental design.
Participants viewed object images in random order while undergoing fMRI before and after learning the temporal and spatial relationships between these objects. The order and timing of picture presentations was held identical in both sessions to assess changes in the similarity of object representations as measured by the difference in similarity of multi-voxel activity patterns (see Materials and methods). In between the two picture viewing tasks, participants acquired knowledge about the spatial and temporal positions of objects along a route through the virtual city. Initially, the route was marked by traffic cones, but in later laps participants navigated the route without guidance. Participants encountered chests along the route and were instructed to open the chests by walking into them. Each chest contained a different object, which was displayed on a black screen upon opening the chest. Crucially, the route featured three teleporters that instantly moved participants to a different part of the city where the route continued (Figure 1). This manipulation enabled us to dissociate the temporal and Euclidean spatial distances between object pairs (Figure 1—figure supplement 2). After the second picture viewing task, participants were asked to freely recall all objects encountered along the route in the order in which they came to mind. Further, participants’ memory for temporal and spatial relationships between object pairs was assessed. Here, participants adjusted a slider to indicate whether they remembered object pairs to be close together or far apart. Temporal and spatial relations were judged in separate trials. The results of these memory tests are reported in detail in Deuker et al. (2016).
Figure 1—figure supplement 2
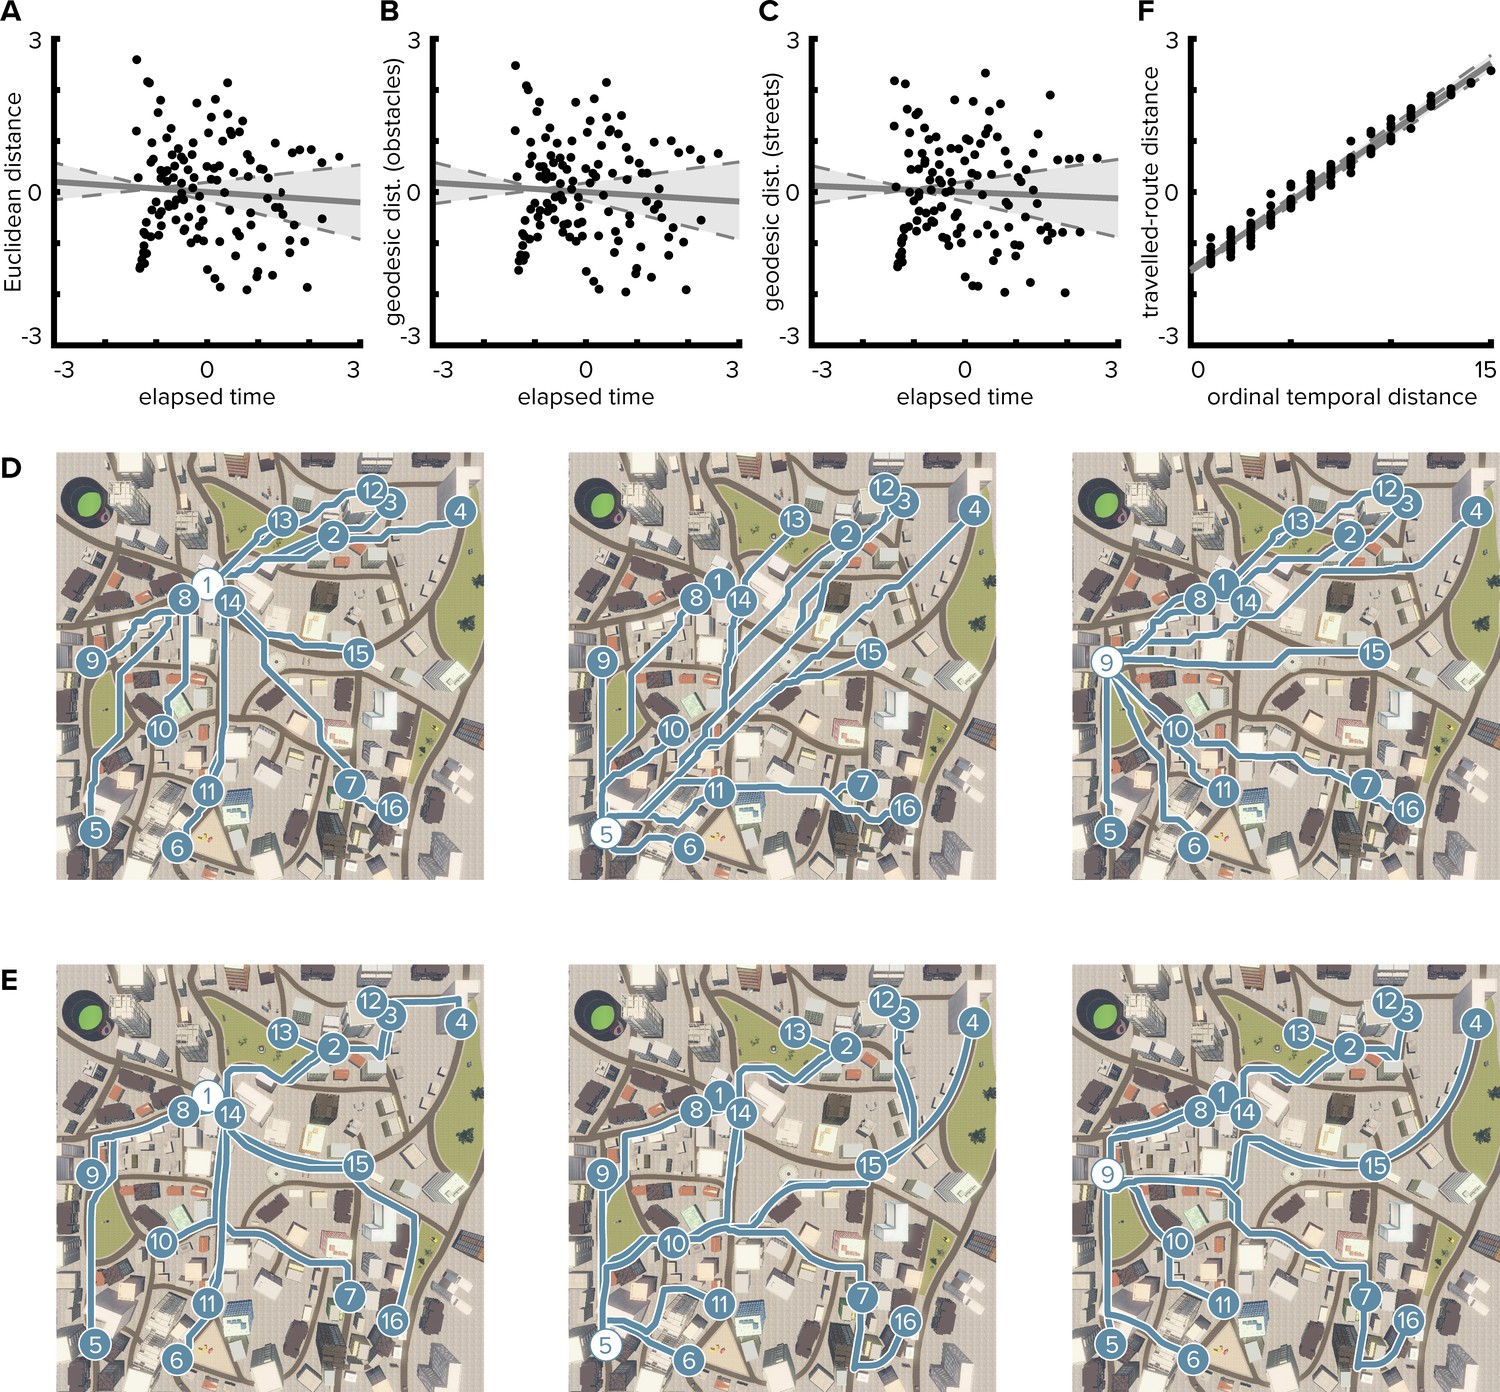
Temporal distances are not correlated with Euclidean or geodesic spatial distances.
(A) Pairwise temporal and Euclidean spatial distances between objects are uncorrelated (Pearson r = −0.068; bootstrapped 95% confidence interval: −0.24, 0.12; p=0.462). Median times elapsed between object encounters were z-scored and then averaged across participants. Spatial distances were defined as z-scored Euclidean distances between object positions. When correlating individual median times elapsed with spatial distances, the correlation between the dimensions was not significant in any of the participants (mean ± standard deviation of Pearson correlation coefficients r = −0.068 ± 0.006, all p≥0.378). (B, C) Likewise, temporal distances were not correlated with geodesic distances between object positions. Geodesic distances were quantified based on the lengths of the shortest paths between object positions allowing navigation of all locations not obstructed by buildings and other objects (B, Pearson r = −0.061, p=0.505; CI: −0.23, 0.14; individual Pearson r = −0.061 ± 0.006, all p≥0.414) or on the city’s street network only (C, Pearson r = −0.041, p=0.653; CI: −0.22, 0.15; individual Pearson r = −0.041 ± 0.006, all p≥0.552). (D, E) Illustrations of geodesic distances based on shortest paths (blue lines) from three object positions (white circles) to all other object positions (blue circles). Shortest paths between positions were calculated using all unobstructed positions (D) or the street network (E), respectively. (F) Because both temporal distances and traveled-route distances increase monotonically with the progression of the route, ordinal temporal distances and traveled-route distances between object pairs were closely related (Spearman r = 0.986, p<0.001; CI: 0.98, 0.99; individual Spearman r = 0.986 ± 0.003, all p<0.001). Circles in (A), (B), (C and F) indicate pairwise object comparisons; solid line shows least squares line; dashed lines and shaded region highlight bootstrapped confidence intervals.
Figure 2 with 4 supplements
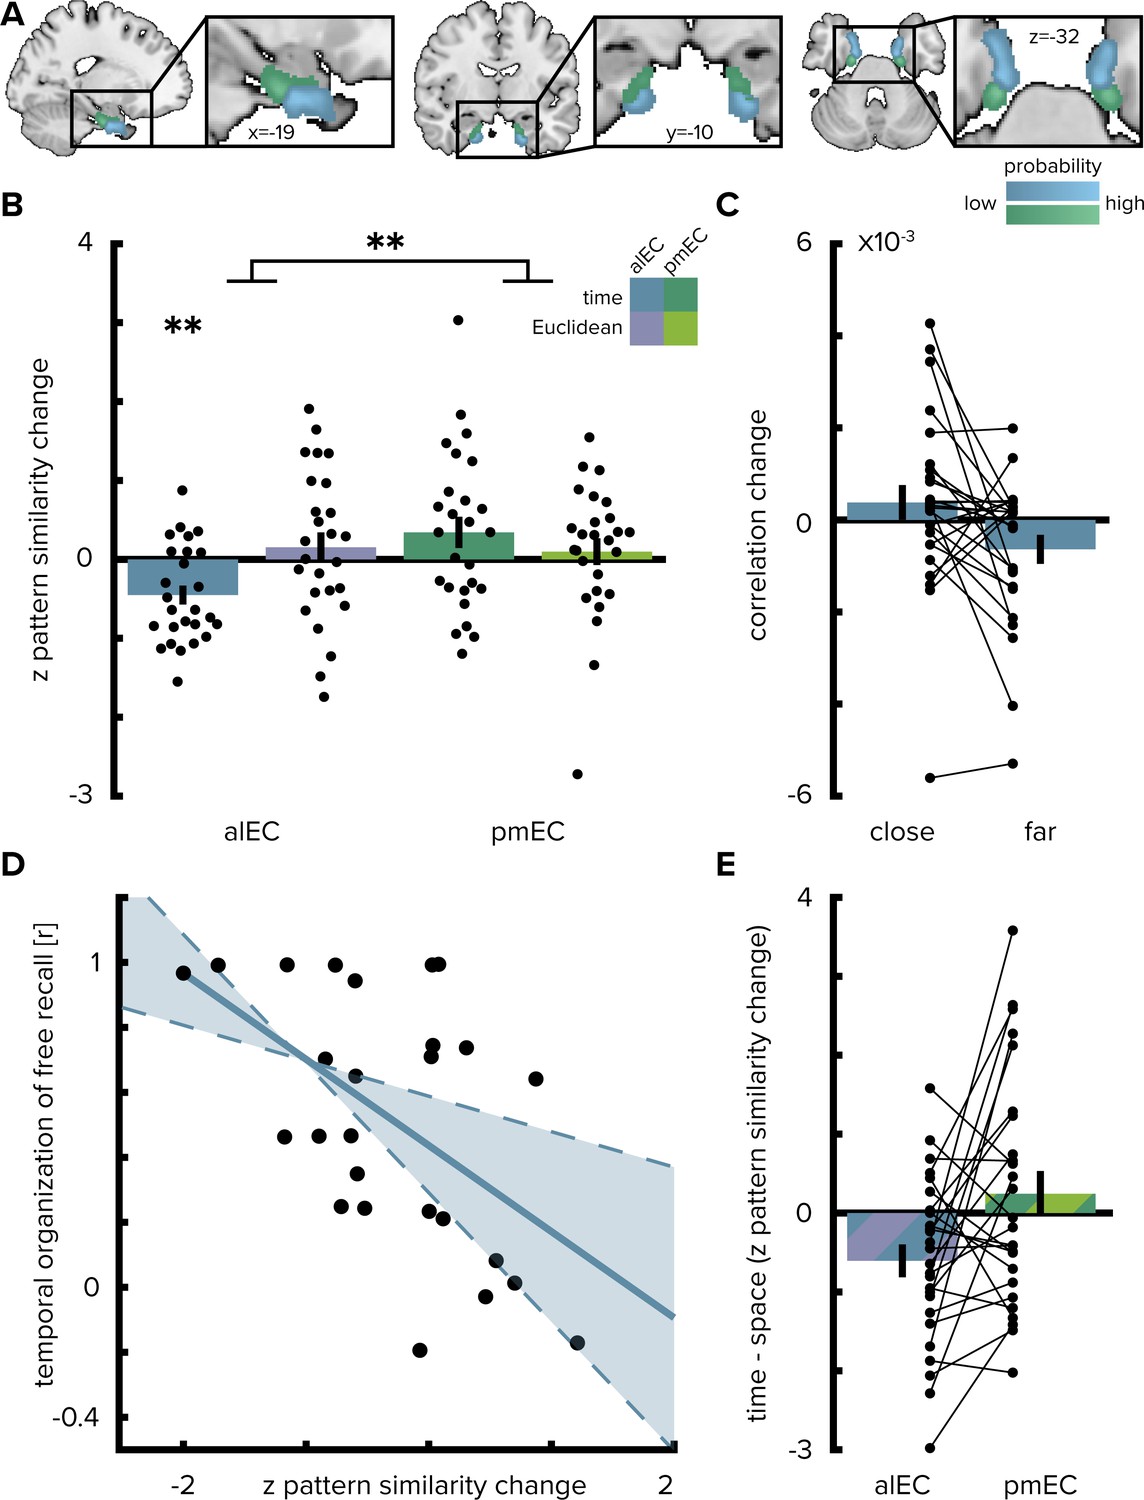
Temporal mapping in alEC.
(A) Entorhinal cortex subregion masks from Navarro Schröder et al. (2015) were moved into subject-space and intersected with participant-specific Freesurfer parcellations of entorhinal cortex. Color indicates probability of voxels to belong to the alEC (blue) or pmEC (green) subregion mask after subject-specific masks were transformed back to MNI template space for visualization. (B) Pattern similarity change in the alEC correlated with the temporal structure of object relationships, defined by the median time elapsed between object encounters, as indicated by z-statistics significantly below 0. A permutation-based two-way repeated measures ANOVA further revealed a significant interaction highlighting a difference in mapping temporal and Euclidean spatial distances between alEC and pmEC. (C) To break down the negative correlation of alEC pattern similarity change and temporal distance shown in (B), pattern similarity change is plotted separately for object pairs close together or far apart in time along the route based on a median split of elapsed time between object encounters. (D) Pattern similarity change in alEC was negatively related to temporal relationships independent of objects encountered in direct succession (Figure 2—figure supplement 1A). The magnitude of this effect correlated significantly with participants’ free recall behavior. The temporal organization of freely recalled objects was assessed by calculating the absolute difference in position for all recalled objects and correlating this difference with the time elapsed between encounters of object pairs along the route. Solid line shows least squares line; dashed lines and shaded region highlight bootstrapped confidence intervals. (E) To illustrate the interaction effect shown in (B), the difference in the relationship between temporal and spatial distances to pattern similarity change is shown for alEC and pmEC. Negative values indicate stronger correlations with temporal compared to spatial distances. Bars show mean and S.E.M with lines connecting data points from the same participant in (C and E). **p<0.01.
-
Figure 2—source data 1
Z-values of correlations between pattern similarity change in the entorhinal subregions and temporal and Euclidean spatial distances as shown in panel B.
- https://doi.org/10.7554/eLife.45333.010
-
Figure 2—source data 2
Pattern similarity changes in alEC for object pairs separated by low and high temporal distances as shown in panel C.
- https://doi.org/10.7554/eLife.45333.011
-
Figure 2—source data 3
Z-values of correlations between alEC pattern similarity change and temporal distances without comparisons of objects encountered in direct succession along the route and Pearson correlation coefficients quantifying temporal clustering during the free recall task (panel D).
- https://doi.org/10.7554/eLife.45333.012
-
Figure 2—source data 4
Z-value differences quantifying the difference in temporal and spatial mapping in alEC and pmEC as shown in panel E.
- https://doi.org/10.7554/eLife.45333.013
Figure 2—figure supplement 1
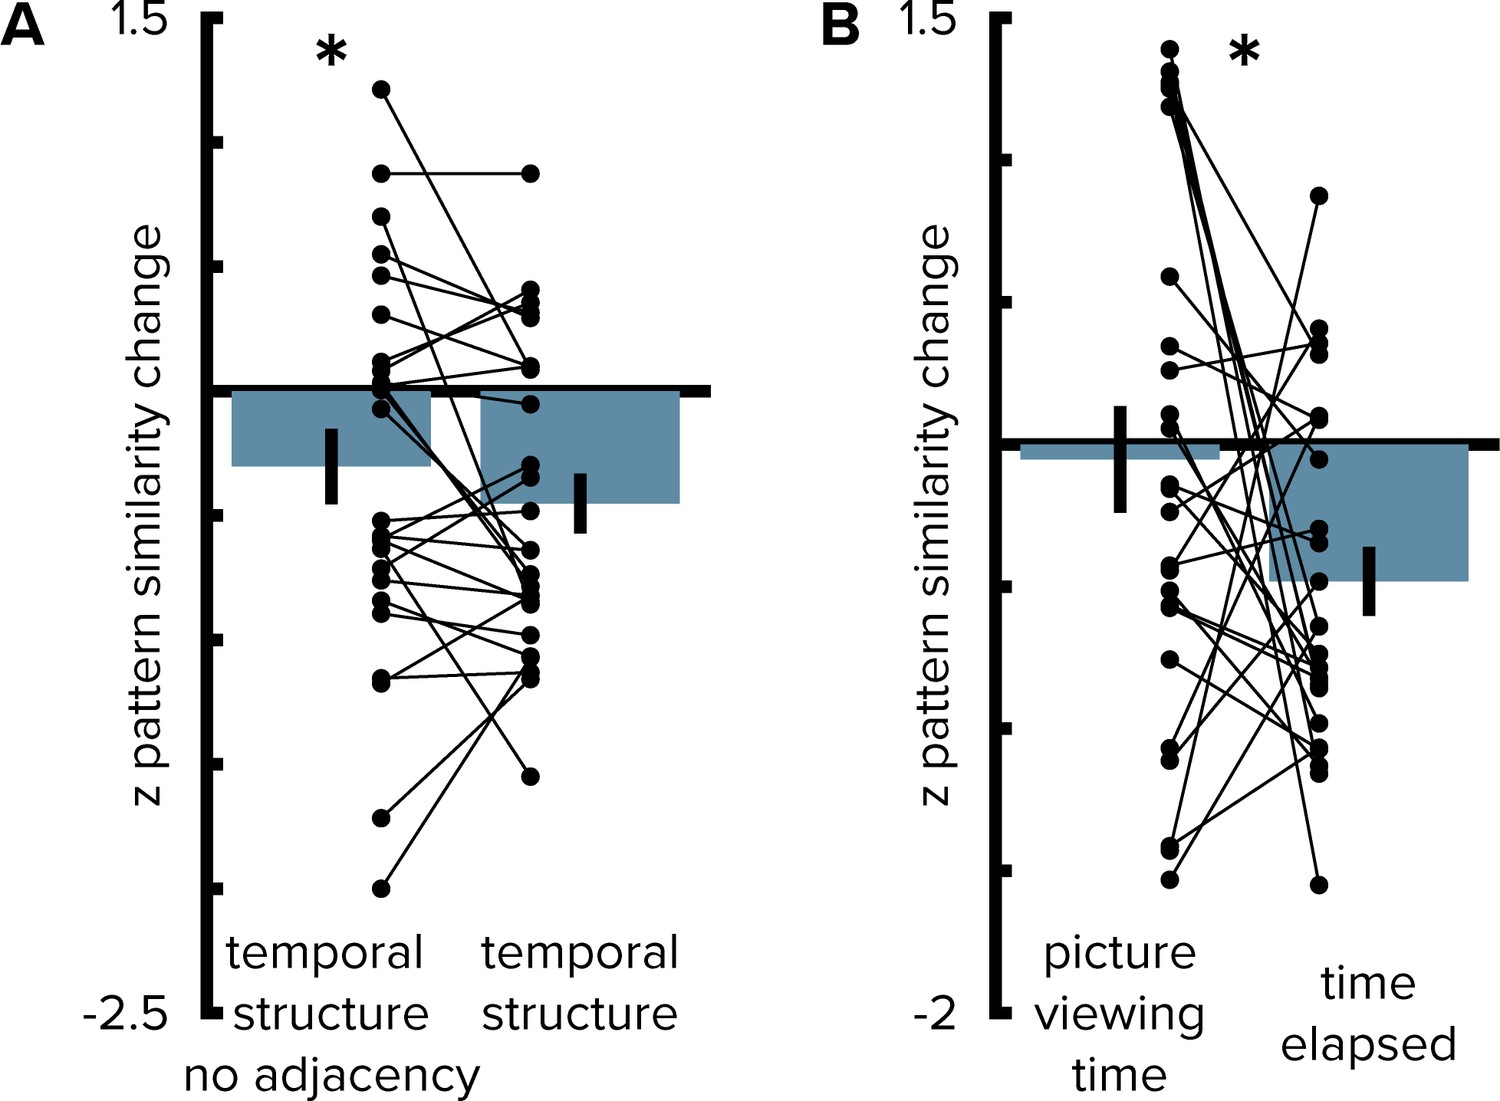
Entorhinal pattern similarity change reflects temporal structure beyond direct adjacency and stimulus presentation times from the pre-learning scan.
(A) To rule out that the effect was driven by objects at temporally adjacent positions along the route we excluded these comparisons from the analysis. The effect of temporal mapping in the alEC remained significant (T(25)=-2.00, p=0.029, one-sided test) and the result of this analysis did not differ significantly from the original results obtained from the analysis including all comparisons (T(25)=1.40, p=0.190). (B) Pattern similarity change in alEC was not correlated with temporal distances from the first picture viewing task. Correlations with pattern similarity change were more negative for elapsed time during the learning task than for presentation times during the first picture viewing task (see Materials and methods). Bars show mean and S.E.M with lines connecting data points from the same participant. *p<0.05.
Figure 2—figure supplement 2
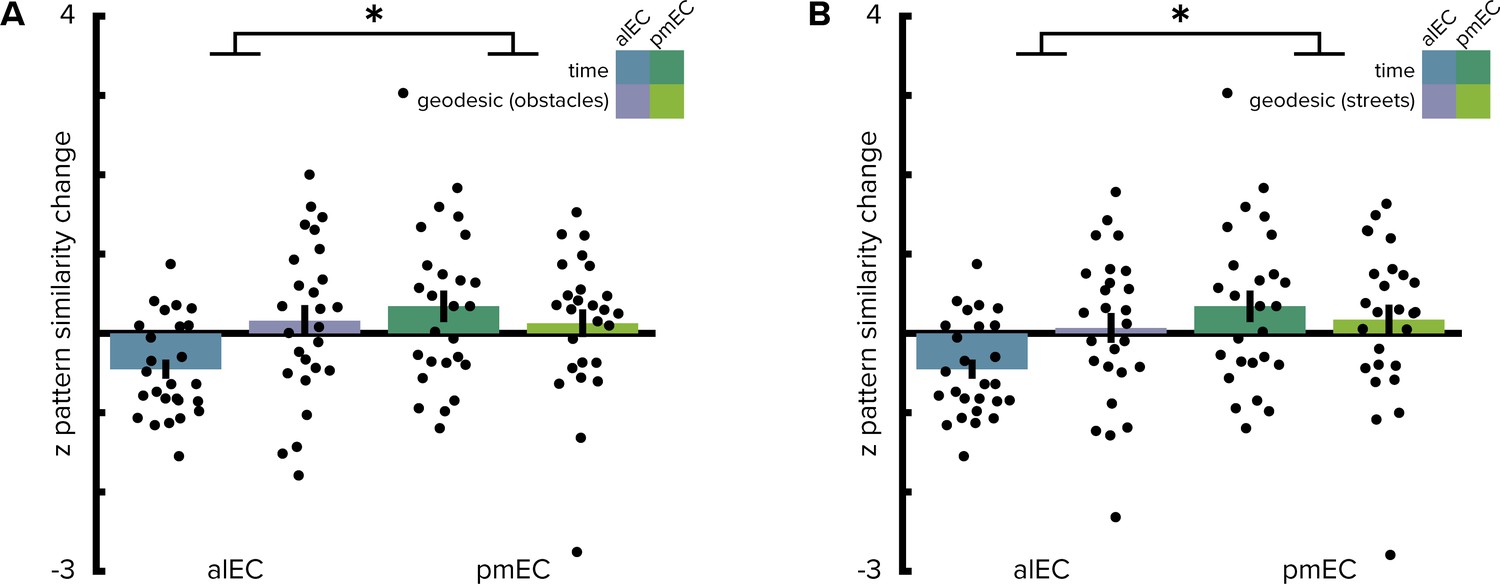
Geodesic spatial distances do not correlate with entorhinal pattern similarity change.
(A, B) Two-way repeated measures ANOVAs with the factors entorhinal subregion and distance type (elapsed time and geodesic spatial distances) yielded comparable results to analyses based on Euclidean spatial distances (see main text); irrespective of whether geodesic distances were quantified as the lengths of shortest paths using all unobstructed locations (A) or restricting shortest paths to the city’s street network (B). Post hoc tests revealed more negative correlations of alEC pattern similarity change with temporal compared to geodesic distances (non-obstructed locations: T(25)=-2.88, p=0.009; street network only: T(25)=-2.51, p=0.019). Bars reflect mean and S.E.M with circles showing data points of individual participants. *p<0.05.
Figure 2—figure supplement 3
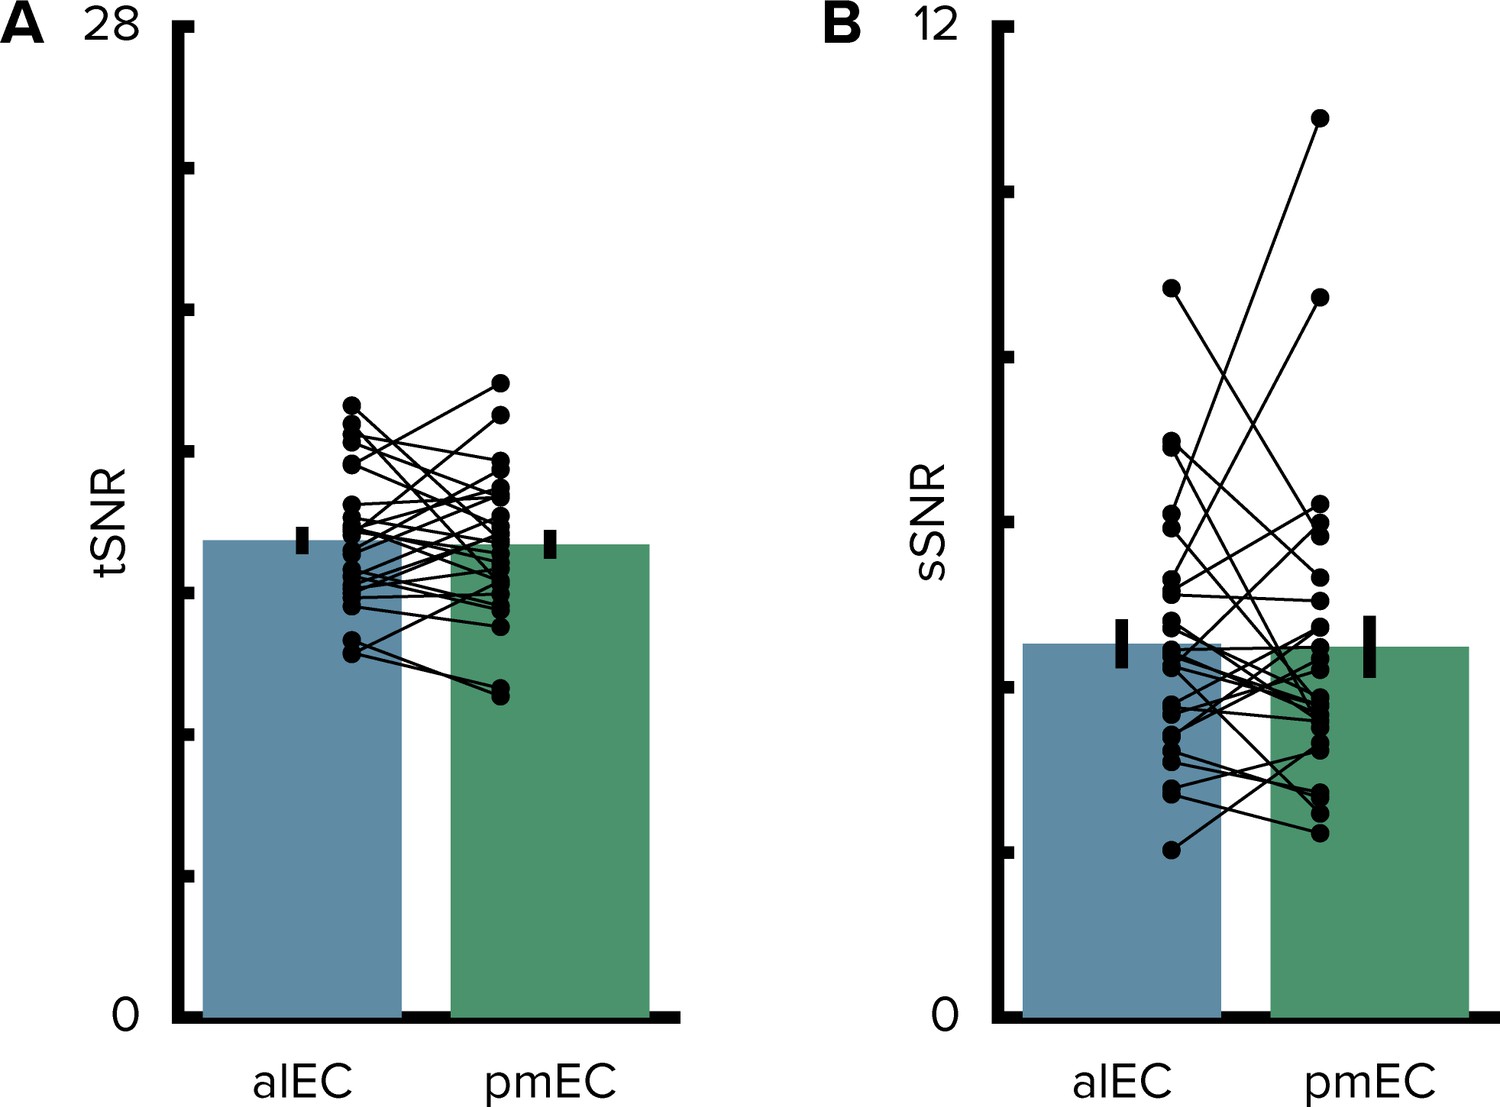
Signal-to-noise ratio in the entorhinal cortex.
(A) The temporal signal-to-noise ratio did not differ between the entorhinal subregions. (B) Similarly, the spatial signal-to-noise ratio did not differ between entorhinal subregions. Bars show mean and S.E.M with lines connecting data points from the same participant.
Figure 2—figure supplement 4

No evidence for reactivation of object representations in the entorhinal cortex.
(A) Group-level visualization of the region of interest used for the lateral occipital cortex (LOC). (B) Classification accuracies observed when testing the classifier trained on the pre-learning scan on the post-learning scan. Data are shown for different lags. Lag 0 corresponds to the same object presented on the screen in a given trial of the two picture viewing tasks. At lag 0, decoding accuracies were above chance levels in the LOC, but not in alEC or pmEC. Negative and positive lags show classifier predictions for objects at preceding and upcoming sequence positions, respectively. Classification accuracies were not above chance levels for preceding or upcoming sequence positions. Bars reflect mean and S.E.M with circles showing data points of individual participants. Red line and shaded area show mean and standard deviation of participant-specific chance levels determined via random permutations of trial labels (see Materials and methods). ***p<0.001; **p<0.01; *p<0.05.
Figure 3
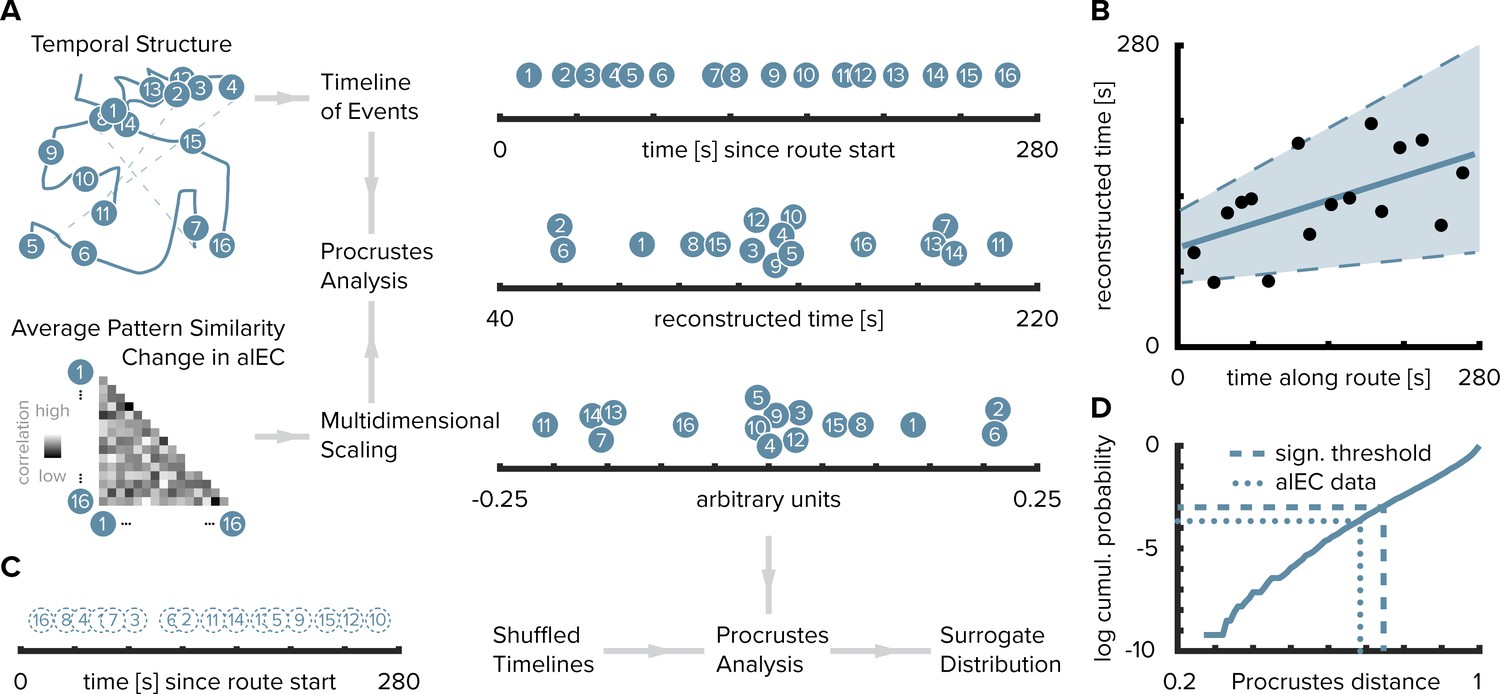
Reconstructing the timeline of events from entorhinal pattern similarity change.
(A) To recover the temporal structure of events we performed multidimensional scaling on the average pattern similarity change matrix in alEC. The resulting coordinates, one for each object along the route, were subjected to Procrustes analysis, which applies translations, rotations and uniform scaling to superimpose the coordinates from multidimensional scaling on the true temporal coordinates along the route (see Materials and methods). For visualization, we varied the positions resulting from multidimensional scaling and Procrustes analysis along the y-axis. (B) The temporal coordinates of this reconstructed timeline were significantly correlated with the true temporal coordinates of object encounters along the route. Circles indicate time points of object encounters; solid line shows least squares line; dashed lines and shaded region highlight bootstrapped confidence intervals. (C) The goodness of fit of the reconstruction (the Procrustes distance) was quantified as the standardized sum of squared errors and compared to a surrogate distribution of Procrustes distances. This surrogate distribution was obtained from randomly shuffling the true coordinates against the coordinates obtained from multidimensional scaling and then performing Procrustes analysis for each of 10000 shuffles (left shows one randomly shuffled timeline for illustration). (D) The Procrustes distance obtained from fitting to the true timeline of events (dotted line) was smaller than the 5th percentile (dashed line) of the surrogate distribution (solid line), which constitutes the significance threshold at an alpha level of 0.05.
-
Figure 3—source data 1
True and reconstructed temporal coordinates of object positions as shown in panel B.
- https://doi.org/10.7554/eLife.45333.015
-
Figure 3—source data 2
Procrustes distance from mapping coordinates from multidimensional scaling based on alEC pattern similarity change to true temporal coordinates and surrogate distribution obtained from fitting to shuffled temporal coordinates (panel D).
- https://doi.org/10.7554/eLife.45333.016
Figure 4
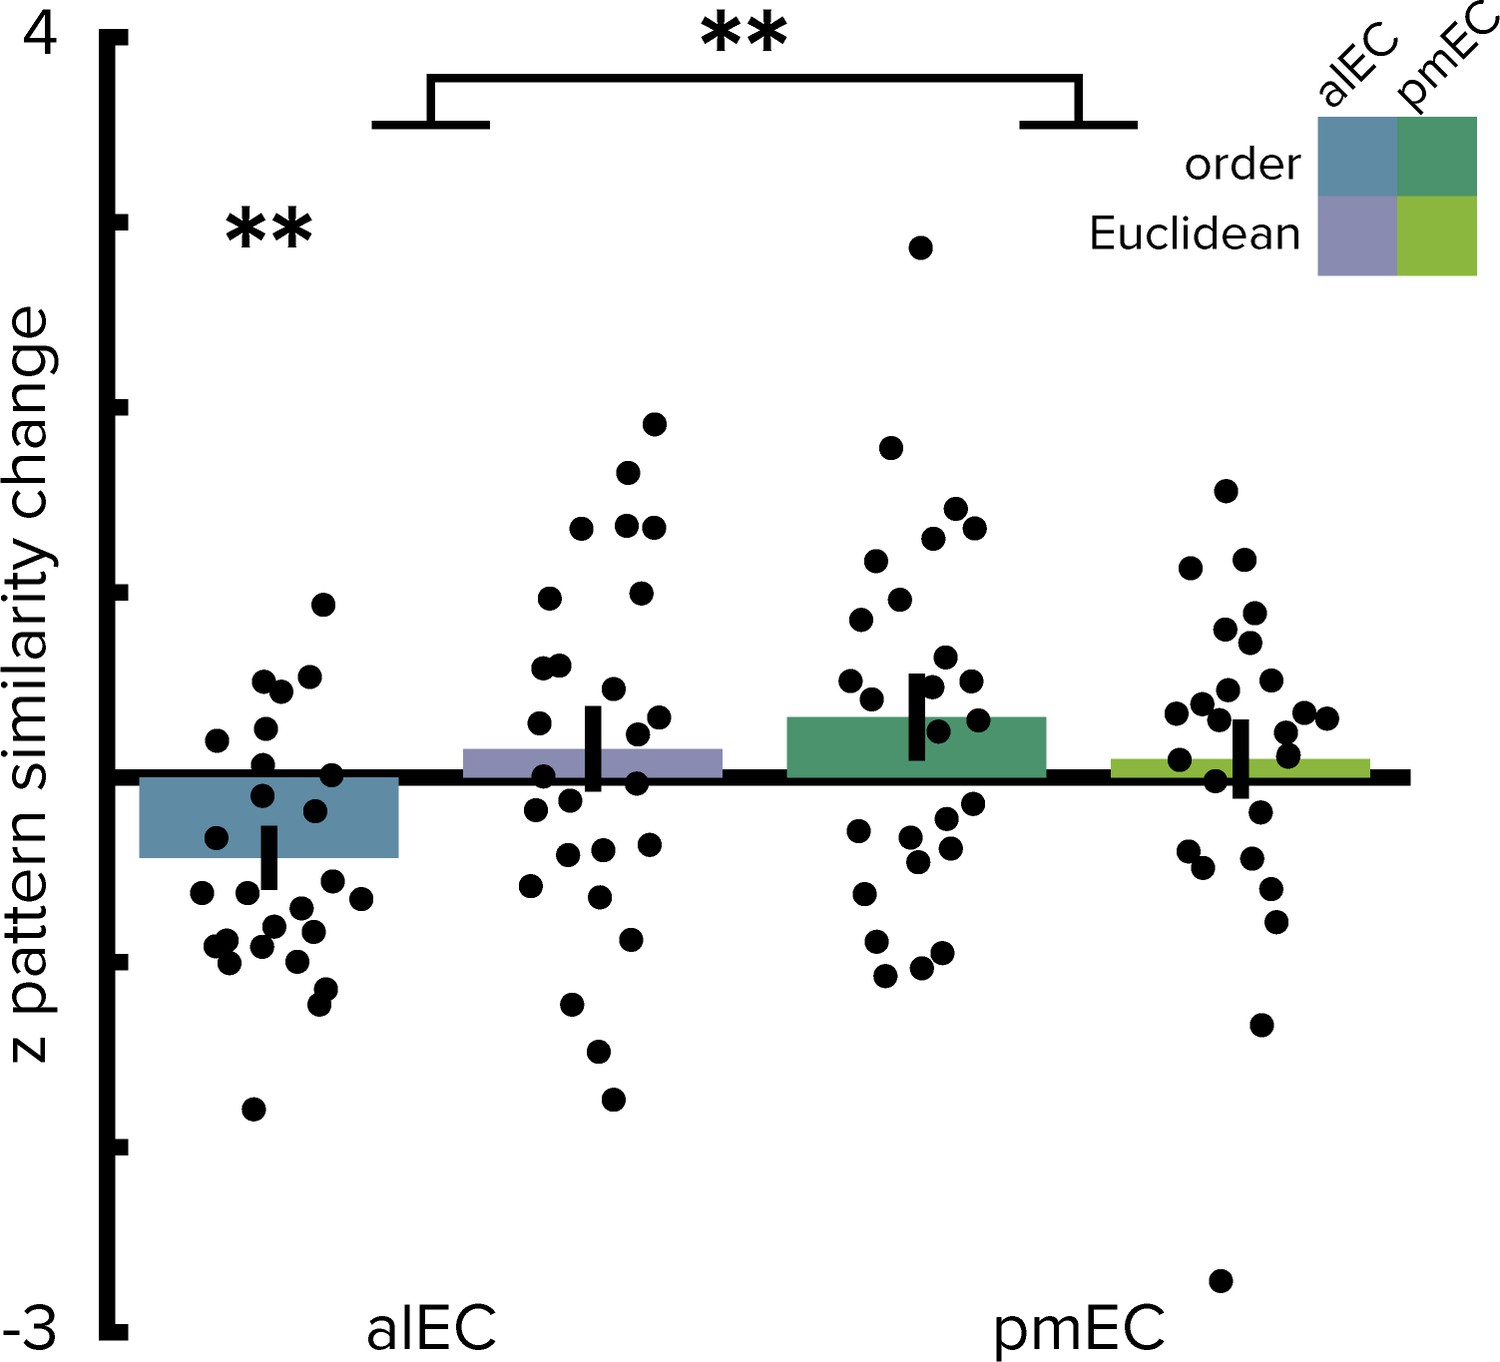
Ordinal temporal distances correlate with pattern similarity change in alEC.
Repeating the two-way repeated measures ANOVA using ordinal distances as the measure of sequence structure yielded results comparable to the analyses presented in Figure 2. We observed a significant interaction (see main text) highlighting a difference in temporal and spatial mapping between alEC and pmEC. Post hoc tests comparing mapping of ordinal temporal distances and Euclidean spatial distances in the alEC (T(25)=-2.81, p=0.008) and comparing mapping of ordinal temporal distances between alEC and pmEC (T(25)=-3.53, p=0.002) are significant at the Bonferroni-corrected alpha-level of 0.025. Bars reflect mean and S.E.M with circles showing data points of individual participants. **p<0.01.
-
Figure 4—source data 1
Z-values of correlations between pattern similarity change in the entorhinal subregions and ordinal temporal and Euclidean spatial distances.
- https://doi.org/10.7554/eLife.45333.018
Additional files
-
Transparent reporting form
- https://doi.org/10.7554/eLife.45333.019
Download links
A two-part list of links to download the article, or parts of the article, in various formats.
Downloads (link to download the article as PDF)
Open citations (links to open the citations from this article in various online reference manager services)
Cite this article (links to download the citations from this article in formats compatible with various reference manager tools)
Mapping sequence structure in the human lateral entorhinal cortex
eLife 8:e45333.
https://doi.org/10.7554/eLife.45333


