One bout of neonatal inflammation impairs adult respiratory motor plasticity in male and female rats
- University of Oregon, United States
- University of Wisconsin-Madison, United States
Figures
Figure 1

Neonatal inflammation increases mortality in neonatal males and transiently delays weight gain in male and female rats.
After neonatal inflammation (P4, LPS 1 mg/kg, i.p.) male mortality (A) is increased within 24 hr (Fisher’s exact test, p = 0.006), but not in females (p = 0.466), relative to saline controls. Weekly male and female weights (B) after neonatal saline or LPS. (*p < 0.05, significant pairwise difference within sex).
-
Figure 1—source data 1
Weights.
- https://doi.org/10.7554/eLife.45399.004
Figure 2
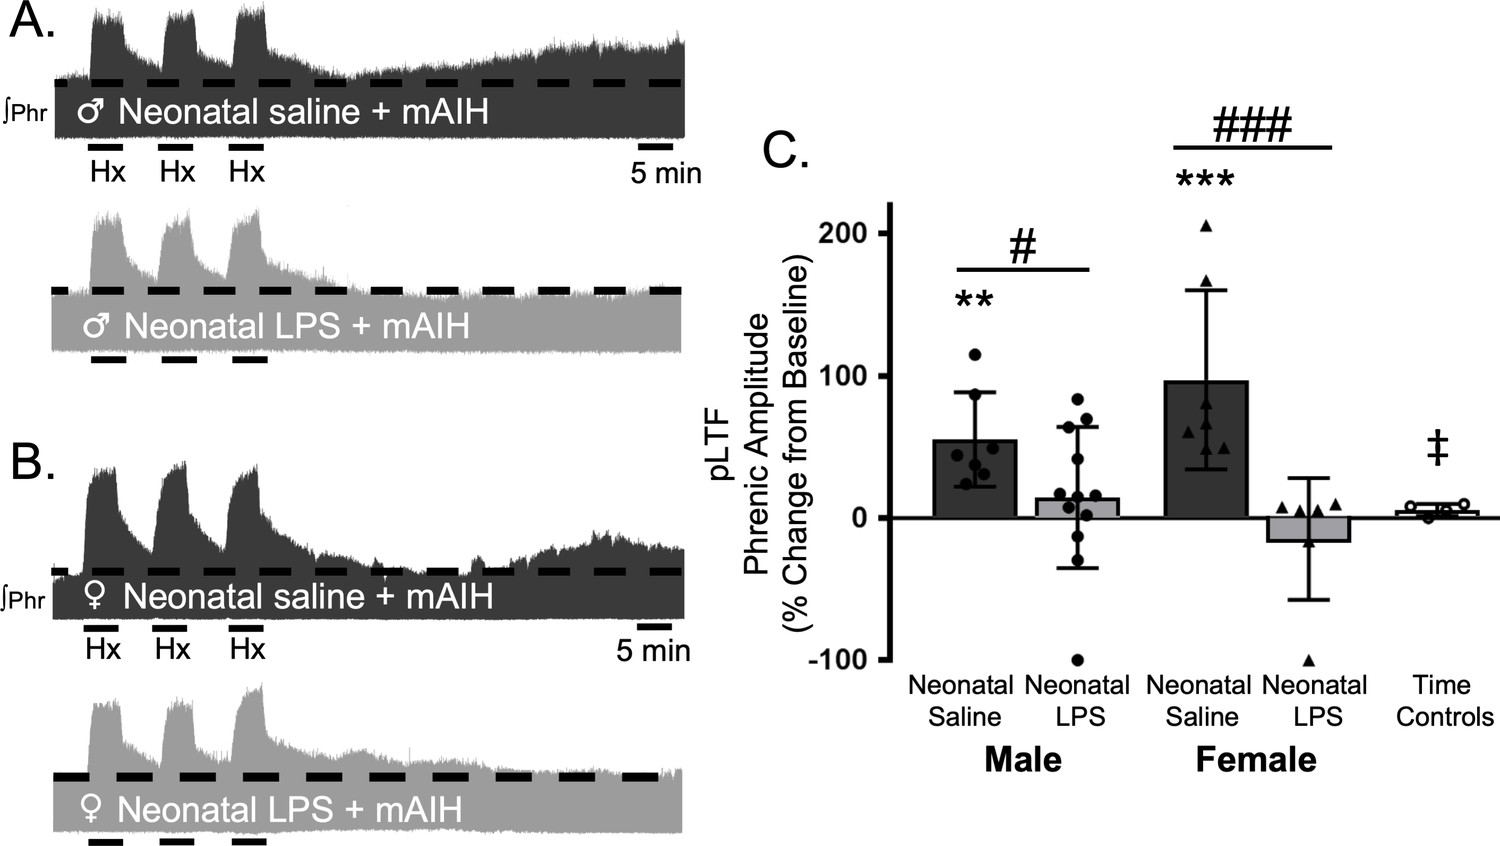
Neonatal systemic inflammation undermines adult, Q-pathway-evoked pLTF in male and female rats.
Representative integrated phrenic neurograms from male (A) and female rats (B) after neonatal (P4) saline (top traces, black) or LPS (1 mg/kg, i.p.; bottom traces, grey). Q-pathway-evoked pLTF is evident in adults after neonatal saline as the progressive increase in phrenic nerve amplitude from baseline (dashed line) over 60 min following moderate acute intermittent hypoxia (mAIH, 3 × 5 min episodes, PaO235–45 mmHg). Group data (C) demonstrate Q-pathway-evoked pLTF 60 min after mAIH is abolished in adults by neonatal LPS in both males (circles) and females (triangles) and no change in phrenic amplitude in time controls (**p < 0.01, ***p < 0.001 from baseline, # p < 0.05, ### p < 0.001 between groups, ‡ p < 0.05 from adult males and females after neonatal saline).
-
Figure 2—source data 1
mAIH.
- https://doi.org/10.7554/eLife.45399.006
Figure 3
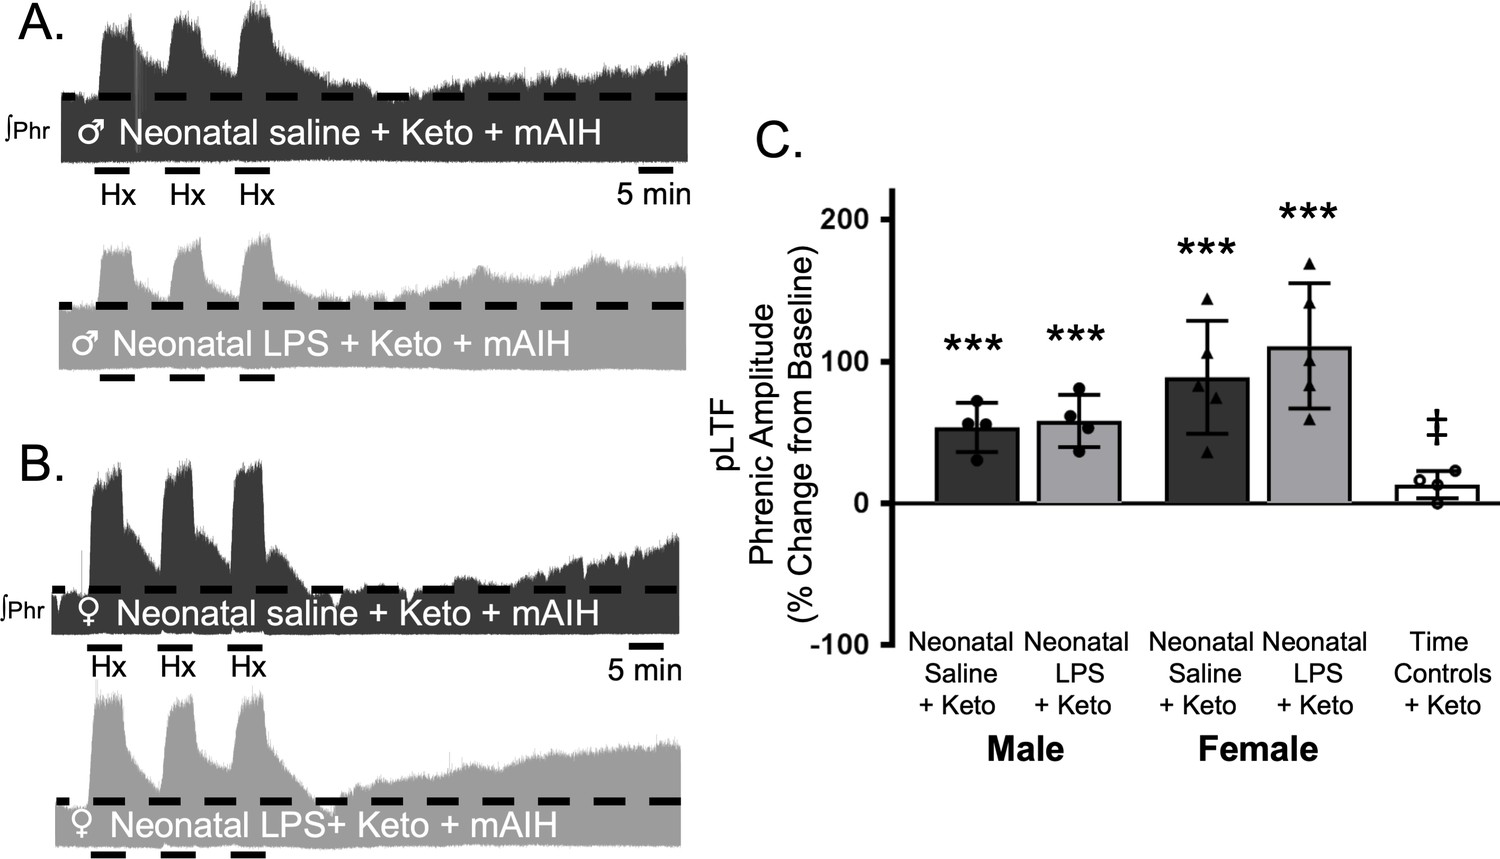
Acute, adult anti-inflammatory (ketoprofen, Keto) restores Q-pathway-evoked pLTF after neonatal systemic inflammation in adult male and female rats.
Representative integrated phrenic neurograms for adult male (A) and female (B) rats after neonatal (P4) saline (top traces, black) or LPS (1 mg/kg, i.p.; bottom traces, grey) and acute, adult ketoprofen (12.5 mg/kg, i.p., 3 hr). Q-pathway-evoked pLTF is evident as the progressive increase in phrenic nerve amplitude from baseline (black dashed line) over 60 min following moderate acute intermittent hypoxia (mAIH, 3 × 5 min episodes, PaO235–45 mmHg). Group data (C) demonstrate adult ketoprofen restores Q-pathway-evoked pLTF 60 min after mAIH in adults after neonatal LPS in both males (circles) and females (triangles) and no change in phrenic amplitude in time controls (***p < 0.001 from baseline, ‡ p < 0.05 from all other groups).
-
Figure 3—source data 1
mAIH_Keto.
- https://doi.org/10.7554/eLife.45399.008
Figure 4
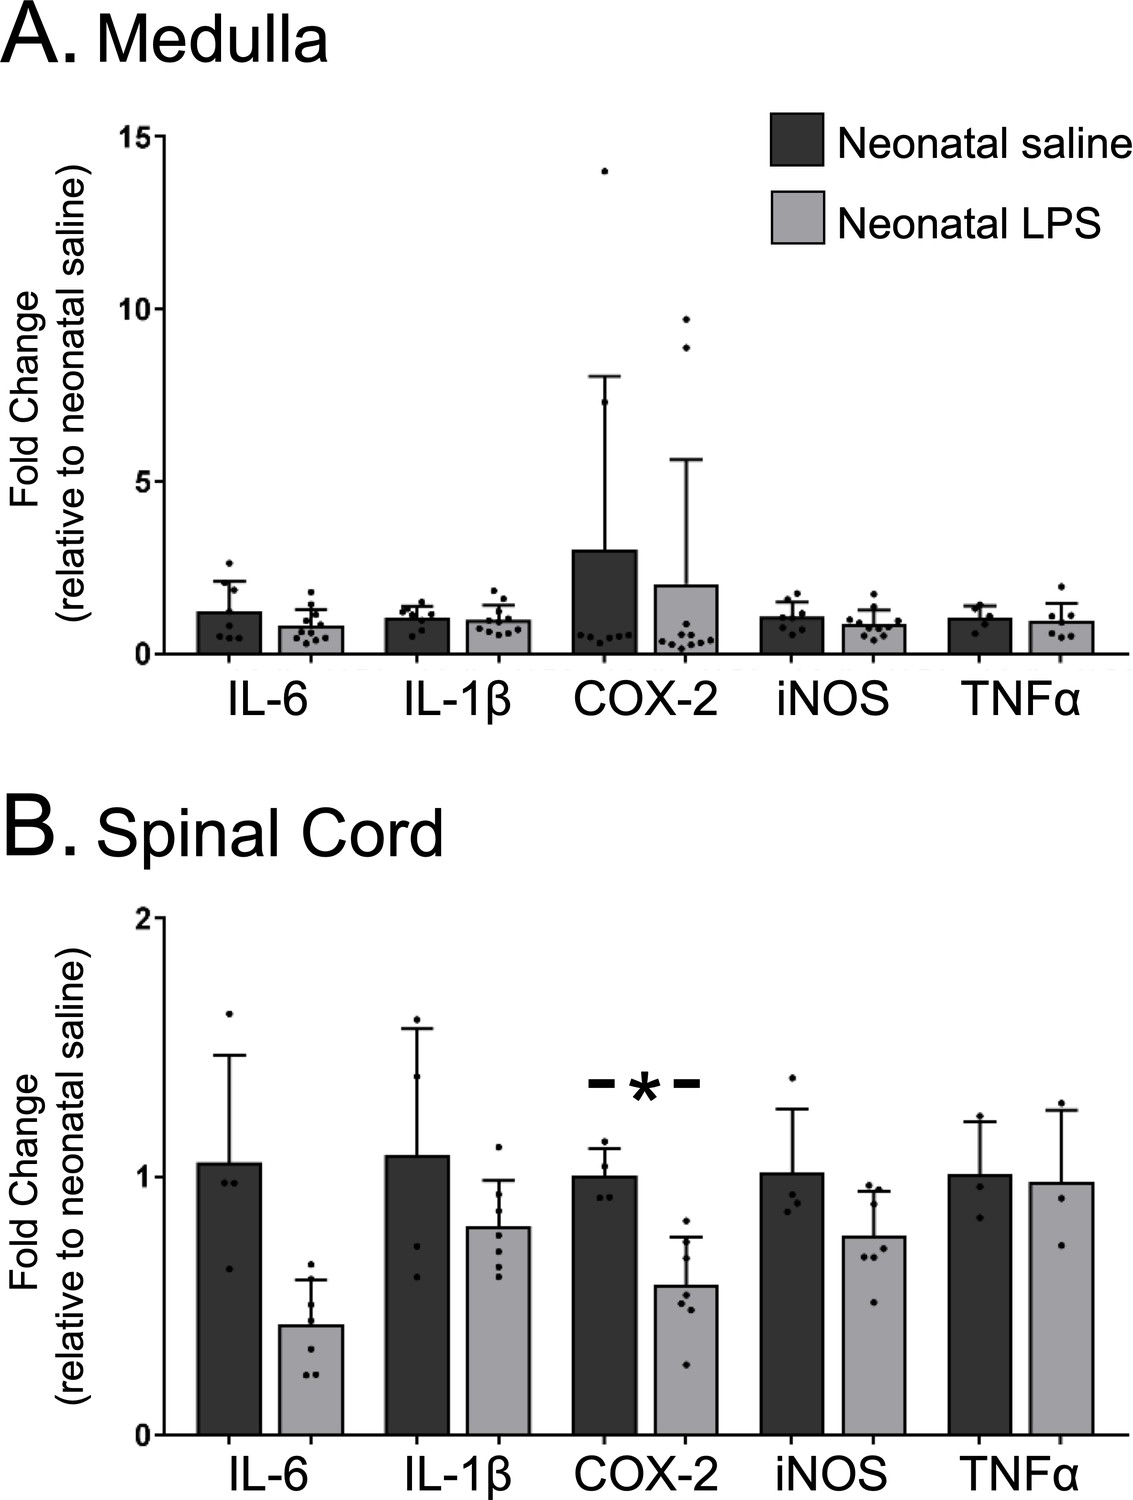
Neonatal inflammation does not increase adult medullary or spinal inflammatory gene expression.
Homogenate samples isolated from adult medullas showed no significant increase in inflammatory mRNA after neonatal inflammation (A). Similarly, homogenate samples from isolated adult cervical spinal cords (B) were not increased by neonatal inflammation, but COX2 gene expression was significantly decreased in adults after neonatal inflammation (*p < 0.05).
-
Figure 4—source data 1
Cytokine_expression.
- https://doi.org/10.7554/eLife.45399.010
Figure 5
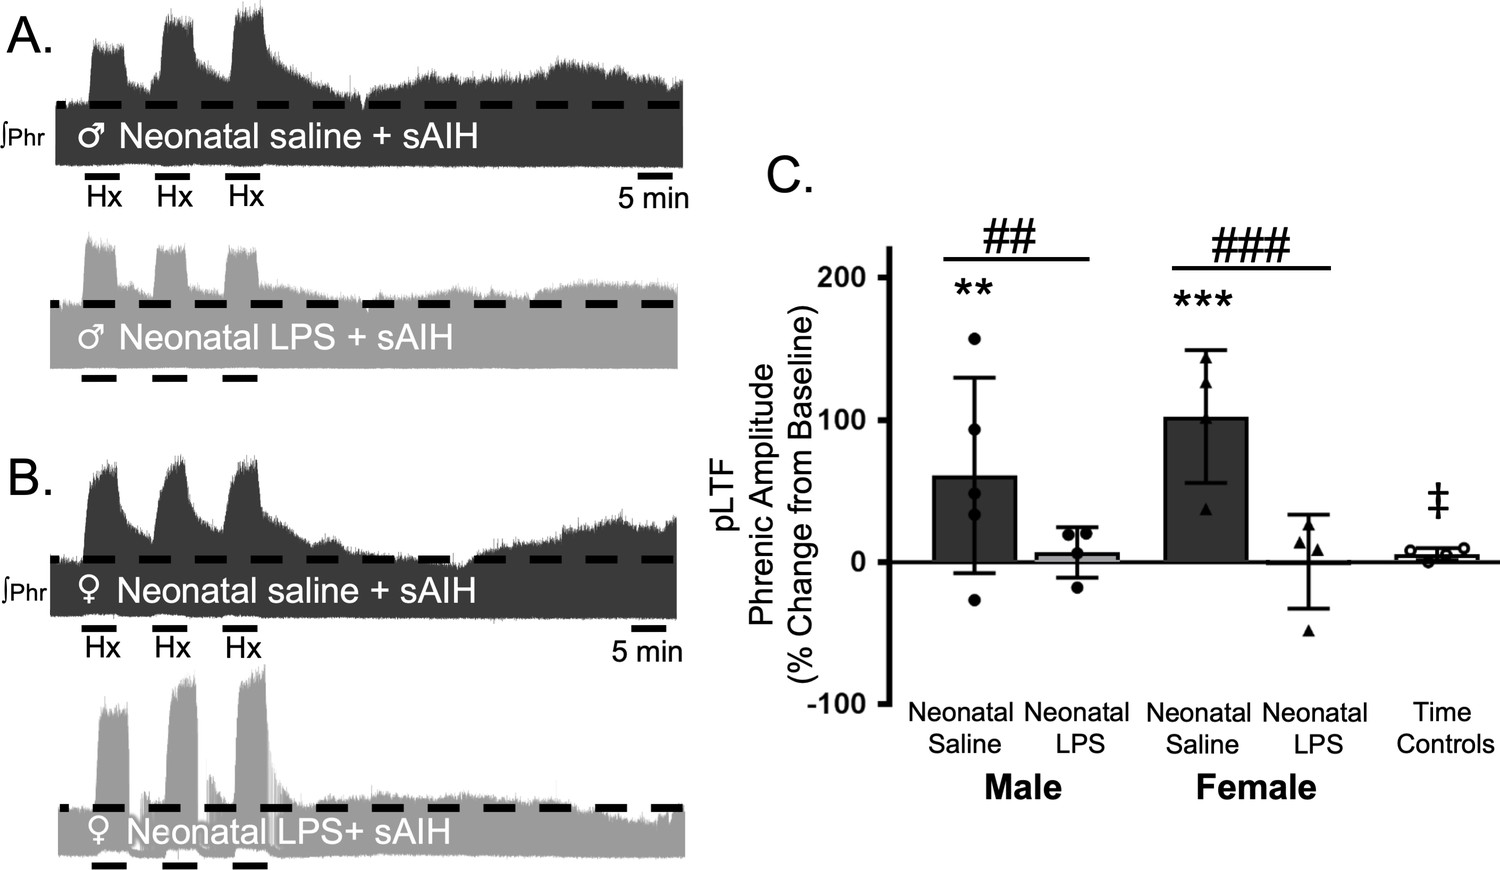
Neonatal systemic inflammation undermines adult, S-pathway-evoked pLTF in male and female rats.
Representative integrated phrenic neurograms for adult male (A) and female (B) rats after neonatal (P4) saline (top traces, black) or LPS (1 mg/kg, i.p.; bottom traces, grey). S-pathway-evoked pLTF is evident as the progressive increase in phrenic nerve amplitude from baseline (black dashed line) over 60 min following severe acute intermittent hypoxia (sAIH, 3 × 5 min episodes, PaO225–35 mmHg) in adults after neonatal saline. Group data (C) demonstrate S-pathway-evoked pLTF 60 min after sAIH is abolished in adults by neonatal LPS in both males (circles) and females (triangles) and no change in phrenic amplitude in time controls (**p < 0.01, ***p < 0.001 from baseline ## p < 0.01, ### p < 0.001 between groups, ‡ p < 0.05 from male and female adults after neonatal saline).
-
Figure 5—source data 1
sAIH.
- https://doi.org/10.7554/eLife.45399.012
Figure 6
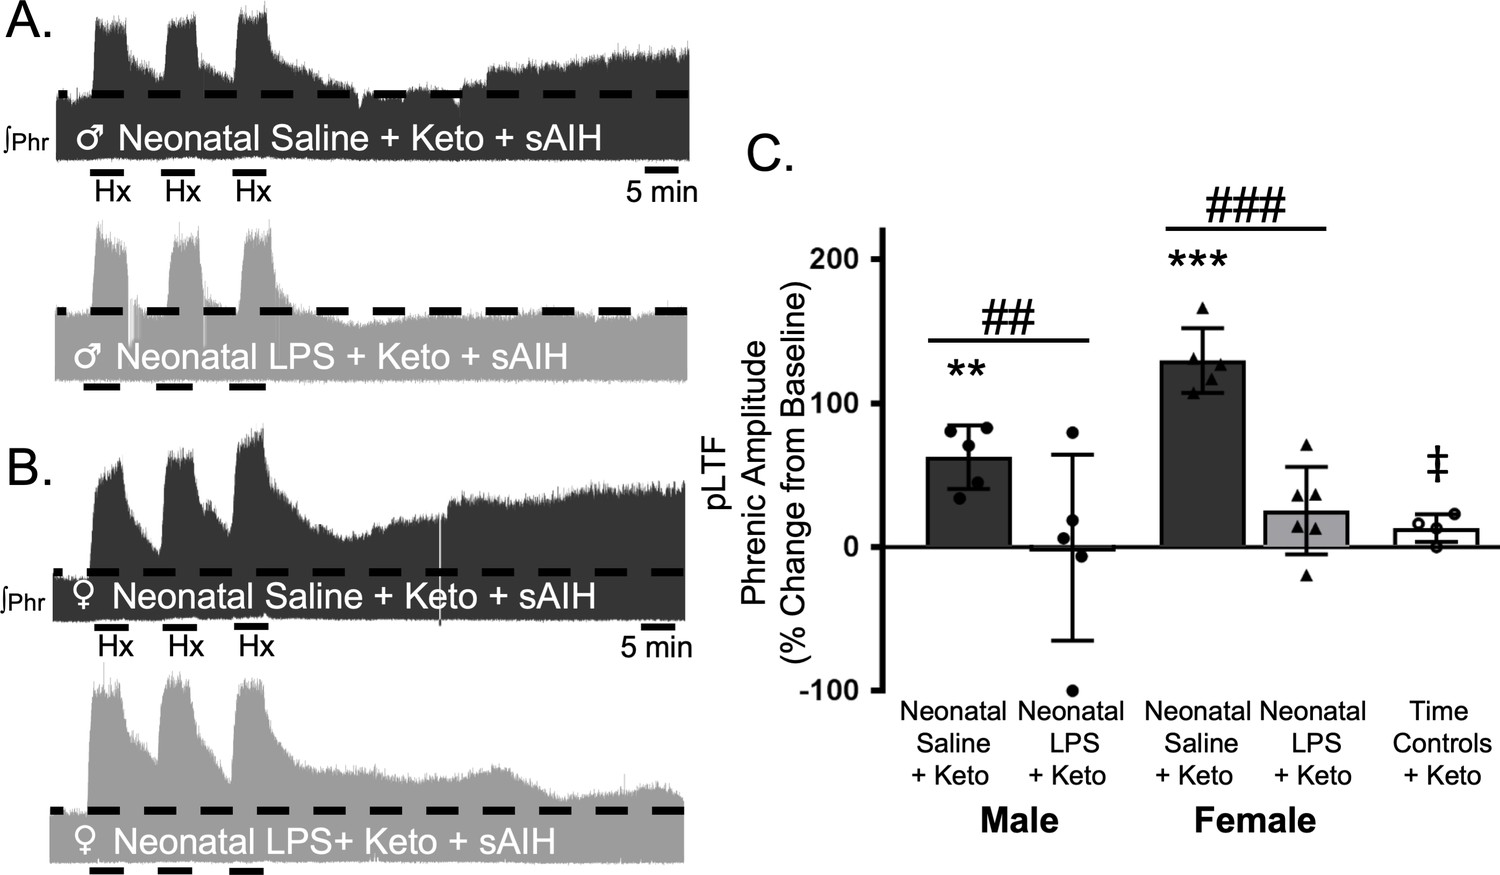
Adult, anti-inflammatory (ketoprofen, keto) does not restore S-pathway-evoked pLTF after neonatal systemic inflammation in adult male and female rats.
Representative integrated phrenic neurograms for adult male (A) and female (B) rats after neonatal (P4) saline (top traces, black) or LPS (1 mg/kg, i.p.; bottom traces, grey) and acute, adult ketoprofen (12.5 mg/kg, i.p., 3 hr). S-pathway-evoked pLTF is evident as the progressive increase in phrenic nerve amplitude from baseline (black dashed line) over 60 min following severe acute intermittent hypoxia (sAIH, 3 × 5 min episodes, PaO235–45 mmHg) in adults after neonatal saline. Group data (C) demonstrate acute, adult ketoprofen does not restore S-pathway-evoked pLTF 60 min after sAIH after neonatal LPS in adult males (circles) and females (triangles) and no change in phrenic amplitude in time controls (**p < 0.01, ***p < 0.001 from baseline, ## p < 0.01, ### p < 0.001 between groups, ‡ p < 0.05 from adult males and females after neonatal saline).
-
Figure 6—source data 1
sAIH_Keto.
- https://doi.org/10.7554/eLife.45399.014
Figure 7

Intermittent adult, adenosine receptor agonism reveals plasticity after neonatal systemic inflammation in male and female rats.
Representative integrated phrenic neurograms for adult male (A) and female (B) rats after neonatal (P4) saline (top traces, black) or LPS (1 mg/kg, i.p.; bottom traces, grey). S-pathway-evoked phrenic motor plasticity is evident as the progressive increase in phrenic nerve amplitude from baseline (black dashed line) 90 min following intermittent CGS-21680 (100 µM, black arrows, 3 × 5 min apart) in adults after neonatal saline. Group data (C) demonstrate adult CGS-21680 reveals S-pathway-evoked plasticity after neonatal LPS in adult males (circles) and females (triangles) and no change in phrenic amplitude in vehicle controls (***p < 0.001 from baseline, ‡ p < 0.001 from adult males and females after neonatal saline).
-
Figure 7—source data 1
CGS2160.
- https://doi.org/10.7554/eLife.45399.016
Figure 8
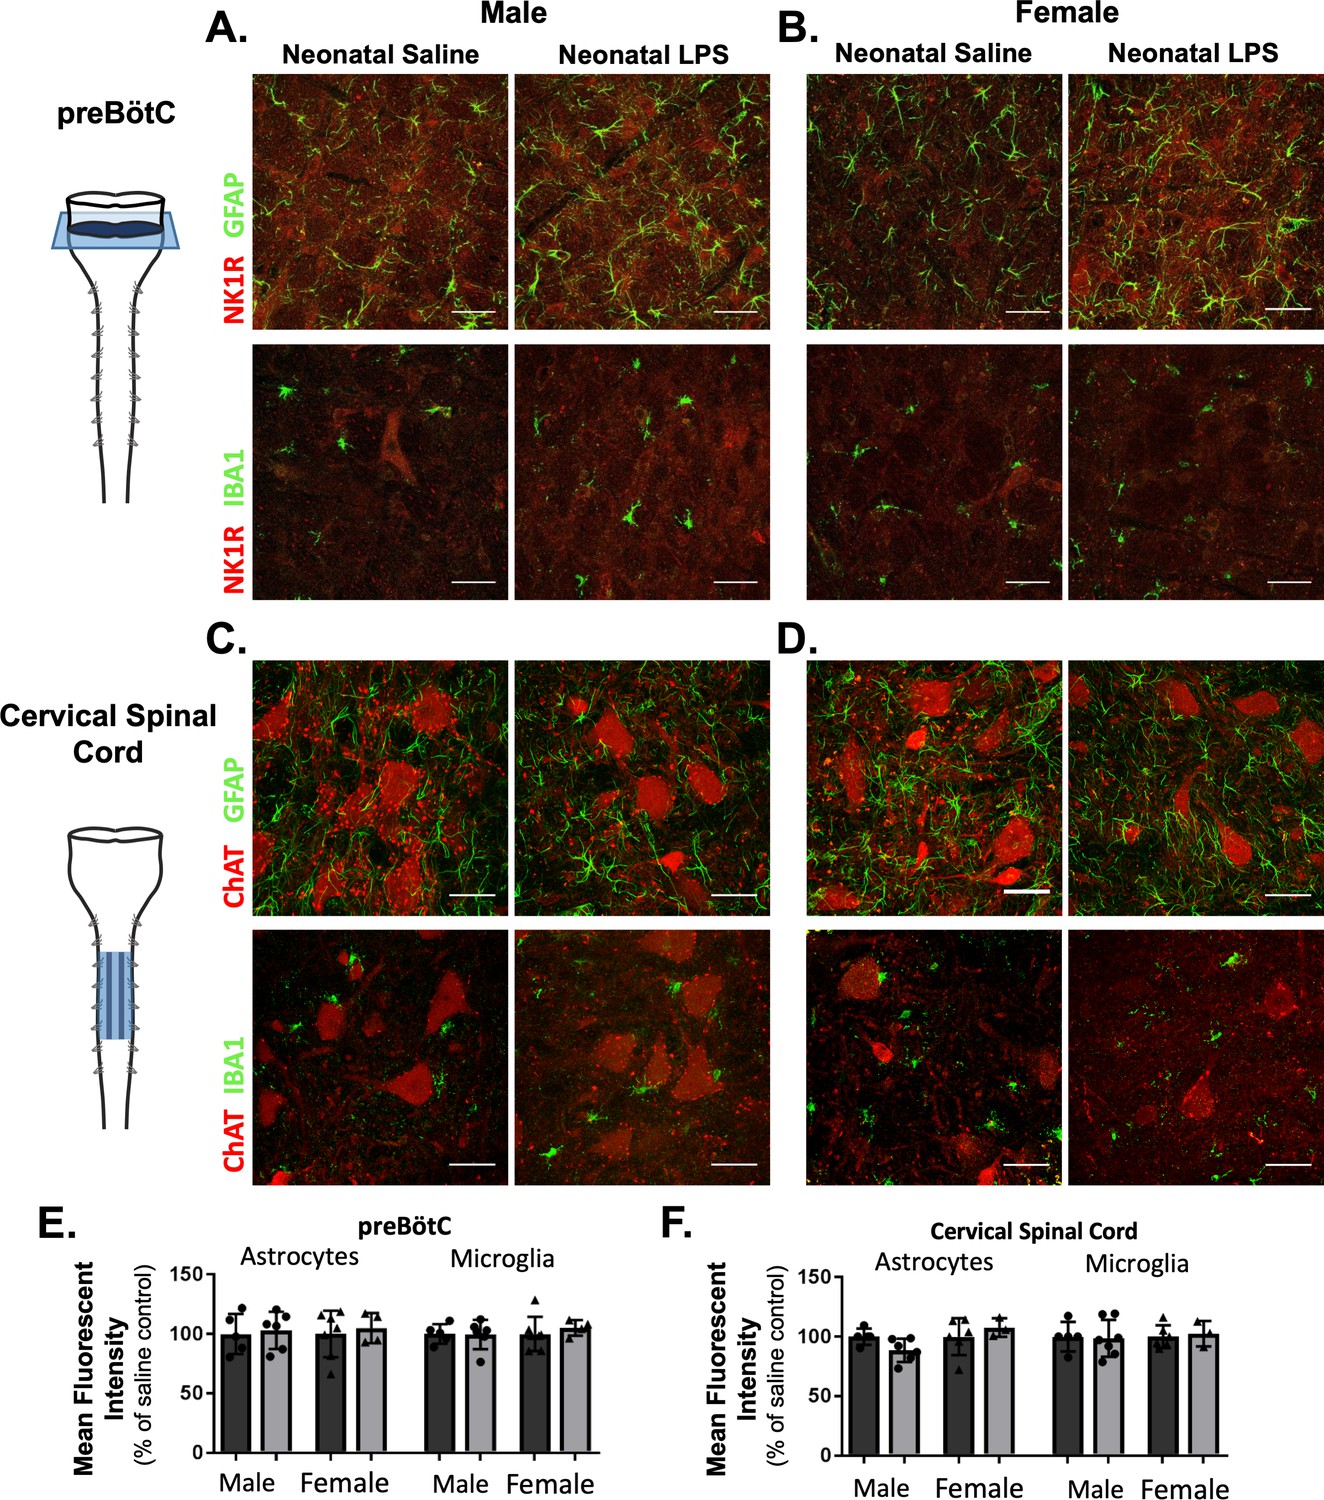
Neonatal inflammation does not alter GFAP or IBA1 immunofluorescence in adult preBötzinger Complex or ventral cervical spinal cords.
After neonatal LPS (1 mg/kg, i.p., (P4), representative confocal images (40x) from adult preBötC (A and B) and cervical spinal cords (C and D) displayed no qualitative differences in immunoreactivity for GFAP (green, astrocytes) or IBA1 (green, microglia) in males (left panels) or females (right panels). PreBötC neurons are labeled with antibodies for NK1R (red, A and B) and motor neurons are labeled with antibodies for ChAT (red, C and D). Neonatal inflammation did not significantly change mean fluorescent intensity of either GFAP or IBA1 in the preBötC (E) or cervical spinal cord (F), suggesting no lasting differences in astrocytes or microglia after neonatal inflammation. Scale bars: 50 µm.
-
Figure 8—source data 1
Immunohistochemistry.
- https://doi.org/10.7554/eLife.45399.018
Tables
Table 1
Acute, adult hypoxic phrenic responses.
https://doi.org/10.7554/eLife.45399.019| Male | Female ††† | |||||||
|---|---|---|---|---|---|---|---|---|
| Neonatal saline | Neonatal LPS | Neonatal saline | Neonatal LPS | |||||
| Moderate hypoxia | 114 ± 41 | 93 ± 36 | 185 ± 53* | 148 ± 63 | ||||
| Keto + Moderate hypoxia | 118 ± 36 | 118 ± 44 | 165 ± 52 | 189 ± 82* | ||||
| Male | Female † | |||||||
| Neonatal Saline | Neonatal LPS | Neonatal Saline | Neonatal LPS | |||||
| Severe hypoxia | 139 ± 37 | 106 ± 10 | 172 ± 125 | 172 ± 26 | ||||
| Keto + Severe hypoxia | 151 ± 25 | 174 ± 96 | 194 ± 45 | 235 ± 63 | ||||
-
Group data for adult, acute hypoxic phrenic responses to moderate (PaO235–45 mmHg) and severe (PaO225–35 mmHg) hypoxia demonstrate no differences after neonatal (P4) saline or LPS (1 mg/kg, i.p), or after adult ketoprofen (12.5 mg/kg, i.p, 3 hr) within each sex. Significant differences between sexes demonstrate larger responses in females after moderate or severe hypoxia († p<0.05, ††† p<0.001). *p<0.05 from male neonatal LPS. Moderate hypoxia: neonatal saline male (n = 7), neonatal LPS male (n = 10), neonatal saline female (n = 6), neonatal LPS female (n = 6). Keto + Moderate hypoxia: neonatal saline male (n = 4), neonatal LPS male (n = 4), neonatal saline female (n = 5), neonatal LPS female (n = 5). Severe hypoxia: neonatal saline male (n = 5), neonatal LPS male (n = 4), neonatal saline female (n = 4), neonatal LPS female (n = 4). Keto + Moderate hypoxia: neonatal saline male (n = 5), neonatal LPS male (n = 5), neonatal saline female (n = 5), neonatal LPS female (n = 6)
-
Table 1—source data 1
Hypoxic responses.
- https://doi.org/10.7554/eLife.45399.020
Table 2
Physiological parameters during electrophysiology experiments.
https://doi.org/10.7554/eLife.45399.021| Temperature (°C) | PaO2 (mmHg) | PaCO2 (mmHg) | pH | MAP (mmHg) | |||||||
|---|---|---|---|---|---|---|---|---|---|---|---|
| Baseline | Male | Female | Male | Female | Male | Female | Male | Female | Male | Female | |
| Neonatal Saline + mAIH | 37.4 ± 0.2 | 37.4 ± 0.2 | 254 ± 19 | 259 ± 53 | 43.2 ± 5.6 | 48.9 ± 3.7 | 7.37 ± 0.06 | 7.36 ± 0.02 | 124 ± 9 | 121 ± 18 | |
| Neonatal LPS + mAIH | 37.6 ± 0.2 | 37.5 ± 0.2 | 266 ± 30 | 268 ± 24 | 42.8 ± 4.7# | 45.0 ± 1.8 | 7.37 ± 0.04 | 7.37 ± 0.02 | 127 ± 10 | 123 ± 23 | |
| Neonatal Saline + Keto + mAIH | 37.3 ± 0.1 | 37.4 ± 0.3 | 249 ± 21 | 255 ± 28 | 41.7 ± 4.9 | 48.6 ± 3.5 | 7.38 ± 0.03 | 7.33 ± 0.02 | 132 ± 8 | 121 ± 12 | |
| NeonatalLPS + Keto + mAIH | 37.4 ± 0.2 | 37.4 ± 0.3 | 276 ± 40 | 283 ± 33 | 41.5 ± 3.2 | 47.9 ± 3.6 | 7.39 ± 0.03 | 7.34 ± 0.02 | 129 ± 16 | 117 ± 14 | |
| Neonatal Saline + sAIH | 37.6 ± 0.3 | 37.5 ± 0.2 | 295 ± 18 | 266 ± 9 | 43.3 ± 5.9 | 47.7 ± 3.1 | 7.37 ± 0.02 | 7.36 ± 0.00 | 133 ± 6 | 121 ± 19 | |
| Neonatal LPS + sAIH | 37.4 ± 0.1 | 37.4 ± 0.4 | 297 ± 28 | 264 ± 35 | 45.3 ± 4.2 | 47.7 ± 4.0 | 7.36 ± 0.02 | 7.36 ± 0.02 | 135 ± 20 | 132 ± 14 | |
| Neonatal Saline + Keto + sAIH | 37.4 ± 0.3 | 37.5 ± 0.1 | 256 ± 46 | 268 ± 29 | 41.6 ± 2.2e | 49.9 ± 3.5 | 7.39 ± 0.03 | 7.34 ± 0.02 | 110 ± 12 | 113 ± 29 | |
| NeonatalLPS + Keto + sAIH | 37.5 ± 0.2 | 37.4 ± 0.2 | 243 ± 45 | 245 ± 39 | 42.3 ± 3.4 | 51.6 ± 6.8 | 7.37 ± 0.01 | 7.31 ± 0.04 | 121 ± 3 | 129 ± 13 | |
| NeonatalSaline + CGS-21680 | 37.5 ± 0.2 | 37.3 ± 0.2 | 268 ± 21 | 237 ± 14 | 45.4 ± 5.3 | 46.2 ± 3 | 7.36 ± 0.04 | 7.34 ± 0.03 | 119 ± 24 | 121 ± 10 | |
| Neonatal LPS + CGS-21680 | 37.6 ± 0.3 | 37.4 ± 0.3 | 247 ± 27 | 247 ± 21 | 46.2 ± 2.9 | 46.6 ± 2.7 | 7.37 ± 0.02 | 7.34 ± 0.02 | 114 ± 12 | 107 ± 15 | |
| Time Controls | 37.7 ± 0.1 | 250 ± 45 | 49.4 ± 4.0 | 7.36 ± 0.05 | 110 ± 10 | ||||||
| Time Controls + Keto | 37.5 ± 0.3 | 250 ± 17 | 44.0 ± 9.1 | 7.37 ± 0.06 | 115 ± 39 | ||||||
| CGS-21680 Vehicle Controls | 37.4 ± 0.3 | 237 ± 40 | 45.8 ± 0.8 | 7.37 ± 0.03 | 110 ± 17 | ||||||
| Hypoxia | |||||||||||
| Neonatal Saline + mAIH | 37.4 ± 0.2 | 37.3 ± 0.1 | 38 ± 2*,†, ‡ | 40 ± 3*,†, ‡ | 42.2 ± 5.1# | 48.8 ± 3.8 | 7.35 ± 0.07 | 7.36 ± 0.03# | 62 ± 23*,†, ‡ | 65 ± 30*,†, ‡ | |
| Neonatal LPS + mAIH | 37.5 ± 0.4 | 37.4 ± 0.1 | 39 ± 2*,†, ‡ | 39 ± 4*,†, ‡ | 43.0 ± 4.8# | 45.4 ± 2.8 | 7.36 ± 0.04# | 7.36 ± 0.02# | 68 ± 19*,†, ‡ | 80 ± 21‡ | |
| Neonatal Saline + Keto + mAIH | 37.5 ± 0.2 | 37.4 ± 0.3 | 38 ± 1*,†, ‡ | 39 ± 3*,†, ‡ | 41.9 ± 3.5 | 48.6 ± 3.7 | 7.37 ± 0.03# | 7.32 ± 0.04 | 62 ± 11‡ | 56 ± 6*,†, ‡ | |
| NeonatalLPS + Keto + mAIH | 37.5 ± 0.2 | 37.5 ± 0.3 | 40 ± 2*,†, ‡ | 39 ± 4*,†, ‡ | 40.9 ± 2.2# | 47.8 ± 4.9 | 7.36 ± 0.04 | 7.32 ± 0.03 | 71 ± 14‡ | 66 ± 19‡ | |
| Neonatal Saline + sAIH | 37.6 ± 0.2 | 37.4 ± 0.3 | 29 ± 5*,†, ‡ | 29 ± 2*,†, ‡ | 43.5 ± 5.9 | 47.7 ± 2.3 | 7.35 ± 0.03 | 7.32 ± 0.06 | 58 ± 9*,†, ‡ | 53 ± 11*,†, ‡ | |
| Neonatal LPS + sAIH | 37.4 ± 0.3 | 37.5 ± 0.3 | 30 ± 4*,†, ‡ | 31 ± 5*,†, ‡ | 46.3 ± 4.2 | 47.3 ± 5.9 | 7.34 ± 0.03 | 7.31 ± 0.03 | 61 ± 20‡ | 59 ± 20*,†, ‡ | |
| Neonatal Saline + Keto + sAIH | 37.4 ± 0.2 | 37.5 ± 0.2 | 30 ± 2*,†, ‡ | 32 ± 3*,†, ‡ | 42.3 ± 2.2# | 48.9 ± 3.7 | 7.36 ± 0.03 | 7.29 ± 0.03 | 34 ± 8*,†, ‡,¶ | 45 ± 29*,†, ‡ | |
| NeonatalLPS + Keto + sAIH | 37.3 ± 0.3 | 37.6 ± 0.2 | 31 ± 2*,†, ‡ | 32 ± 1*,†, ‡ | 42.2 ± 3.2# | 52.2 ± 5.8 | 7.34 ± 0.03 | 7.28 ± 0.06 | 37 ± 11*,†, ‡,¶ | 43 ± 21*,†, ‡ | |
| Time Controls | 37.6 ± 0.3 | 226 ± 40 | 48.7 ± 4.7 | 7.35 ± 0.04 | 107 ± 13 | ||||||
| Time Controls + Keto | 37.5 ± 0.2 | 258 ± 13 | 45.5 ± 9.3 | 7.37 ± 0.06# | 109 ± 44 | ||||||
| 60 min | |||||||||||
| Neonatal Saline + mAIH | 37.5 ± 0.4 | 37.3 ± 0.1 | 234 ± 28 | 259 ± 22 | 43.4 ± 5.7 | 48.6 ± 3.7 | 7.38 ± 0.05# | 7.35 ± 0.02 | 114 ± 9 | 117 ± 27 | |
| Neonatal LPS + mAIH | 37.5 ± 0.3 | 37.4 ± 0.3 | 253 ± 19 | 268 ± 23* | 42.9 ± 4.4# | 45.2 ± 2.6 | 7.39 ± 0.04# | 7.37 ± 0.01 | 116 ± 14 | 121 ± 25 | |
| Neonatal Saline + Keto + mAIH | 37.3 ± 0.2 | 37.3 ± 0.3 | 262 ± 14 | 257 ± 32 | 42.5 ± 4.9 | 48.7 ± 4.0 | 7.38 ± 0.01 | 7.33 ± 0.04 | 121 ± 13 | 115 ± 11 | |
| NeonatalLPS + Keto + mAIH | 37.6 ± 0.3 | 37.6 ± 0.3 | 257 ± 18 | 276 ± 40* | 41.5 ± 2.7 | 47.8 ± 3.6 | 7.36 ± 0.02 | 7.34 ± 0.06 | 123 ± 11 | 112 ± 18 | |
| Neonatal Saline + sAIH | 37.5 ± 0.3 | 37.4 ± 0.2 | 262 ± 36 | 258 ± 19 | 43.7 ± 5.5 | 47.6 ± 2.9 | 7.37 ± 0.04 | 7.32 ± 0.03 | 135 ± 9 | 115 ± 24 | |
| Neonatal LPS + sAIH | 37.7 ± 0.2 | 37.4 ± 0.2 | 282 ± 16* | 266 ± 18 | 46.2 ± 4.8 | 47.7 ± 4.5 | 7.36 ± 0.02 | 7.35 ± 0.02 | 127 ± 14 | 128 ± 17 | |
| Neonatal Saline + Keto + sAIH | 37.7 ± 0.3 | 37.4 ± 0.3 | 248 ± 42 | 262 ± 9 | 42.3 ± 2.6 | 50.2 ± 4.2 | 7.37 ± 0.03 | 7.32 ± 0.03§ | 105 ± 10 | 109 ± 36 | |
| NeonatalLPS + Keto + sAIH | 37.5 ± 0.2 | 37.4 ± 0.3 | 252 ± 24 | 245 ± 21 | 42.2 ± 3 | 51.2 ± 6.9 | 7.38 ± 0.02 | 7.31 ± 0.04 | 117 ± 14 | 125 ± 19 | |
| NeonatalSaline + CGS-21680 | 37.3 ± 0.3 | 37.6 ± 0.1 | 270 ± 46 | 215 ± 48 | 45.7 ± 4.9 | 47 ± 3.3 | 7.34 ± 0.06 | 7.35 ± 0.04 | 112 ± 30 | 126 ± 21 | |
| Neonatal LPS + CGS-21680 | 37.4 ± 0.4 | 37.4 ± 0.4 | 254 ± 26 | 256 ± 21 | 46.1 ± 3.2 | 46.5 ± 3.2 | 7.37 ± 0.01 | 7.33 ± 0.04 | 107 ± 16 | 101 ± 25 | |
| Time Controls | 37.5 ± 0.3 | 220 ± 25 | 48.4 ± 3.7 | 7.36 ± 0.04 | 102 ± 22 | ||||||
| Time Controls + Keto | 37.6 ± 0.2 | 272 ± 21 | 44.3 ± 8.7 | 7.37 ± 0.07 | 111 ± 48 | ||||||
| CGS-21680 Vehicle Controls | 37.6 ± 0.2 | 271 ± 27 | 45.4 ± 1.6 | 7.36 ± 0.03 | 108 ± 7 | ||||||
-
MAP, mean arterial pressure; PaO2, arterial oxygen pressure; PaCO2, arterial carbon dioxide pressure. Neonatal Saline +mAIH male (n = 7) female (n = 7); Neonatal LPS +mAIH male (n = 12) female (n = 6); Neonatal Saline +Keto + mAIH male (n = 4) female (n = 5); Neonatal LPS +Keto + mAIH male (n = 4) female (n = 5); Neonatal Saline +sAIH male (n = 5) female (n = 4); Neonatal LPS +sAIH male (n = 4) female (n = 4); Neonatal Saline +Keto + sAIH male (n = 5) female (n = 5); Neonatal LPS +Keto + sAIH male (n = 5) female (n = 6); Time Control (n = 5); Time Control + Keto (n = 4). Statistical comparisons: ANOVA-RM, Tukey’s post hoc: * different from Time control within time point, † different from TC +Keto within time point, ‡ different from baseline and 60 min, § different from baseline, # different from female neonatal LPS +Keto + sAIH within time point, ¶ different from female LPS within time point
-
Table 2—source data 1
Physiological parameters.
- https://doi.org/10.7554/eLife.45399.022
Key resources table
| Reagent type (species) or resource | Designation | Source or reference | Identifiers | Additional information |
|---|---|---|---|---|
| Chemical compound, drug | LPS (Lipopolysaccharides from e Coli (0111:B4)) | Sigma Aldrich | L4130 | dissolved in saline, 1 mg/ml |
| Chemical compound, drug | Keto ((S) - (+) - Ketoprofen) | Sigma Aldrich | 471909 | dissolved in 50% ethanol in saline,12.5 mg/ml |
| Chemical compound, drug | CGS-21680 | Sigma Aldrich | C141 | dissolved in DMSO to50 mM for storage in aliquots. Dissolved to 100 uM in 10% DMSO and artificial CSF for injections. |
| Antibody | anti-GFAP (Rabbit polyclonal) | Millipore | (Millipore Cat# AB5804, RRID:AB_2109645) | (1:1000) |
| Antibody | anti-NK1R (Guinea pig polyclonal) | Millipore | (Millipore Cat# AB15810, RRID:AB_11213393) | (1:500) |
| Antibody | anti-IBA1 (Rabbit polyclonal) | Wako | (Wako Cat# 019–19741, RRID:AB_839504) | (1:1000) |
| Antibody | anti-CHaT (Goat polyclonal) | Millipore | (Millipore Cat# AB144P, RRID:AB_2079751) | (1:300) |
| Antibody | donkey-anti-rabbit 647 IgG secondary | Life Technologies | (Molecular Probes Cat# A-31573, RRID:AB_2536183) | (1:1000) |
| Antibody | donkey-anti-goat 555 IgG secondary | Life Technologies | (Molecular Probes Cat# A-21432, RRID:AB_141788) | (1:1000) |
| Antibody | donkey-anti-guinea pig 488 IgG secondary | Jackson Immuno | (Jackson ImmunoResearch Labs Cat# 706-545-148, RRID:AB_2340472) | (1:1000) |
| Sequence-based reagent | IL-1β forward primer | Integrated DNA Technologies | CTG CAG ATG CAA TGG AAA GA | |
| Sequence-based reagent | IL-1β reverse primer | Integrated DNA Technologies | TTG CTT CCA AGG CAG ACT TT | |
| Sequence-based reagent | IL-6 forward primer | Integrated DNA Technologies | GTG GCT AAG GAC CAA GAC CA | |
| Sequence-based reagent | IL-6 reverse primer | Integrated DNA Technologies | GGT TTG CCG AGT AGA CCT CA | |
| Sequence-based reagent | iNOS forward primer | Integrated DNA Technologies | AGG GAG TGT TGT TCC AGG TG | |
| Sequence-based reagent | iNOS reverse primer | Integrated DNA Technologies | TCT GCA GGA TGT CTT GAA CG | |
| Sequence-based reagent | TNFα forward primer | Integrated DNA Technologies | TCC ATG GCC CAG ACC CTC ACA C | |
| Sequence-based reagent | TNFα reverse primer | Integrated DNA Technologies | TCC GCT TGG TGG TTT GCT ACG | |
| Sequence-based reagent | COX2 forward primer | Integrated DNA Technologies | TGT TCC AAC CCA TGT CAA AA | |
| Sequence-based reagent | COX2 reverse primer | Integrated DNA Technologies | CGT AGA ATC CAG TCC GGG TA | |
| Sequence-based reagent | 18 s forward primer | Integrated DNA Technologies | CGG GTG CTC TTA GCT GAG TGT CCC | |
| Sequence-based reagent | 18 s reverse primer | Integrated DNA Technologies | CTC GGG CCT GCT TTG AAC AC |
Additional files
-
Transparent reporting form
- https://doi.org/10.7554/eLife.45399.023
Download links
A two-part list of links to download the article, or parts of the article, in various formats.
Downloads (link to download the article as PDF)
Open citations (links to open the citations from this article in various online reference manager services)
Cite this article (links to download the citations from this article in formats compatible with various reference manager tools)
One bout of neonatal inflammation impairs adult respiratory motor plasticity in male and female rats
eLife 8:e45399.
https://doi.org/10.7554/eLife.45399


