Targeted degradation of aberrant tau in frontotemporal dementia patient-derived neuronal cell models
- Massachusetts General Hospital, Harvard Medical School, United States
- Dana-Farber Cancer Institute, United States
- Harvard Medical School, United States
Figures
Figure 1 with 2 supplements
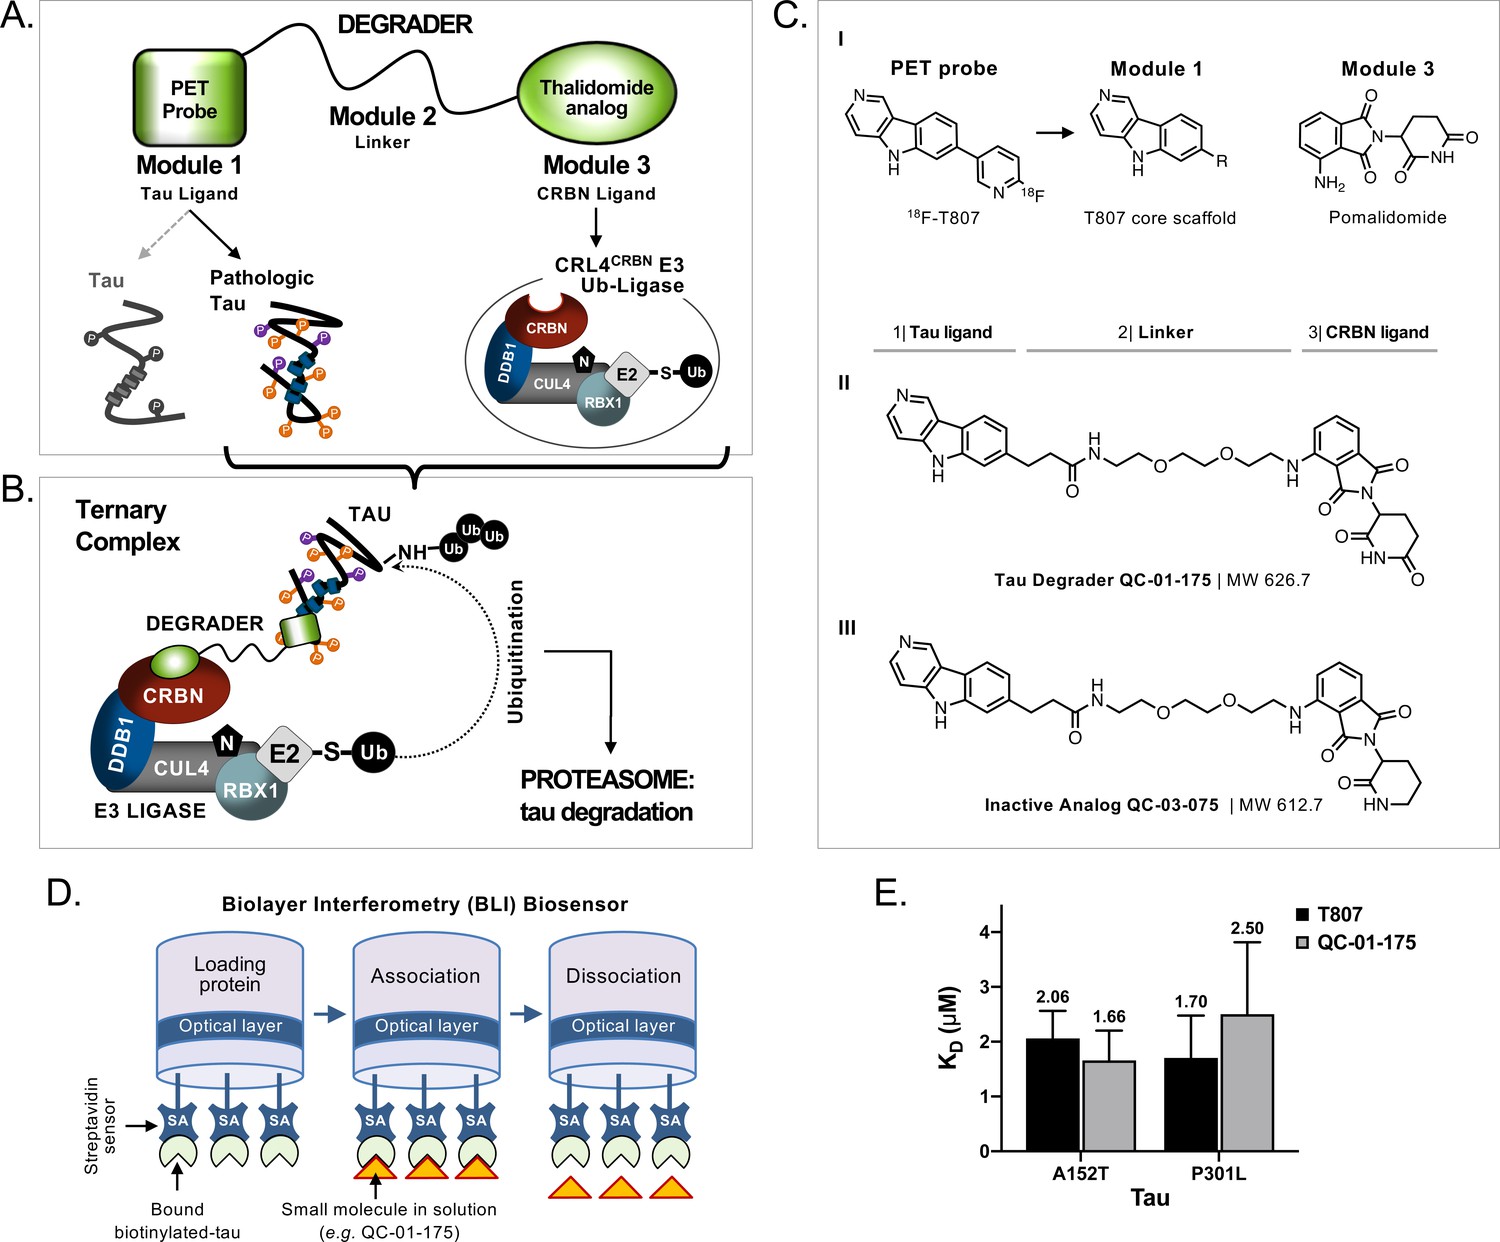
Design and working model for a new hetero-bifunctional tau degrader.
(A) A degrader molecule was designed to preferentially recognize disease-associated forms of tau (Module 1), and simultaneously engage with CRBN in the CRL4CRBN E3 ubiquitin ligase complex (Module 3). (B) Degrader-mediated association of tau with CRL4CRBN and formation of a ternary complex is predicted to mediate tau ubiquitination and degradation by the proteasome. (C) QC-01–175 (I) was synthesized based on the T807 core scaffold for tau recognition, a thalidomide analog E3 ligand (pomalidomide) for CRBN engagement, and a linker designed for maximum target clearance efficiency (II). QC-03–075 is the inactive analog (III). (D) BLI Streptavidin (SA) biosensor assay to measure recombinant tau protein affinity to small molecules (e.g. T807, QC-01–175). (E) BLI results indicate that, in vitro, QC-01–175 binds to variant forms of tau within the same order of magnitude as T807. Bars represent mean KD (μM)±SD (n ≥ 3). Figure 1—figure supplement 1 shows representative BLI sensograms and steady-state graphs for tau WT and each variant affinity to QC-01–175 and control compounds, with respective KD values. Figure 1—figure supplement 2 shows QC-01–175 effect on monoamine oxidase (MAO) activity. The following figure supplements are available for Figure 1.
Figure 1—figure supplement 1
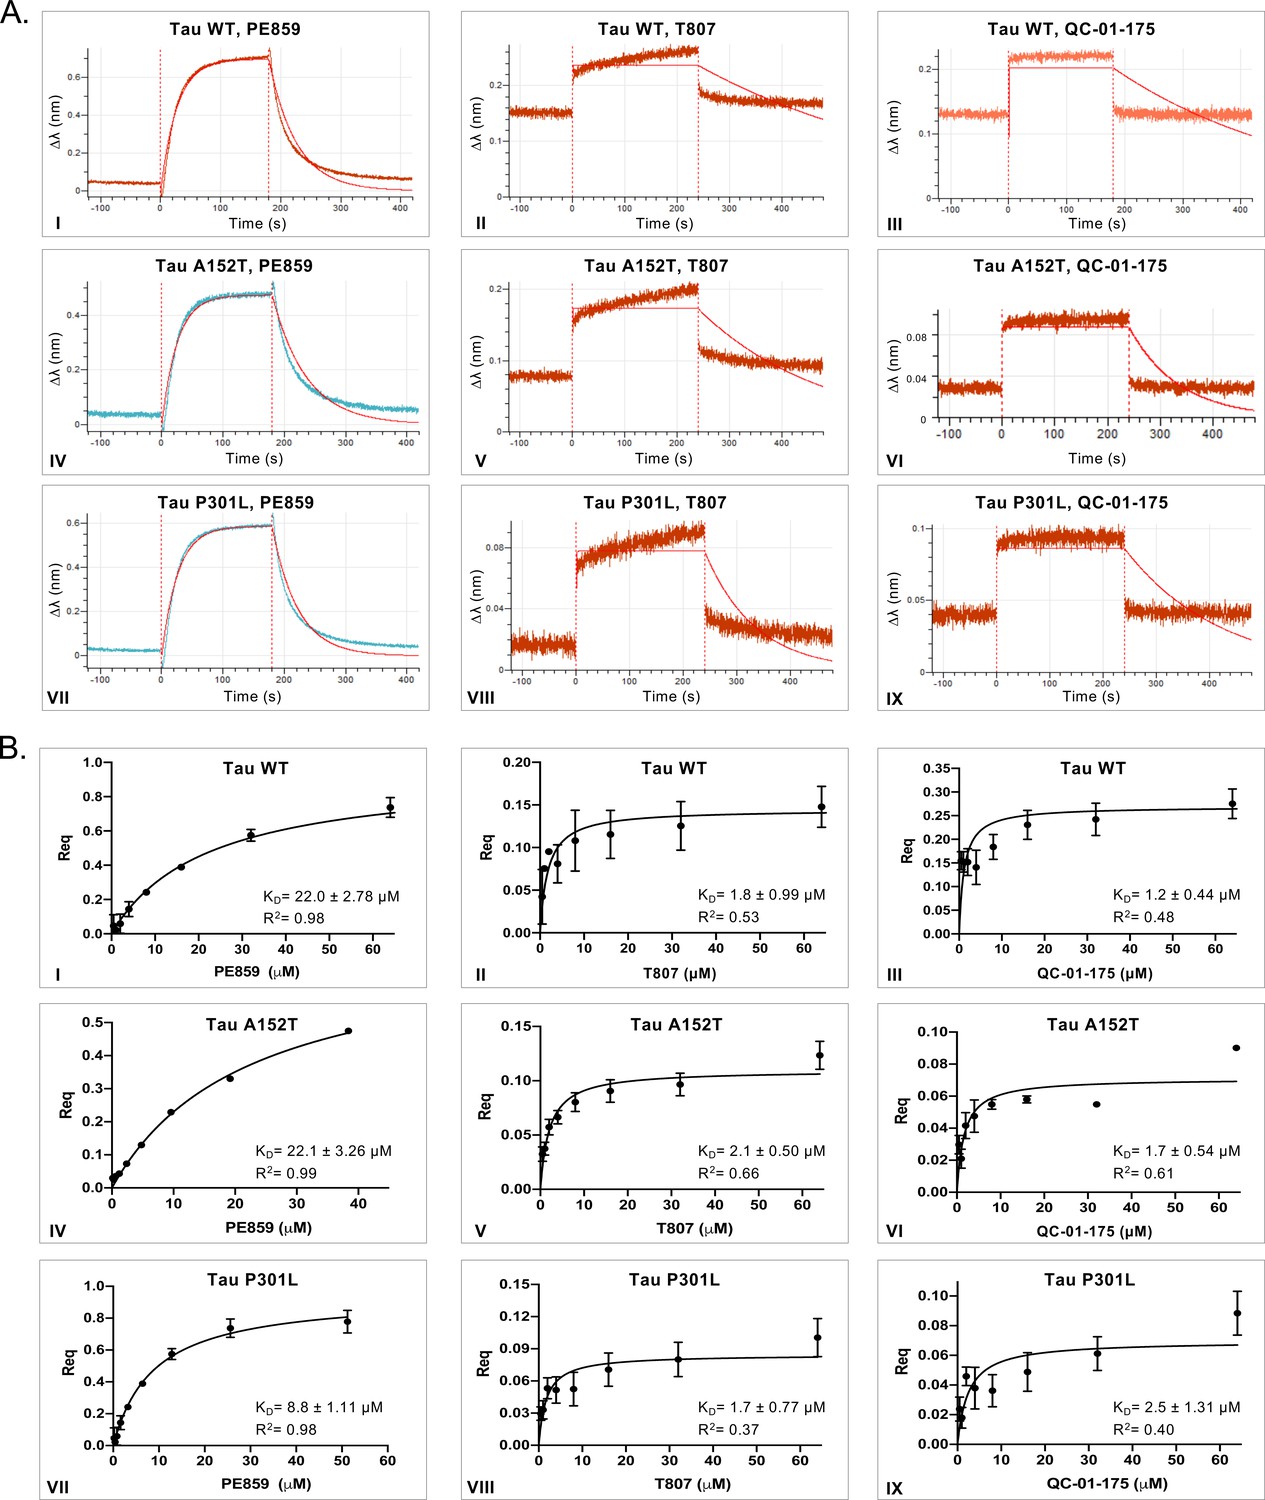
In vitro characterization of tau-binding affinity to QC-01–175 and control compounds.
(A) Association-dissociation curves for BLI biosensor measurements (64 μM compound is shown, except for PE859 at 50 μM) and (B) BLI steady-state graphs, representing human recombinant biotinylated-tau WT (I-III), A152T (IV-VI) and P301L (VII-IX) in vitro binding affinity to compounds PE859 (I, IV, VII), T807 (II, V, VIII) and QC-01–175 (III, VI, IX). Representative curves of n ≥ 3 are shown.
Figure 1—figure supplement 2
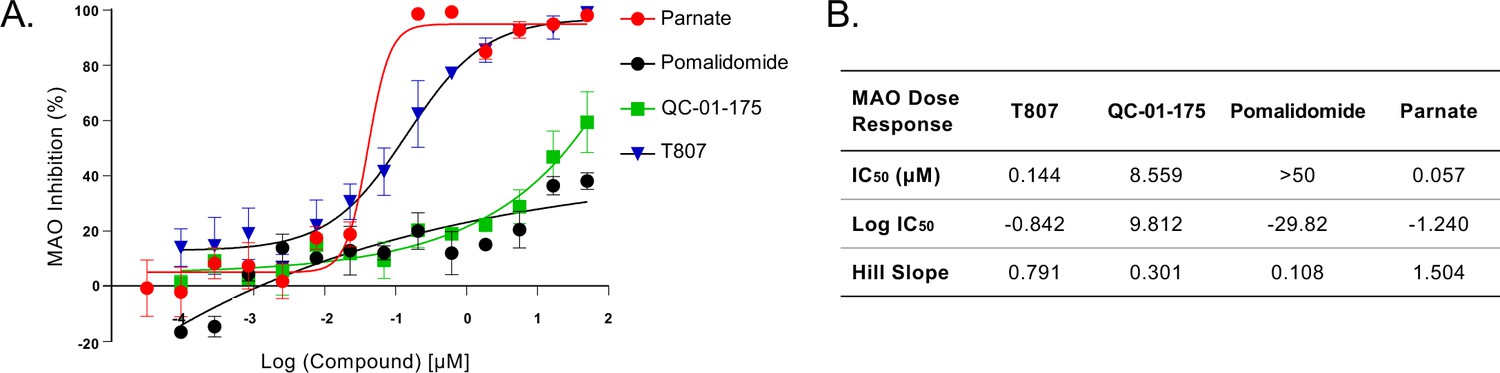
QC-01–175 effect on MAO activity.
(A) Monoamine oxidase activity assay shows that the inhibitory effect of T807 is greater than that of QC-01–175. Parnate is a known MAO inhibitor (positive control) and pomalidomide is used as a negative control. Data points represent mean values of % of MAO inhibition ± SD (n = 3). (B) IC50 values extrapolated from A.
Figure 2 with 2 supplements
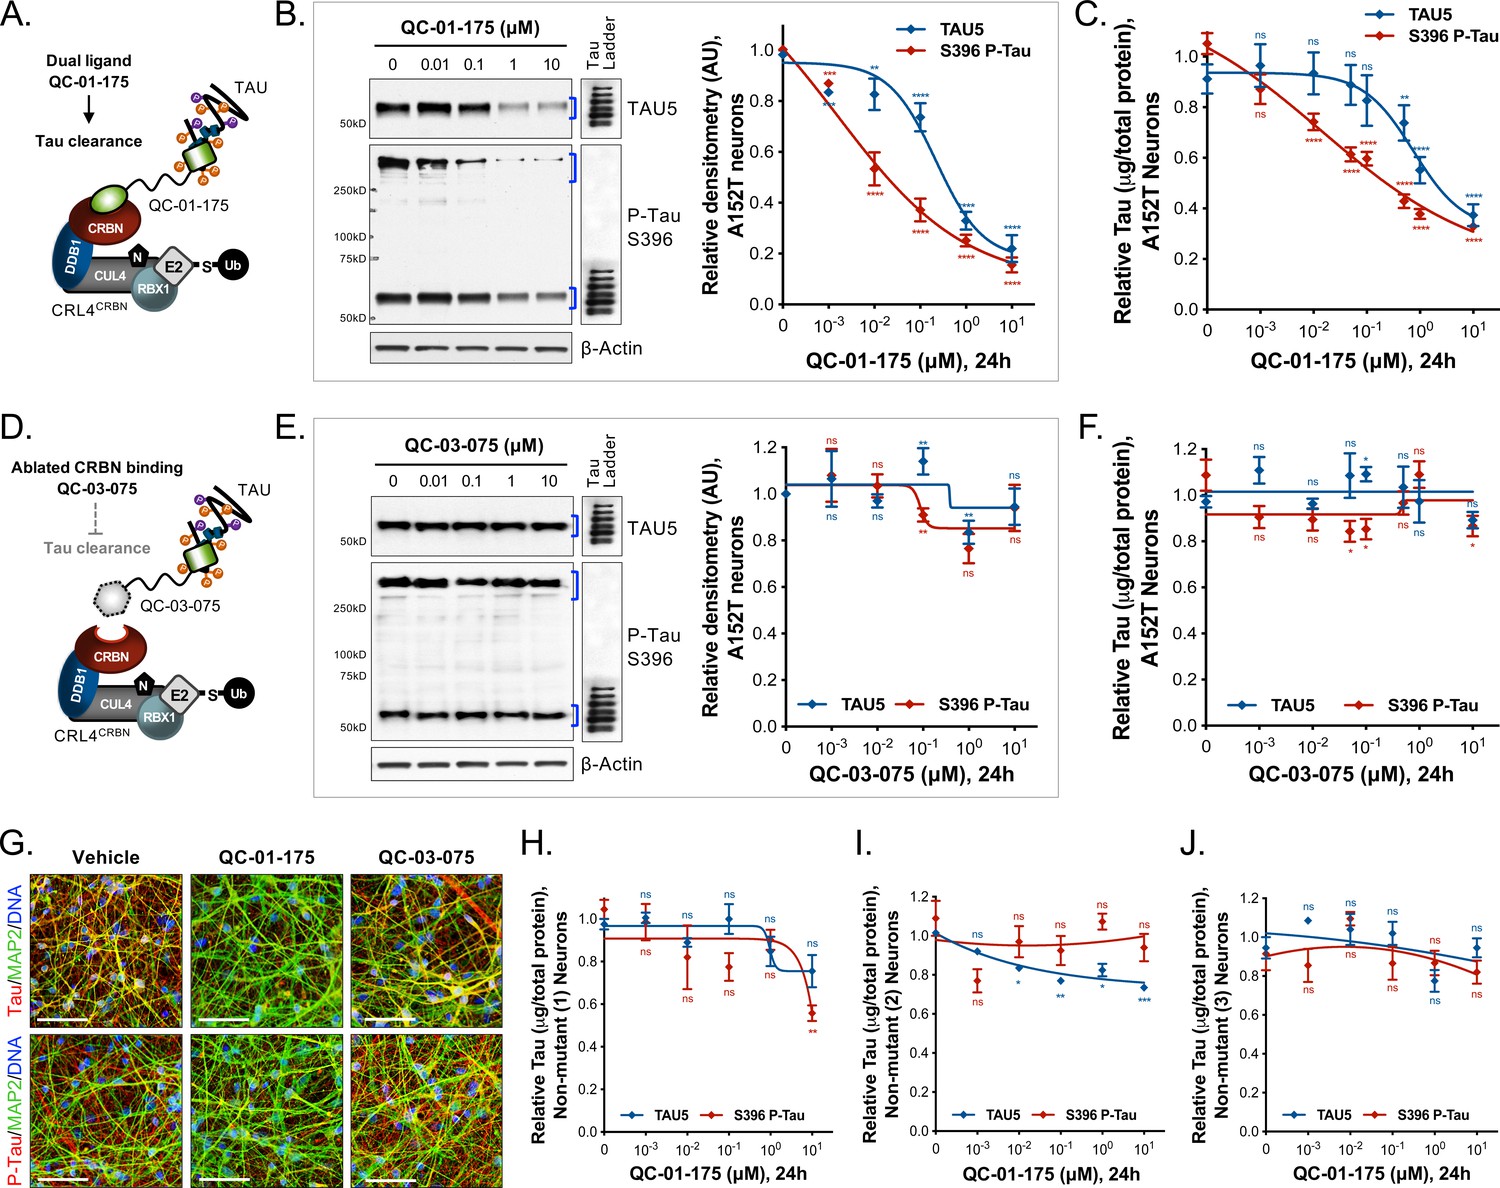
Concentration effect of QC-01–175
(A) on tau protein levels of A152T and control neurons. Analysis of total tau (TAU5) and phospho-tau (S396 P-tau) levels upon treatment by western blot (B) and ELISA (C). Analysis of total tau (TAU5) and phospho-tau (S396 P-tau) levels upon treatment with the negative control QC-03–075 (D), by western blot (E) and ELISA (F). Representative western blots are shown (B, E) with mean densitometry quantification (bands corresponding to brackets)±SEM (n = 3). (C, F) For ELISA, data points represent mean tau levels (μg of total protein) normalized to vehicle-treated ± SEM (n = 4). Both assays show QC-01–175 dose-dependent effect on tau levels, with QC-03–075 minimal effect (~10%). (G) IF of A152T neurons treated with vehicle or 10 μM compound, immuno-probed for total tau (K9JA, red), P-tau (PHF-1, red) and the neuronal marker MAP2 (green), scale bar 50 μm. (H–J) Tau ELISA of control neurons treated with QC-01–175, which did not show a dose-dependent effect. (H) 8330–8-RC1 line; (I) MGH2069-RC1 line; (J) CTR2-L17-RC2 line. Data points represent mean tau levels (μg of total protein) normalized to vehicle-treated ± SEM (n = 3). All neurons were differentiated for 6 weeks and treated with compound for 24 hr. Student T-test between each concentration and vehicle-treated tau levels nsp> 0.05, *p<0.05, **p<0.01, ***p<0.001, ****p<0.0001. Figure 2—figure supplement 1 depicts the variability of degrader effect across biological replicates, by western blot, with an overall 60% to 90% efficacy. Figure 2—figure supplement 2 shows degrader effect in P301L neurons and compares concentration effect across all lines. Figure 2—source data 1 summarizes the information pertaining to each cell line included in this study. Figure 2—source data 2 includes all ELISA data. The following figure supplements are available for Figure 2.
-
Figure 2—source data 1
Human neural cell lines derived from tauopathy-affected (progressive supranuclear palsy, PSP or behavioral variant of FTD, bvFTD) and age-matched unaffected individuals, and MAPT KO line employed in this study.
± refers to heterozygous variant carriers.
- https://doi.org/10.7554/eLife.45457.008
-
Figure 2—source data 2
Numerical description and statistics for data presented in Figure 2 and respective supplement 2 ELISAs.
- https://doi.org/10.7554/eLife.45457.009
Figure 2—figure supplement 1
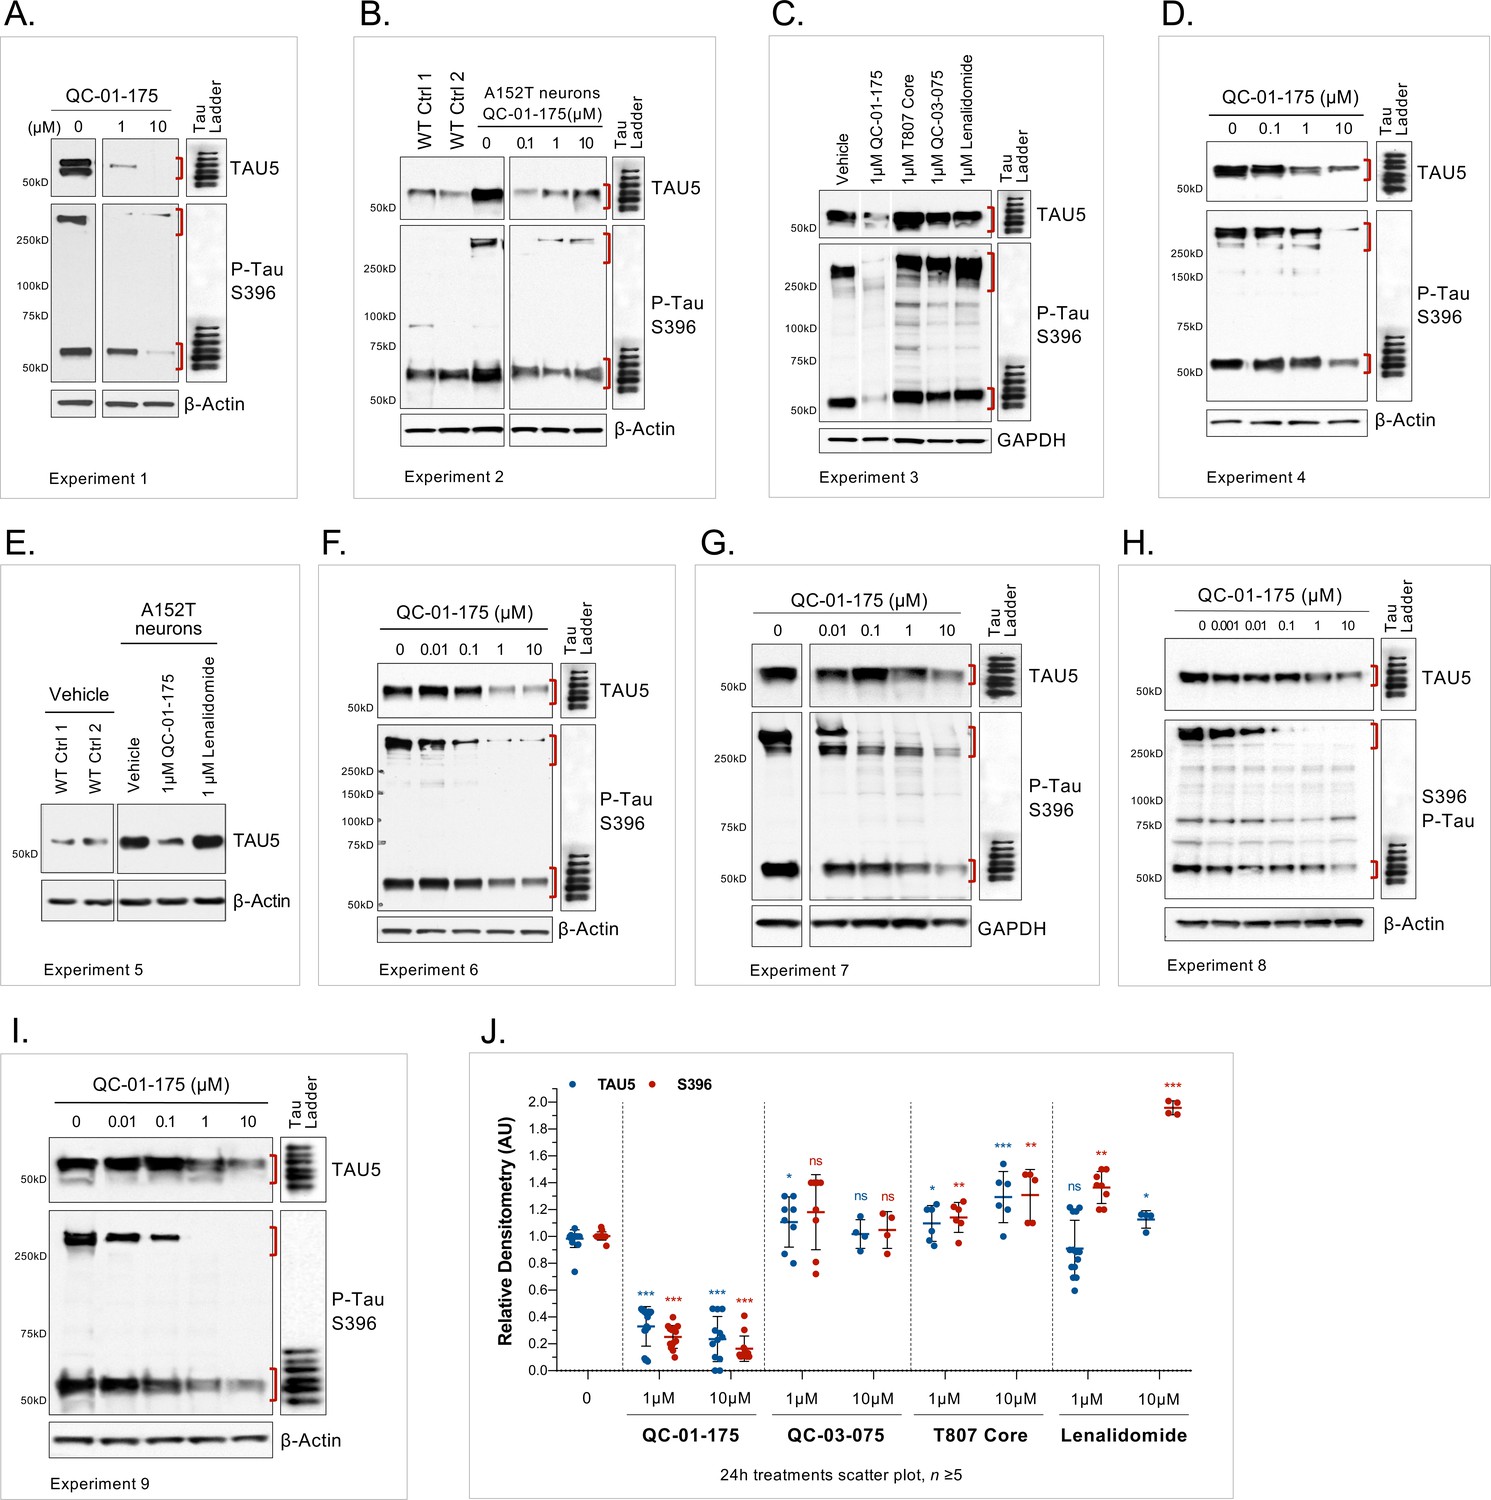
Variability of the effect of QC-01–175 across biological replicates.
(A– I) Western blot analysis of total tau (TAU5) and S396 P-Tau protein, upon 24 hr treatment with QC-01–175 or the negative controls lenalidomide, T807 and QC-03–075. Assessment of the variability in tau clearance across multiple concentrations and nine biological replicates. Red brackets indicate protein bands that were quantified by densitometry. Experiments done with A152T neurons differentiated for 6 weeks, except for (C, E) where age-matched non-mutant controls (1, 8330–8-RC1 and 2, MGH2069-RC1) were included for comparison. (J) Scatter plot of western blot densitometry, for A152T neurons treated with QC-01–175 (n = 9) or the respective negative controls (n ≥ 5), for 24 hr. Lines represent mean tau densitometry ± SD, relative to vehicle-treated. Student T-test for each concentration/antibody relative to vehicle-treated, nsp>0.05, *p≤0.01, **p≤0.001, ***p≤0.0001. Some blot images were cropped for the purpose of this figure only, to exclude samples not included in this manuscript (Silva and Ferguson, Manuscript in preparation, 2019), but all samples in each set were run in the same gel.
Figure 2—figure supplement 2
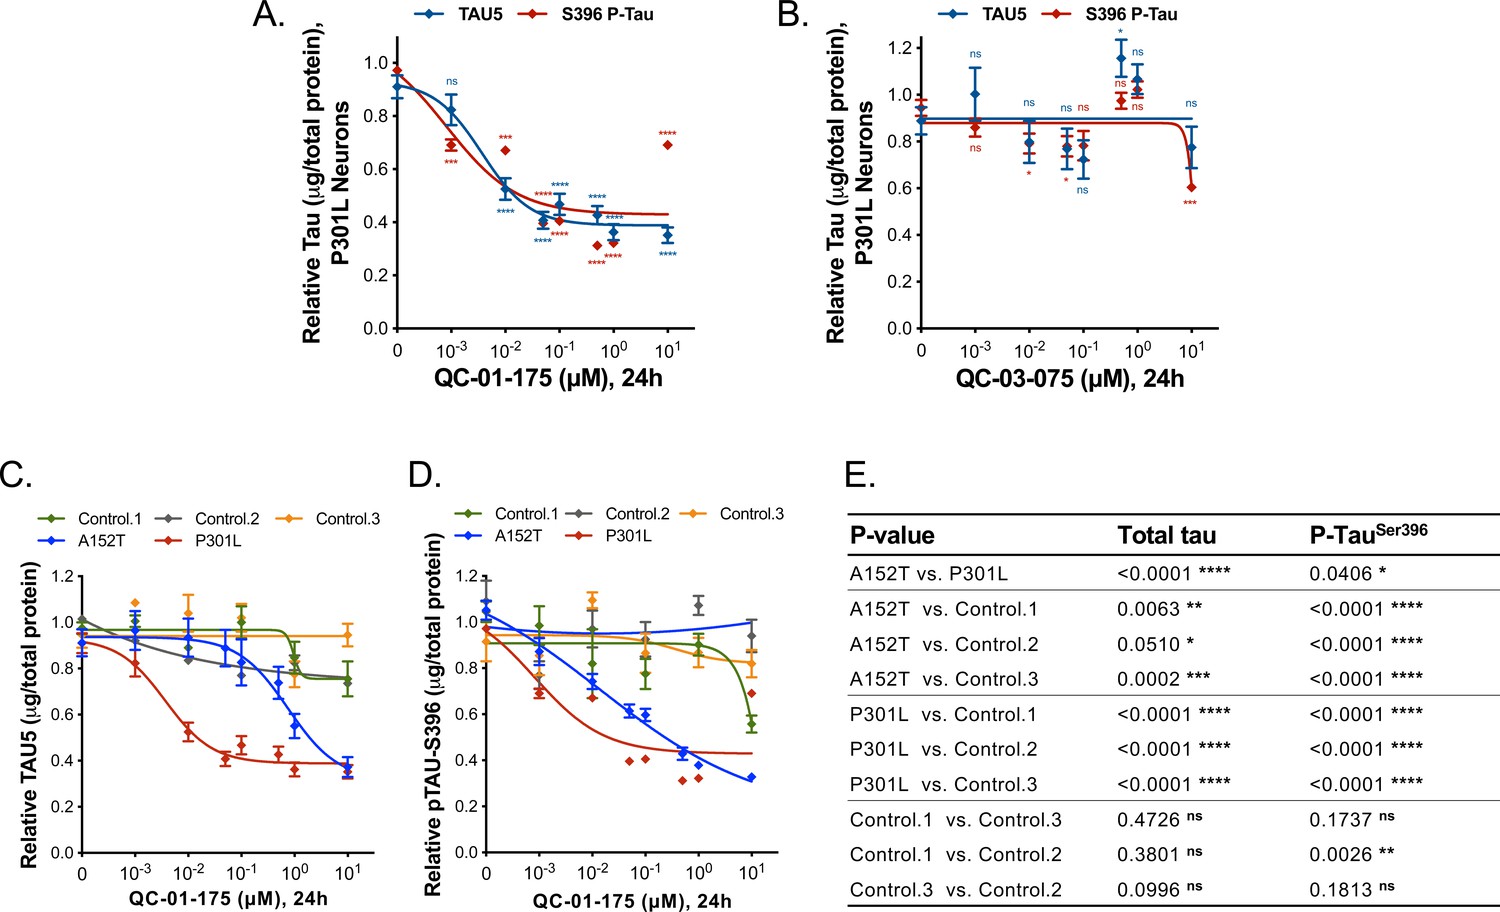
Demonstration of QC-01–175 effect in tau-P301L neurons.
(A-B) Concentration effect of QC-01–175 and QC-03–075 on total tau (TAU5) and S396 P-Tau by ELISA, in P301L neurons at 6 weeks of differentiation. Data points represent mean values of tau normalized to total μg of protein, relative to vehicle-treated ± SD (n = 3). Student T-test between each concentration and vehicle-treated tau levels nsp> 0.05, *p<0.05, ***p<0.001, ****p<0.0001. (C-E) Overview of concentration effect of QC-01–175 24 hr treatment on (C) total tau and (D) S396 P-Tau across all genotypes. Control (1) 8330–8-RC1, control (2) MGH2069-RC1, control (3) CTR2-L17-RC2. Data points represent mean tau levels by ELISA, normalized to total μg of protein and relative to vehicle-treated ± SD (n ≥ 3). (E) Two-Way ANOVA statistical analysis for (C) and (D).
Figure 3 with 1 supplement
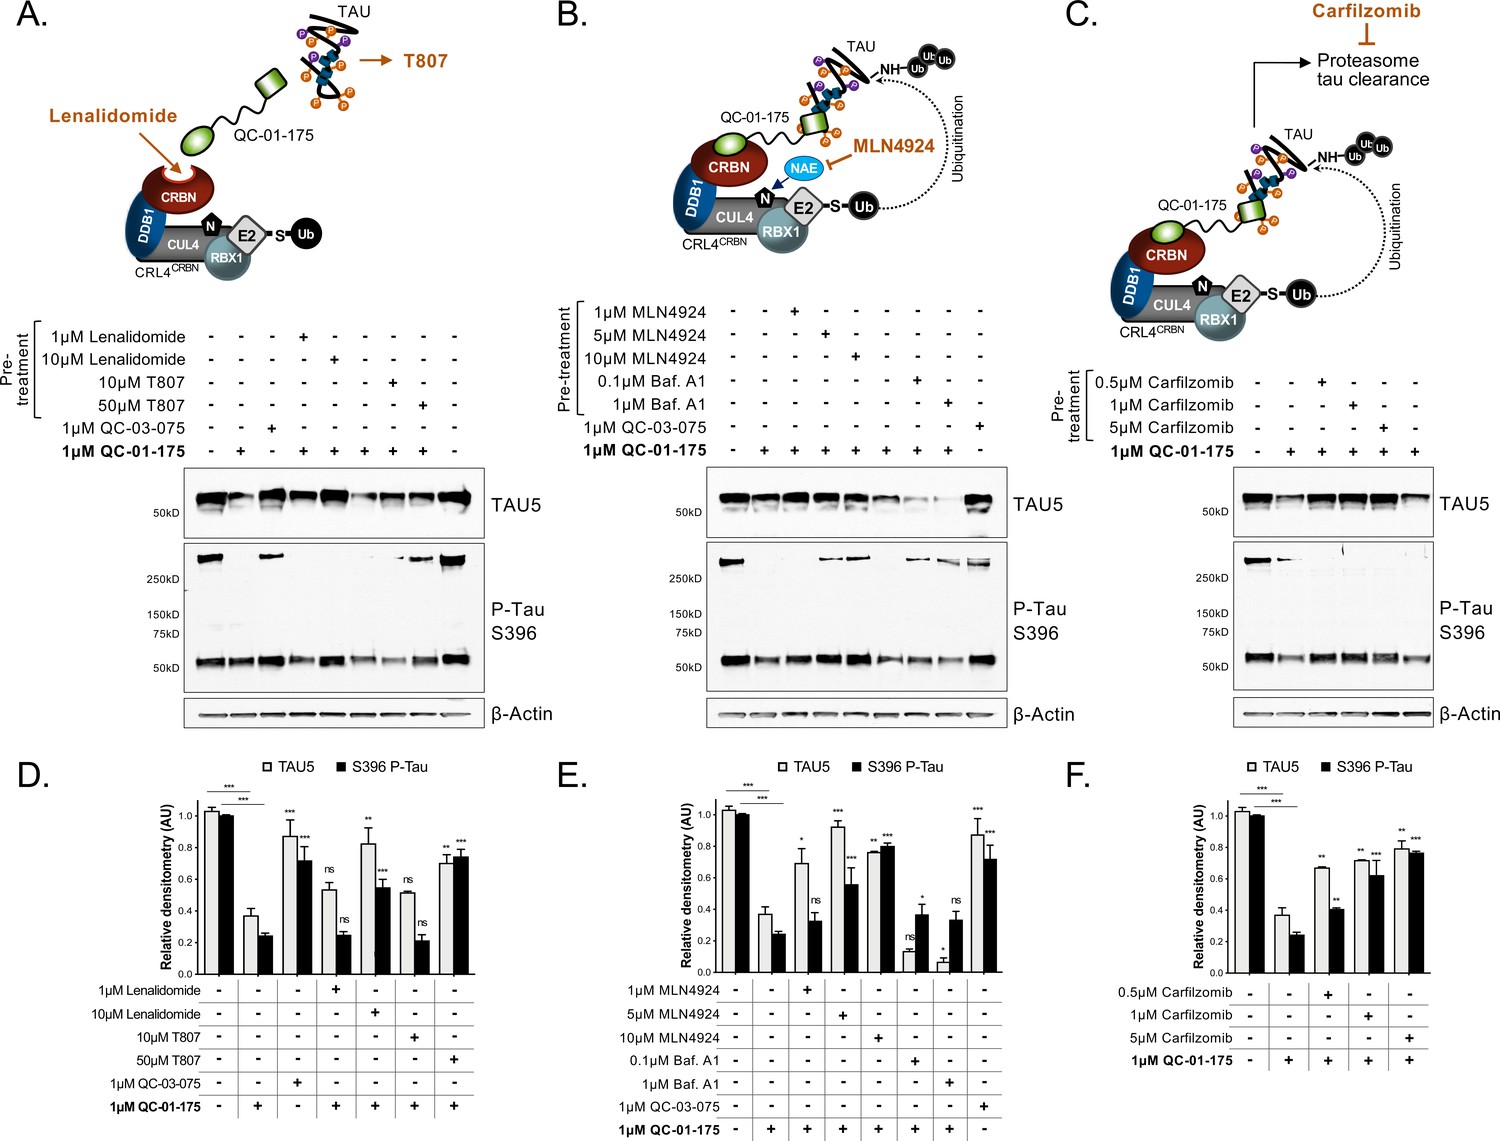
Mechanism of QC-01–175 clearance of tau is CRL4CRBN and UPS-dependent.
Neurons were pre-treated for 6 hr with (A) either CRBN ligand excess lenalidomide or tau ligand excess T807, (B) the NAE inhibitor MLN4924, the autophagy inhibitor Baf.A1, or (C) the proteasome inhibitor carfilzomib; followed by 18 hr treatment with QC-01–175 (or negative control QC-03–075), for a total of 24 hr. Total (TAU5) and P-tau S396 levels were analyzed by western blotting. (A–C) Representative blots are shown. (D–F) Densitometry bars represent tau mean intensity values ± SD (n = 3), relative to vehicle-treated samples. Student T-test of QC-01–175 samples relative to vehicle treated, and the remainder bars show p-value of each pre-treatment relative to QC-01–175 to assess rescue of clearance effect (***p<0.001, **p<0.01, *p<0.05, nsp>0.05). A152T neurons were differentiated for 6 weeks. Figure 3—figure supplement 1 includes additional specificity controls for A152T, P301L and control neuronal models. The following figure supplement is available for Figure 3.
Figure 3—figure supplement 1

Additional specificity controls for QC-01–175-mediated tau clearance.
(A–C) Western blot and densitometry analysis of total tau, S396 P-tau and CRBN upon 24 hr treatment with QC-01–175 or the negative controls QC-03–075, T807 and a thalidomide analog, lenalidomide (1 μM), in (A) A152T, (B) P301L or (C) control-1 8330–8-RC1 neurons. Cropped lanes correspond to samples not included in this manuscript (Silva and Ferguson, Manuscript in preparation, 2019), but all samples in each set were run in the same gel. Densitometry graph bars represent tau or CRBN mean intensity levels ± SD (n = 3), relative to vehicle-treated samples. (D) QC-01–175 had minimal effect on CRBN upon 24 hr treatment. Student T-test of compound-treated samples relative to vehicle-treated ***p<0.001, **p<0.01, *p<0.05, nsp>0.05.
Figure 4

Demonstration of ternary complex formation in A152T neurons upon QC-01–175 treatment, by co-IP and western blot analysis.
Neurons (6-week differentiated) were treated for 4 hr with 1 μM QC-01–175 ± 30 min pre-treatment with proteasome inhibitors (carfilzomib or bortezomib at 5 μM), with the goal of capturing maximum molecular interactions at 4 hr and halting tau clearance. QC-03–075 is a negative control for CRBN binding. (A) Co-IP by DDB1 pulldown and detection of tau in the complex by probing for total tau (TAU5), P-tauS396/S404 (PHF-1), and ubiquitinated proteins (Ubi-1). (B) Co-IP by tau pulldown (TAU5) and detection of CRL4CRBN subunits CRBN, CUL4A and DDB1. Western blot of total tau (K9JA) was used as a control. (C) Control western blot analysis with 3% (10 μg) of IP input confirms the effect of QC-01–175 ± proteasome inhibitors on tau and P-tau S396. Red arrows and brackets indicate the predicted bands for each immunoprobed protein (n = 3).
Figure 5 with 1 supplement
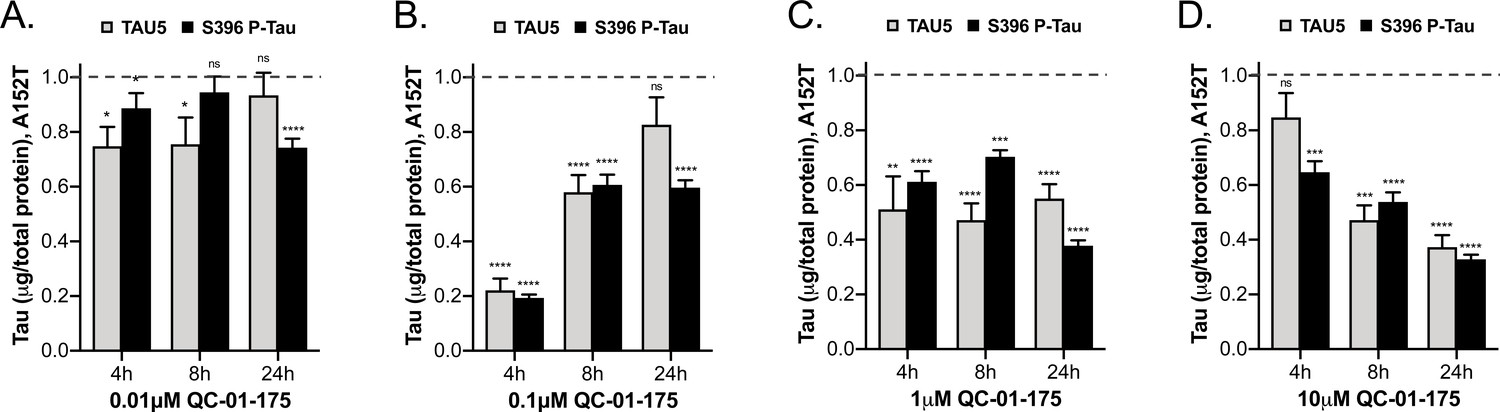
Comparative analysis of the effect of QC-01–175 at (A)
0.01 μM, (B) 0.1 μM, (C) 1 μM, and (D) 10 μM after 4 hr, 8 hr or 24 hr of treatment. Graph bars represent mean levels of total tau (TAU5) and S396 P-tau protein measured by ELISA, normalized to total μg of protein and to vehicle-treated samples ± SEM (n = 3), in A152T 6-week differentiated neurons. Student T-test for each dose/time is relative to vehicle-treated tau levels nsp> 0.05, *p<0.05, **p<0.01, ***p<0.001, ****p<0.0001. Figure 5—figure supplement 1 shows concentration effect curves for QC-01–175 at 4 hr and 8 hr, for all doses tested in A152T and P301L neurons; as well as the 4 hr effect seen by western blot. Figure 5—source data 1 includes all values plotted in the main Figure and supplement. The following figure supplement is available for Figure 5.
-
Figure 5—source data 1
Numerical description and statistics for data presented in Figure 5 and respective supplement 1.
- https://doi.org/10.7554/eLife.45457.014
Figure 5—figure supplement 1
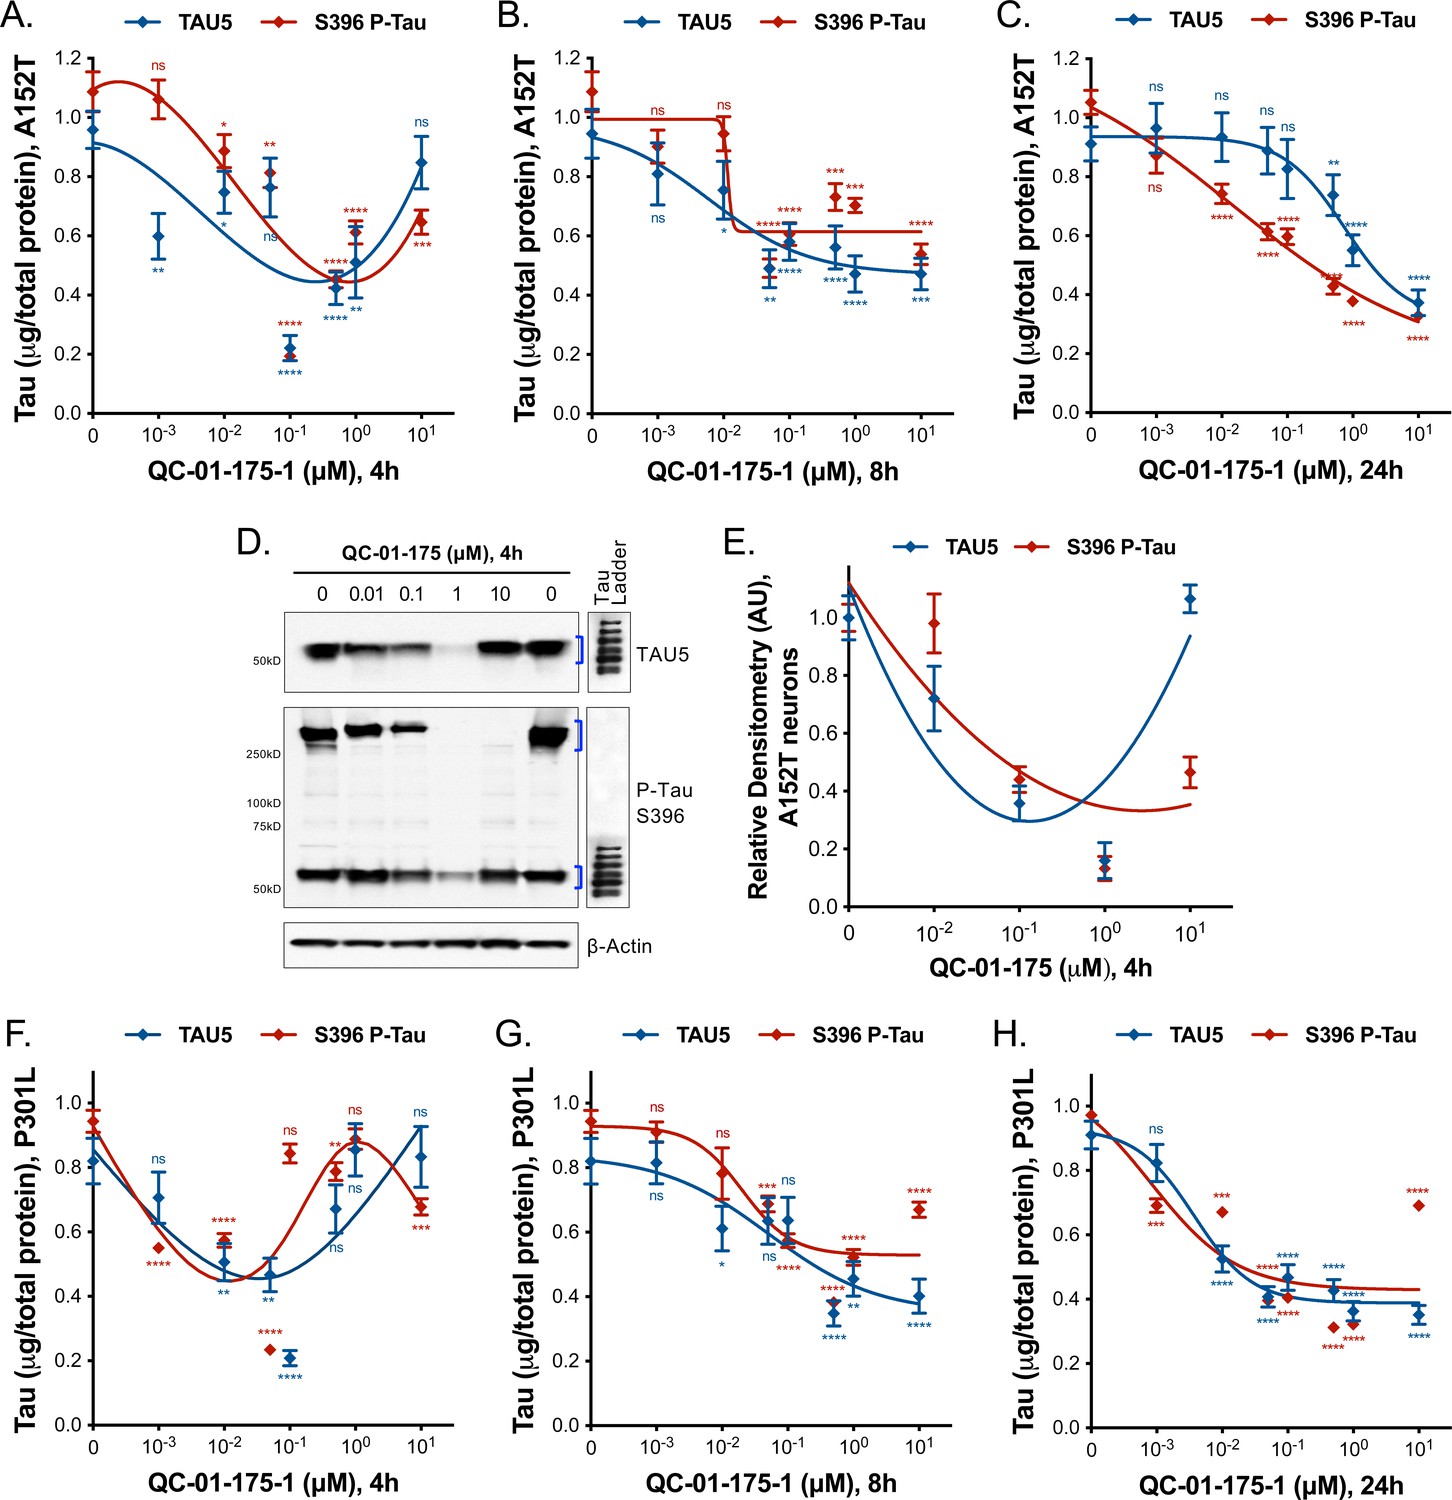
Degrader concentration and time effect on tau, in A152T and P301L neurons.
(A–C) Concentration and time effect of QC-01–175 on total tau (TAU5) and S396 P-tau levels, in A152T 6-week differentiated neurons, treated for (A) a short 4 hr interval, (B) an intermediate 8 hr interval, (C) compared to 24 hr treatment. (D) Concentration effect of QC-01–175 4 hr treatment in A152T neurons, by western blot analysis of total tau (TAU5) and P-tau S396 (representative blot is shown) with mean densitometry quantification (bands corresponding to brackets)±SEM (n = 3). (F–H) Concentration and time effect of QC-01–175 on total tau (TAU5) and S396 P-tau levels, in P301L 6-week differentiated neurons treated for (F) 4 hr, (G) 8 hr and (H) 24 hr. (A-C, F-H) Data points represent mean levels of tau protein measured by ELISA, normalized to total μg of protein and to vehicle-treated ± SEM (n = 3). Student T-test between each dose and vehicle-treated tau levels nsp>0.05, *p<0.05, **p<0.01, ***p<0.001, ****p<0.0001.
Figure 6
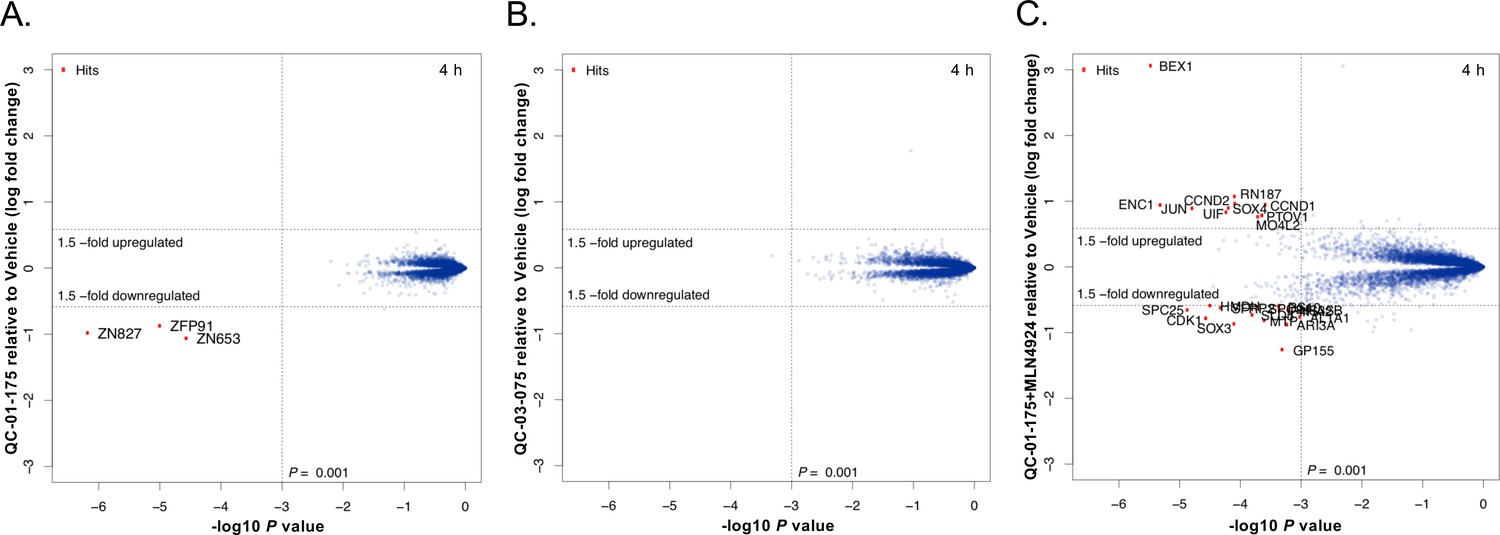
Mass spectrometry-based proteomics to quantify the effect of QC-01–175 treatment on the proteome of A152T neurons.
6-week differentiated neurons were treated for 4 hr with (A) 1 μM of QC-01–175, (B) 1 μM of the negative control QC-03–075, or (C) 10 μM MLN4924 (NAE inhibitor, 30 min pre-treatment) and 1 μM of QC-01–175. Upon degrader QC-01–175 treatment (A), three off-targets were detected within statistical significance, which all belong to known IMiD targets, an effect rescued by the negative control (B) or inhibition of neddylation by MLN4924 (C). Significant hits were assessed by moderated t-test as implemented in the limma package (Ritchie et al., 2015), with the log2 fold change shown on the y-axis, and negative log10 P values on the x-axis (n = 3 for treatment with DMSO, QC-01–175, and QC-03–075, and n = 2 for QC-01–175 + MLN4924).
Figure 7
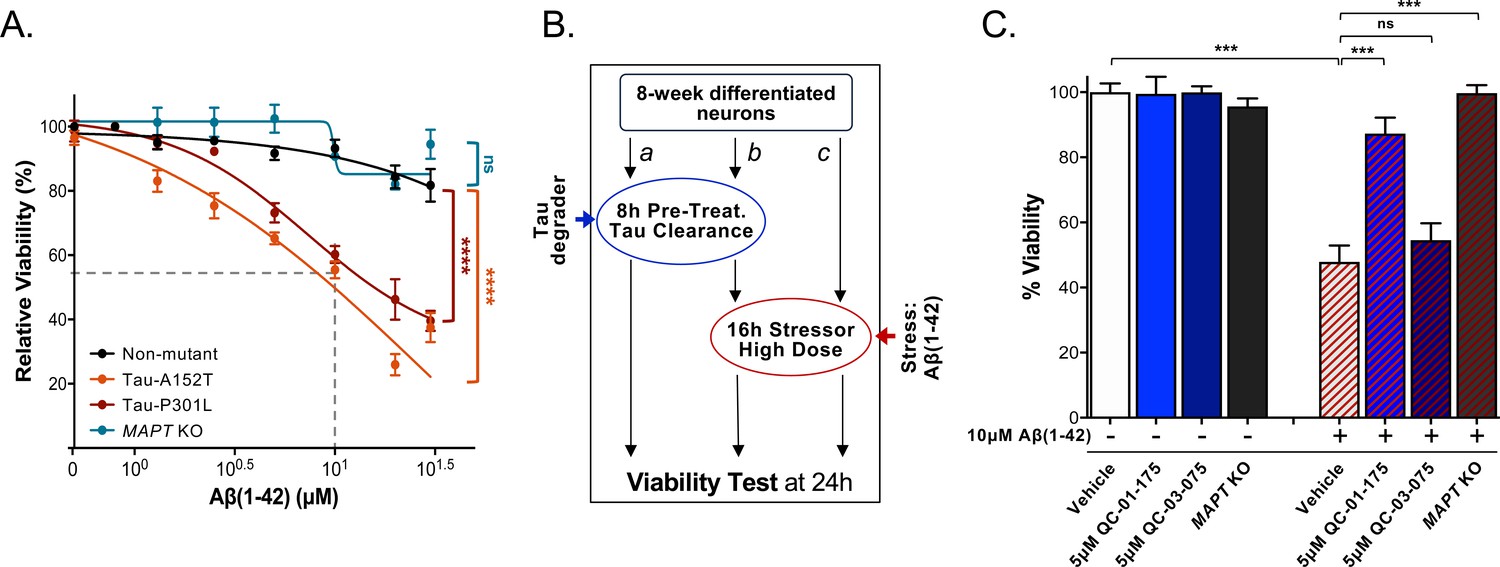
QC-01–175 treatment rescued stress vulnerability of A152T neurons.
(A) Aβ(1-42) proteotoxicity causes concentration- and genotype-dependent loss of neuronal vulnerability, affecting preferentially A152T and P301L neurons, with a rescue by MAPT KO. Data points represent mean viability relative to vehicle-treated neurons (100%)±SEM (n ≥ 3); two-way ANOVA statistical analysis relative to non-mutant control-1 neurons (black curve, 8330–8-RC1), ****p<0.0001, nsP > 0.05. (B) Assay overview to measure effect of the stressor Aβ(1-42) on neuronal viability (c) and potential rescue by pre-treatment with QC-01–175 (b). Effect of 24 hr treatment with QC-01–175 alone was also tested (a). (C) QC-01–175 (light blue-stripe bar) but not the negative control QC-03–075 (dark blue-stripe bar), rescued viability loss caused by Aβ(1-42) (white-stripe bar) in A152T neurons differentiated for 8 weeks, in a comparable manner to genetic MAPT knockout (black-stripe bar). Graph bars represent mean % viability ± SD, relative to vehicle-treated (white) neurons. T-test ***p≤0.001; nsp>0.05 (n = 3). Figure 7—source data 1 includes all values plotted in main Figure 7A and C.
-
Figure 7—source data 1
Numerical description and statistics for data presented.
- https://doi.org/10.7554/eLife.45457.018
Scheme 1
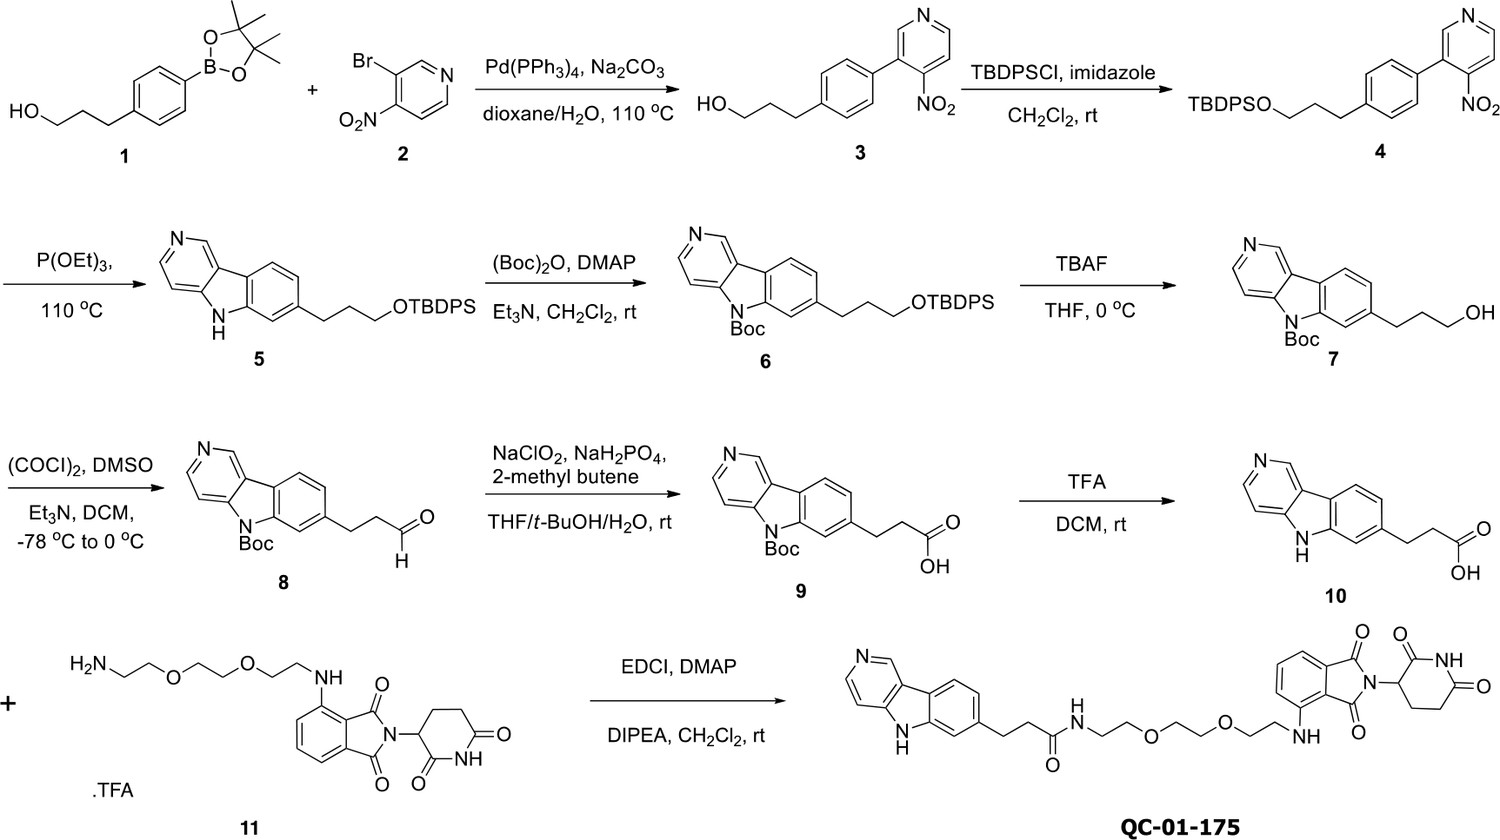
Synthesis route for the tau degrader QC-01-175.
https://doi.org/10.7554/eLife.45457.019
Chemical structure 1
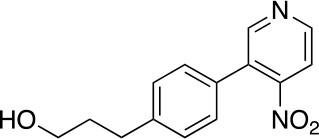
3-(4-(4-nitropyridin-3-yl)phenyl)propan-1-ol (3)
https://doi.org/10.7554/eLife.45457.020
Chemical structure 2

3-(4-(3-((tert-butyldiphenylsilyl)oxy)propyl)phenyl)-4-nitropyridine (4)
https://doi.org/10.7554/eLife.45457.021
Chemical structure 3
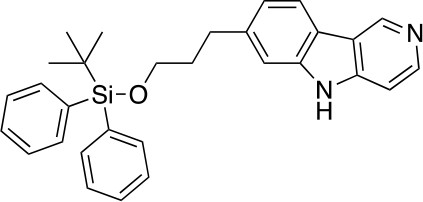
7-(3-((tert-butyldiphenylsilyl)oxy)propyl)-5H-pyrido[4,3-b]indole (5)
https://doi.org/10.7554/eLife.45457.022
Chemical structure 4
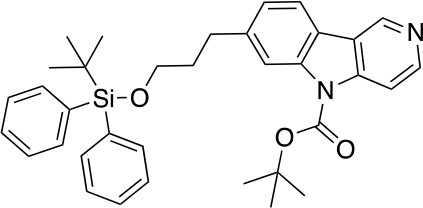
tert-butyl 7-(3-((tert-butyldiphenylsilyl)oxy)propyl)-5H-pyrido[4,3-b]indole-5-carboxylate (6)
https://doi.org/10.7554/eLife.45457.023
Chemical structure 5

tert-butyl 7-(3-hydroxypropyl)-5H-pyrido[4,3-b]indole-5-carboxylate (7)
https://doi.org/10.7554/eLife.45457.024
Chemical structure 6
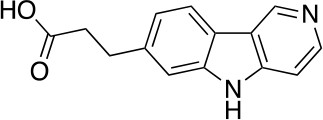
3-(5H-pyrido[4,3-b]indol-7-yl)propanoic acid (10)
https://doi.org/10.7554/eLife.45457.025
Chemical structure 7
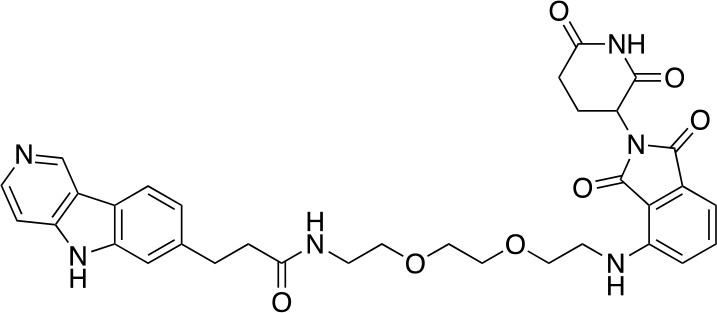
QC-01-175
https://doi.org/10.7554/eLife.45457.026
Chemical structure 8
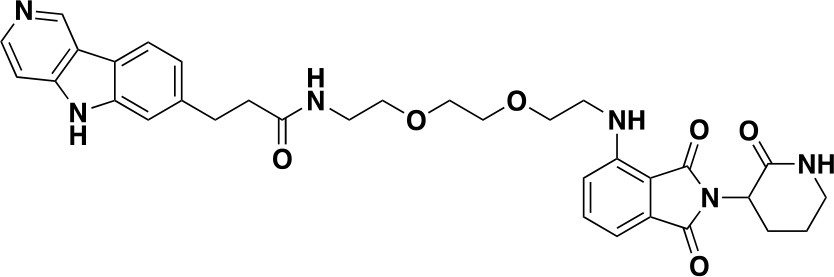
QC-03-075: Was prepared according to Scheme 1.
https://doi.org/10.7554/eLife.45457.027Tables
Key resources table
| Reagent type (species) or resource | Designation | Source or reference | Identifiers | Additional information |
|---|---|---|---|---|
| Cell line (H. sapiens) | 8330–8-RC1 | Silva et al. (2016) Stem Cell Reports. | Figure 2—source data 1. Human iPSC-derived NPC line, non-mutant tau. Original fibroblasts GM08330 from Coriell Institute for Medical Research. | |
| Cell line (H. sapiens) | MGH2069-RC1 | Seo et al. (2017) J. Neuroscience. Manuscript in preparation. | Figure 2—source data 1. Human iPSC-derived NPC line, non-mutant tau. Original fibroblasts MGH-2069 from Massachusetts General Hospital Frontotemporal Dementia Clinic, Massachusetts General Hospital Neurodegeneration Repository. | |
| Cell line (H. sapiens) | CTR2-L17-RC2 | Almeida et al., 2012 Cell Reports. Silva et al. (2016) Stem Cell Reports | Figure 2—source data 1. Human iPSC-derived NPC line, non-mutant tau. | |
| Cell line (H. sapiens) | FTD19-L5-RC6 | Silva et al. (2016) Stem Cell Reports | Figure 2—source data 1. Human iPSC-derived NPC line, tau-A152T (NCBI RefSeq NM_001123066; rs143624519). | |
| Cell line (H. sapiens) | FTD19-L5-RC6;MAPT-KO | Silva et al. (2016) Stem Cell Reports | Figure 2—source data 1. Human iPSC-derived NPC FTD19-L5-RC6 line, CRISPR/Cas9-engineered MAPT knockout. | |
| Cell line (H. sapiens) | MGH2046-RC1 | Seo et al. (2017) J. Neuroscience. Manuscript in preparation. | Figure 2—source data 1. Human iPSC-derived NPC line, tau-P301L (NCBI RefSeq NM_001123066; rs63751273). Original fibroblasts MGH-2046 from Massachusetts General Hospital Frontotemporal Dementia Clinic, Massachusetts General Hospital Neurodegeneration Repository. | |
| Antibody | TAU5 | Invitrogen | Cat. AHB0042 RRID:AB_2536235 | WB 1:1000 |
| Antibody | TAU5 | AbCam | Cat. ab80579 RRID:AB_1603723 | Co-IP |
| Antibody | Tau K9JA | DAKO, Agilent | Cat. A002401-2 | IF 1:1000, WB 1:10,000 |
| Antibody | P-Tau S396 | Invitrogen | Cat. 44752G RRID:AB_1502108 | WB 1:1000 |
| Antibody | P-Tau PHF-1 | Dr. Peter Davies | Albert Einstein College of Medicine, NY | IF 1:400 |
| Antibody | MAP2 | Chemicon, Millipore | Cat. AB5543 RRID:AB_571049 | IF 1:1000 |
| Antibody | DDB1 | AbCam | Cat. ab109027 RRID:AB_10859111 | WB 1:50,000/Co-IP |
| Antibody | CUL4A | Cell Signaling Technology | Cat. 2699 RRID:AB_2086563 | WB 1:1000 |
| Antibody | CRBN | ProteinTech | Cat. 11435–1-AP RRID:AB_2085739 | WB 1:500 |
| Antibody | Ubiquitin, Ubi-1 | Millipore | Cat. MAB1510 RRID:AB_2180556 | WB 1:500 |
| Antibody | β-Actin | Sigma-Aldrich | Cat. A1978 RRID:AB_476692 | WB 1:10,000 |
| Antibody | GAPDH | AbCam | Cat. ab8245 RRID:AB_2107448 | WB 1:5000 |
| Antibody | AlexaFluor-488 2° antibody | Life Technologies | Cat. A11039 RRID:AB_142924 | IF 1:500 |
| Antibody | AlexaFluor-594 2° antibody | Life Technologies | Cat. A11012 RRID:AB_141359 | IF 1:500 |
| Antibody | AlexaFluor-594 2° antibody | Life Technologies | Cat. A11032 RRID:AB_141672 | IF 1:500 |
| Antibody | Anti-mouse IgG, HRP-linked | Cell Signaling Technology | Cat. 7076S RRID:AB_330924 | Western blotting, 1:4000 |
| Antibody | Anti-rabbit IgG, HRP-linked | Cell Signaling Technology | Cat. 7074S RRID:AB_2099233 | Western blotting, 1:4000 |
| Antibody | Hoechst 33342 | Invitrogen | Cat. H3570 | IF Nuclear stain, 1:1000 |
| Peptide, Recombinant Protein | Tau-441(WT), Biotinylated | SignalChem | Cat. T08-54BN Lot. H2681-10 | Human recombinant protein expressed in E. coli cells. |
| Peptide, Recombinant Protein | Tau-441(A152T) Protein | SignalChem | Cat. T08-56VN Lot. B2157-7 | Human recombinant protein expressed in E. coli cells, tag-free. Accession no. P10636-8. |
| Peptide, Recombinant Protein | Tau-441(P301L) Protein | SignalChem | Cat. T08-56FN Lot. O917-2 | Human recombinant protein expressed in E. coli cells, tag-free. Accession no. P10636-8. |
| Peptide, Recombinant Protein | Aβ(1-42) | Enzo Lifesciences | Cat. ALX-151–002 | CAS No. 107761-42-2 |
| Commercial Assay, Kit | EZ-Link NHS-PEG4-Biotinylation Kit | Thermo Fisher Scientific | Cat. 21455 | |
| Commercial Assay, Kit | MAO-Glo Assay Kit | Promega | Cat. V1401 | |
| Commercial Assay, Kit | Pierce BCA Protein Assay Kit | Thermo Fisher Scientific | Cat. 23227 | |
| Commercial Assay, Kit | Human Total Tau ELISA | Invitrogen | Cat. KHB0041 | |
| Commercial Assay, Kit | P-Tau[pS396] Human ELISA | Invitrogen | Cat. KHB7031 | |
| Commercial Assay, Kit | ELISA Compatible Lysis Buffer | Invitrogen | Cat. FNN0011 | |
| Commercial Assay, Kit | Immunoprecipitation Kit Dynabeads Protein G | Novex, Life Technologies | Cat. 10007D | |
| Commercial Assay, Kit | Pierce IP Lysis Buffer | Thermo Fisher Scientific | Cat. 87787 | |
| Commercial Assay, Kit | Tandem mass tag (TMT) reagents | Thermo Fisher Scientific | Cat. A34807 | |
| Commercial Assay, Kit | AlamarBlue Cell Viability Reagent | Thermo Fisher Scientific | Cat. DAL1025 | |
| Chemical Compound, Drug | T807 (AV-1451) | MedChem Express | Cat. HY-101184 | CAS No. 1415379-56-4 |
| Chemical Compound, Drug | T807 core scaffold | This paper | (Intermediate 10) | Methods, Synthetic methods general protocols. Figure 1C. |
| Chemical Compound, Drug | Pomalidomide | Sigma Aldrich | Cat. P0018 | CAS No. 19171-19-8 |
| Chemical Compound, Drug | Lenalidomide | Sigma Aldrich | Cat. 901558 | CAS No. 191732-72-6 |
| Chemical Compound, Drug | QC-01–175 | This paper | Methods, Synthetic methods general protocols. Figure 1C. | |
| Chemical Compound, Drug | QC-03–075 | This paper | Methods, Synthetic methods general protocols. Figure 1C. | |
| Chemical Compound, Drug | MLN4924 | MedChem Express | Cat. HY-70062 | CAS No. 905579-51-3 |
| Chemical Compound, Drug | Bafilomycin A1 | Enzo LifeSciences | Cat. BML-CM110 | CAS No. 88899-55-2 |
| Chemical Compound, Drug | Carfilzomib | MedChem Express | Cat. HY-10455 | CAS No. 868540-17-4 |
| Chemical Compound, Drug | Bortezomib | Selleckchem | Cat. S1013 | CAS No. 179324-69-7 |
| Chemical Compound, Drug | PE859 | MedChem Express | Cat. HY-12662 | CAS No. 1402727-29-0 |
| Chemical Compound, Drug | Parnate (Tranylcypromine) | Sigma-Aldrich | Cat. P8511 | CAS No. 1986-47-6 |
| Chemical Compound, Drug | Protease inhibitor cocktail | Roche | Cat. 04 693 124 001 | |
| Chemical Compound, Drug | Phosphatase inhibitor cocktail 2 | Sigma-Aldrich | Cat. P5726 | |
| Software, Algorithm | Data Acquisition HT 11.0 | ForteBio (www.fortebio.com/octet-software.html) | Version 11 (BLI Analysis and KD calculation) | |
| Software, Algorithm | Adobe Photoshop CS5 | Adobe Photoshop (www.adobe.com/Photoshop) | Version 12.0.4 (Histogram function, western blots densitometry) | |
| Software, Algorithm | GraphPad Prism | GraphPad Prism (www.graphpad.com) | Version 8 | |
| Software, Algorithm | Proteome Discoverer 2.2 | Thermo Fisher Scientific | RRID:SCR_014477 | Version 2.2 |
| Software, Algorithm | R framework | Team RCR: A Language and Environment for Statistical Computing http://www.R-project.org/; accessed Nov. 1, 2017 | R Version 3.5.1 – Feather Spray | |
| Software, Algorithm | Statistical Analysis Limma Package (R framework) | Bioconductor | Ritchie et al. (2015) Nucleic Acids Res. | |
| Other | Octet Red384 Instrument | ForteBio | https://www.fortebio.com/octet-red384.html | |
| Other | IN Cell Analyzer 6000 Cell Imaging System | GE Healthcare Life Sciences | ||
| Other | EnVision Multilabel Plate Reader | Perkin Elmer | ||
| Other | HPLC | Waters 2489/2545 | ||
| Other | UPLC | Waters Aquity I UPLC | ||
| Other | HPLC | Agilent 1260 Infinity II LC System | ||
| Other | Orbitrap Fusion Lumos mass spectrometer | Thermo Fisher Scientific | IQLAAEGAAPFADBMBHQ | |
| Other | Proxeon EASY-nLC 1200 LC pump | Thermo Fisher Scientific | LC140 | |
| Other | EasySpray ES803 75 μm inner diameter microcapillary column | Thermo Fisher Scientific | ES803 |
Additional files
-
Supplementary file 1
1H NMR Spectra of QC-01-175.
- https://doi.org/10.7554/eLife.45457.028
-
Supplementary file 2
1H NMR Spectra of QC-03-075.
- https://doi.org/10.7554/eLife.45457.029
-
Supplementary file 3
UPLC chromatogram and mass spectra of QC-01-175.
- https://doi.org/10.7554/eLife.45457.030
-
Supplementary file 4
UPLC chromatogram and mass spectra of QC-03-075.
- https://doi.org/10.7554/eLife.45457.031
-
Transparent reporting form
- https://doi.org/10.7554/eLife.45457.032
Download links
A two-part list of links to download the article, or parts of the article, in various formats.
Downloads (link to download the article as PDF)
Open citations (links to open the citations from this article in various online reference manager services)
Cite this article (links to download the citations from this article in formats compatible with various reference manager tools)
Targeted degradation of aberrant tau in frontotemporal dementia patient-derived neuronal cell models
eLife 8:e45457.
https://doi.org/10.7554/eLife.45457


