Opportunities for improved surveillance and control of dengue from age-specific case data
- University of California, San Francisco, United States
- Institut Pasteur, France
- CNRS, URA3012, France
- Johns Hopkins University, United States
- University of Florida, United States
Figures
Figure 1 with 2 supplements
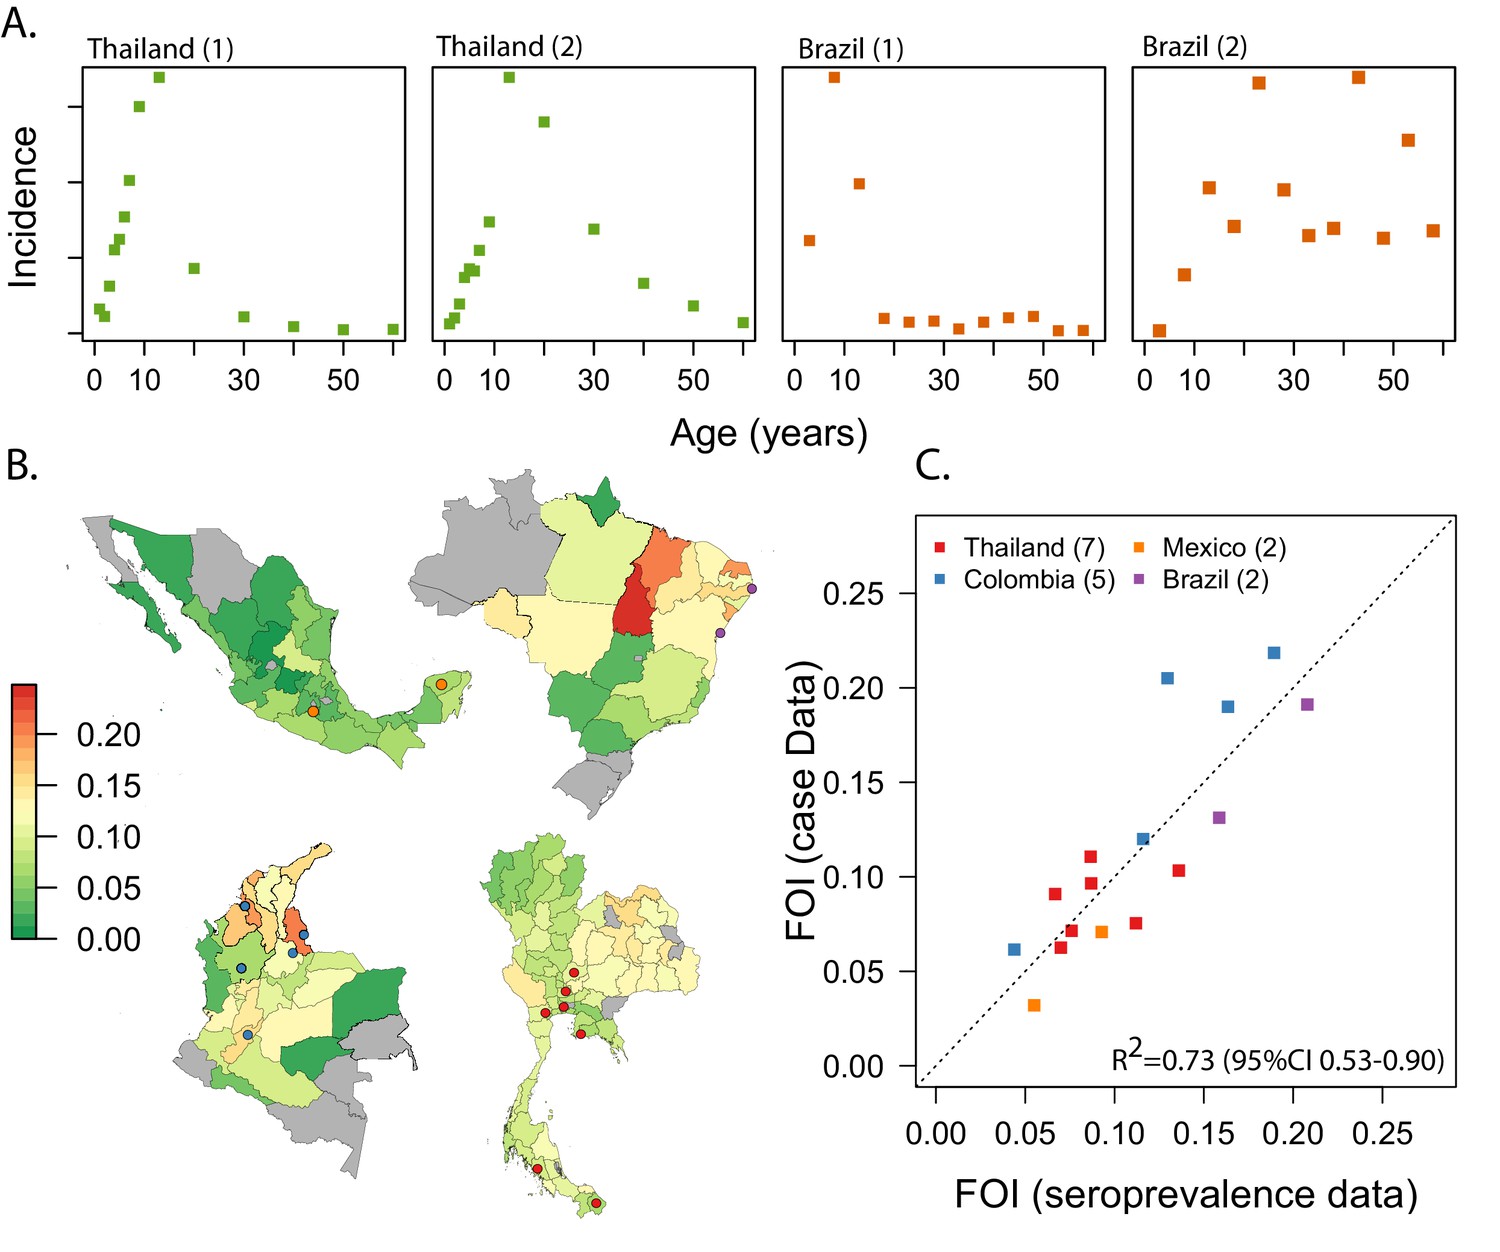
Estimating FOI from age-specific incidence data in Thailand, Colombia, Brazil and Mexico.
(A) Examples of the age-specific incidence of dengue observed in two settings with very high endemic transmission (Thailand 1- Udon Thani, Thailand; Brazil 1 Pernambuco, Brazil) and two settings with lower and very low transmission (Thailand 2 = Chiang Mai, Thailand; Brazil 2 = Parana, Brazil). (B) Maps of our estimates of the FOI for the four countries. (C) Correlation between our estimates of the force of infection, with estimates derived from age-stratified serological data (gold standard) for 16 settings where we had both types of data (Thailand: Rayong (Rodríguez-Barraquer et al., 2014); Bangkok (Imai et al., 2015); Ratchaburi (Imai et al., 2015); Lop Buri, Narathiwat, Trang, Ayuttayah (Vongpunsawad et al., 2017). Brazil: Pernambuco (Rodriguez-Barraquer et al., 2011); Salvador (Wilson et al., 2007). Colombia (unpublished). Mexico: Morelos (Amaya-Larios et al., 2014), Yucatan (Hladish et al., 2016). The locations of the specific cities are shown in the maps in panel B.
Figure 1—figure supplement 1
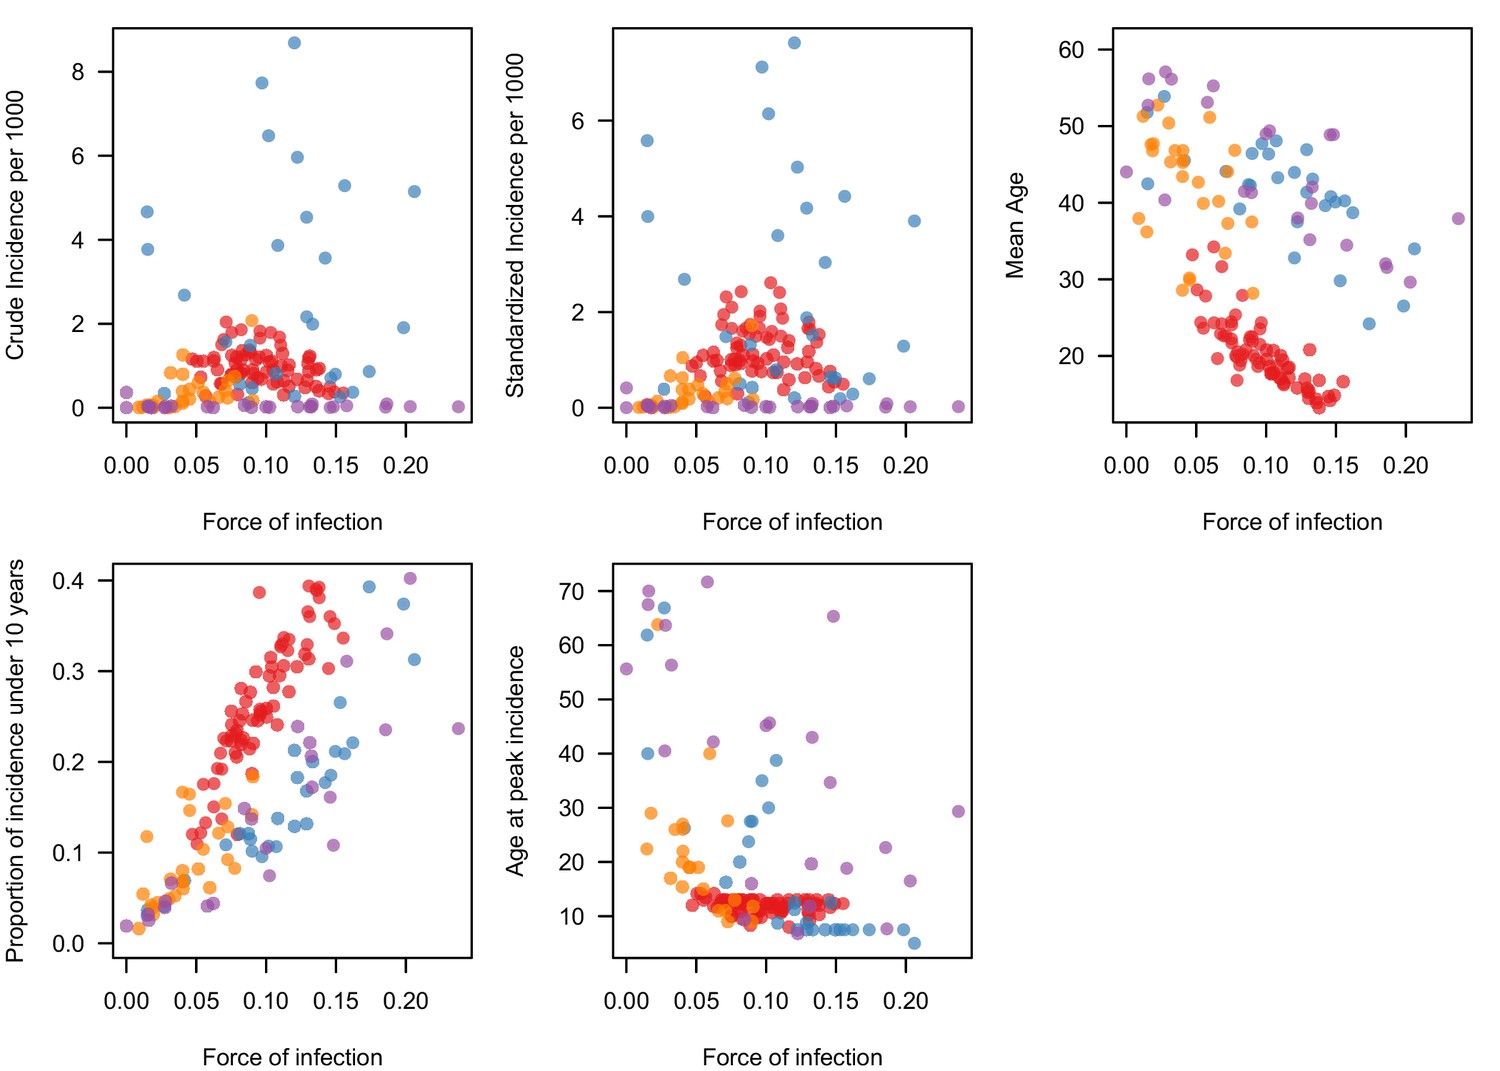
Correlation between estimates of the FOI (derived from age-specific case data) and alternative metrics calculated directly from age-specific incidence data.
Red = Thailand, blue = Colombia, purple = Brazil, orange = Mexico.
Figure 1—figure supplement 2
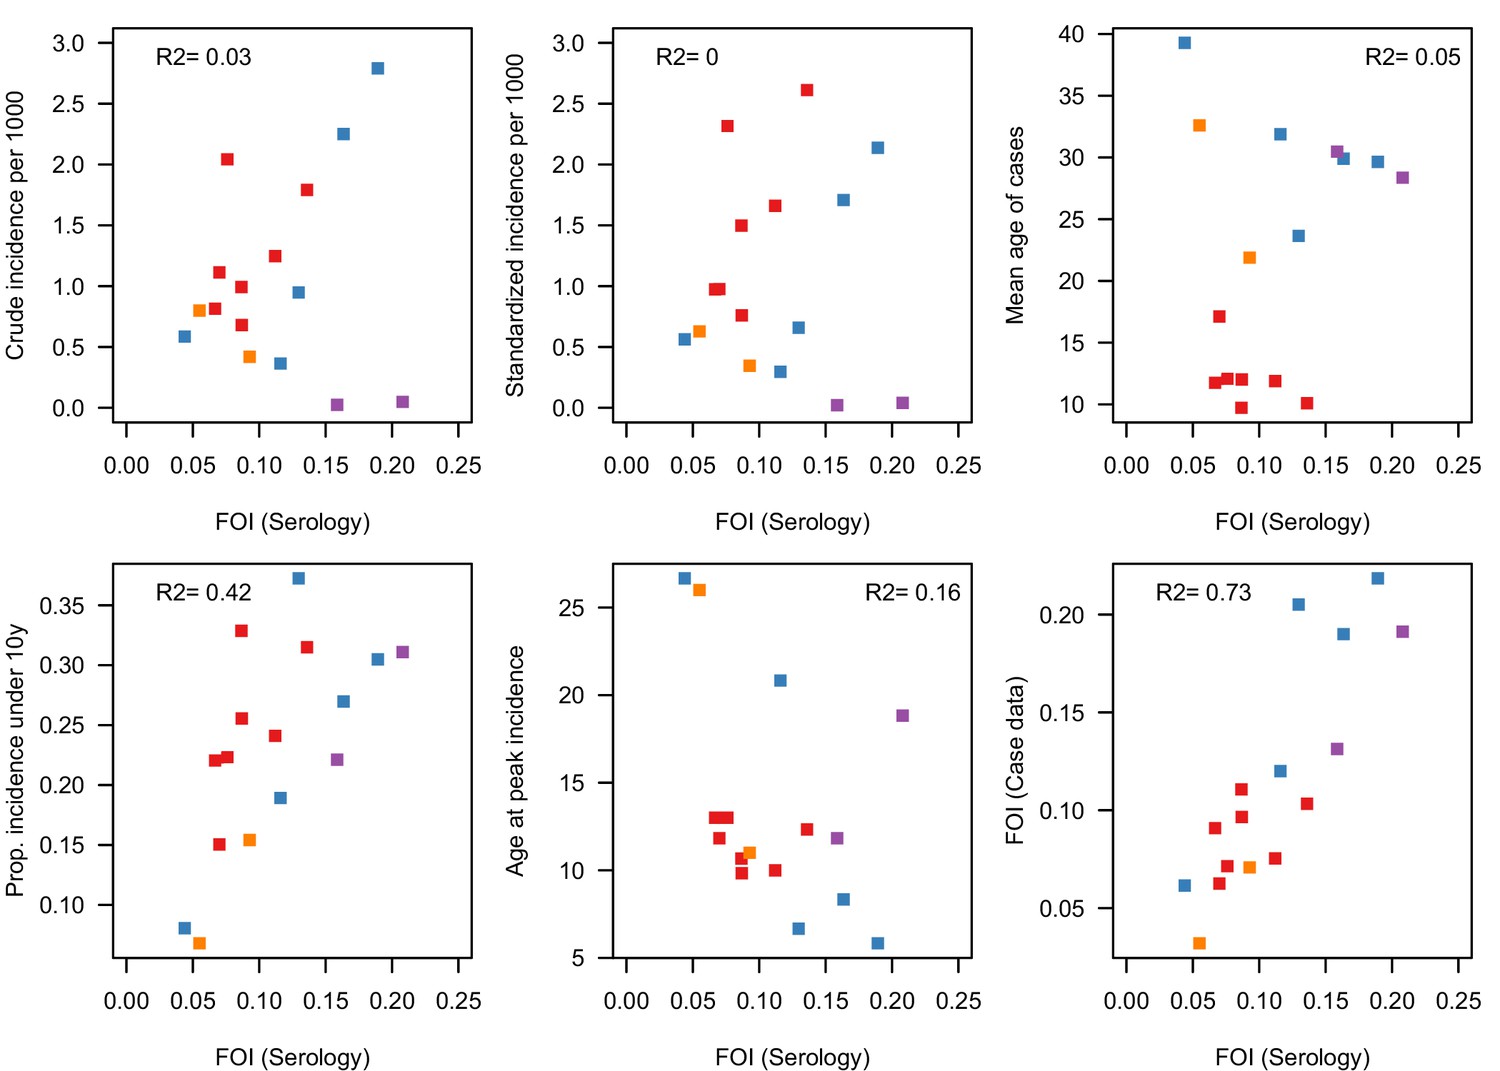
Correlation between estimates of the FOI derived from seroprevalence data (the gold standard) and several metrics derived from age-specific case data, for 16 spatial units where we had the two sources of data.
https://doi.org/10.7554/eLife.45474.004
Figure 2 with 2 supplements
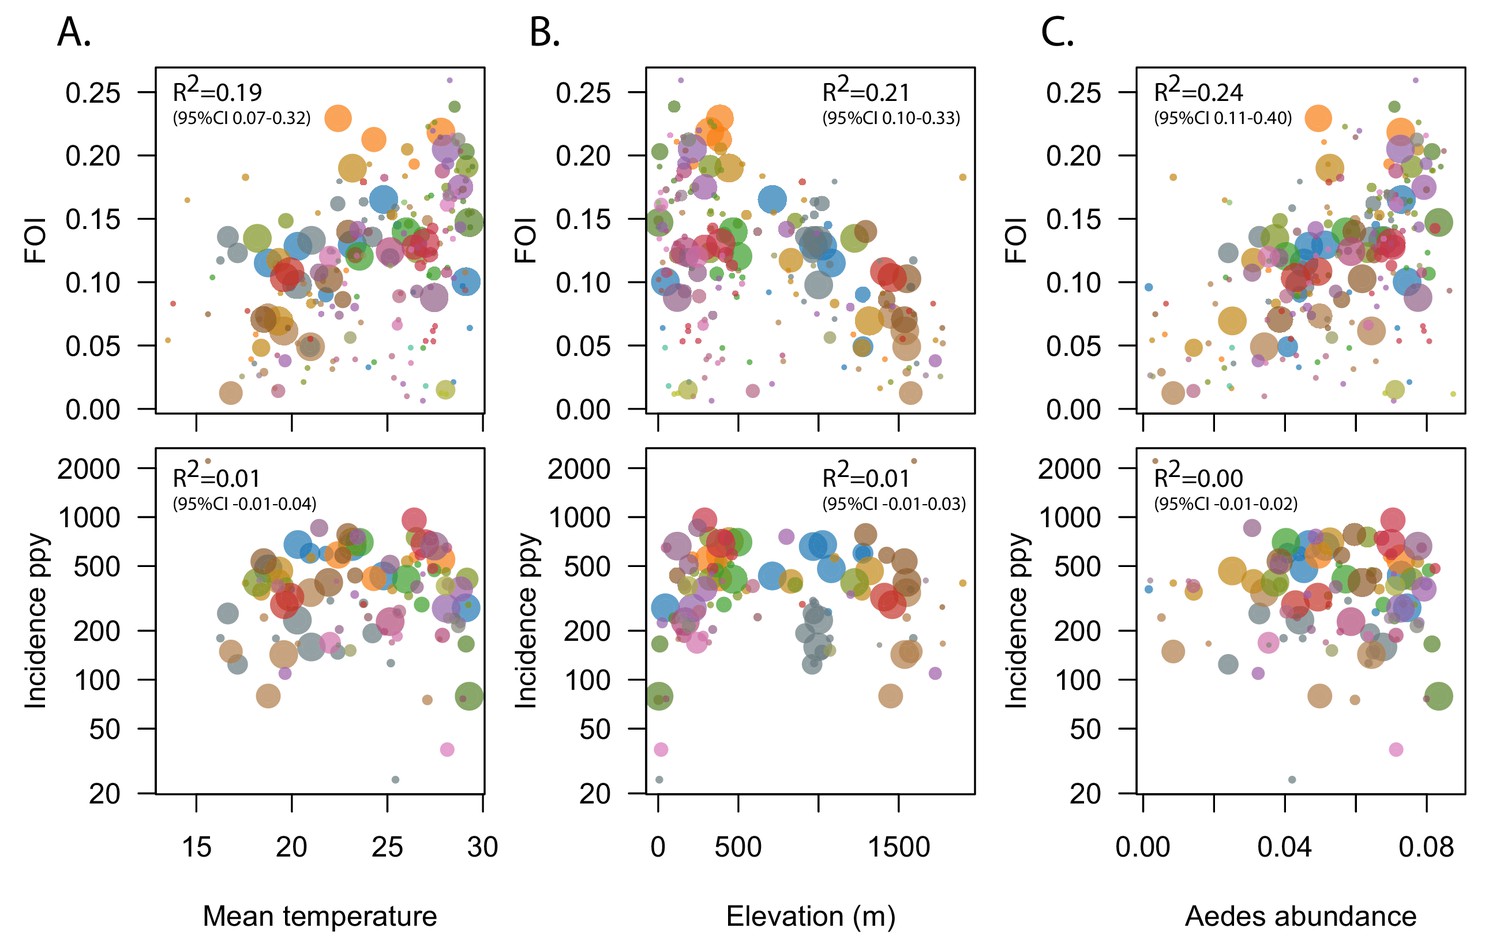
Correlation between estimates of the FOI and known environmental drivers of dengue transmission.
Top panels show correlation between estimates of the FOI for 211 municipalities (administrative level 2) of Colombia and mean temperature (A), elevation (B) and Aedes abundance (C). Size of symbols is proportional to the number of cases available to estimate the FOI. Bottom panels shows lack of correlation between environmental drivers and recent incidence, the most commonly used metric of transmission intensity. R2 values reported were obtained by fitting weighted linear regression models, with weights proportional to the number of cases used to derive the FOI estimate.
Figure 2—figure supplement 1
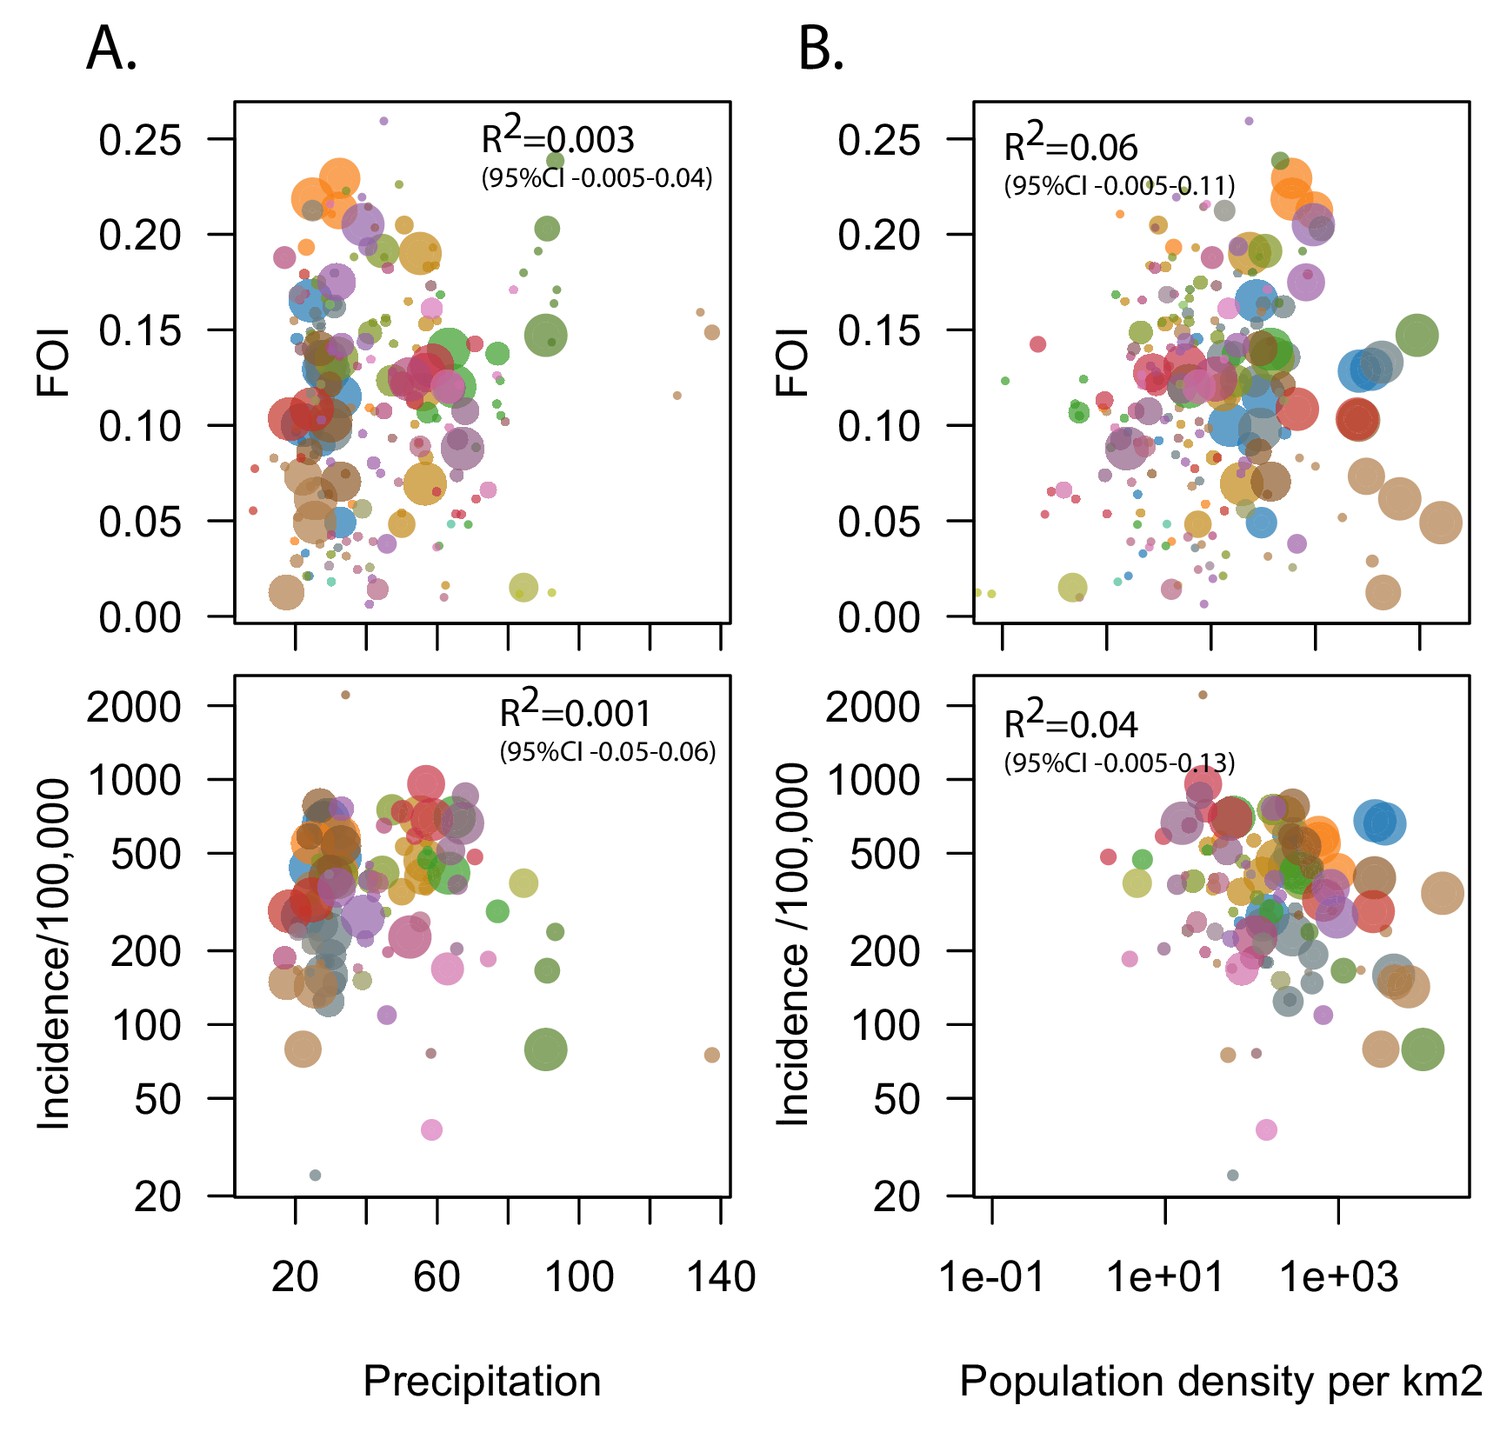
Correlation between estimates of the FOI and known environmental drivers of dengue transmission.
Top panels show correlation between estimates of the FOI for 211 municipalities (administrative level 2) of Colombia and precipitation (A) and Population density (B). Size of symbols is proportional to the number of cases available to estimate the FOI. Bottom panels show correlation between these two environmental drivers and recent incidence. R2 values reported were obtained by fitting weighted linear regression models, with weights proportional to the number of cases used to derive the FOI estimate.
Figure 2—figure supplement 2

Heterogeneity in FOI within administrative level 1 units of Colombia.
Filled circles show the estimates for each municipality (administrative level two unit) within the department that reported > 200 cases. Hollow circles indicate the mean force of infection for those municipalities that reported < 200 cases. Size of circles is proportional to the number of cases available to estimate the FOI. Triangles indicate the mean estimate for each department.
Figure 3
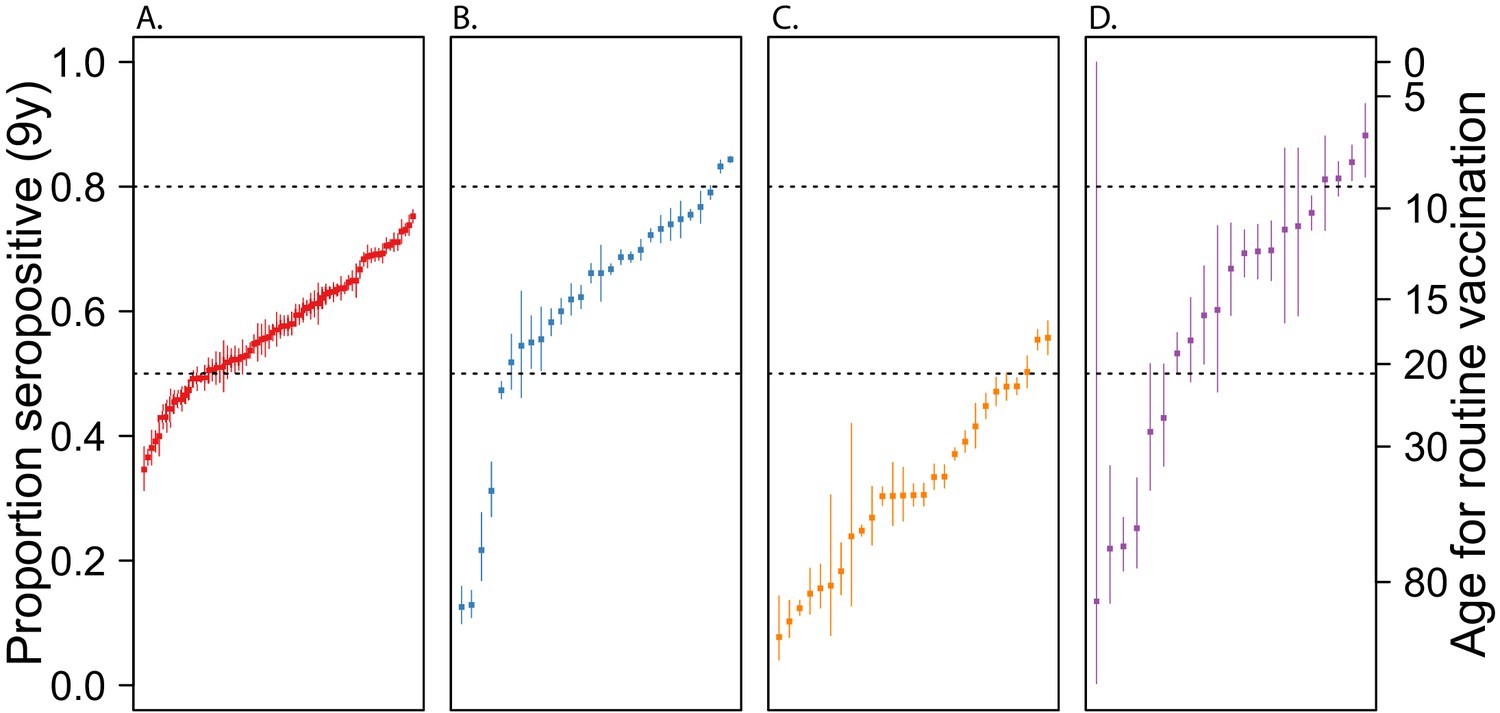
Guiding vaccination policy.
Estimated dengue seroprevalence at 9 years of for administrative level 1 units of Thailand, Colombia, Brazil and Mexico Expected seroprevalence of dengue among children aged 9 years, derived from the FOI estimates (see Materials and methods for more details), for administrative level 1 units of Thailand (A), Colombia (B), Brazil (C) and Mexico (D). For each country, administrative units were ranked by their FOI. Dashed lines indicate 50% and 80% seroprevalence levels. Therefore, units above the 80% line are those where, according to the WHO-SAGE recommendation from 2018, it might be reasonable target children aged 9 years old for vaccination. Units below the 50% line are those where vaccination of this age-group would not be recommended. The axis on the right of the plot indicates the minimum age-group that would need to be targeted in each location to ensure at least 80% seropositivity.
-
Figure 3—source data 1
Estimated forces of infection and seroprevalences for 148 spatial units.
- https://doi.org/10.7554/eLife.45474.009
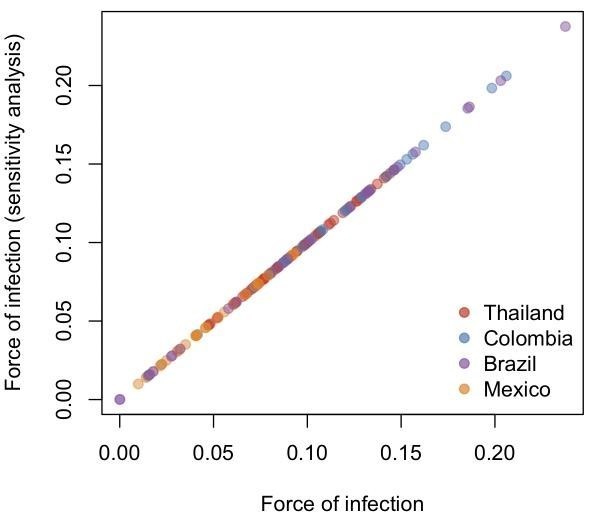
Figure 4
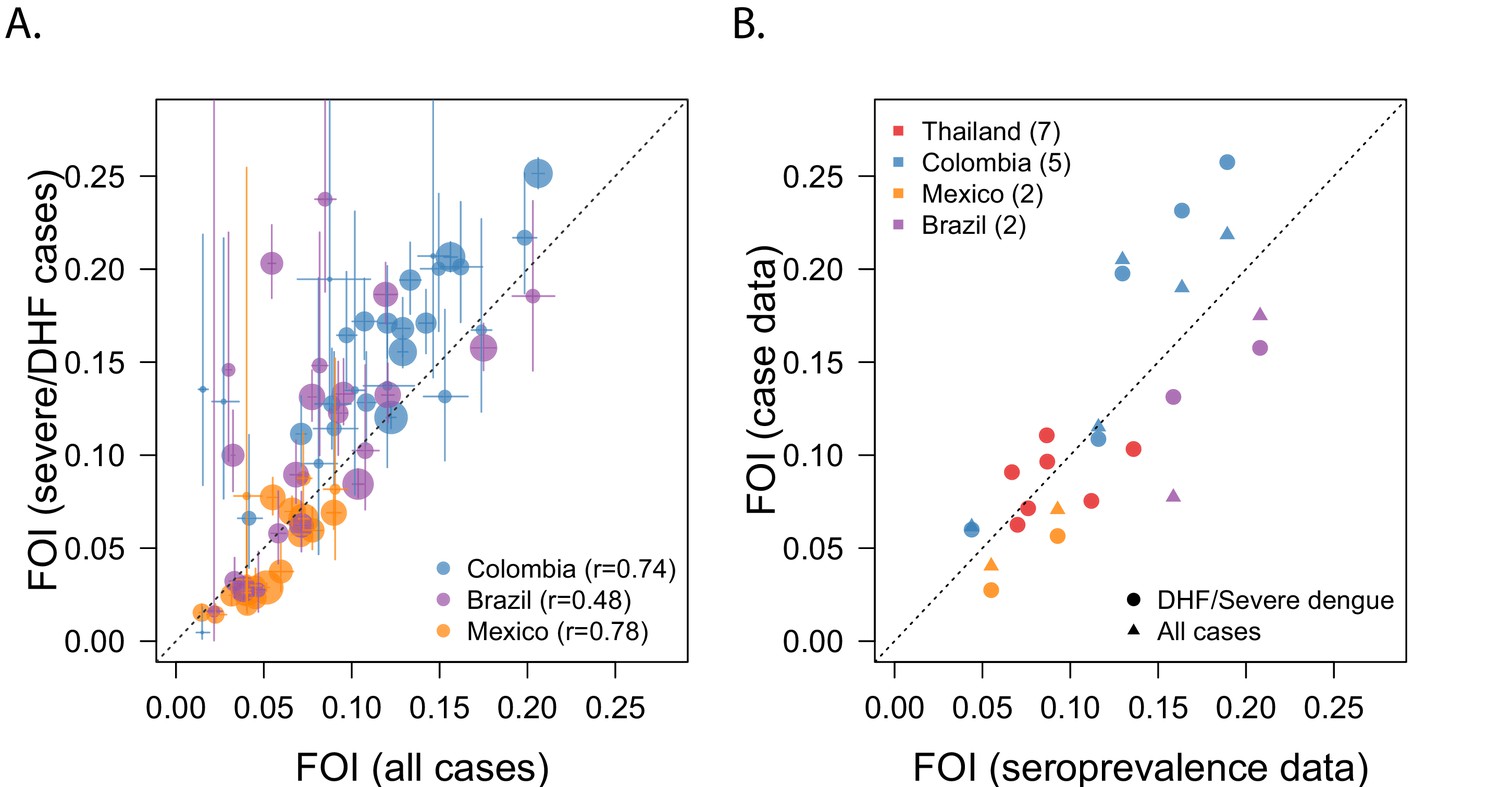
Sensitivity analysis: Comparing different types of data.
(A) Correlation between estimates of the FOI obtained when using data from DHF/severe dengue infections, vs. data from all cases combined. (B) Correlation between FOI estimates derived from different types of dengue data, with estimates derived from age-stratified serological data (gold standard).
Appendix 1—figure 1
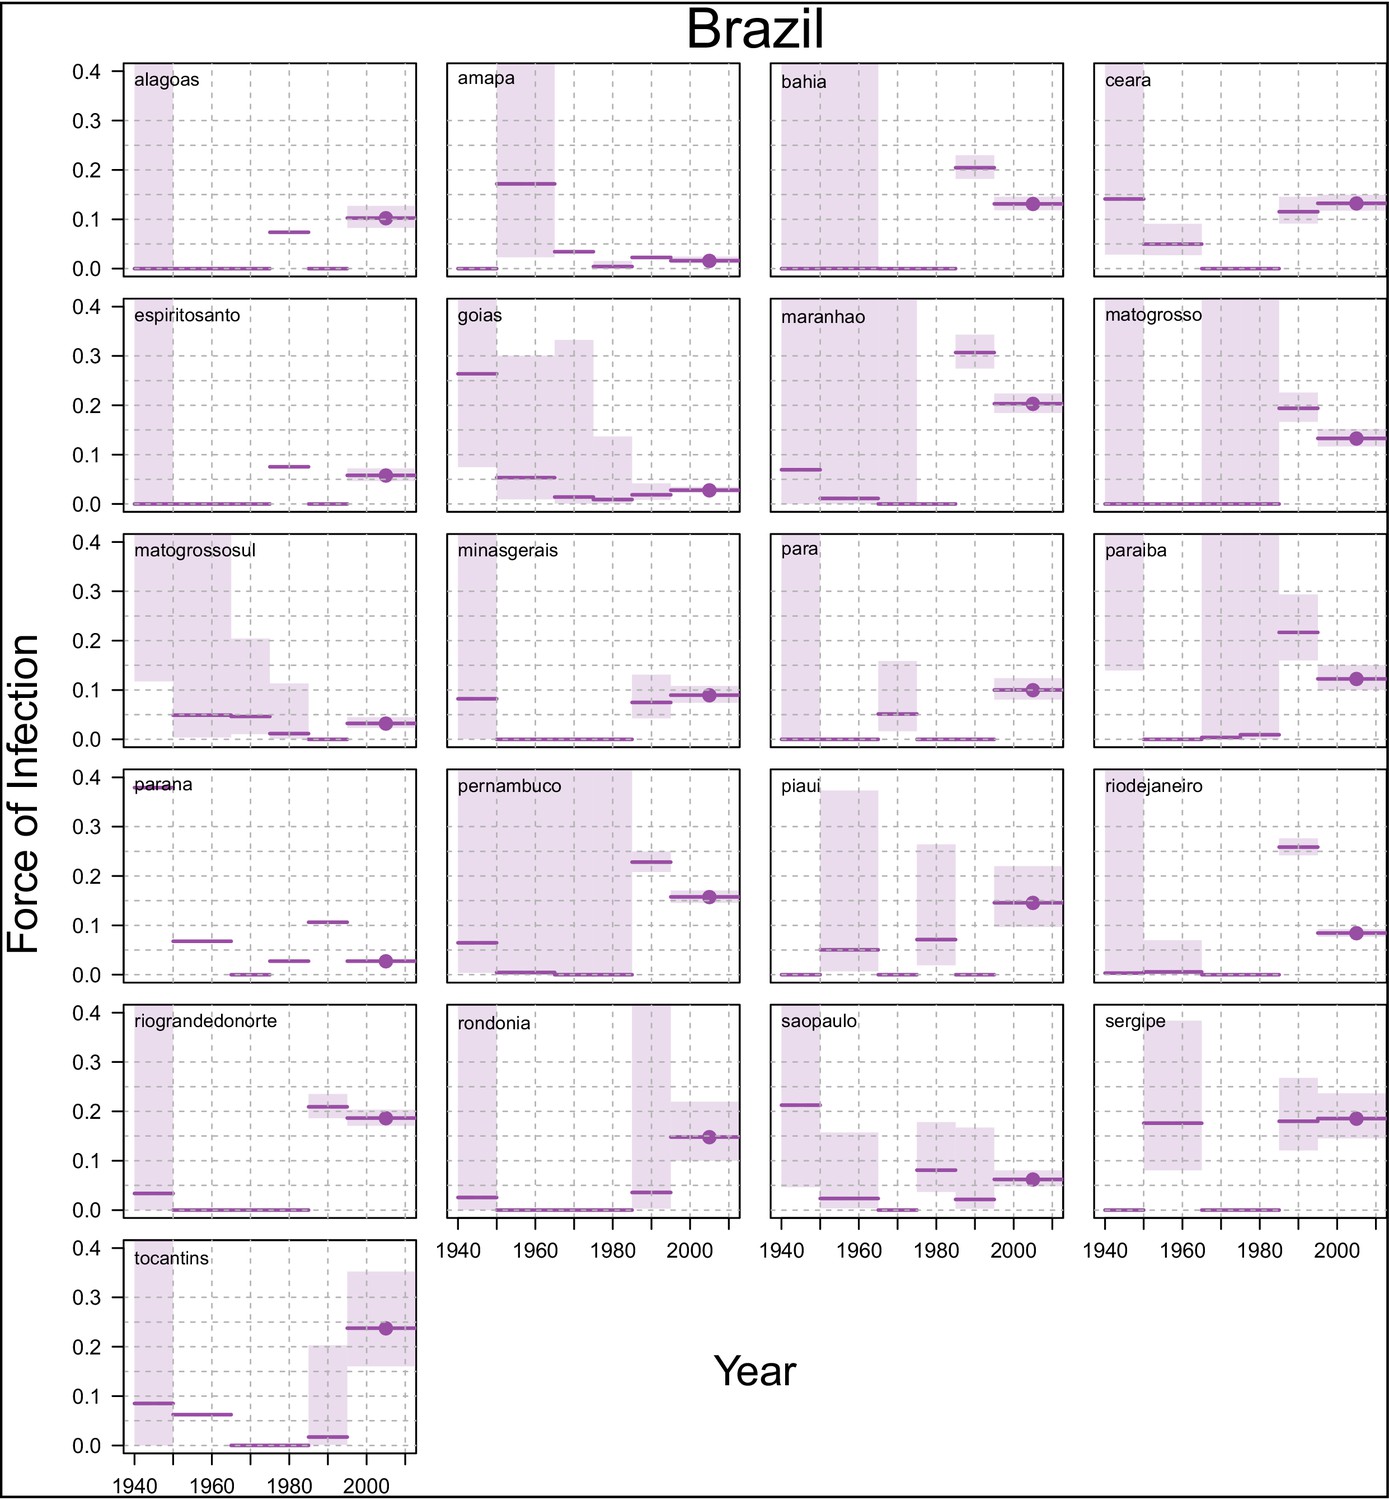
Time varying Force of Infection Estimates.
https://doi.org/10.7554/eLife.45474.016
Appendix 1—figure 2
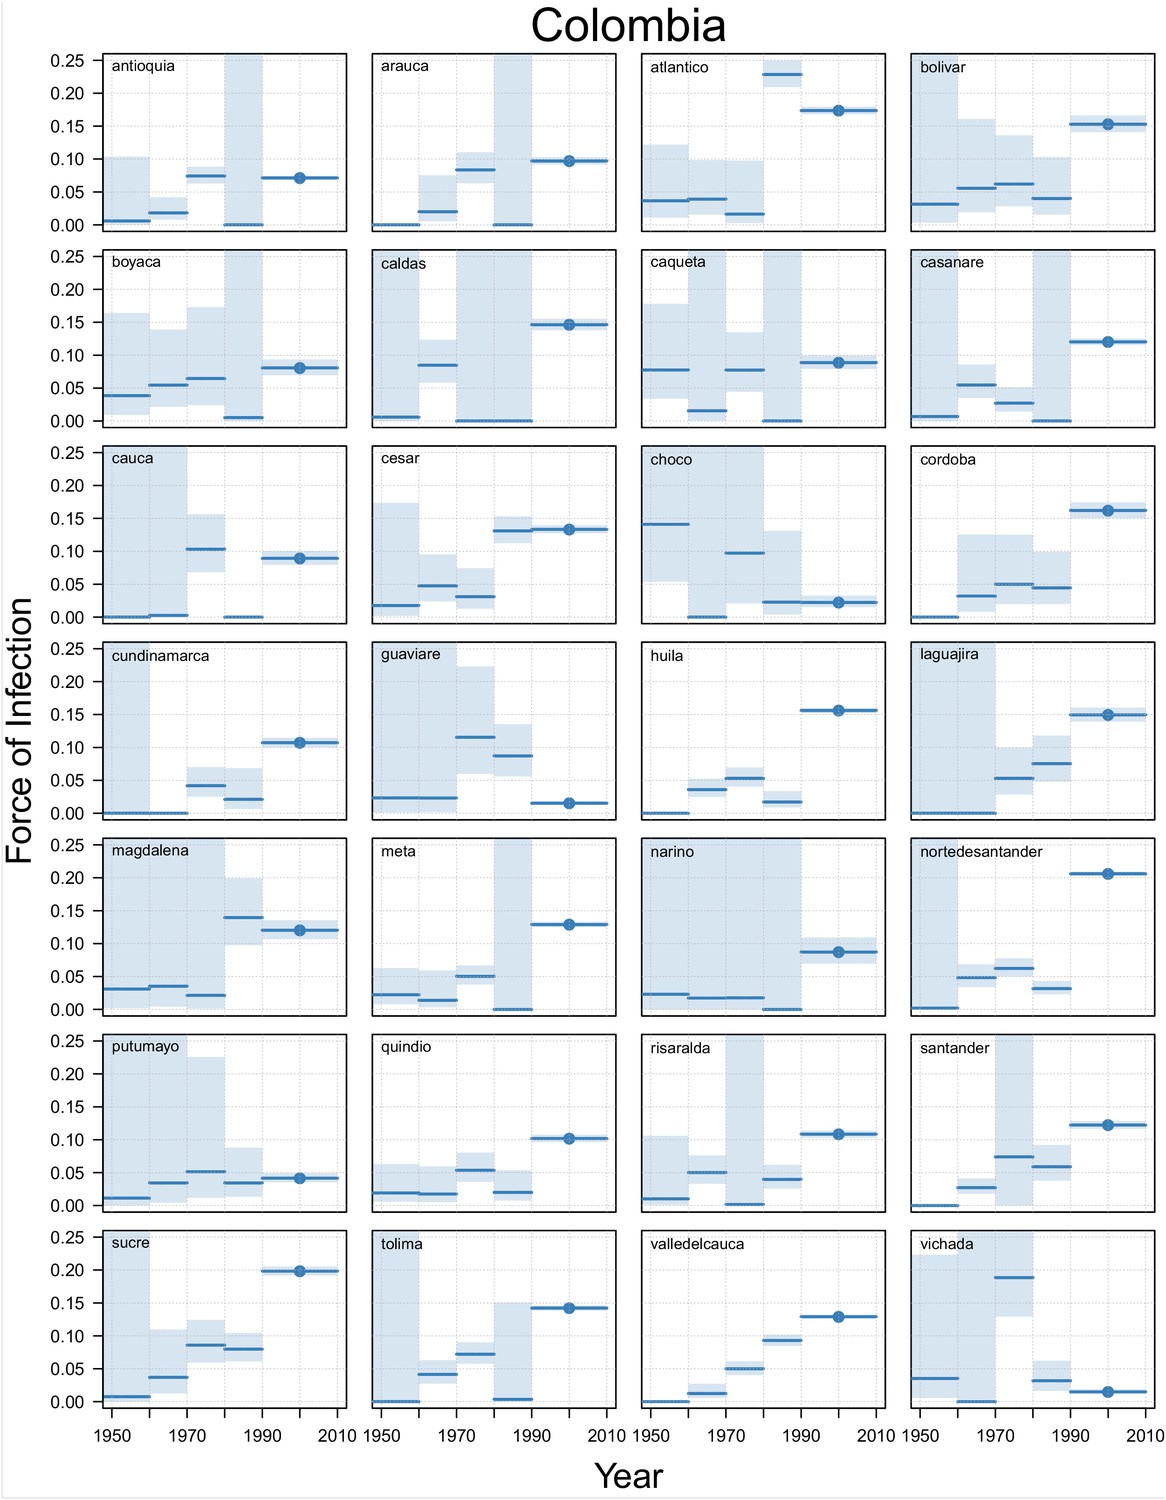
Time varying Force of Infection Estimates, Colombia.
https://doi.org/10.7554/eLife.45474.017
Appendix 1—figure 3
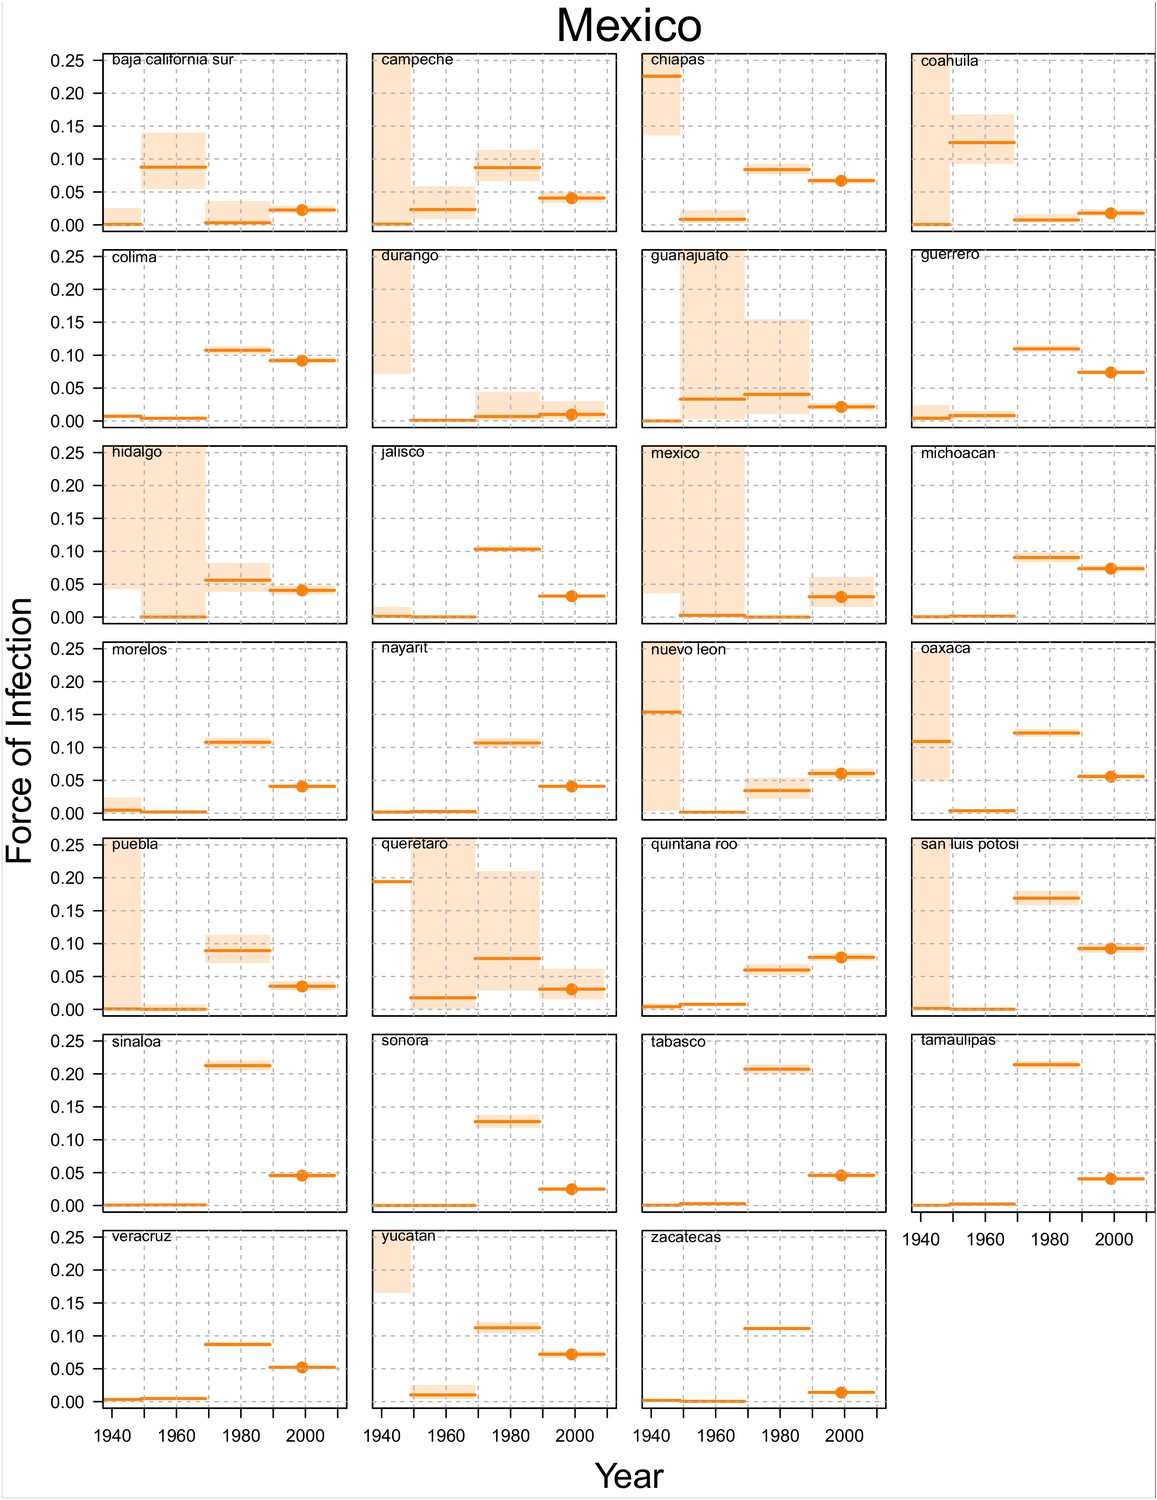
Time varying Force of Infection Estimates, Mexico.
https://doi.org/10.7554/eLife.45474.018
Appendix 1—figure 4
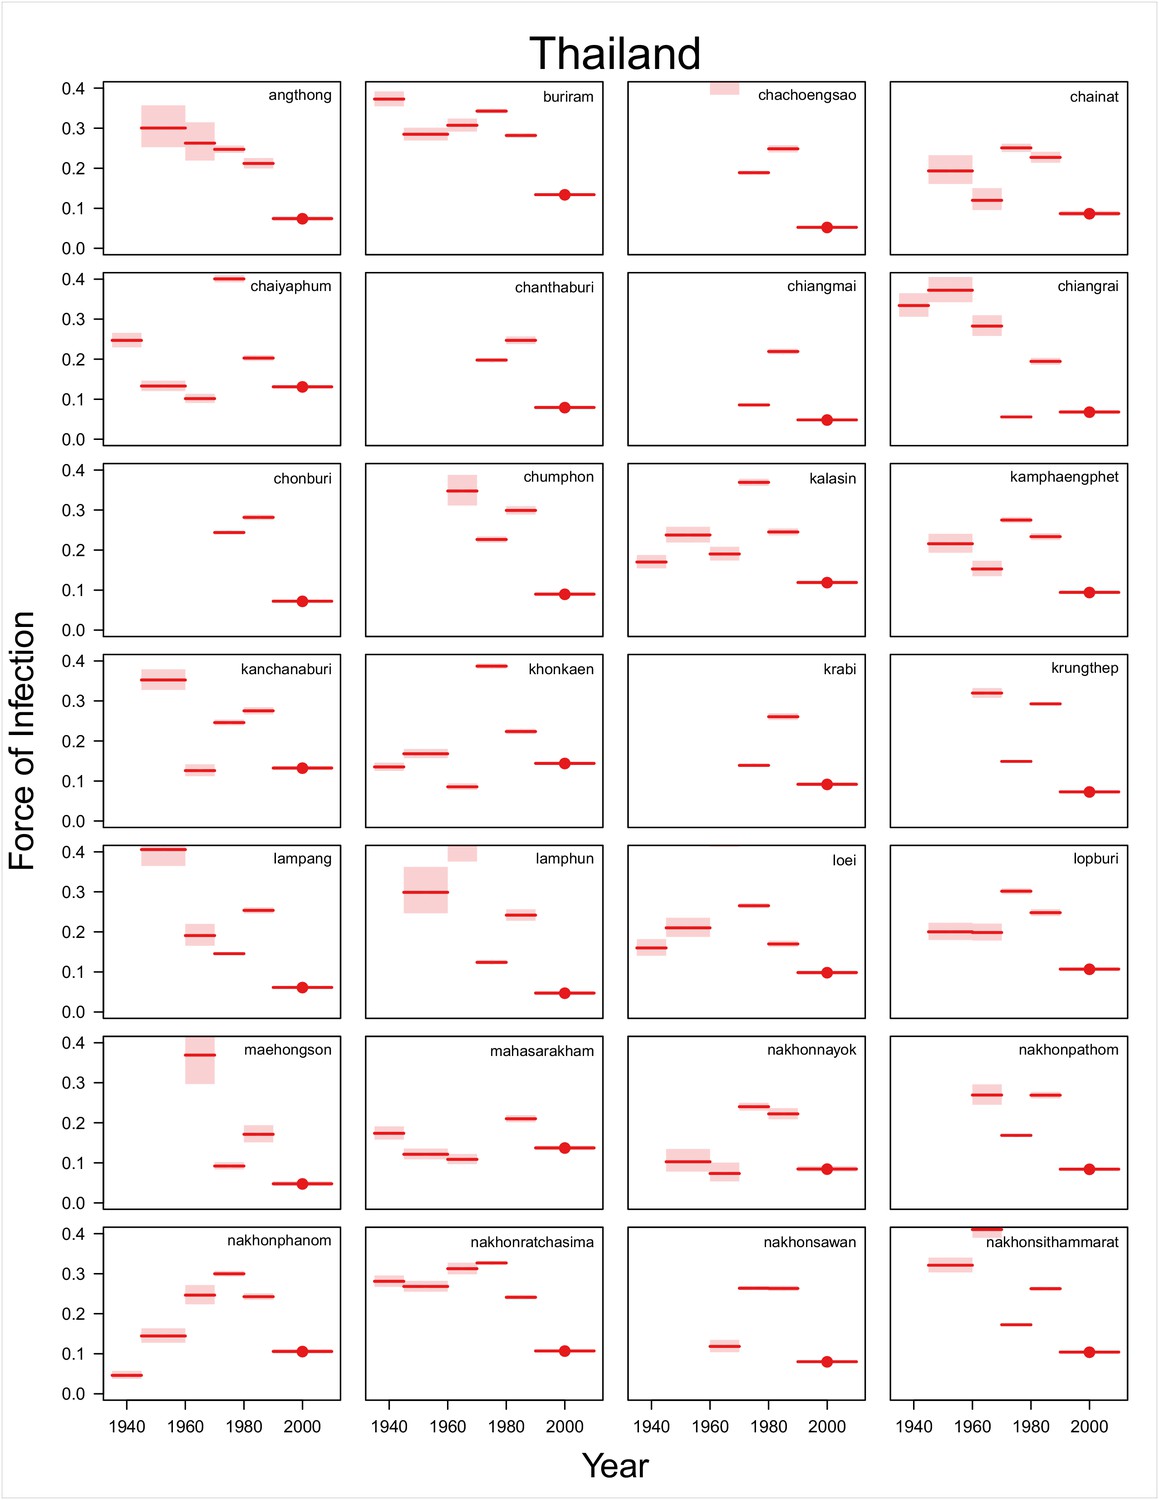
Time varying Force of Infection Estimates, Thailand (1).
https://doi.org/10.7554/eLife.45474.019
Appendix 1—figure 5

Time varying Force of Infection Estimates, Thailand (2).
https://doi.org/10.7554/eLife.45474.020
Appendix 1—figure 6

Time varying Force of Infection Estimates, Thailand (3).
https://doi.org/10.7554/eLife.45474.021
Appendix 2—figure 1
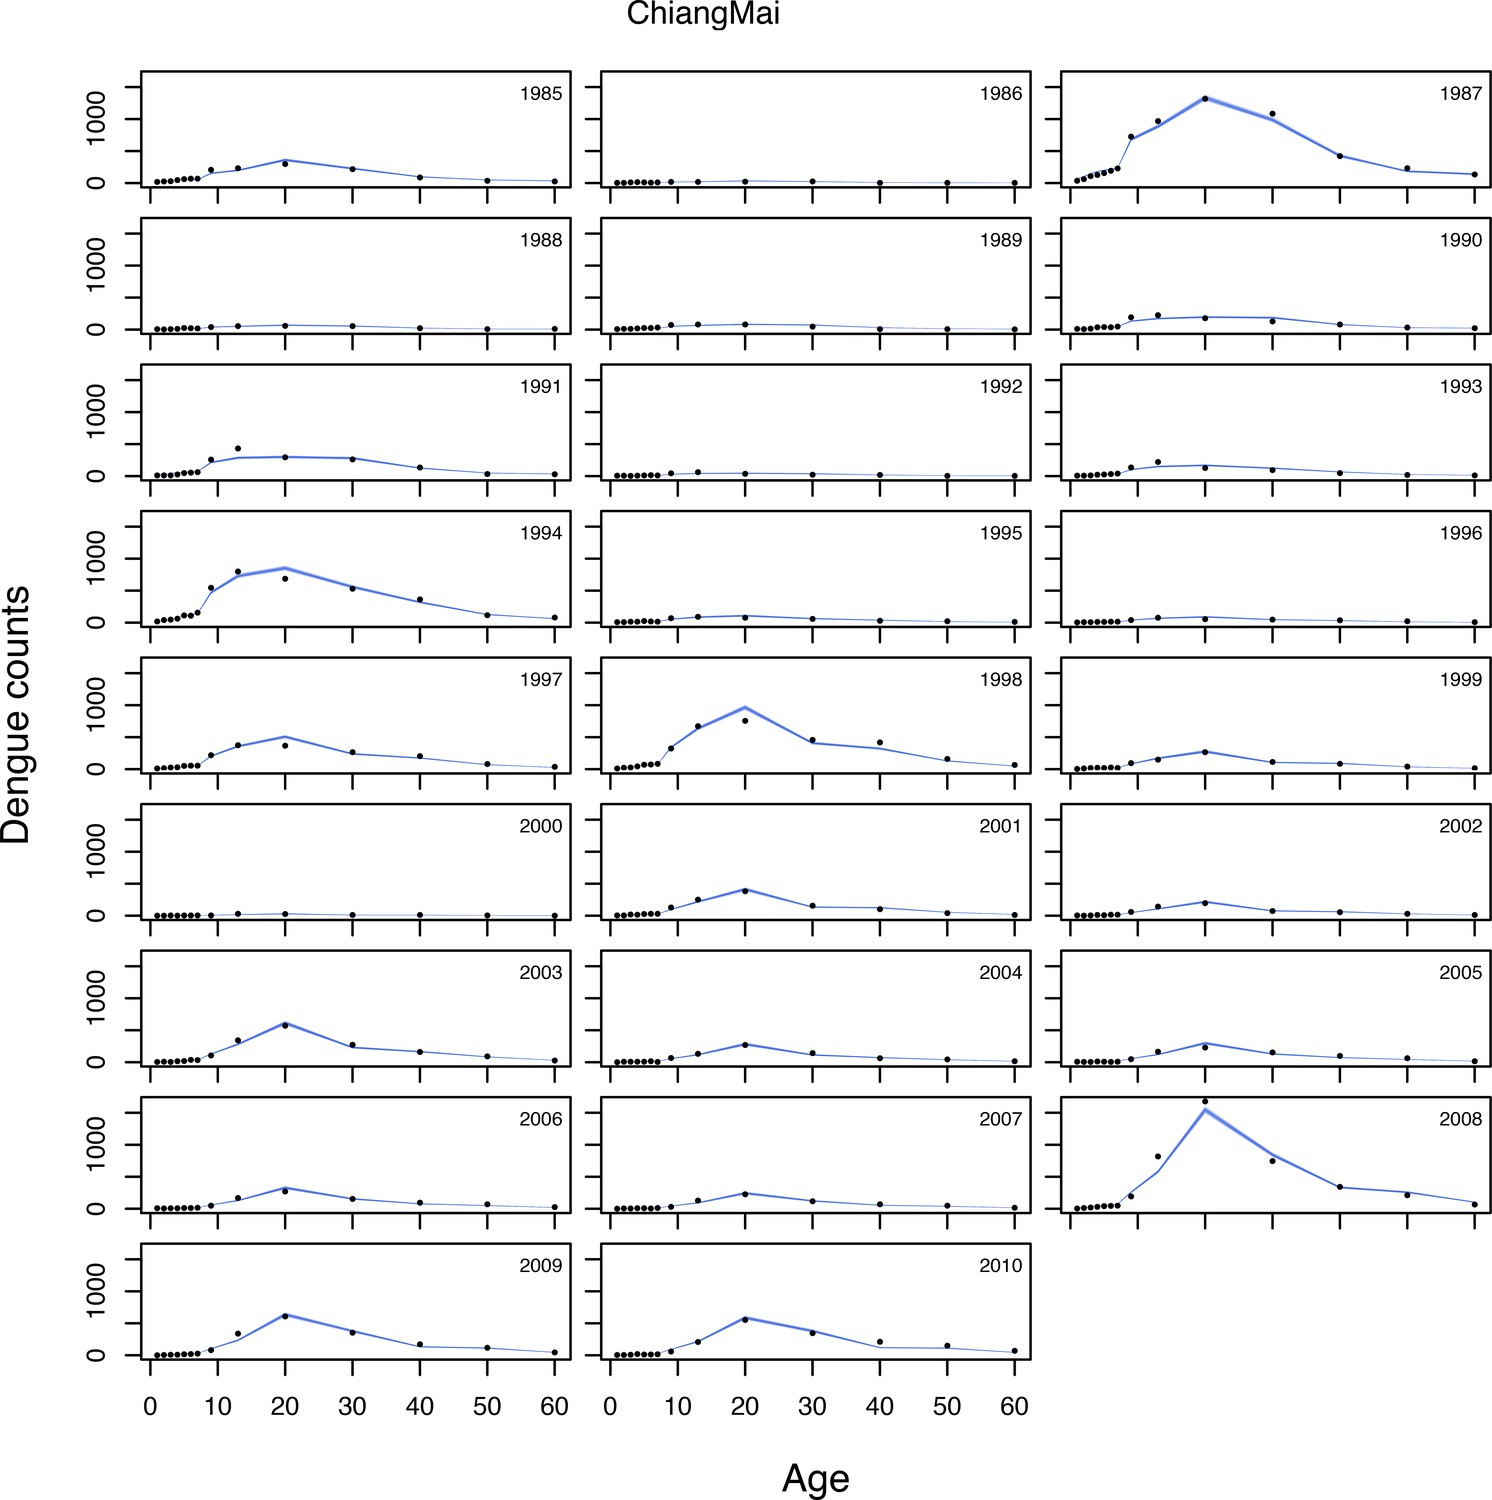
Selected model fits (1).
https://doi.org/10.7554/eLife.45474.023
Appendix 2—figure 2
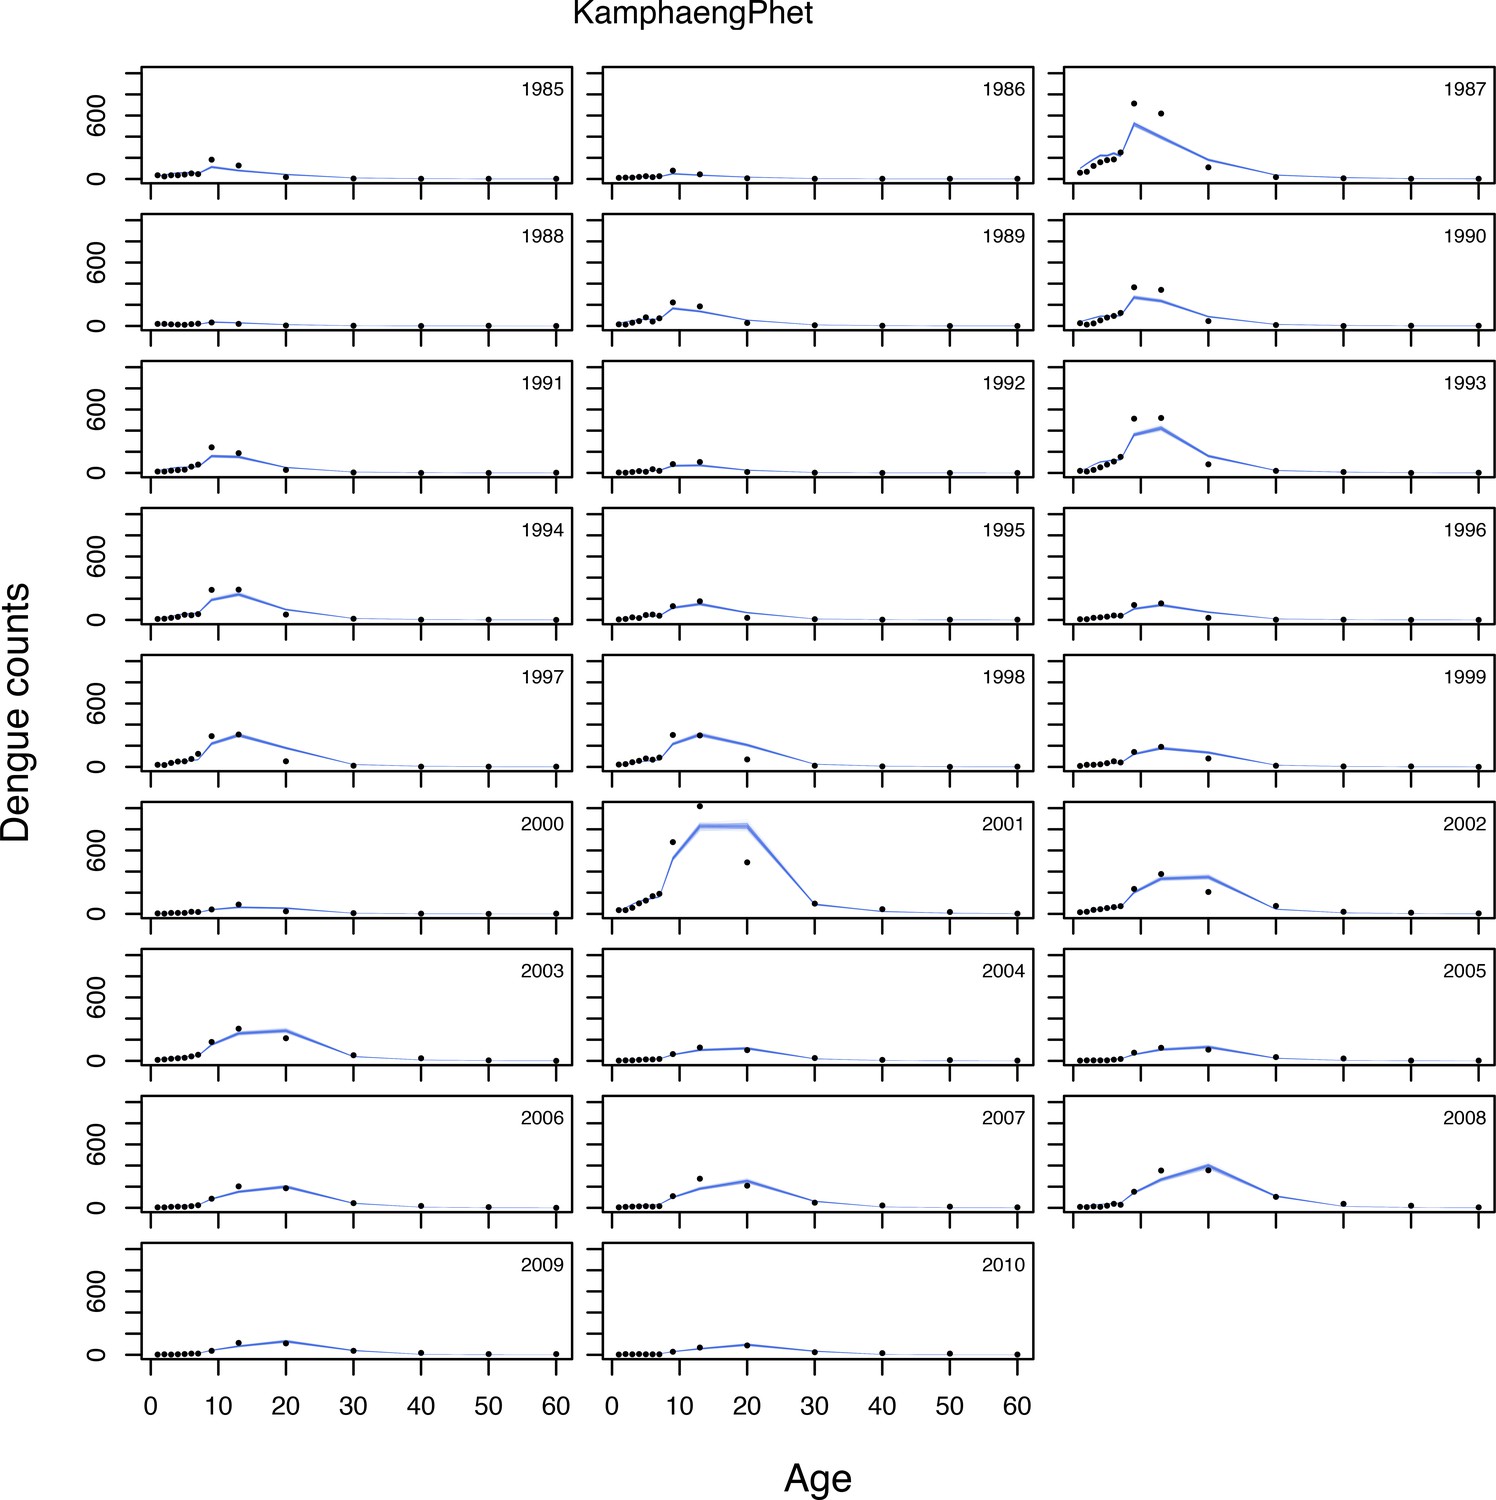
Selected model fits (2).
https://doi.org/10.7554/eLife.45474.024
Appendix 2—figure 3
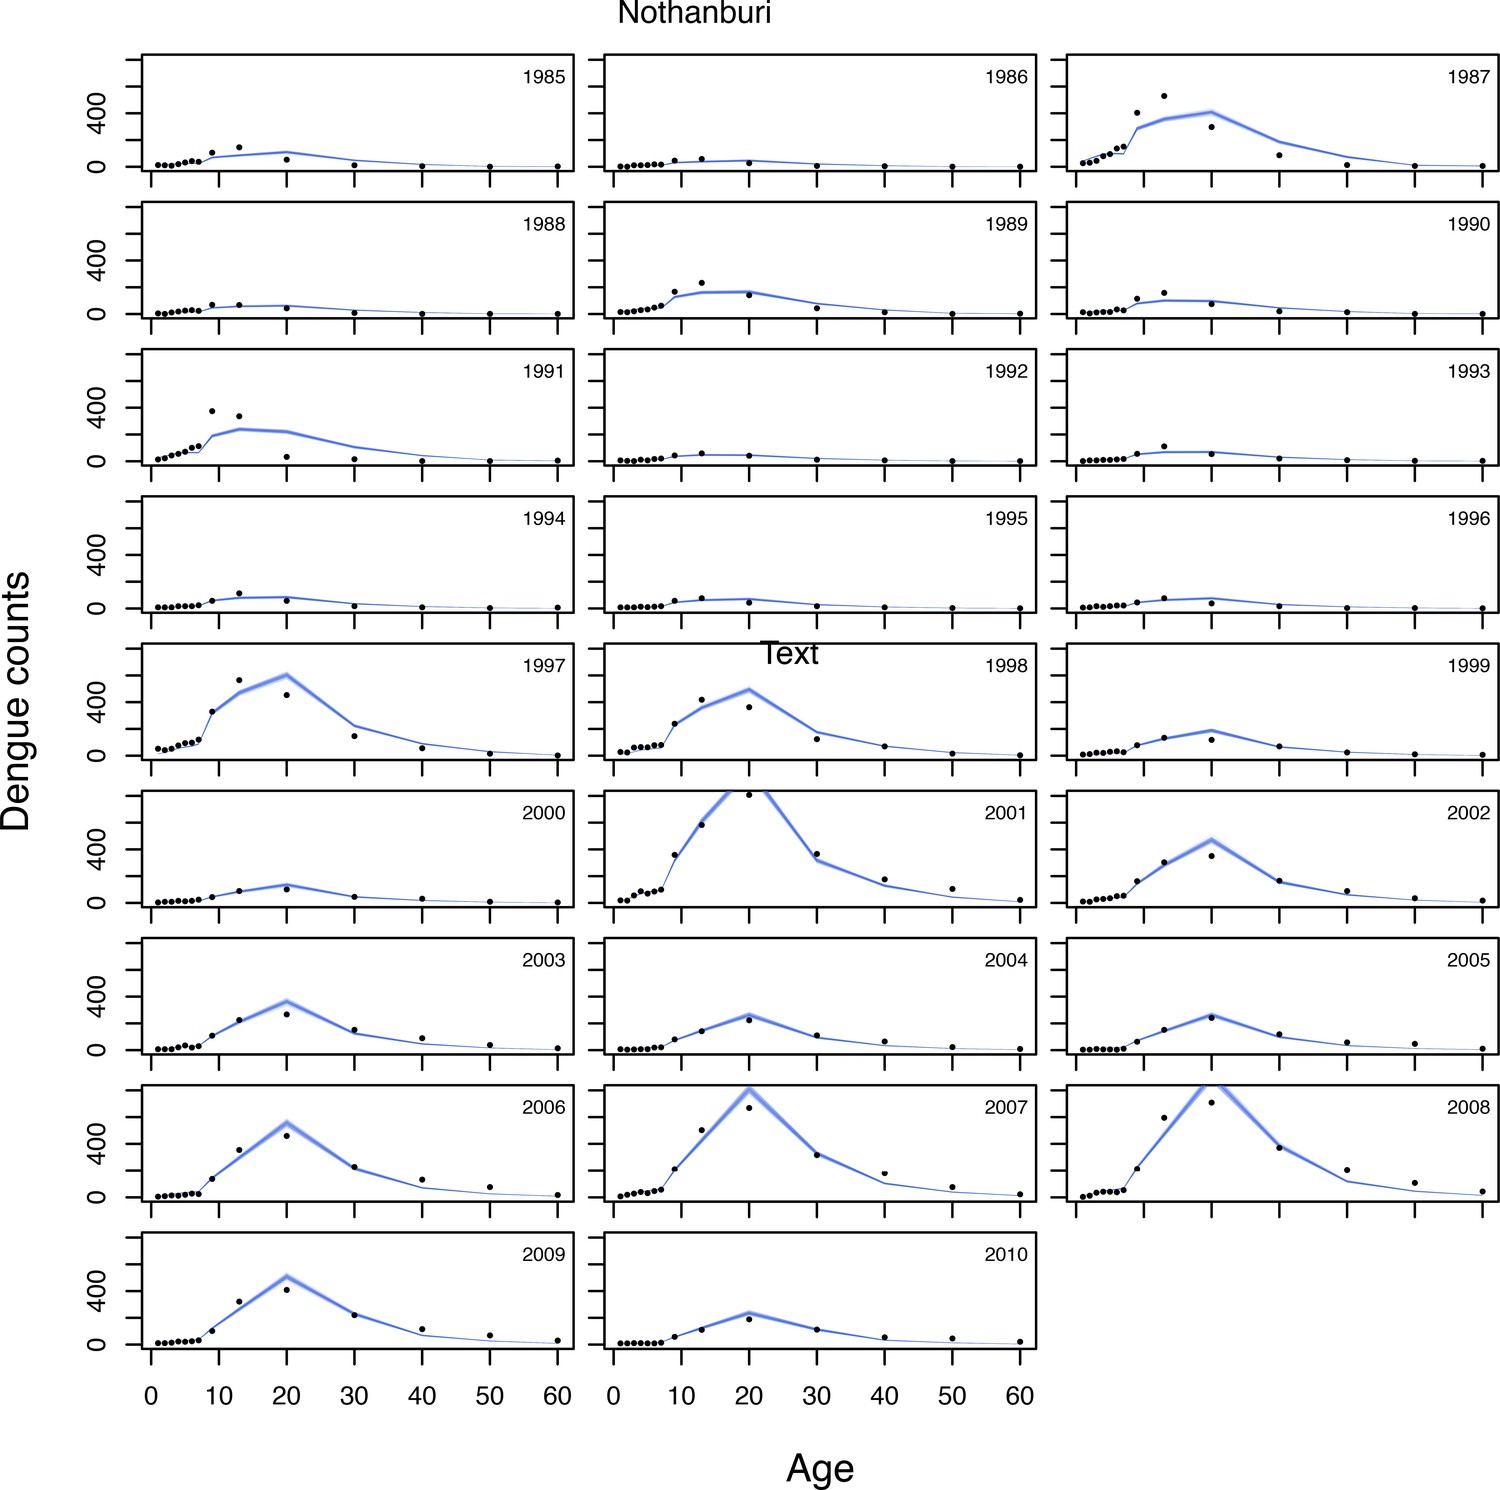
Selected model fits (3).
https://doi.org/10.7554/eLife.45474.025
Appendix 2—figure 4
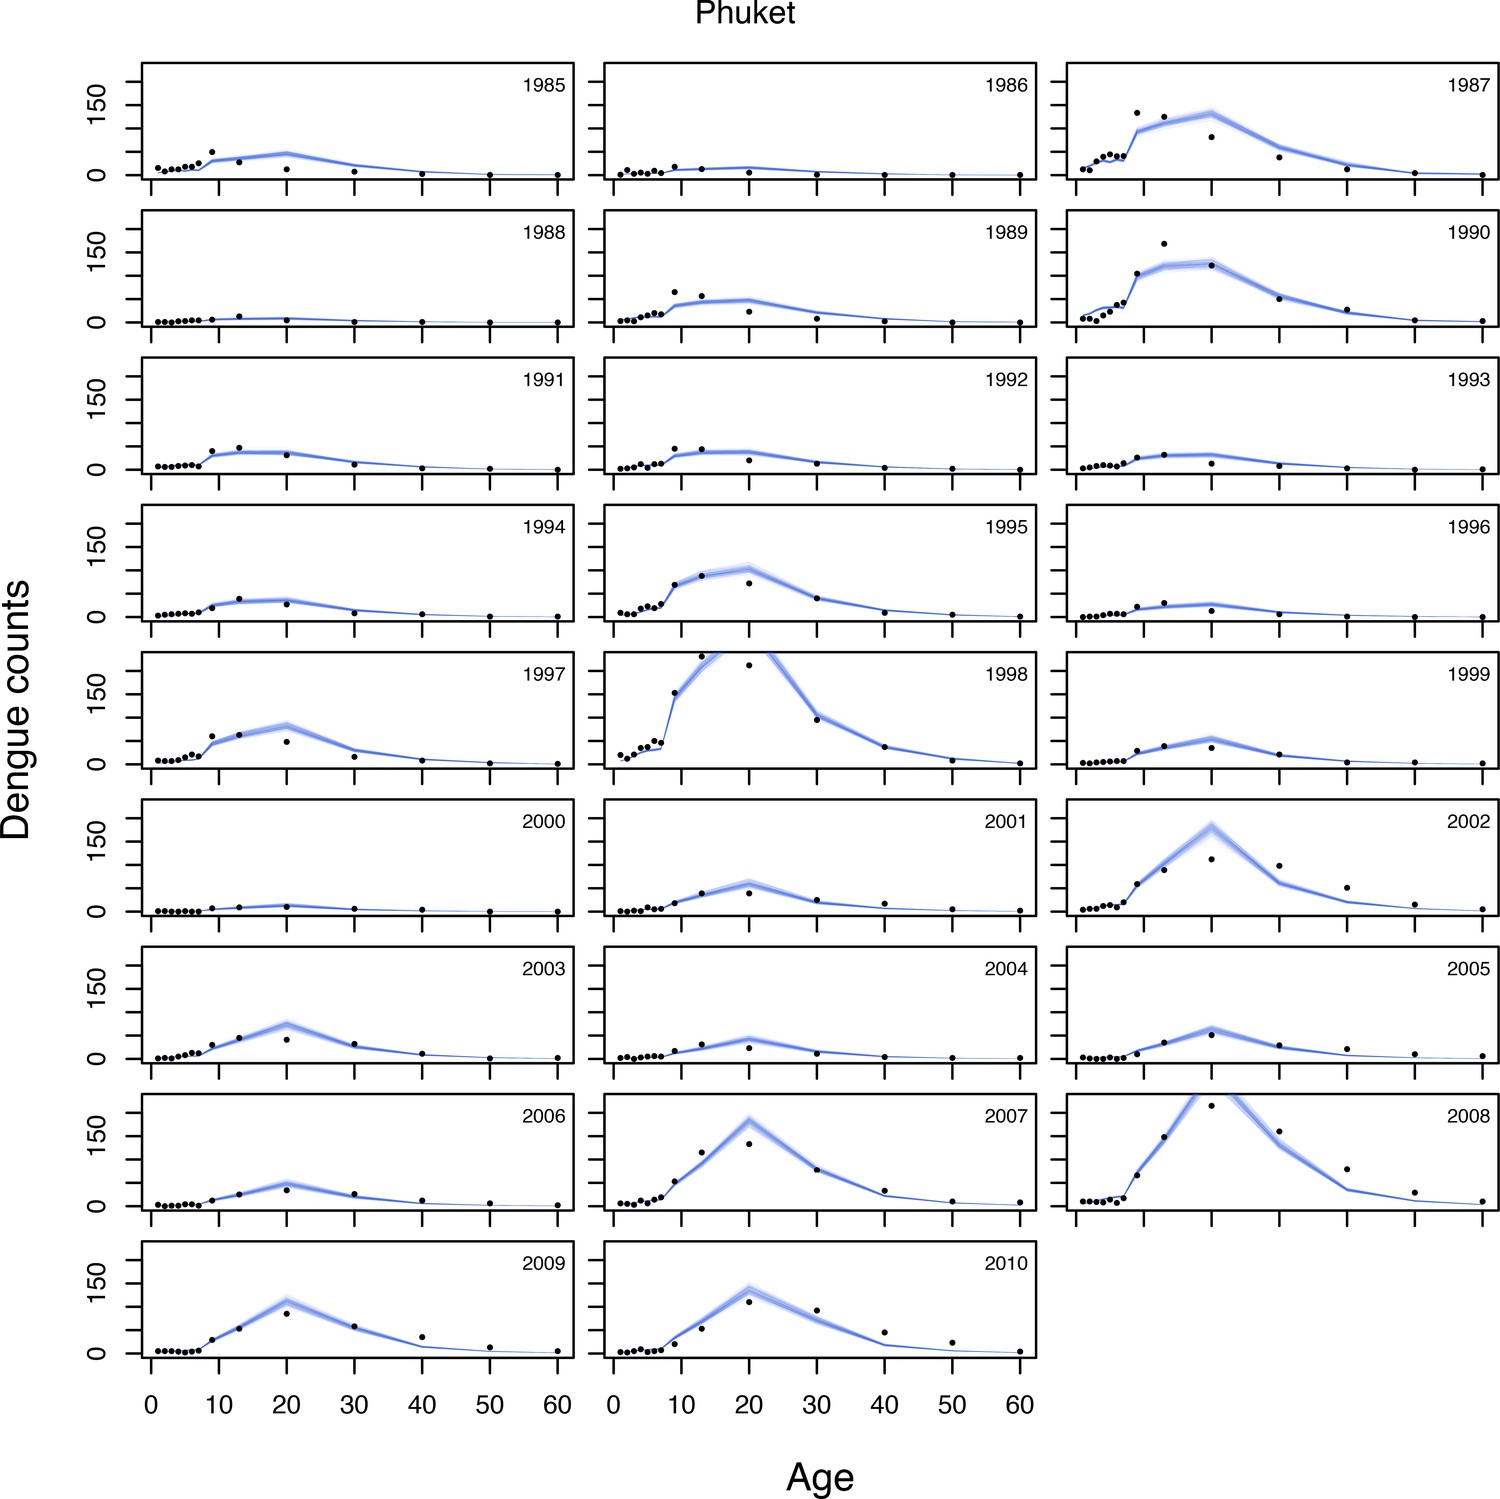
Selected model fits (4).
https://doi.org/10.7554/eLife.45474.026
Appendix 2—figure 5
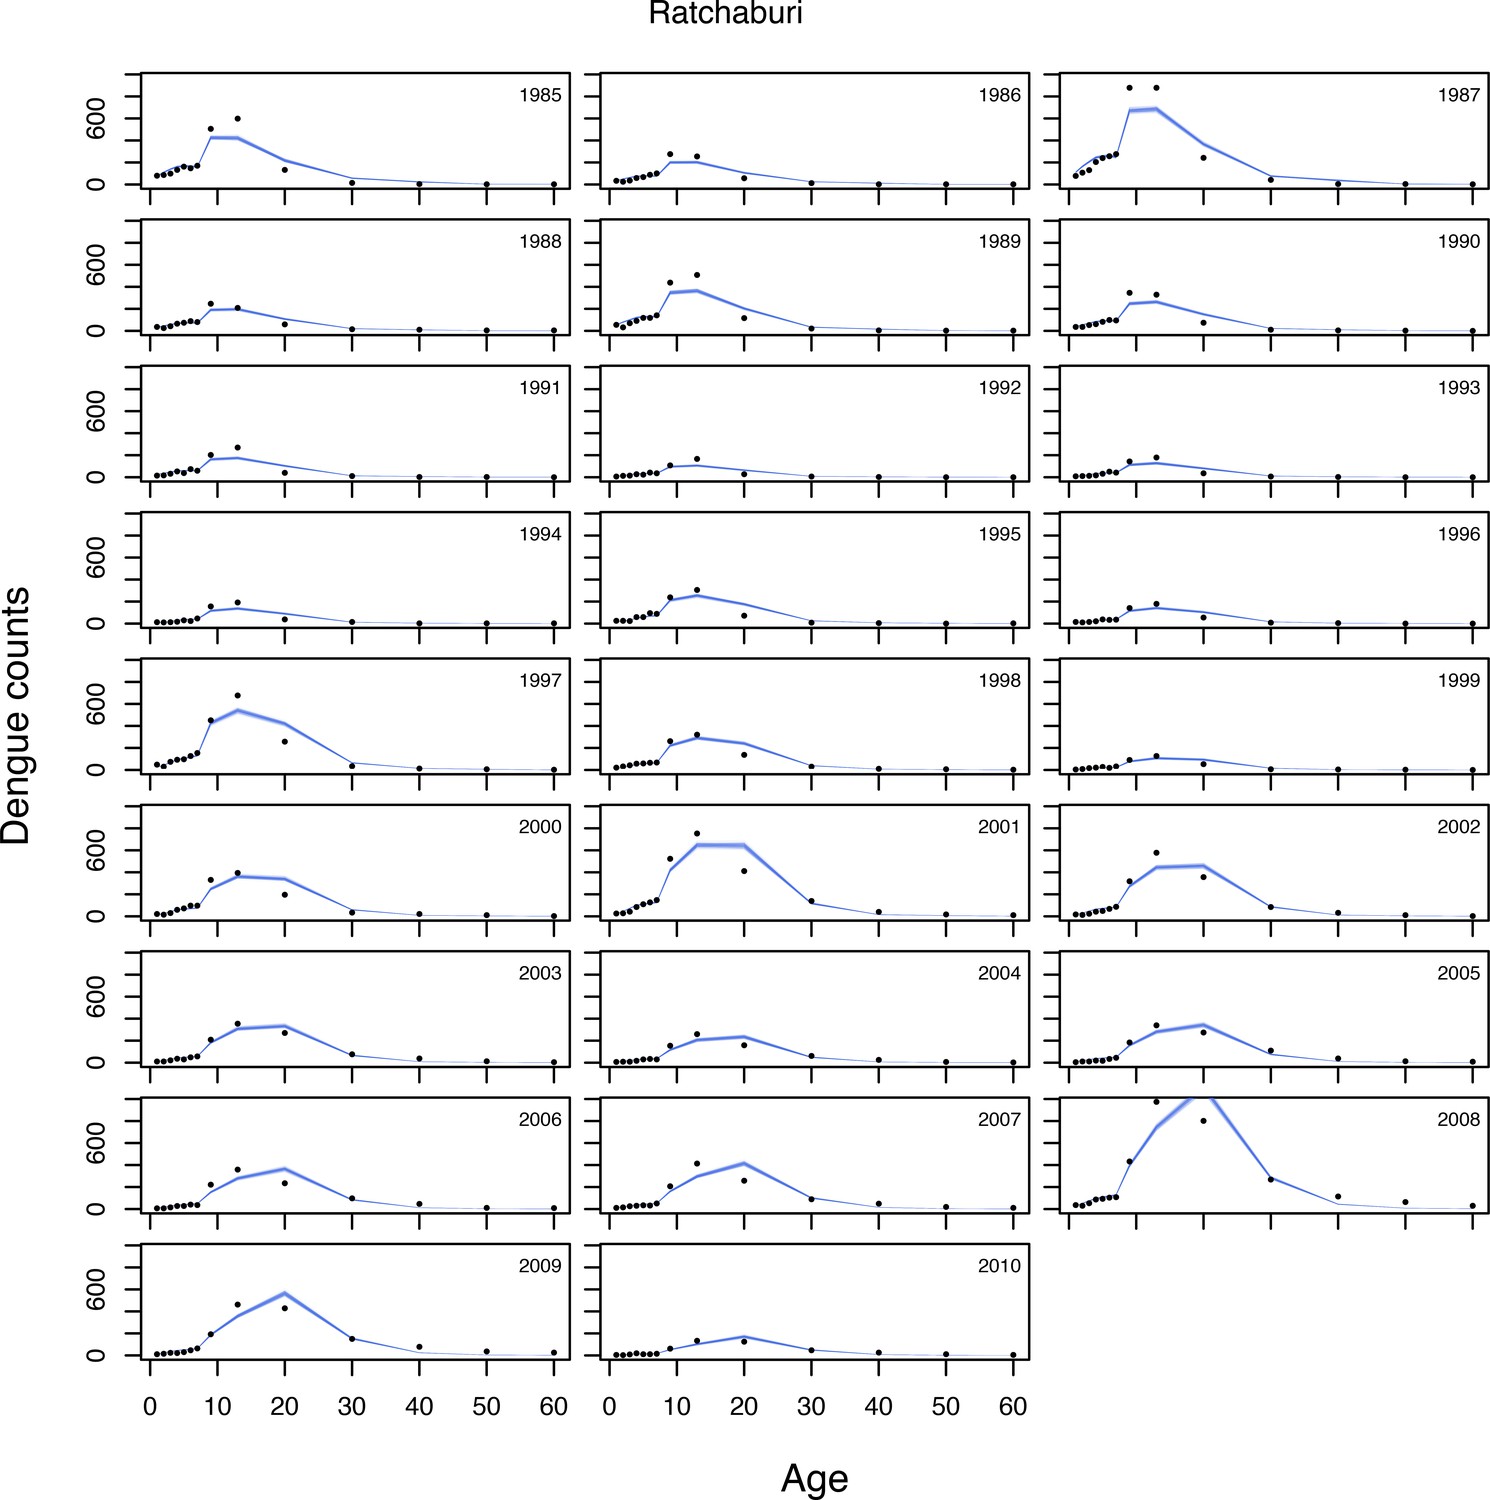
Selected model fits (5).
https://doi.org/10.7554/eLife.45474.027
Appendix 2—figure 6
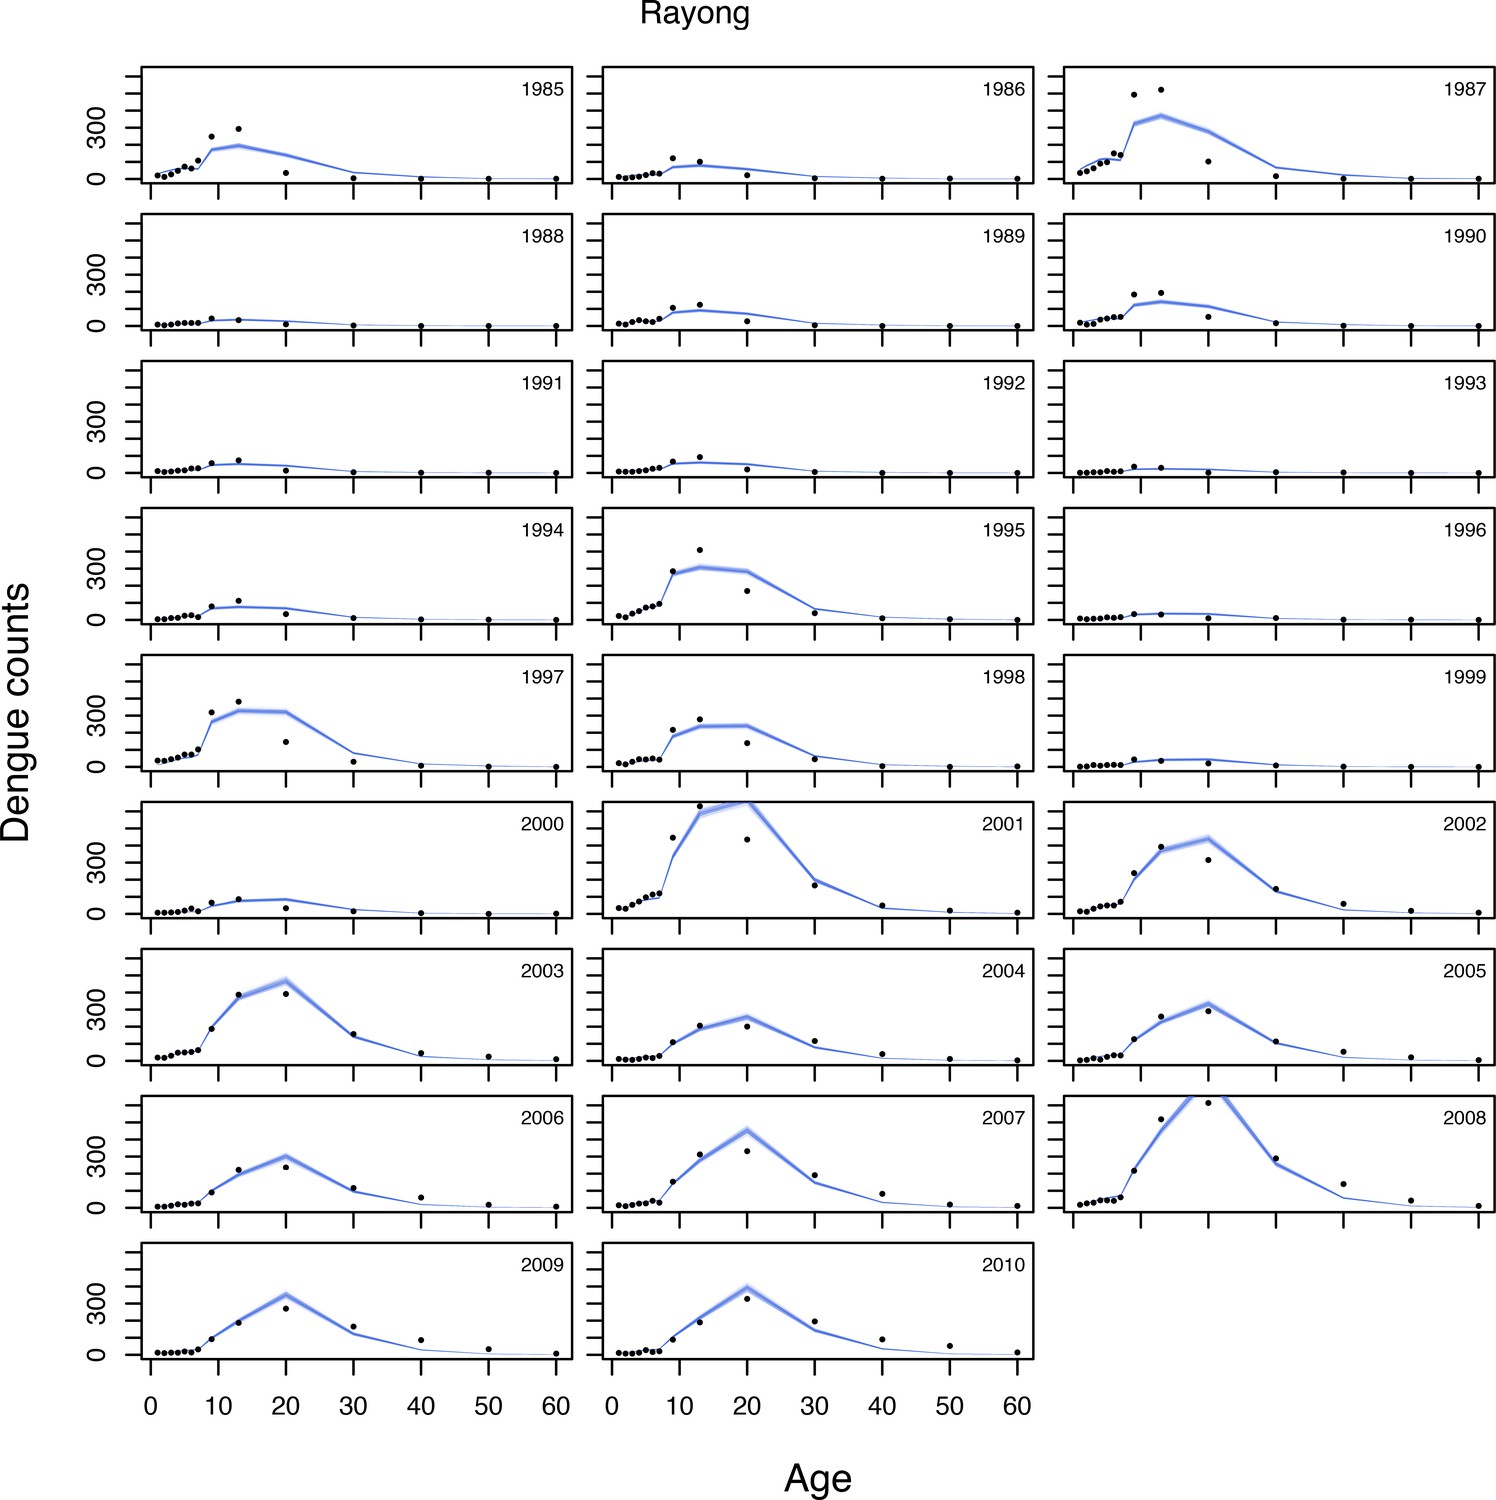
Selected model fits (6).
https://doi.org/10.7554/eLife.45474.028
Appendix 2—figure 7
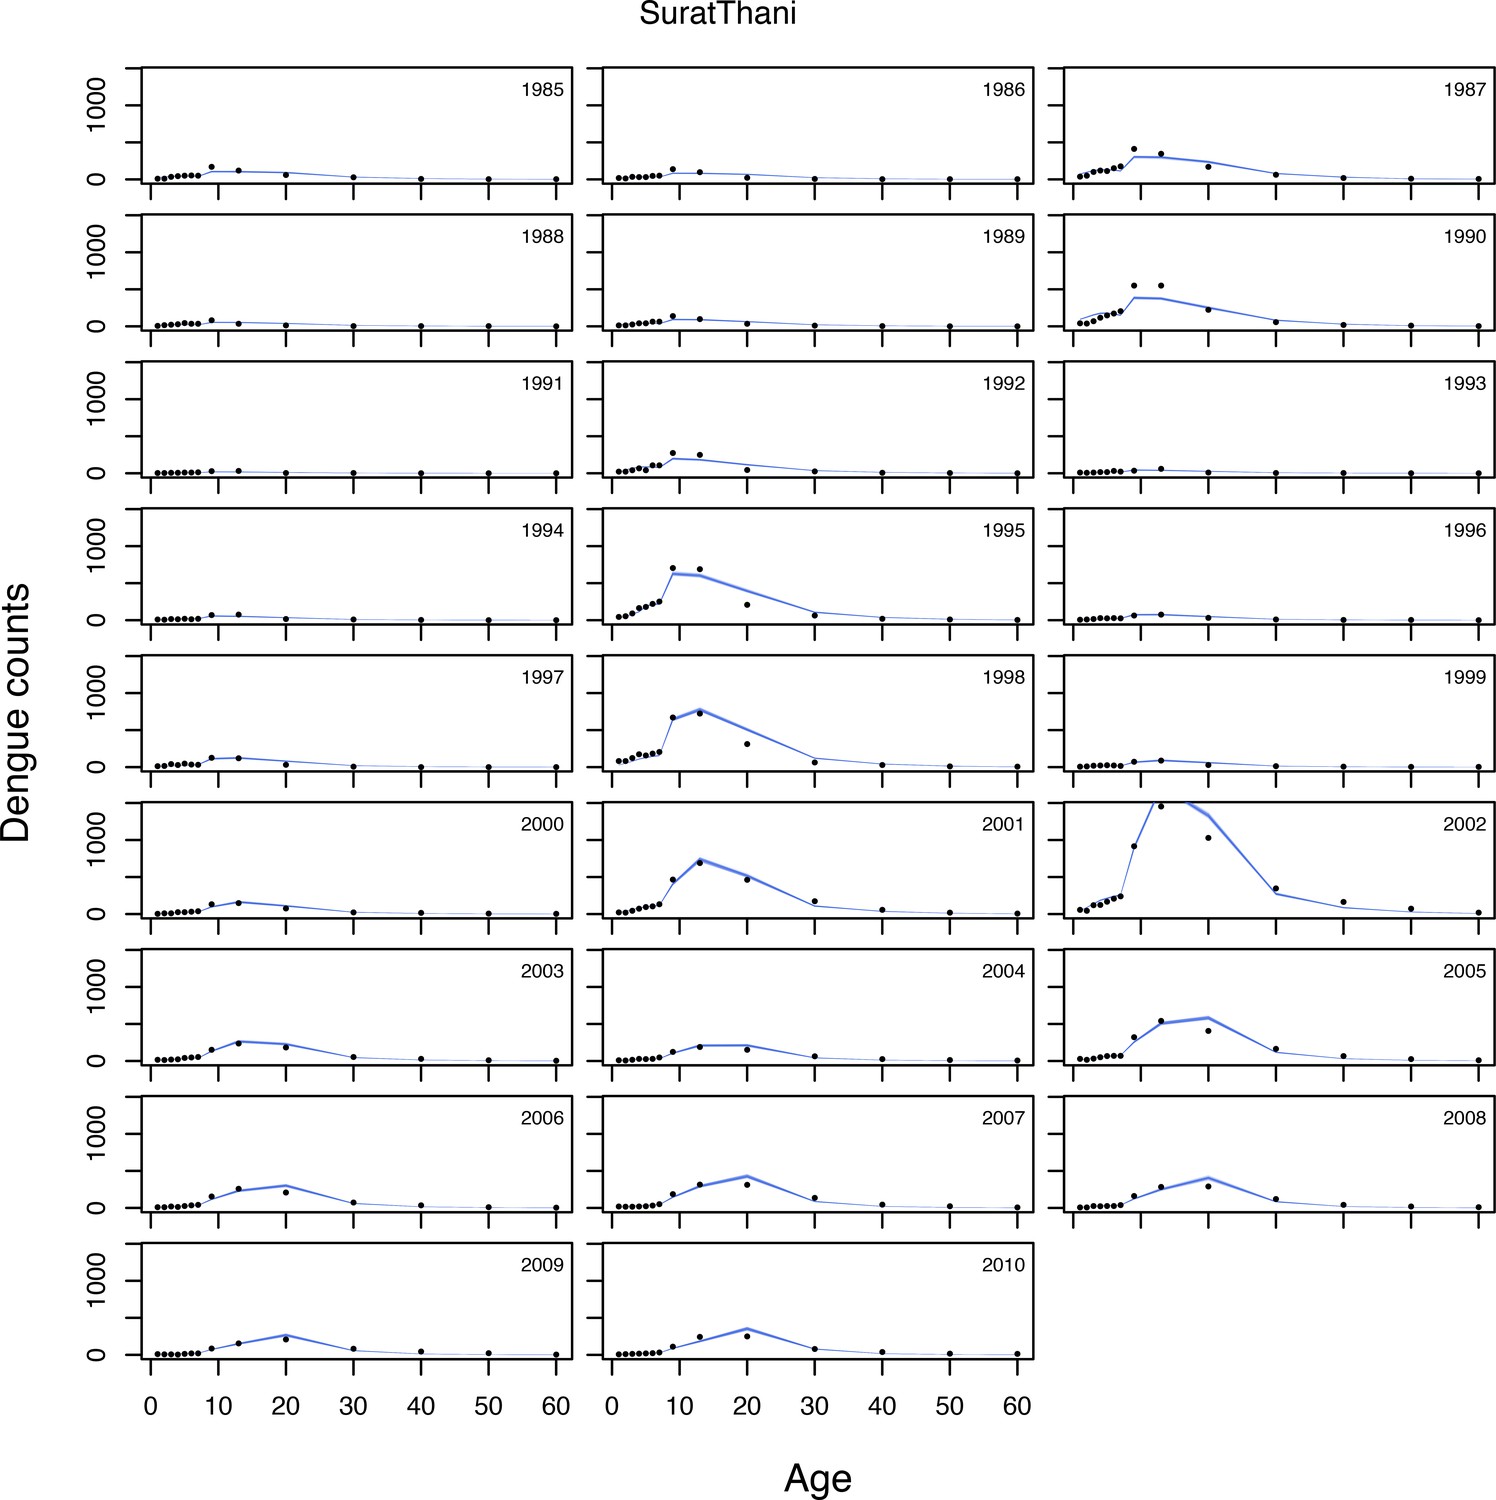
Selected model fits (7).
https://doi.org/10.7554/eLife.45474.029
Author response image 1
Comparison of FOI estimates obtained when using the two alternative model formulations.
Tables
Table 1
Data sources used
https://doi.org/10.7554/eLife.45474.011| Country | Years of data available | Type of report available | Type of report used | No. admin units analyzed* | Source of dengue data | Source of census data |
|---|---|---|---|---|---|---|
| Thailand | 1985–2010 | DHF | DHF | 72 | (Bureau of Epidemiology, Department of Disease Control, 2019) | (National Statistical Office Thailand, 2017) |
| Colombia | 2007–2012 | DHF/DF | All cases | 28/211 | (Instituto Nacional de Salud Colombia, 2016) | (DANE, 2019) |
| Brazil | 1998–2015 | DHF/DF† | DHF | 21 | (Ministério da Saude, 2017) | (Instituto Brasileiro de Geografia e Estadistica, 2017) |
| Mexico | 2000–2009 | DHF/DF | All cases | 27 | (Direccion General de Epidemiología, 2017) | (Instituto Nacional de Estadistica y Geografia, 2016) |
-
*Admin level one/Admin level two units with at least 150 cases reported
†Data from Brazil is on hospitalized dengue fever and dengue hemorrhagic fever cases.
Table 2
Association between environmental variables and dengue force of infection for 211 municipalities in Colombia
https://doi.org/10.7554/eLife.45474.012| Variable | Unadjusted | Adjusted | ||
|---|---|---|---|---|
| Estimate | 95% CI | Estimate | 95% CI | |
| Elevation (per 100 m) | −0.005 | −0.003,–0.006 | −0.007 | −0.008,–0.006 |
| Mean temperature (per °C) | 0.006 | 0.004, 0.007 | ||
| Mean weekly precipitation | 0.0001 | −0.000, 0.001 | −0.0005 | −0.0008, −0.0002 |
| Population density | −0.001 | −0.003, 0.001 | 0.007 | 0.004, 0.009 |
Table 3
Association between environmental variables and the log incidence of dengue (over the last 5 years) for 211 municipalities in Colombia.
https://doi.org/10.7554/eLife.45474.013| Variable | Unadjusted | Adjusted* | ||
|---|---|---|---|---|
| Estimate | 95% CI | Estimate | 95% CI | |
| Elevation (per 100 m) | −0.02 | −0.03, 0 | 0.01 | −0.01, 0.03 |
| Mean temperature (per °C) | 0.01 | 0, 0.05 | ||
| Mean weekly precipitation | 0 | 0, 0 | −0.002 | −0.01, 0 |
| Population density | −0.04 | −0.07,–0.01 | −0.06 | −0.10, −0.02 |
| * R2 of adjusted model: 0.04 | ||||
Additional files
-
Transparent reporting form
- https://doi.org/10.7554/eLife.45474.014
Download links
A two-part list of links to download the article, or parts of the article, in various formats.
Downloads (link to download the article as PDF)
Open citations (links to open the citations from this article in various online reference manager services)
Cite this article (links to download the citations from this article in formats compatible with various reference manager tools)
Opportunities for improved surveillance and control of dengue from age-specific case data
eLife 8:e45474.
https://doi.org/10.7554/eLife.45474


