Sonic hedgehog signaling in astrocytes mediates cell type-specific synaptic organization
- Drexel University, United States
- Drexel University College of Medicine, United States
- Harvard Medical School, United States
Figures
Figure 1
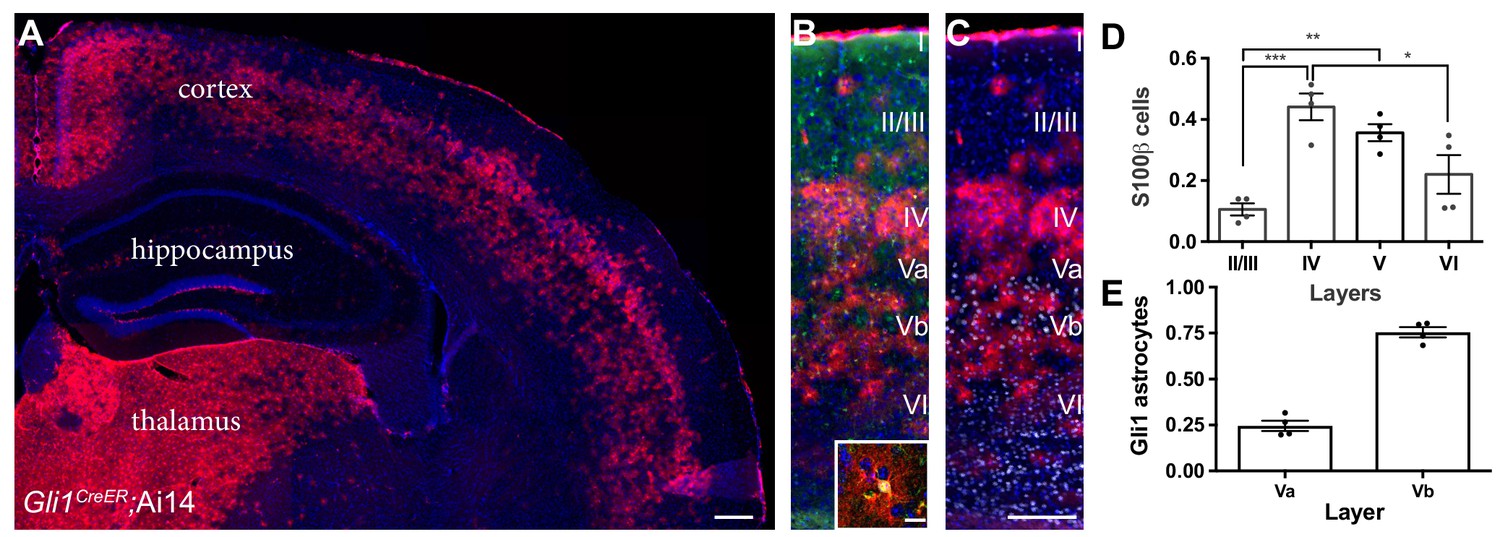
Gli1 astrocytes are distributed in a laminar-specific manner.
(A) Tamoxifen- induced reporter expression in Gli1CreER/+;Ai14 mice reveals a laminar distribution of cells undergoing active Shh signaling (red). Scale bar, 250 μm. (B) Gli1+ cells (red) are a subset of all astrocytes (S100β, green, see inset; scale bar, 12.5 μm). (C) Layer analysis of Gli1 astrocytes (red) with DAPI and the deep layer marker Ctip2 (gray) illustrate their layer-specific organization. Scale bar, 125 μm. (D) The fraction of astrocytes expressing Gli1 in each cortical layer. Data points indicate individual animals, bars represent mean ± SEM. Statistical significance was assessed by one-way ANOVA with Tukey’s post hoc test for multiple comparisons. *, p<0.05; **, p<0.01; ***, p<0.001. (E) The fraction of Gli1 astrocytes in sublayers Va and Vb. Bar graphs represent mean value ± SEM. n = 4 animals.
-
Figure 1—source data 1
Distribution of Gli1 astrocytes in cortical layers.
- https://doi.org/10.7554/eLife.45545.004
Figure 2 with 3 supplements
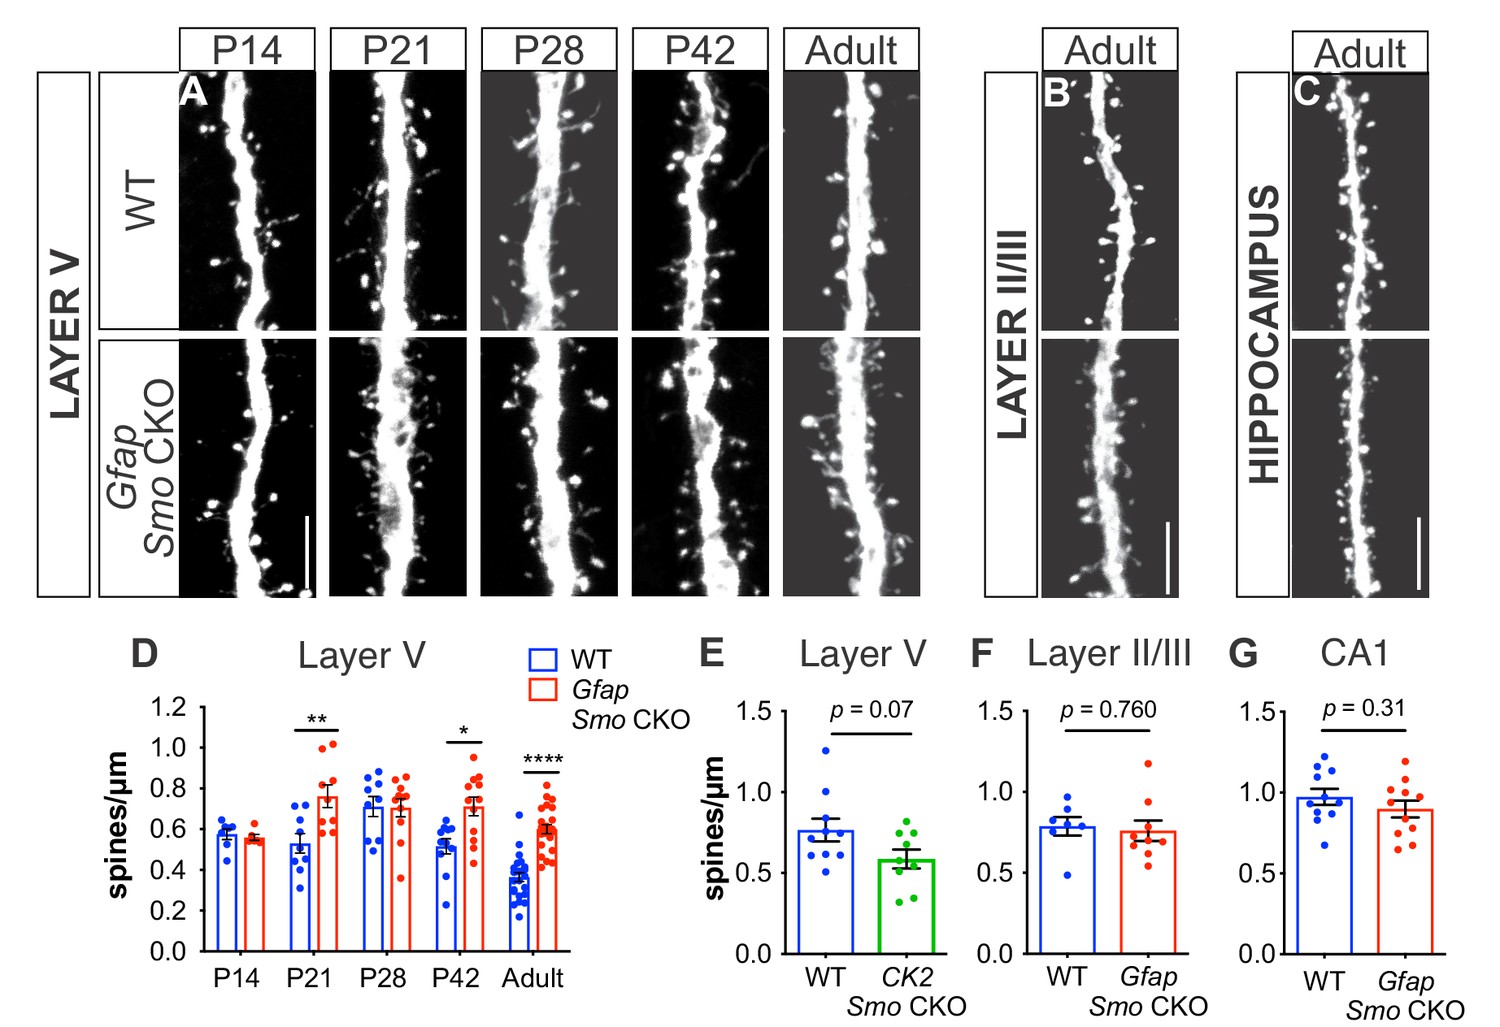
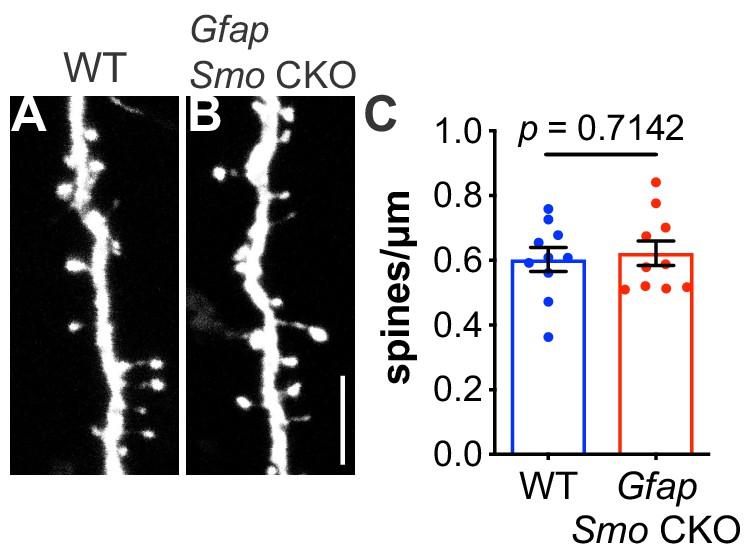
Loss of Shh signaling in astrocytes results in increased spine density on layer V neurons.
(A-C) GFP immunostaining of representative apical dendritic segments from (A) layer V neurons, (B) layer II/III neurons, and (C) CA1 neurons in WT and Gfap Smo CKO mice. Scale bar, 5 μm. (D) Spine density of apical dendrites from layer V neurons across various postnatal ages and in adult mice. Data points represent individual cells, bars represent mean ± SEM. Statistical analysis performed by two-way ANOVA with Tukey’s post-hoc test for multiple comparisons. *, p<0.05; **, p<0.01; ****, p<0.0001. Significance is stated as Gfap Smo CKO compared to WT at a given age. (E) Spine density of apical dendrites from layer V neurons in adult CamKIIa Smo CKO mice. (F–G) Spine density of apical dendrites from layer II/III (F) and CA1 pyramidal neurons (G) in WT and Gfap Smo CKO mice. Data points represent individual cells, bars represent mean ± SEM. Statistical significance assessed by Student’s t-test. n ≥ 3 animals per genotype for all ages except P14, where n = 2 animals per genotype.
-
Figure 2—source data 1
Analysis of spine density.
- https://doi.org/10.7554/eLife.45545.010
Figure 2—figure supplement 1
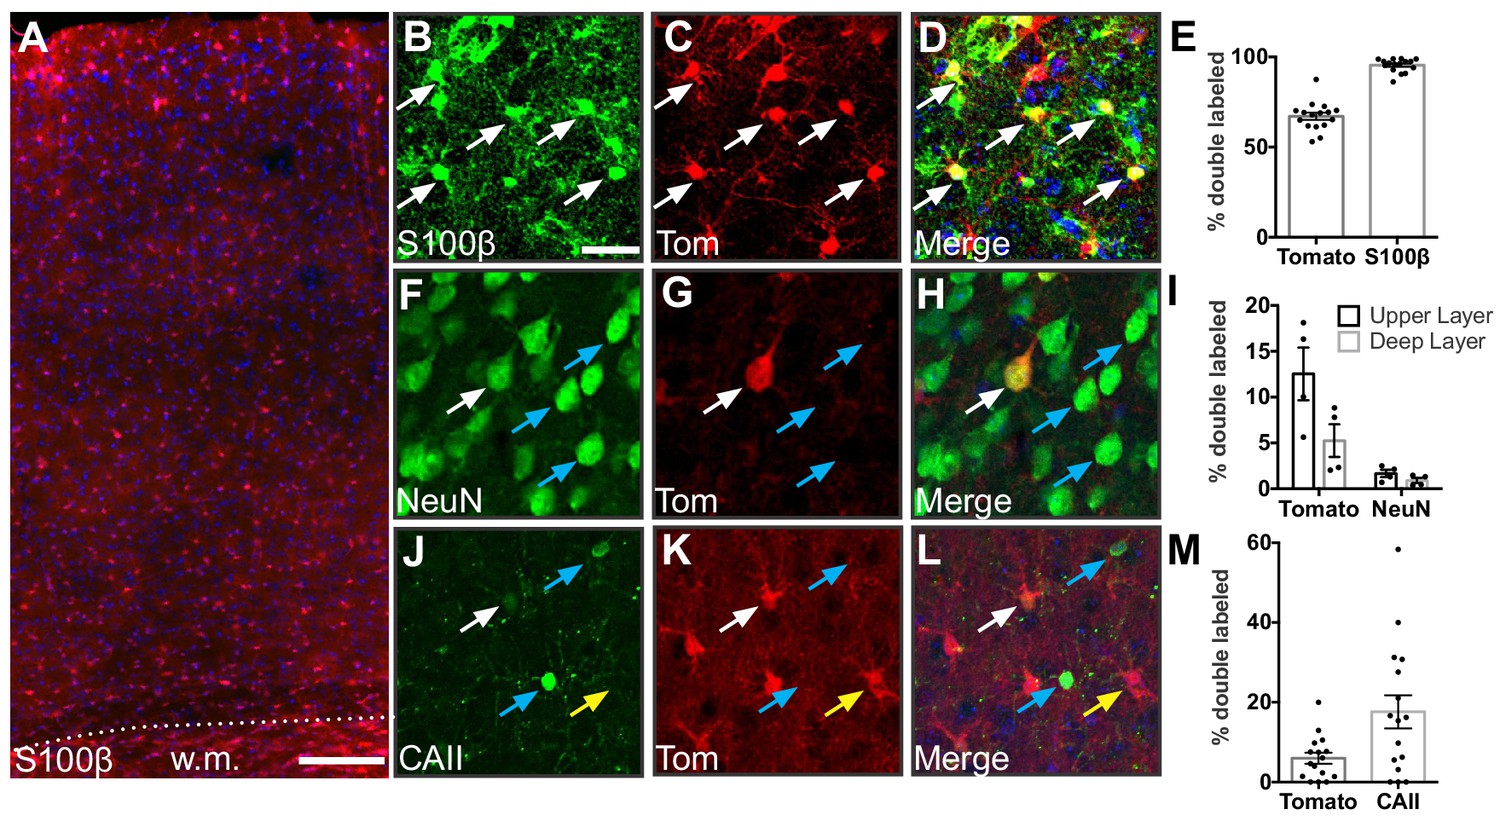
Gfap-Cre recombination occurs primarily in astrocytes.
(A) Representative image of tdTomato expression in the cortex of Gfap-Cre;Ai14 mice. w.m., white matter. Scale bar, 125 μm. (B–D) Expression of the astrocyte marker S100β and tdTomato in somatosensory cortex. Scale bar, 25 μm. (E) Fraction of recombined cells identified as astrocytes in the cortex of adult Gfap-Cre;Ai14 mice. (F–H) Expression of the neuronal marker NeuN and tdTomato in somatosensory cortex. (I) Fraction of recombined cells identified as neurons. (J– L) Expression of the oligodendrocyte marker CAII and tdTomato in somatosensory cortex. (M) Fraction of recombined cells identified as oligodendrocytes. White arrows show double-labeled cells, blue arrows show cells that express the indicated marker but are tomato-negative, and yellow arrows show single-labeled tomato-positive cells. Data points represent individual brain sections analyzed. Bar graphs represent mean ± SEM. n = 2 animals, four sections per animal.
Figure 2—figure supplement 2
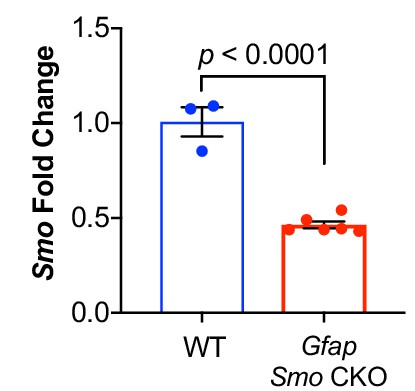
Gfap Smo CKO mice have reduced levels of Smo.
Quantitative PCR of cortical RNA shows a significant reduction in Smo expression. Data points represent individual animals, bars represent mean ± SEM. Statistical analysis assessed by unpaired Student’s t-test.
-
Figure 2—figure supplement 2—source data 1
Quantification of Smo mRNA.
- https://doi.org/10.7554/eLife.45545.008
Figure 2—figure supplement 3
Spine density on layer V basal dendrites are not affected in adult Gfap Smo CKO mice.
(A–B) Representative images of basal dendrites analyzed from layer V neurons expressing Thy1-GFPm in both WT (Smofl/fl) and Gfap Smo CKO (Gfap Smofl/fl) animals. Scale bar, 5 μm. (C) Graph comparing the density of spines on basal dendrites from WT and Gfap Smo CKO animals. Data points represent individual cells, bars represent mean ± SEM. Statistical significance was assessed using unpaired Student’s t-test. n = 3 animals per genotype.
Figure 3 with 2 supplements
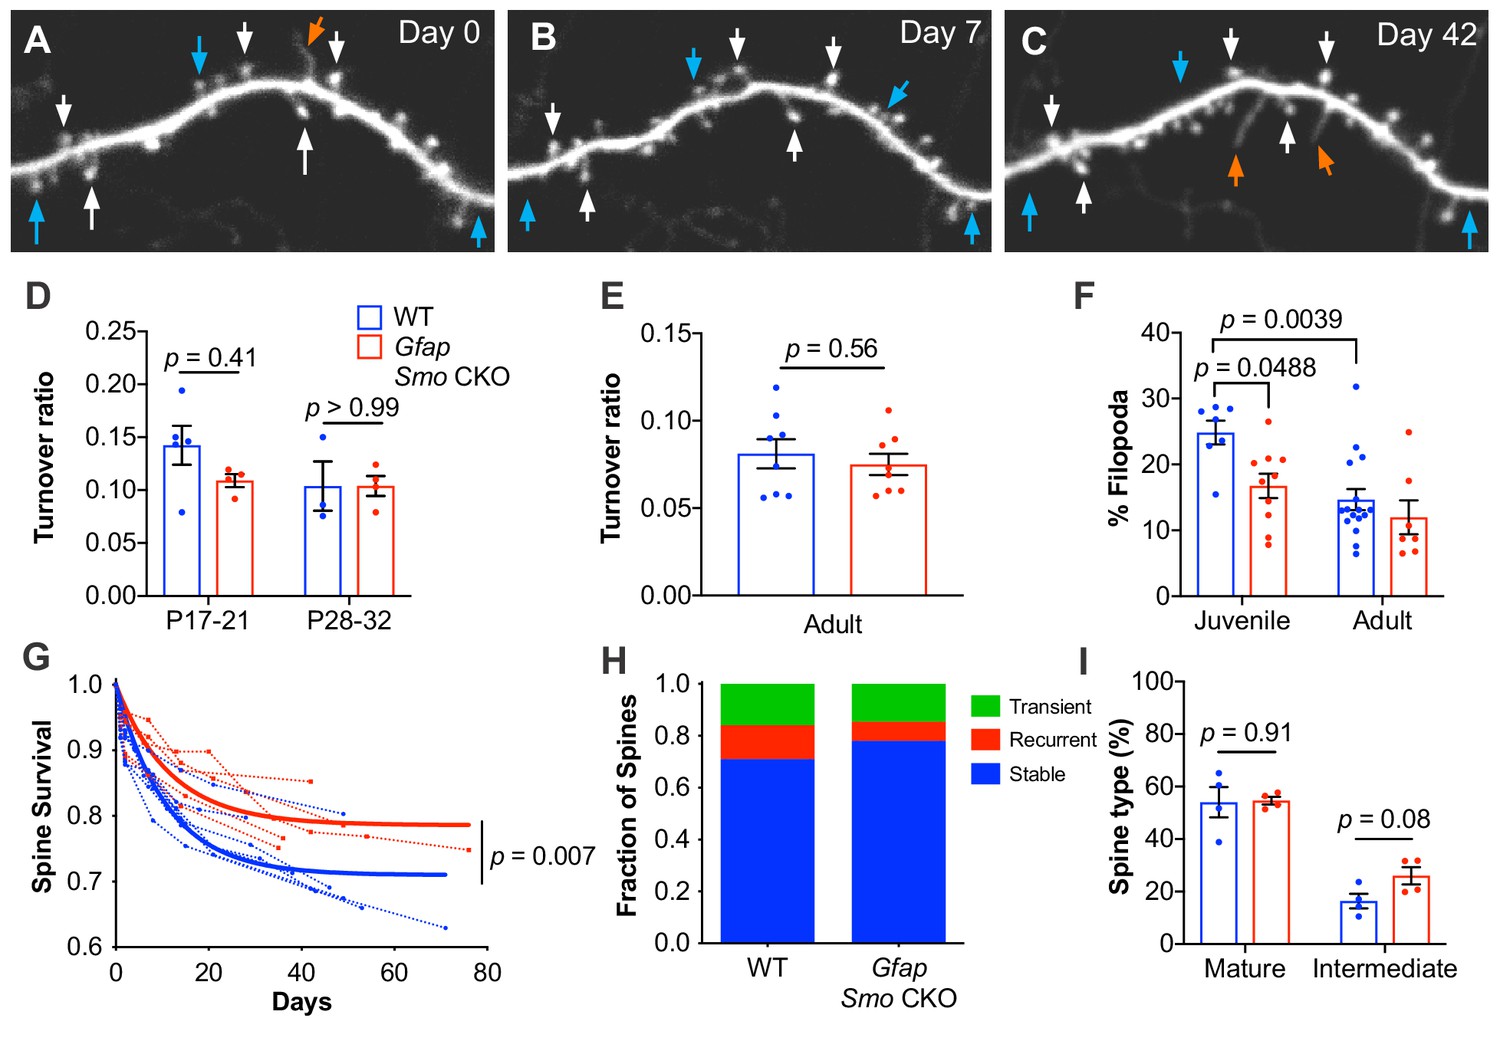
Loss of astrocytic Shh signaling impairs structural plasticity.
(A–C) Example dendrite segment imaged repeatedly over 6 weeks. Day 0 indicates the first day of imaging, subsequent imaging days indicated. White arrows, stable spines; cyan arrows, transient spines; orange arrows, filopodia. (D) Turnover ratios in WT (n = 3–5 animals per age group) and Gfap Smo CKO juvenile mice (n = 4 animals per age group) analyzed over 2 days. (E) Turnover ratios in WT (n = 8 animals) and Gfap Smo CKO (n = 8 animals) adult mice analyzed over 7 days. Statistical analysis by two-way ANOVA, Tukey’s post hoc test (D) and unpaired Student’s t-test (E). (F) Fraction of protrusions identified as filopodia in juvenile (WT, n = 7 animals; Gfap Smo CKO, n = 10 animals) and adult mice (WT, n = 16: Gfap Smo CKO, n = 7 animals). Statistics by two-way ANOVA, Tukey’s post hoc test. (G) Comparison of spine survival curves for WT and Gfap Smo CKO neurons. Each dashed curve represents the curve from an individual mouse (WT, n = 7 animals; Gfap Smo CKO, n = 5 animals). Solid curves represent best-fits to exponential decay models. (H) The fraction of spines belonging to the stable, recurrent, and transient populations. Statistical significance was assessed by Student’s t-test for each class (stable, recurrent, or transient; n = 7 and 8 animals, WT and Gfap Smo CKO, respectively). Stable, p=0.0485; Recurrent, p=0.1023; Transient, p=0.7709. (I) Breakdown of spine morphology in juvenile mice. Statistical analysis by unpaired Student’s t-test for each spine class. For graphs D-F and I, data points represent individual animals, bars represent mean ± SEM.
-
Figure 3—source data 1
Spine turnover data.
- https://doi.org/10.7554/eLife.45545.014
-
Figure 3—source code 1
MATLAB-based custom-written code for longitudinal analysis of spine dynamics.
SpineTracking generates a longitudinal tracking file that stores the x,y,z location of each feature, along with its status (missing/present/filopodia) for each tile, LongSurvival gathers all the tiles and pools the data to give the final survival curves for each mouse, and FeatLong is used for examining each feature individually.
- https://doi.org/10.7554/eLife.45545.015
Figure 3—figure supplement 1
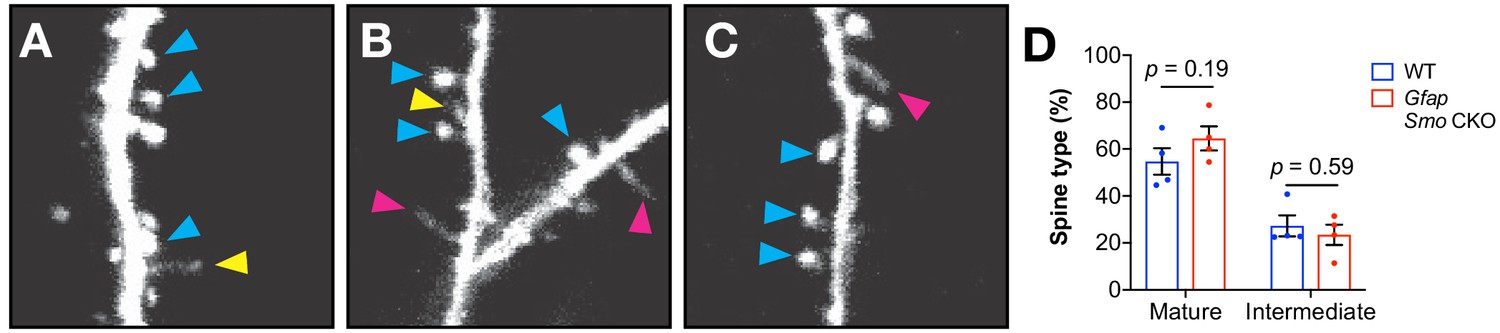
Classification of protrusions.
(A–C) Several examples of protrusions classified as mushroom (blue arrowheads) or intermediate (yellow arrowheads) spines, and filopodia (pink arrow- heads). Note the thin stalk and small bulbous head of the intermediate spine in A, whereas filopodia lack a discerible head (B and C). (D) The fraction of protrusions classified as mush- room or intermediate in adult Gfap Smo mice and WT controls. Data points represent individual animals, bars represent mean ± SEM. Statistical analysis by unpaired Student’s t-test.
Figure 3—figure supplement 2
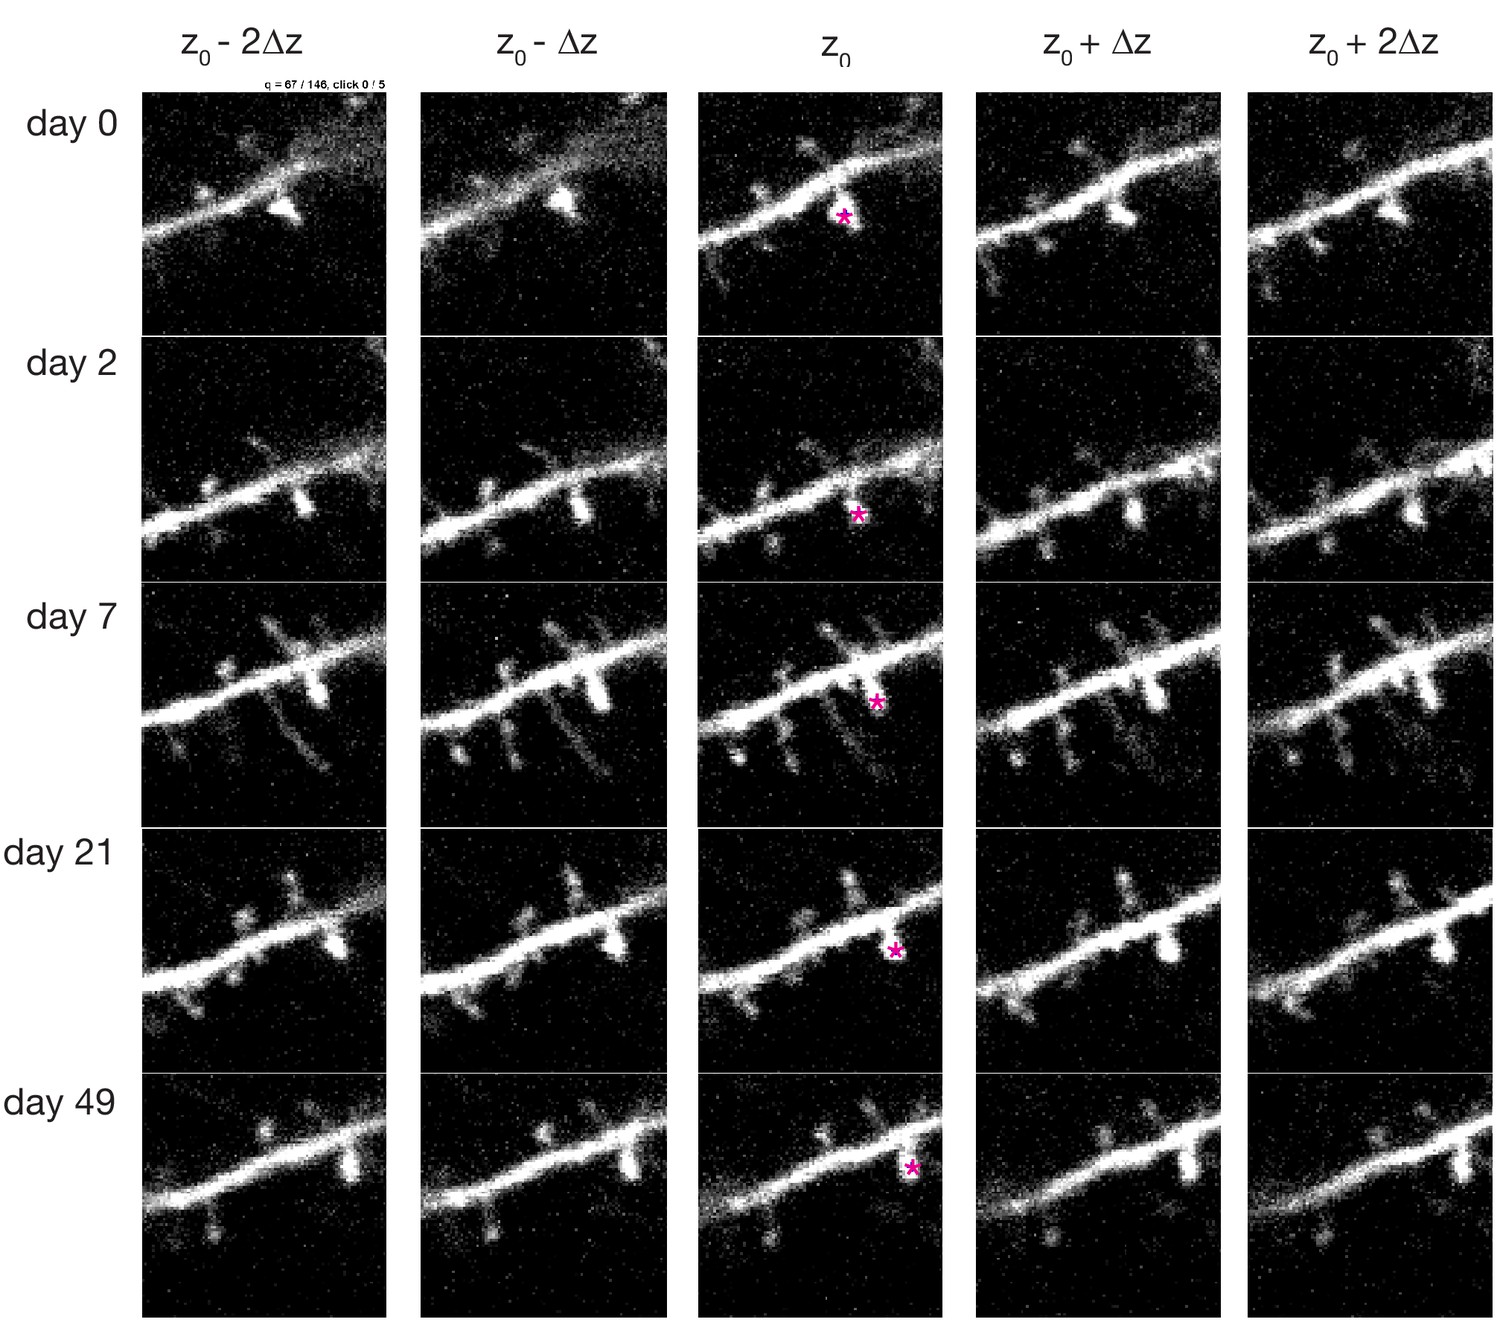
Screenshot depicting the graphical user interface used for longitudinal tracking of spines across multiple days of imaging.
A spine identified in the first imaging session (pink star, top central panel) is presented to the user for scoring. The same spine is manually tracked across subsequent days (rows). For each day, multiple frames above and below the estimated z-plane corresponding to that spine, Z0, are also presented (columns). For each timepoint, the user then clicks on the spine’s head using the frame that best captures the spine. In this case, the frame jump, Δz, was set to 1, and four neighboring frames are presented; these parameters can be adjusted as necessary.
Figure 4 with 1 supplement
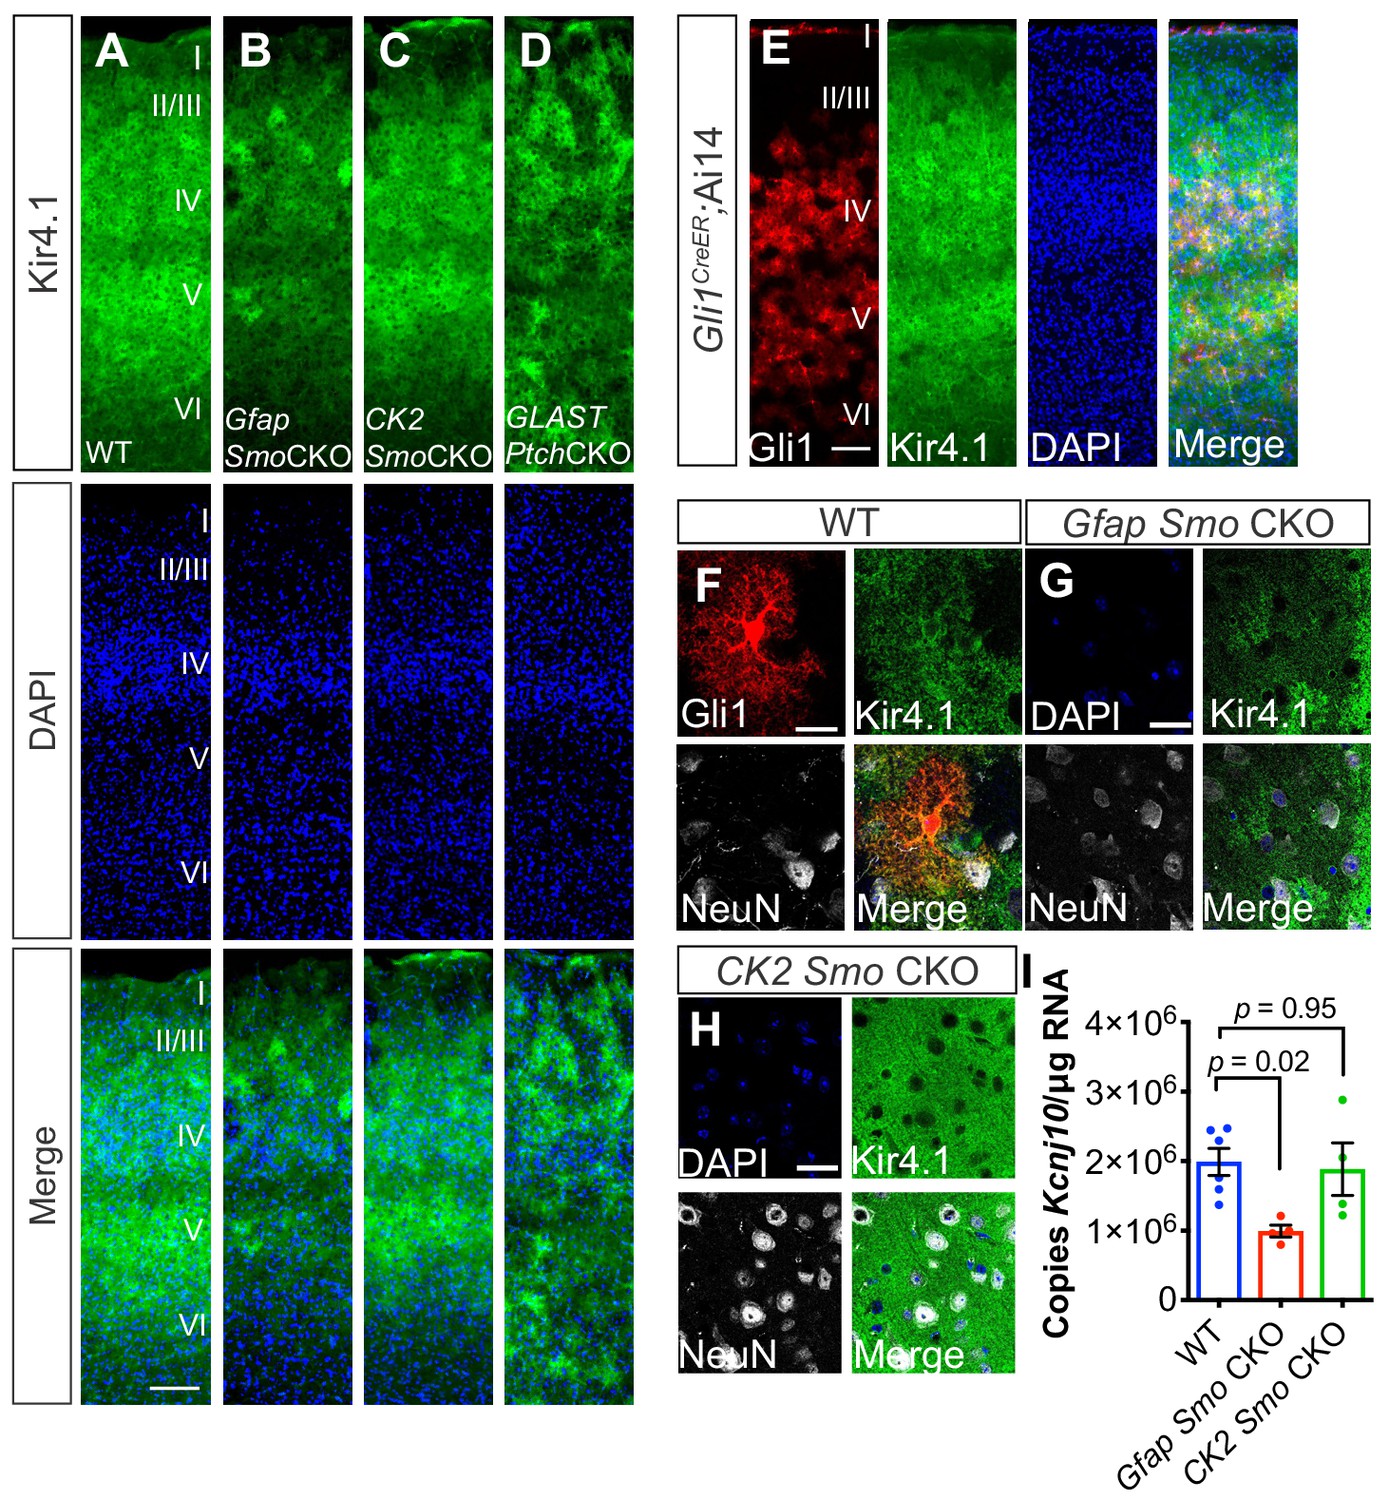
Shh signaling regulates Kir4.1 expression in the cortex.
(A–D) Immunofluorescence for Kir4.1 in the cortex of adult WT (A), Gfap Smo CKO (B), CK2 Smo CKO (C) and GLAST Ptch CKO mice (D). Scale bar, 125 μm. (E) Fluorescence micrographs showing the distribution of Gli1 astrocytes (red) and Kir4.1 (green) in the cortex of an adult Gli1CreER/+;Ai14 mouse counterstained with DAPI (blue). (F–G) Confocal images of Gli1 (F, red) Kir4.1 (green) and NeuN (white) from adult WT (F), Gfap Smo CKO (G), or CamK2a Smo CKO (H) mice. Scale bar, 25 μm. (I) Gene expression levels in the cortex of Kcnj10 from WT (n = 6 animals) and Gfap Smo CKO or CK2 Smo CKO mice (n = 4 each). Data points represent individual animals and bar graphs represent mean value ± SEM. Statistical significance was assessed by one-way ANOVA with Tukey’s test for multiple comparisons. Significance stated on the graph is compared to WT.
-
Figure 4—source data 1
Measurement of gene expression.
- https://doi.org/10.7554/eLife.45545.018
Figure 4—figure supplement 1
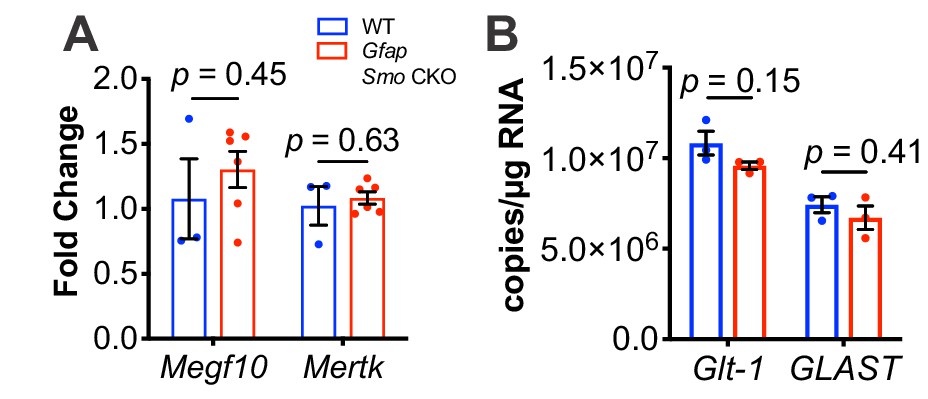
Quantitative PCR analysis of known spine and synapse modulators shows no change in expression in Gfap Smo CKO mice.
(A) Quantitative PCR shows no change in Megf10 or Mertk in Gfap Smo CKO animals compared to controls (n = 3 and 6 samples of cortical RNA from WT and Gfap Smo CKO animals, respectively). Statistical significance assessed by unpaired Student’s t-test of the quantification cycles for each sample. Error bars represent standard error of the mean. (B) Droplet digital PCR shows no difference in the number of transcripts of either Glt1 or Glast in Gfap Smo CKO animals (n = 3 cortical RNA samples per genotype). Statistical significance assessed by unpaired Student’s t-test of the copy number for each target in each genotype. Error bars represent standard error of the mean.
Figure 5 with 1 supplement
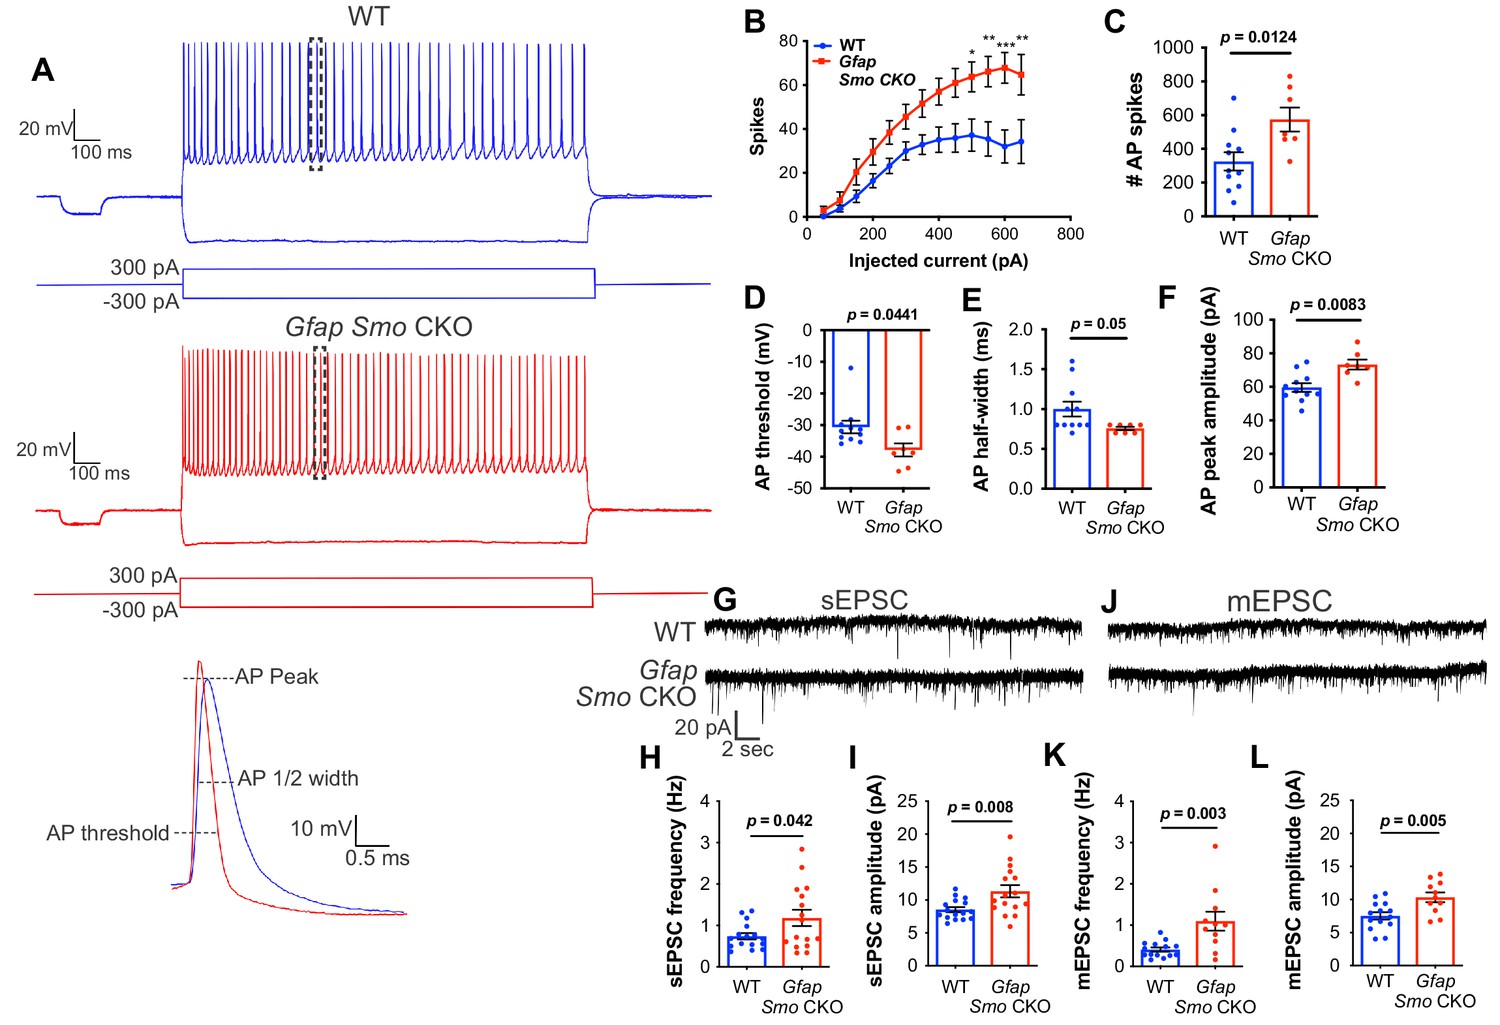
Neurons in Gfap Smo CKO mice exhibit a significant increase in excitability and synaptic transmission.
(A) Example traces of action potentials from layer V pyramidal neurons in WT and Gfap Smo CKO mice at P21. Samples of action potential spikes (dashed lines, lower panel) describe AP threshold, AP peak amplitude, and AP 1⁄2 width of pyramidal neurons. (B) Line graph displays relationship between action potential spike numbers (y-axis) and current injection; Gfap Smo CKO neurons exhibit an increase in AP spikes (>500 pA) compared to WT neurons. Statistical significance was assessed by two-way ANOVA with Sidak’s test for multiple comparisons and stated as Gfap Smo CKO compared to WT at a given current (n = 11 and 7 cells from WT and Gfap Smo CKO, respectively). (C–F) Bar graphs describe an increase in total AP spike numbers (C), reduction in AP threshold (mV) (D), reduction in AP 1/2 width (E), and increase in AP peak amplitude (pA) (F) in Gfap Smo CKO neurons. (G) Example traces of sEPSCs from layer V pyramidal neurons recorded in the presence of picrotoxin from WT and Gfap Smo CKO mice at P21. (H–I) Summary graphs of sEPSC frequency and amplitude (n = 14 and 11 cells from WT and Gfap Smo CKO animals, respectively). (J) Example traces of mEPSCs from layer V pyramidal neurons recorded in the presence of picrotoxin and TTX. (K–L) Summary graphs of mEPSC frequency and amplitude (n = 16 cells per genotype). Gfap Smo CKO neurons exhibit increases in both frequency and amplitude in sEPSCs and mEPSCs recordings. Statistical significance was assessed by unpaired Student’s t-test. For each graph, data points represent individual cells. All data are from at least three animals per genotype.
-
Figure 5—source data 1
Physiological properties of neurons and response to current injections.
- https://doi.org/10.7554/eLife.45545.021
-
Figure 5—source data 2
Measurements of spontaneous and miniature EPSCs.
- https://doi.org/10.7554/eLife.45545.022
Figure 5—figure supplement 1
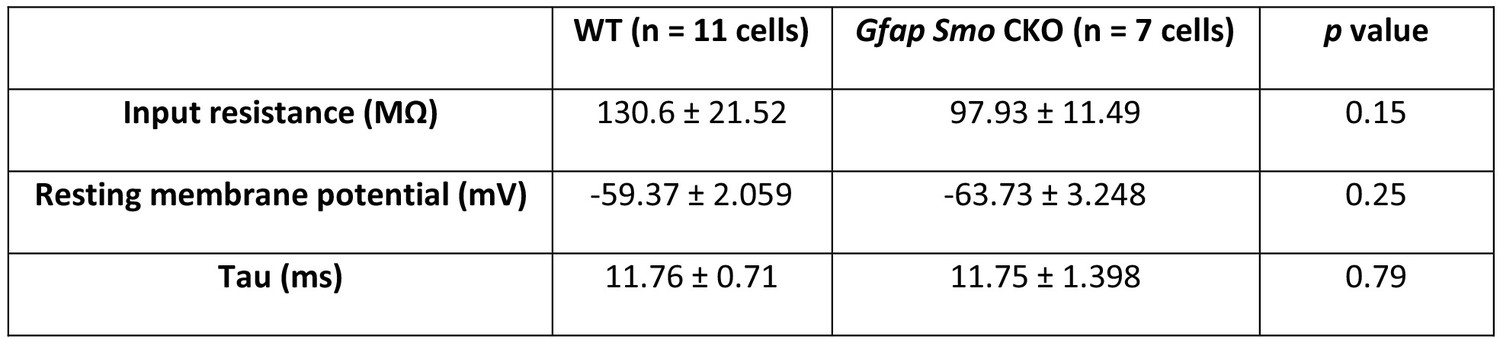
Membrane properties of Gfap Smo CKO layer V pyramidal neurons.
There is a significant decrease in input resistance (MΩ) in Gfap Smo CKO neurons compared to WT neurons. No significant differences were observed in resting membrane potential (mV), rheobase (pA), and tau (ms) in Gfap Smo CKO neurons. Statistical significance was assessed by Mann-Whitney U test (input resistance and tau) and unpaired Student’s t-test (resting membrane potential).
Figure 6 with 1 supplement
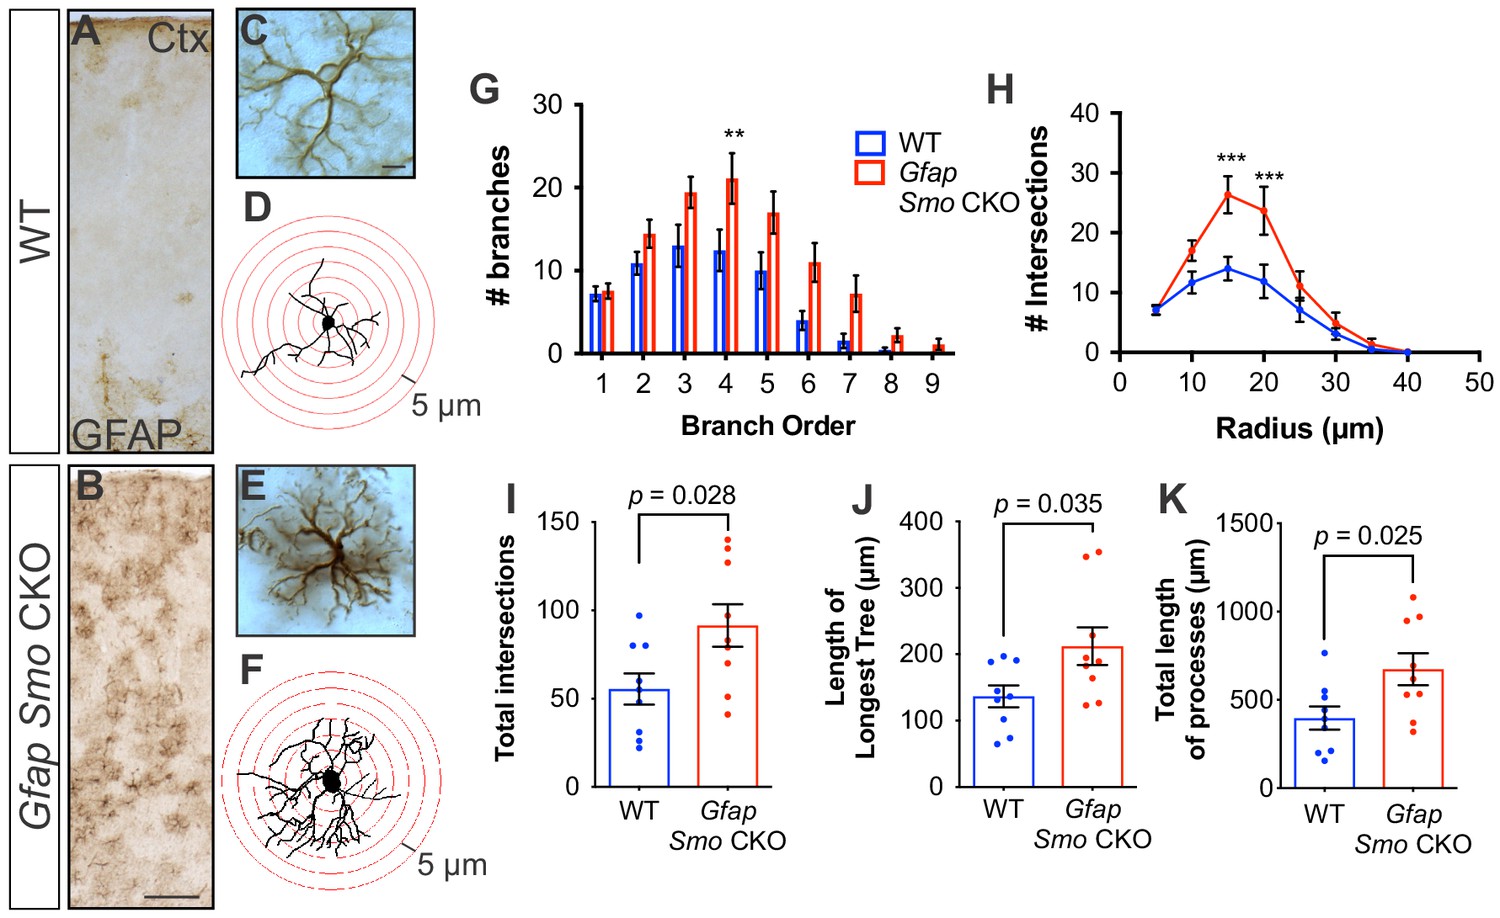
Disruption of Shh signaling in astrocytes results in widespread reactive changes in morphology.
(A–B) Brightfield immunohistochemistry reveals a reactive upregulation of GFAP across cortical layers in Gfap Smo CKO astrocytes. Scale bar, 125 μm. (C and E) Representative high-magnification images of both WT (C) and Gfap Smo CKO (E) astrocytes are shown. Scale bar, 10 μm. (D and F) Representative traces of GFAP expression from WT (D) and Gfap Smo CKO (F) cortical astrocytes. (G and H) Sholl analysis shows significant increases in complexity of Gfap Smo CKO astrocytes compared to WT controls. Statistical significance was assessed by one-way ANOVA with Bonferroni’s for multiple comparisons. (I–K) Quantification of various morphological features of traced astrocytes. Statistical analysis performed by one-way ANOVA (G and H) and unpaired Student’s t-test (I–K). Data points represent individual cells. Graphs represent mean value ± SEM. n = 3 animals per genotype.
-
Figure 6—source data 1
Sholl analysis of cortical astrocytes.
- https://doi.org/10.7554/eLife.45545.025
Figure 6—figure supplement 1
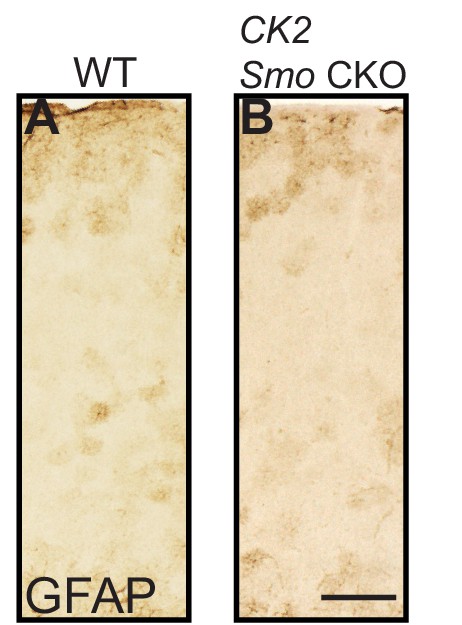
Reactive gliosis does not occur when neuronal Shh signaling is disrupted.
Brightfield immunohistochemistry for GFAP in the cortex of an adult CamKIIa;Smo fl/fl animal (B) and littermate control (A) shows comparable levels of GFAP expression. Scale bar, 125 μm.
Tables
Key resources table
| Reagent type (species) or resource | Designation | Source or reference | Identifiers | Additional information |
|---|---|---|---|---|
| Genetic reagent (M. musculus) | Gli1CreER/+ | The Jackson Laboratory; Ahn and Joyner, 2005 | stock no. 7913 | from Alexandra Joyner, MSKCC |
| Genetic reagent (M. musculus) | Ai14 (B6.Cg-Gt(ROSA)26Sortm14(CAG-tdTomato)Hze/J) | The Jackson Laboratory; Madisen et al., 2010 | stock no.7914 | |
| Genetic reagent (M. musculus) | Gfap-Cre, line 73.12 | The Jackson Laboratory; Garcia et al., 2004 | stock no. 12886 | from Michael Sofroniew, UCLA |
| Genetic reagent (M. musculus) | Smofl/fl | The Jackson Laboratory; Long et al., 2001 | stock no.4526 | |
| Genetic reagent (M. musculus) | CamKinaseIIα-Cre (CamKIIα-Cre) | The Jackson Laboratory; Tsien et al., 1996 | stock no. 5359 | |
| Genetic reagent (M. musculus) | Thy1-GFPm | The Jackson Laboratory; Feng et al., 2000 | stock no. 7788 | |
| Chemical compound, drug | tamoxifen | Sigma | catalog no. T5648 | |
| Antibody | Polyclonal rabbit anti-GFP | Millipore | catalog no. AB3080 | 1:5000 (brightfield); 1:1000 (fluorescence) |
| Antibody | Polyclonal rabbit anti-Kir4.1 | Millipore | catalog no. AB5818 | 1:1000 (fluorescence) |
| Antibody | Polyclonal rabbit anti-Gfap | Agilent Dako | catalog no. Z033429-2; | 1:20,000 (brightfield) |
| Antibody | Monoclonal mouse anti-NeuN | Millipore | catalog no. MAB377 | 1:1000 (fluorescence) |
| Antibody | Polyclonal rabbit anti-RFP | MBL International | catalog no. PM005 | 1:500 (fluorescence) |
| Antibody | Monoclonal rat anti-Ctip2 | Abcam | catalog no. ab18465 | 1:2000 (fluroescence0 |
| Antibody | Polyclonal sheep anti-CAII | Bio-Rad | catalog no. AHP206 | 1:2000 (fluorescence) |
| Antibody | Polyclonal rabbit anti-S100B | Agilent Dako | catalog no. Z0311 | 1:1000 (fluorescence) |
| Antibody | Polyclonal rabbit anti-Olig2 | Millipore | catalog no. AB9610 | 1:1000 (fluorescence) |
| Software, algorithm | computer assisted tracing of dendrites and spines; Sholl analysis of astrocytes | Neurolucida, MBF Biociences | Williston, VT | |
| Software, algorithm | MATLAB-based custom-written code for longitudinal analysis of spine turnover | This paper | Figure 3—source code 1 |
Additional files
-
Transparent reporting form
- https://doi.org/10.7554/eLife.45545.026
Download links
A two-part list of links to download the article, or parts of the article, in various formats.
Downloads (link to download the article as PDF)
Open citations (links to open the citations from this article in various online reference manager services)
Cite this article (links to download the citations from this article in formats compatible with various reference manager tools)
Sonic hedgehog signaling in astrocytes mediates cell type-specific synaptic organization
eLife 8:e45545.
https://doi.org/10.7554/eLife.45545


