Cortico-hippocampal network connections support the multidimensional quality of episodic memory
- Boston College, United States
Figures
Figure 1
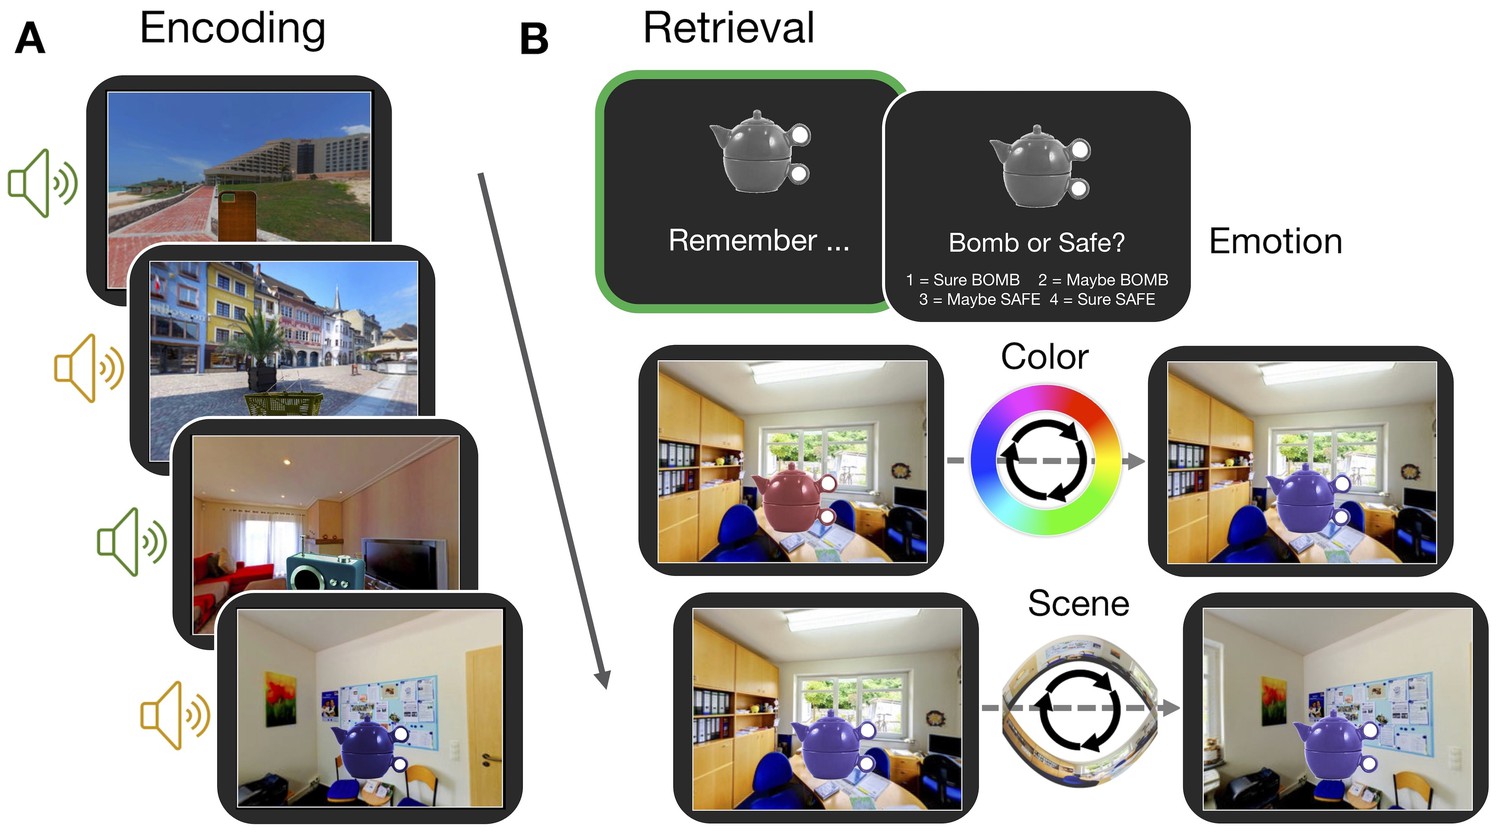
Experiment paradigm.
(A) Participants encoded a series of objects, presented in a specific color and scene location and accompanied by either an emotionally negative (orange; ‘bomb’) or neutral (green; ‘safe’) sound. (B) For each trial in the memory test, participants first retrieved all features associated with an object in their mind (‘remember’ event; green box). This remember event was the basis of all retrieval-related fMRI analyses. Participants then retrieved the individual features of the object sequentially. For questions about the color and scene location, participants recreated the object’s appearance by moving around the 360° color spectrum and panorama scene. Accuracy was measured in terms of error (response - target). Background panoramic images taken from the SUN 360 database (Xiao et al., 2012); objects taken from the Vision and Memory Lab (Brady et al., 2013).
Figure 2
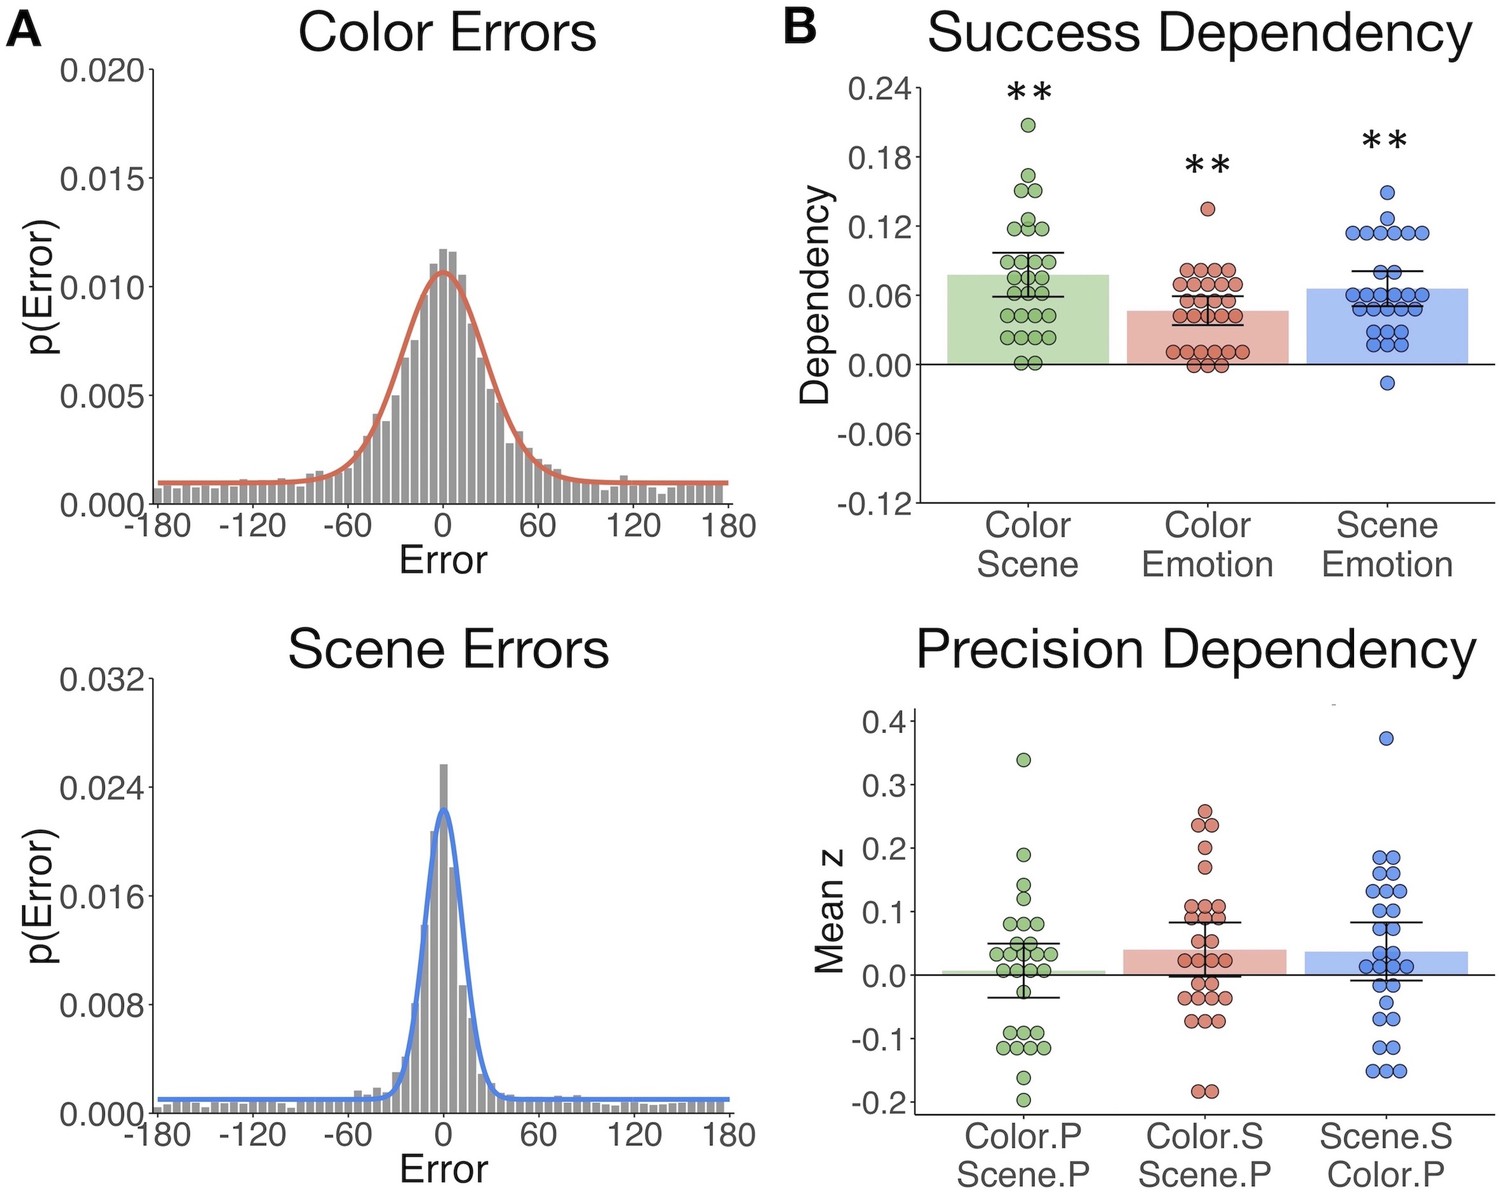
The gist but not precision of episodic features is bound in memory.
(A) Aggregate color and scene location errors (response - target) with the best-fitting mixture model probability density functions overlaid (Figure 2—source data 1). (B) Memory dependency between the features across trials within subjects, in terms of binary ‘correct’ vs. ‘incorrect’ retrieval, and the precision of correctly remembered visual information. The top panel shows corrected dependency for successful recall of each feature pair. This measure reflects the observed dependency of each feature pair after subtracting the expected dependency from the independent model . The bottom panel shows the mean Fisher-transformed Pearson’s correlation between the precision (P) of remembered color and scene trials and successful (S; correct vs. incorrect) retrieval of those features (Figure 2—source data 2). Bars = Mean + /- 95% CI. **=p < 0.001.
-
Figure 2—source data 1
Feature Errors.
- https://doi.org/10.7554/eLife.45591.006
-
Figure 2—source data 2
Feature Memory Dependency.
- https://doi.org/10.7554/eLife.45591.007
Figure 3
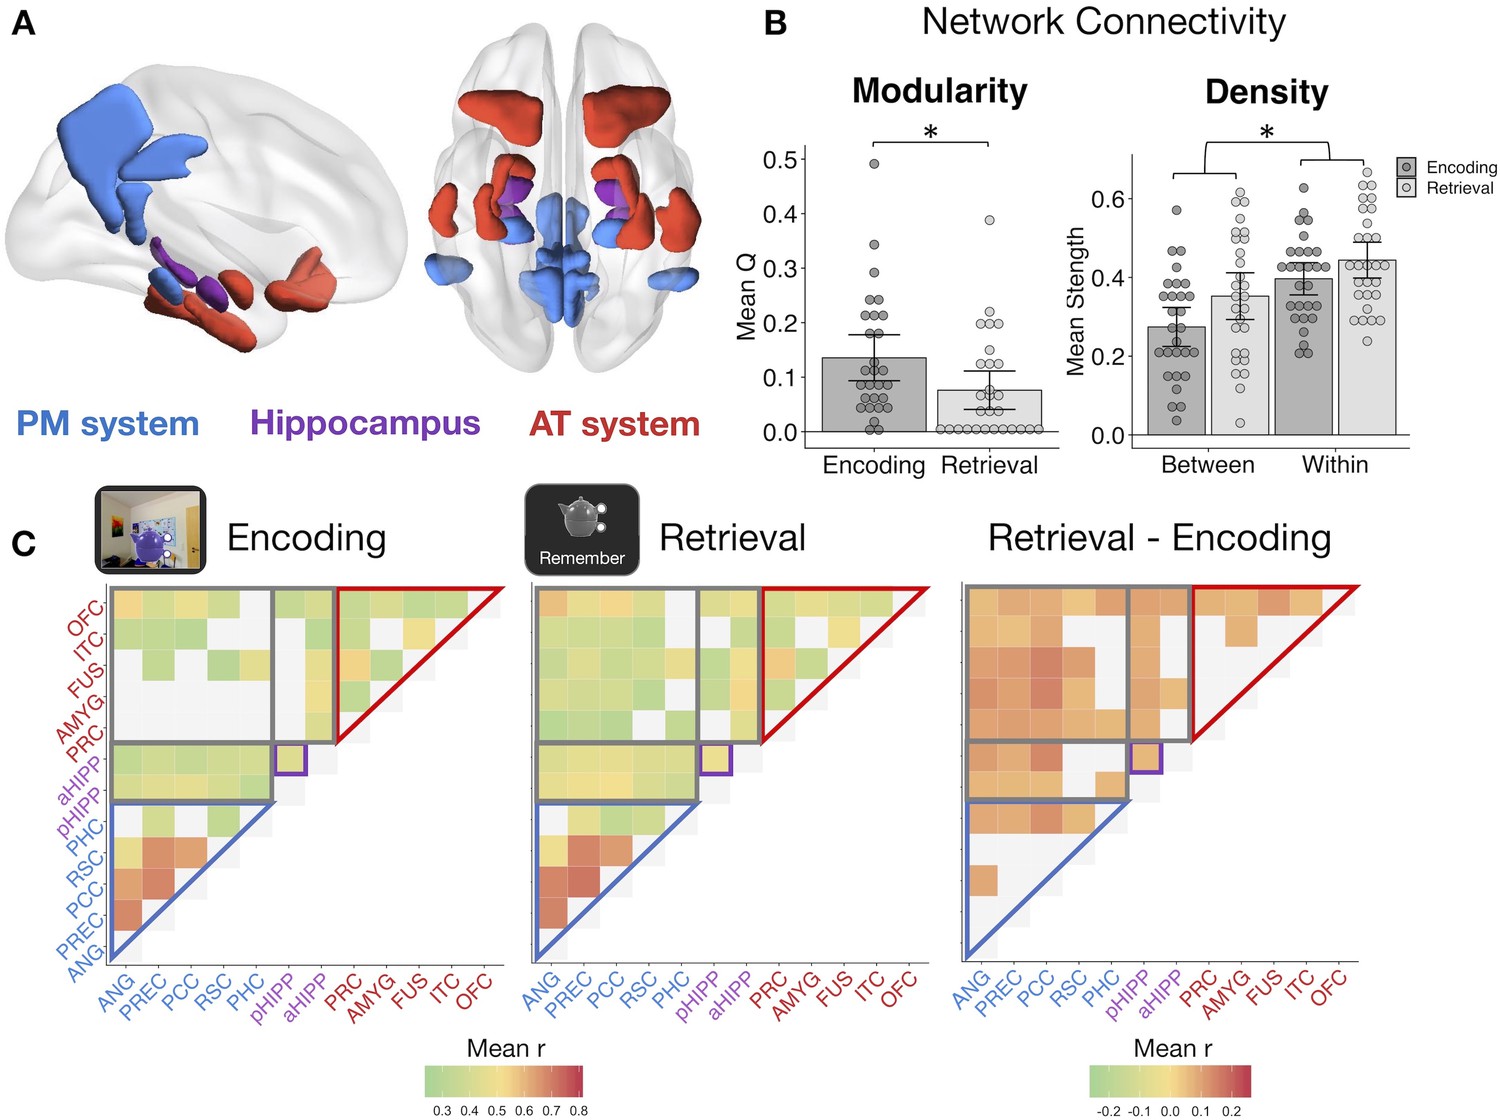
Memory retrieval reduces modularity and increases inter-network background connectivity.
(A) Bilateral anatomical ROIs included in all analyses, obtained from probabilistic atlases in MNI space. PM ROIs: angular gyrus (ANG), precuneus (PREC), posterior cingulate cortex (PCC), retrosplenial cortex (RSC), and parahippocampal cortex (PHC). AT ROIs: perirhinal cortex (PRC), amygdala (AMYG), anterior fusiform gyrus (FUS), anterior inferior temporal cortex (ITC), and lateral orbitofrontal cortex (OFC). Hippocampus was divided into anterior (aHIPP) and posterior (pHIPP). Visualization generated with BrainNet Viewer (Xia et al., 2013). (B) Mean change in functional connectivity between encoding and retrieval (‘remember’) events, including overall modularity as well as between- and within-network density (mean strength of connections, defined as r > 0.25) (Figure 3—source data 1). Bars = Mean + /- 95% CI, points = individual subject mean estimates. *=p < 0.05. (C) Mean ROI-to-ROI connectivity during encoding, retrieval, and retrieval - encoding. Connections shown within a task exceed r = 0.25, p<0.05 FDR-corrected, and connections that change between tasks are significantly different from zero, p<0.05 FDR-corrected.
-
Figure 3—source data 1
Network Modularity and Density.
- https://doi.org/10.7554/eLife.45591.009
Figure 4
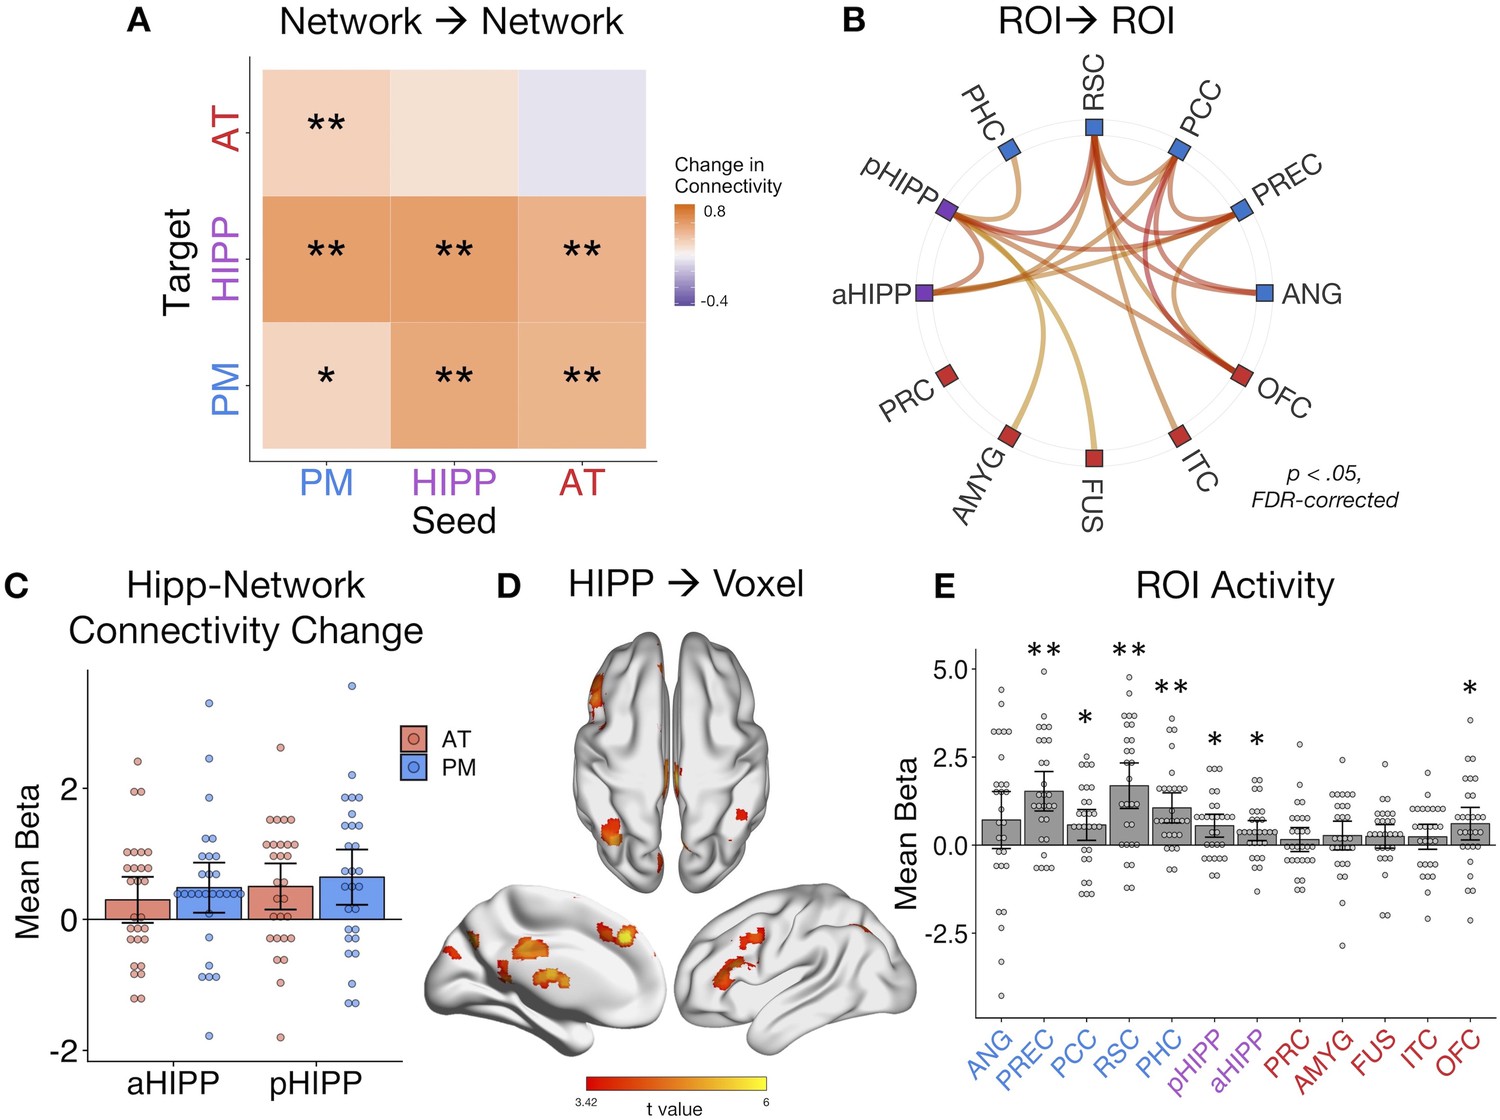
Dynamic changes in hippocampal-cortical network connectivity predict multidimensional memory quality.
(A) Mean change in within- and between-network connection strength with increasing memory quality during remember trials. **=p < 0.05, FDR-corrected; *=p < 0.05, uncorrected. (B) Individual ROI-to-ROI connections whose connectivity strength positively tracks the quality of episodic retrieval. (C) Mean change in connectivity between aHipp and pHipp ROIs and regions in the AT and PM systems with increasing memory quality (Figure 4—source data 1). (D) Hippocampus to voxel connectivity with increasing memory quality. Voxels shown at a peak threshold of p<0.001, and a cluster threshold of p<0.05, FDR-corrected. (E) Mean change in bilateral ROI activity with memory quality during retrieval (Figure 4—source data 2). **=p < 0.001, FDR-corrected; *=p < 0.05, FDR-corrected. Bars = Mean + /- 95% CI, points = individual subject estimates.
-
Figure 4—source data 1
Memory-Modulated Hippocampal Connectivity.
- https://doi.org/10.7554/eLife.45591.011
-
Figure 4—source data 2
Memory-Modulated ROI Activity.
- https://doi.org/10.7554/eLife.45591.012
Figure 5
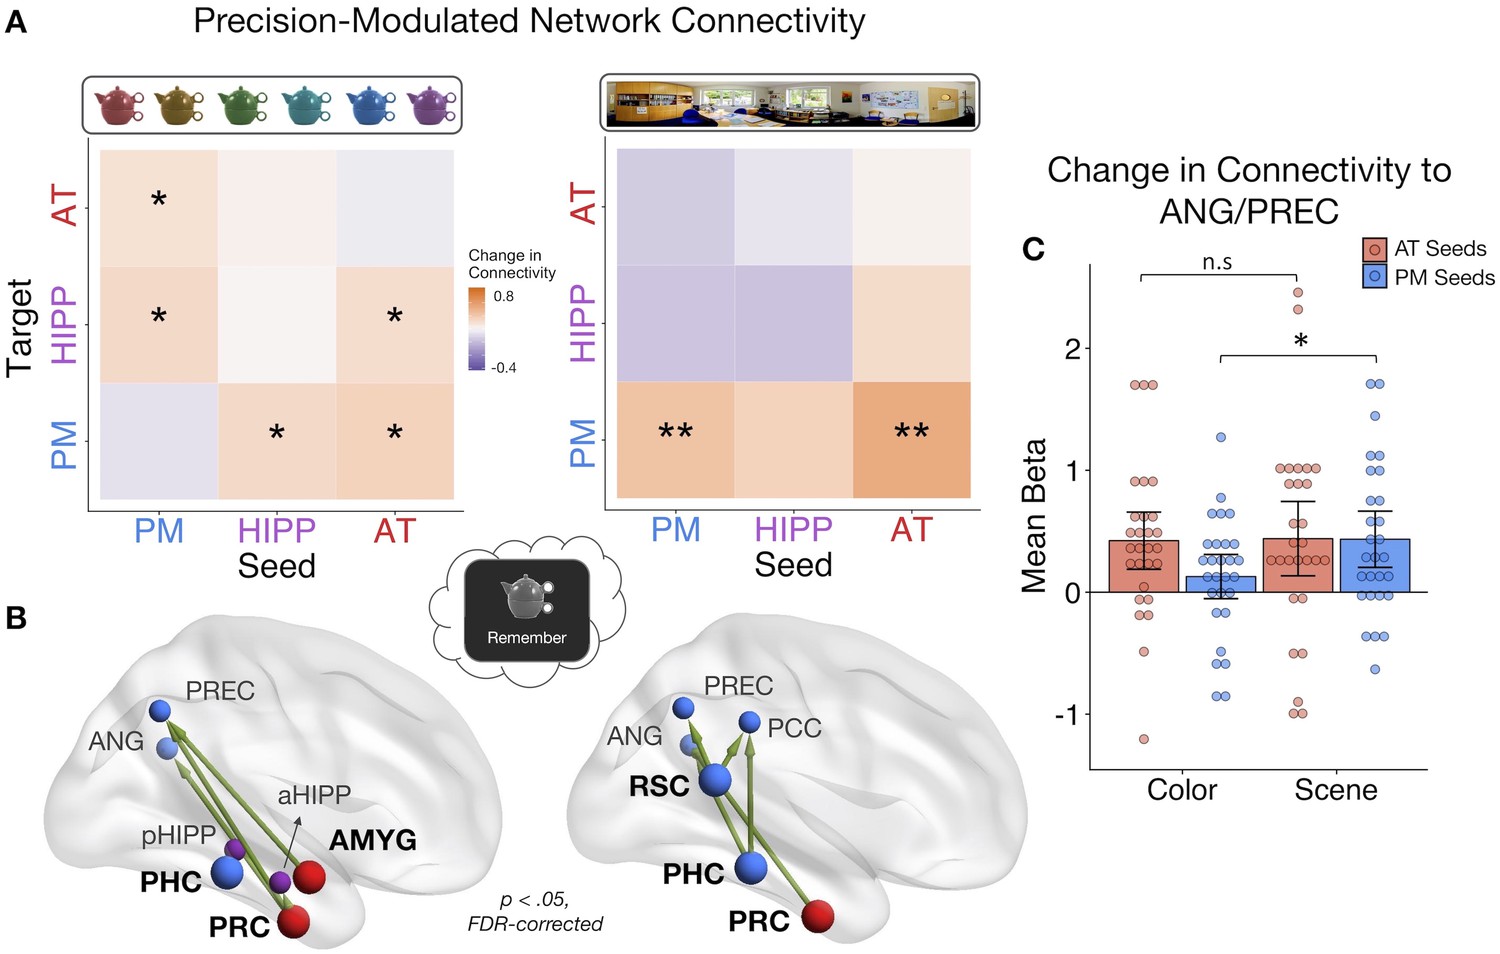
PMAT connections predicting the precision of item and spatial features in memory.
(A) Mean change in within- and between-network connectivity with increasing color memory precision (left) and spatial memory precision (right) during remember trials. **=p < 0.05, FDR-corrected; *=p < 0.05, uncorrected. (B) Individual seed-to-target connections whose connectivity strength tracks the precision of memory for color (left) and scene (right) information, including PRC and AMYG, sensitive to item and emotion information in the AT system, and PHC and RSC, sensitive to spatial information in the PM system. Depicted connections survive FDR-correction for all possible seed-to-target connections. Seed regions are shown as larger nodes, with bold labels. (C) Mean strength of precision-modulated connectivity changes to ANG/PREC for AT seeds (PRC and AMYG) and PM seeds (PHC and RSC), by feature ±95% CI. *=p < 0.05 (Figure 5—source data 1). Points = individual subject estimates.
-
Figure 5—source data 1
Feature-Related Connectivity.
- https://doi.org/10.7554/eLife.45591.014
Author response image 1

The most posterior half of pHIPP and the most anterior half of aHIPP.
Tables
Table 1
Feature memory success and precision.
The proportion of trials for which the emotion, color, and scene features were ‘successfully’ remembered (note that chance is 0.5 for emotion and 0 for color and scene) and the precision (response concentration k) of remembered color and scene features (Table 1—source data 1). Means (SE).
| Feature | Memory success | Memory precision |
|---|---|---|
| Emotion | 0.76 (0.02) | --- |
| Color | 0.67 (0.04) | 5.40 (0.49) |
| Scene | 0.64 (0.04) | 27.00 (3.30) |
-
Table 1—source data 1
Feature Memory Success and Precision.
- https://doi.org/10.7554/eLife.45591.004
Key resources table
| Reagent type (species) or resource | Designation | Source or reference | Identifier | Additional information |
|---|---|---|---|---|
| Software, algorithm | R version 3.5.1, RStudio | R Project for Statistical Computing | https://www.r-project.org/ | |
| Software, algorithm | FMRIPrep v1.0.3 | Poldrack Lab, Stanford University | https://fmriprep.readthedocs.io/en/1.0.3/ | |
| Software, algorithm | MRIQC v0.10.1 | Poldrack Lab, Stanford University | https://mriqc.readthedocs.io/en/0.10.1/ | |
| Software, algorithm | MATLAB 2017a | Mathworks | https://www.mathworks.com/ | |
| Software, algorithm | Psychtoolbox-3 | Kleiner et al., 2007 | http://psychtoolbox.org/ | |
| Software, algorithm | SPM12 | Wellcome Centre for Neuroimaging, UCL | https://www.fil.ion.ucl.ac.uk/spm/ | |
| Software, algorithm | CONN toolbox v17 | Gabrieli Lab, MIT | https://web.conn-toolbox.org/ |
Additional files
-
Transparent reporting form
- https://doi.org/10.7554/eLife.45591.015
Download links
A two-part list of links to download the article, or parts of the article, in various formats.
Downloads (link to download the article as PDF)
Open citations (links to open the citations from this article in various online reference manager services)
Cite this article (links to download the citations from this article in formats compatible with various reference manager tools)
Cortico-hippocampal network connections support the multidimensional quality of episodic memory
eLife 8:e45591.
https://doi.org/10.7554/eLife.45591


