Closed-loop optogenetic activation of peripheral or central neurons modulates feeding in freely moving Drosophila
- University of British Columbia, Canada
Figures
Figure 1 with 2 supplements
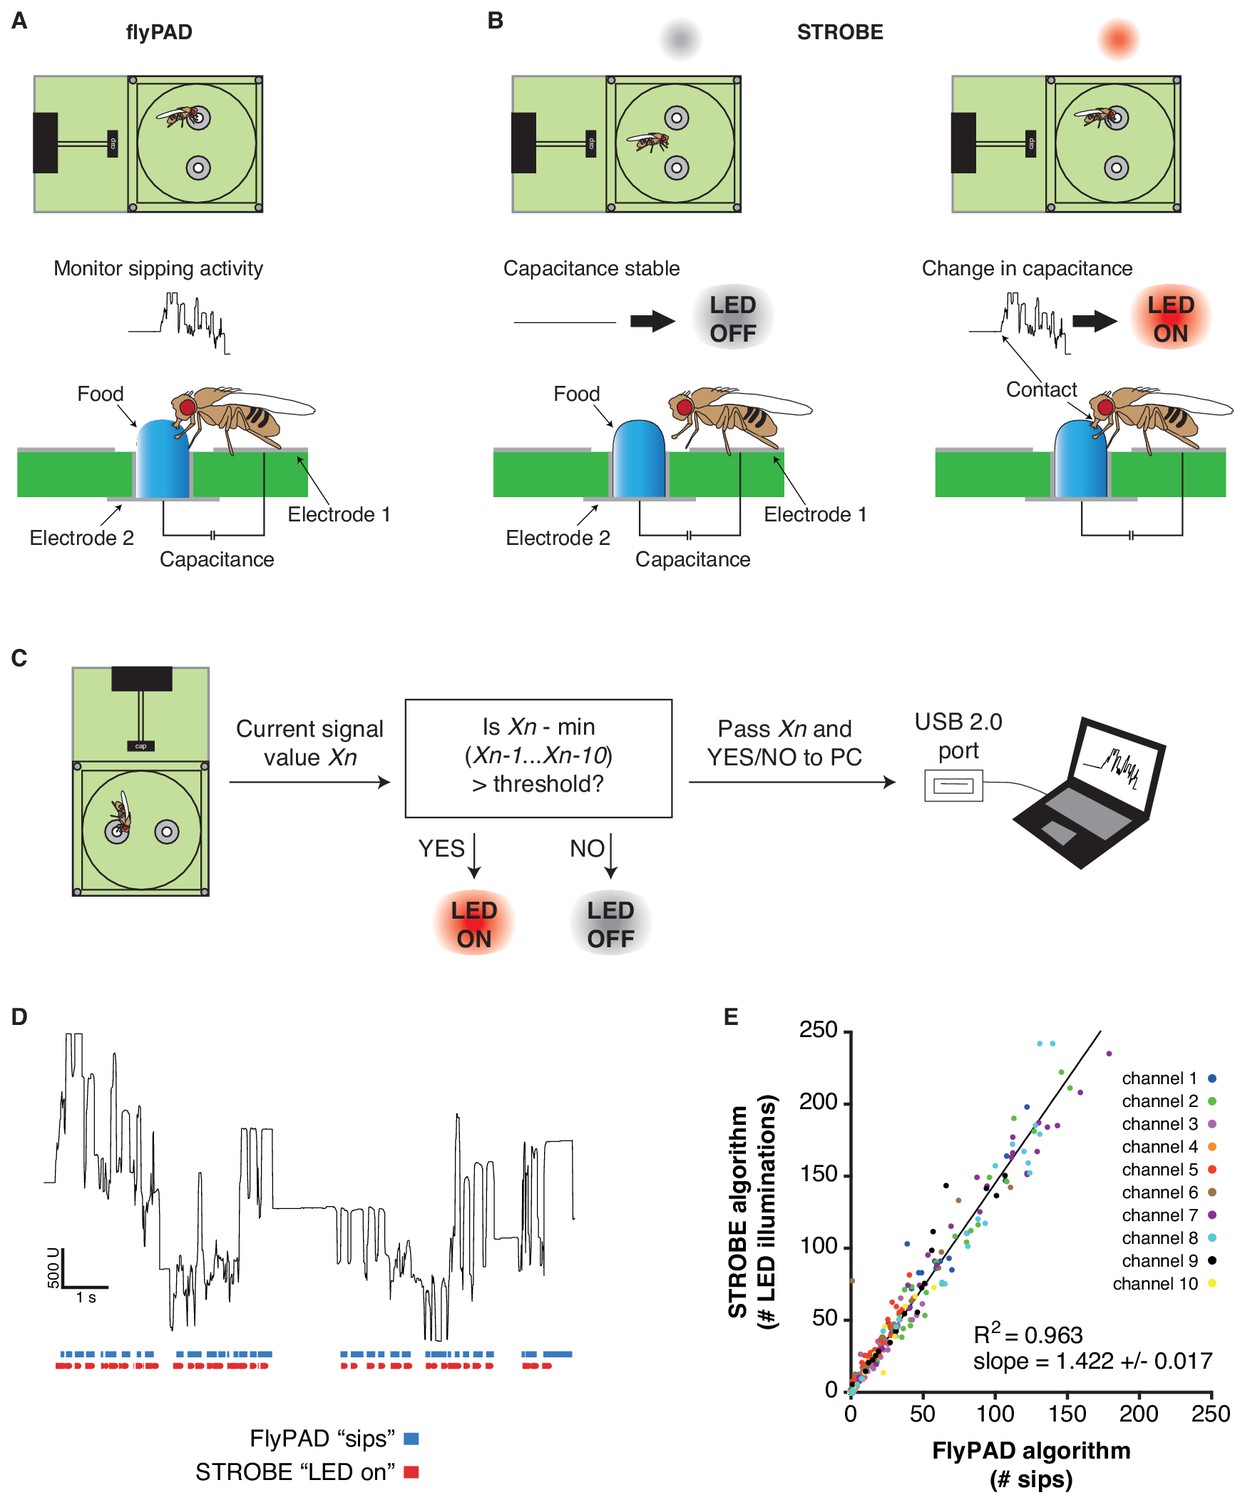
The STROBE setup.
(A) Concept of the FlyPAD: The interaction between the fly’s proboscis and the food is detected as a change in capacitance between two electrodes: electrode 1, on which the fly stands, and electrode 2, on which the food is placed. (B) Concept of the STROBE: when the fly is not interacting with the food, no change of capacitance is detected and the LED is OFF (left); when the fly sips, changes in capacitance turn the LED ON (right). (C) Flowchart of the STROBE signal processing algorithm. (D) Example of capacitance changes during a feeding bout, and the associated sips called by the FlyPAD (blue) and STROBE lighting events (red). (E) Comparison of the sip numbers called by the FlyPAD algorithm and LED illuminations triggered by STROBE algorithm. Sips/illuminations were counted in 1 min bins across a 1 hr experiment for 10 different channels (five arenas). Bins with neither sips detected by the FlyPAD algorithm nor illuminations triggered by the STROBE algorithm were excluded from analysis, as these were deemed times when the fly was not interacting with the food.
-
Figure 1—source data 1
This file contains all the raw numerical data for Figure 1 and its associated figure supplements.
- https://doi.org/10.7554/eLife.45636.005
Figure 1—figure supplement 1
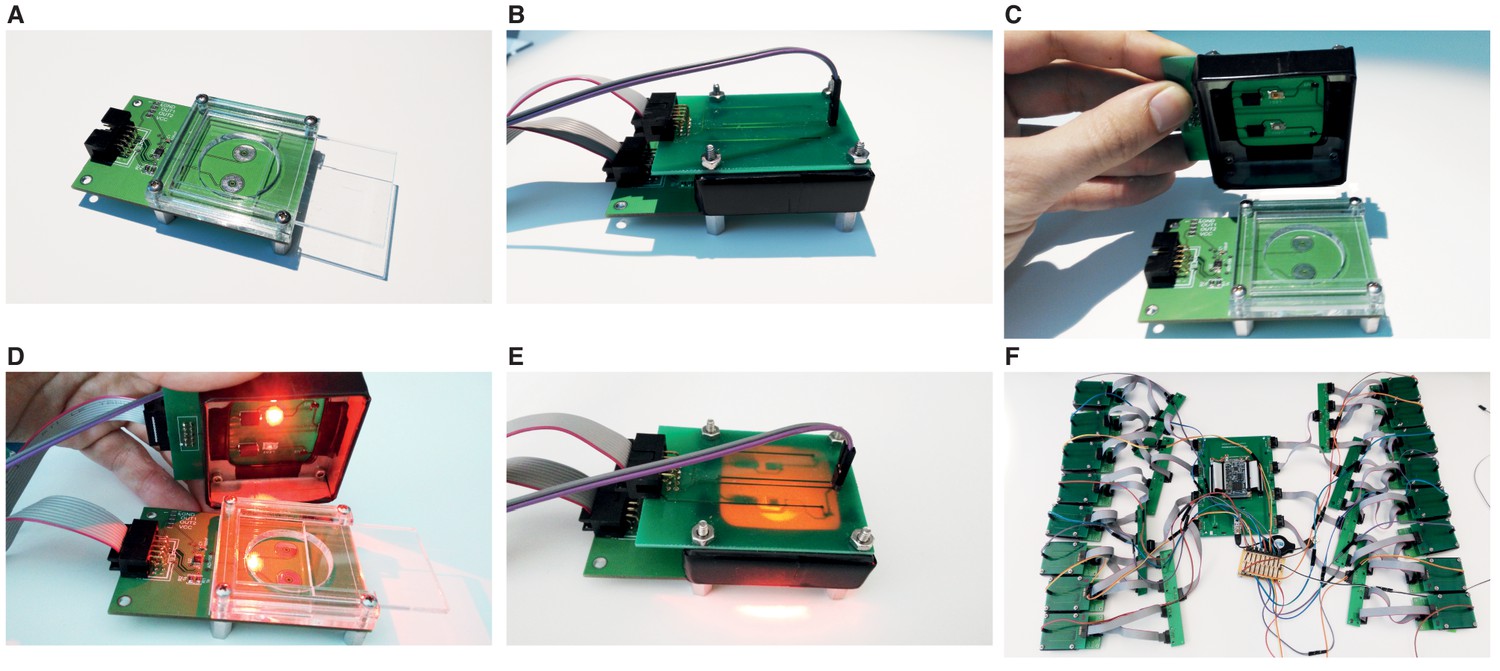
The STROBE setup.
(A) FlyPAD arena. (B–C) FlyPAD arena with STROBE lid. One LED is positioned just above each channel D-E) STROBE arena with red LED on. (F) Complete STROBE setup, with 16 arenas working in parallel.
Figure 1—figure supplement 2

LED illumination is triggered with short latency following touch.
(A–C) Images from video taken at 178 frames/s showing a frame prior to touch (A), during touch initiation (B), and when lighting is triggered (C). (D) measured latency of light activation for eight wire touches. (E–F) Consecutive frames from video taken at 60 frames/s, showing a fly extending its proboscis onto the light-triggering food. Light is triggered in the same frame we observe full extension of the proboscis onto the food (arrow in F).
Figure 2 with 4 supplements
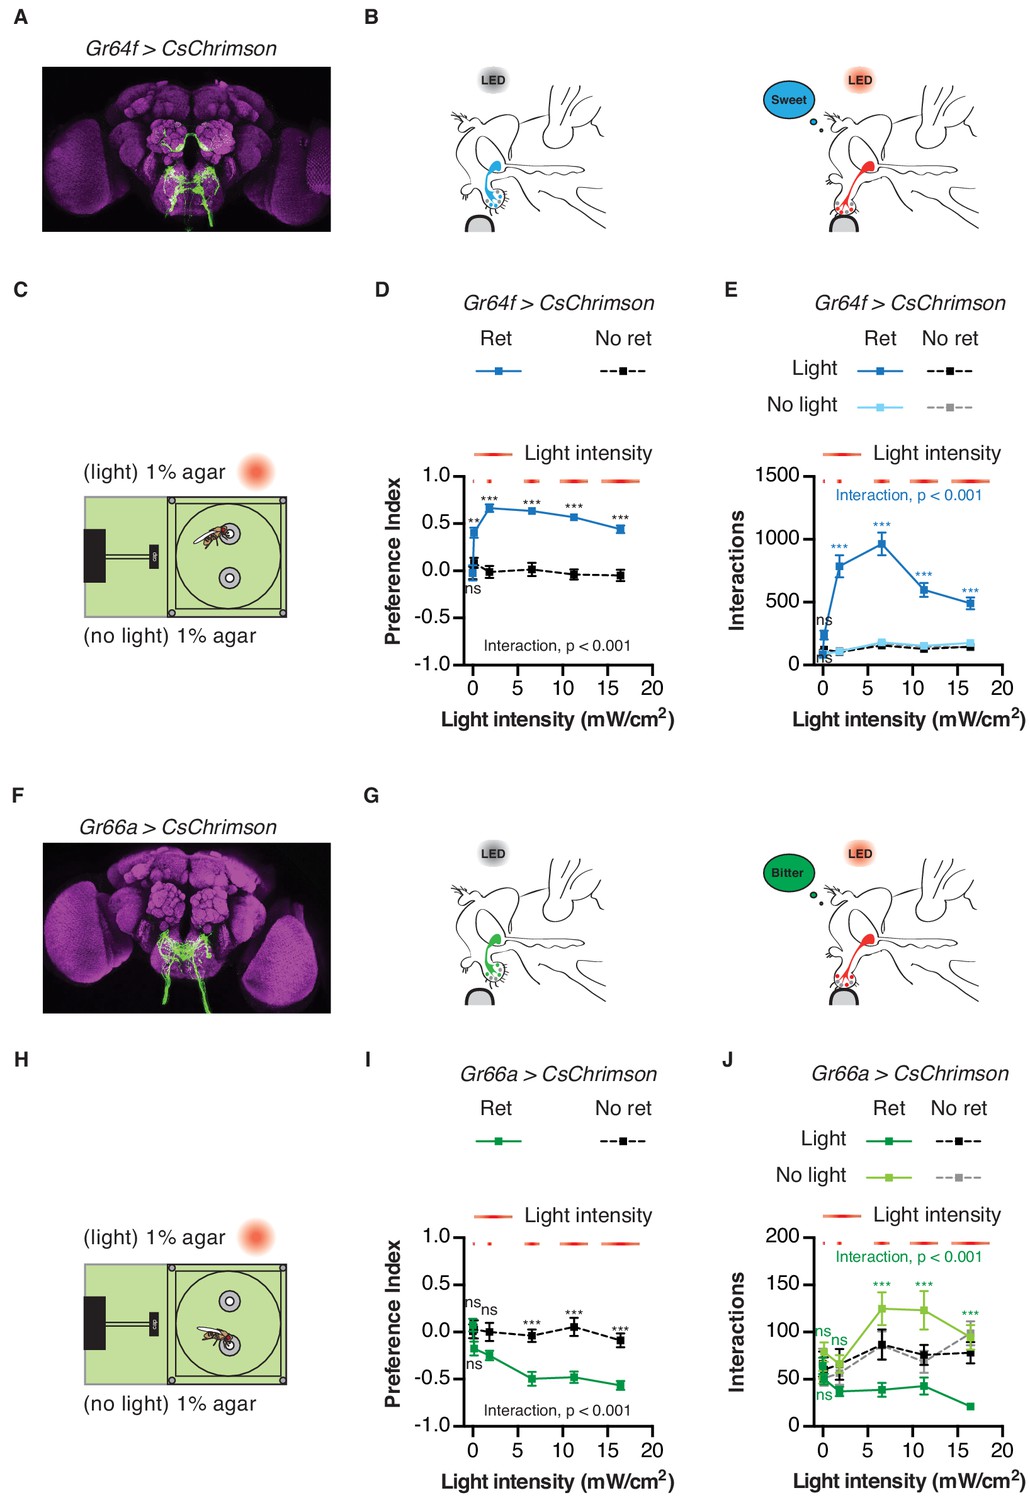
Activation of sweet and bitter sensory neurons drives feeding preferences in the STROBE.
(A) Immunofluorescent detection of UAS-CsChrimson.mVenus driven by Gr64f-GAL4. (B) Schematic illustrating STROBE activation of sweet neurons. (C) Experimental setup: both channels are filled with 1% agar, only one is paired to LED activation. (D–E) Relationship between light intensity and light side preference (D) or interaction numbers (E) for Gr64f > CsChrimson flies pre-fed retinal (blue squares) or not fed retinal (black squares). (F) Expression of UAS-CsChrimson.mVenus driven by Gr66a-GAL4. (G) Schematic illustrating STROBE activation of bitter neurons. (H) Experimental setup: both channels contain plain 1% agar. (I–J) Relationship between light intensity and light side preference (I) or interaction numbers (J) Gr66a > CsChrimson flies pre-fed retinal (green squares) or not fed retinal (black squares). Values represent mean ± SEM. n = 30–37 (D–E) or 19–28 (H–I). Statistical tests: two-way ANOVA and Bonferroni post hoc: ns p>0.05, **p<0.01, ***p<0.001. Colored asterisks represent significance between sips on each side for the retinal group.
-
Figure 2—source data 1
This file contains all the raw numerical data for Figure 2 and its associated figure supplements.
- https://doi.org/10.7554/eLife.45636.013
Figure 2—figure supplement 1

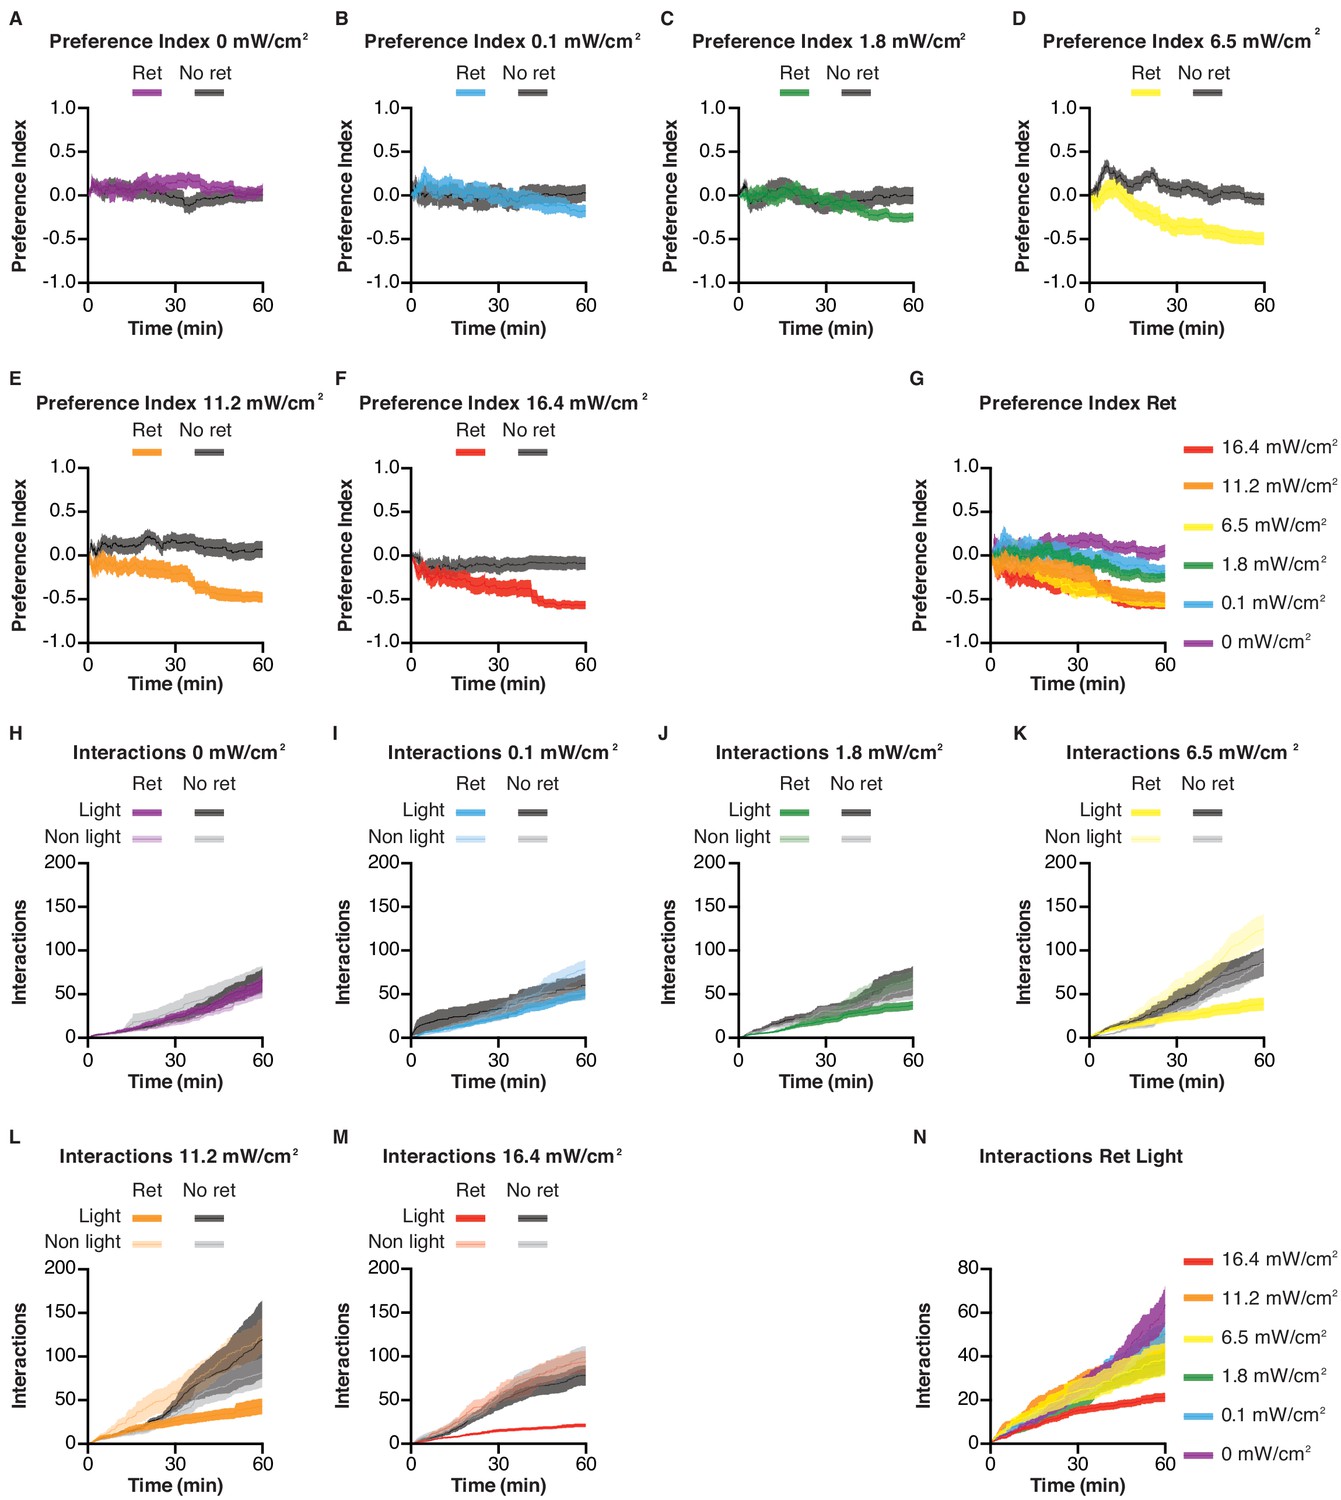
Behavioral dynamics during sweet GRN stimulation.
(A–F) Preference indices as a function of time, for Gr64f > CsChrimson flies in the STROBE with the indicated light intensities. Blue lines denote flies pre-fed retinal and gray lines are non-retinal controls. (G) Summary data for retinal-positive flies from all experiments. (H–M) Interaction numbers as a function of time, for Gr64f > CsChrimson flies in the STROBE with the indicated light intensities. (N) Summary data for retinal-positive flies from all experiments.
Figure 2—figure supplement 2
Behavioral dynamics during bitter GRN stimulation.
(A–F) Preference indices as a function of time, for Gr66a > CsChrimson flies in the STROBE with the indicated light intensities. Green lines denote flies pre-fed retinal and gray lines are non-retinal controls. (G) Summary data for retinal-positive flies from all experiments. (H–M) Interaction numbers as a function of time, for Gr66a > CsChrimson flies in the STROBE with the indicated light intensities. (N) Summary data for retinal-positive flies from all experiments.
Figure 2—figure supplement 3
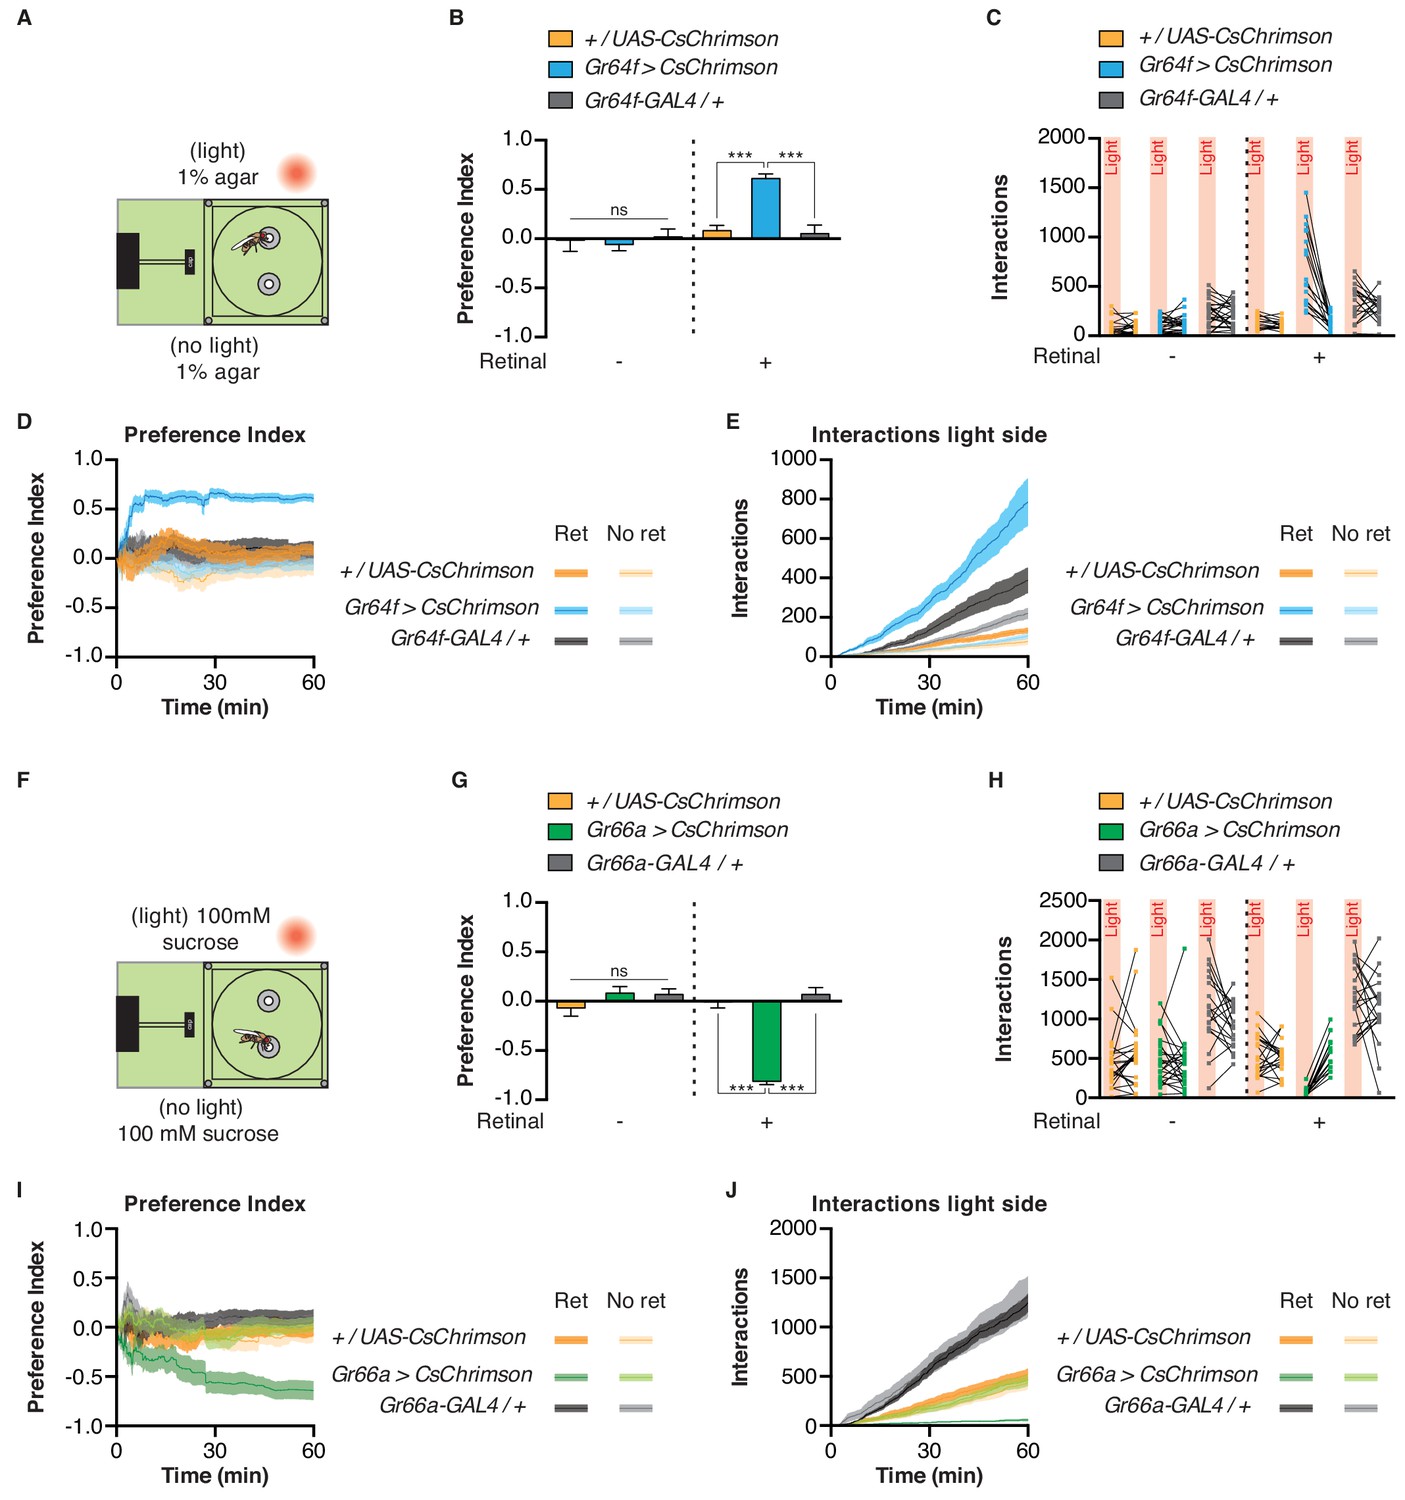
Genetic controls for Gr66a and Gr64f do not show any preference in the STROBE.
(A) Experimental setup: both channels contain 1% agar, with one triggering LED activation. (B–C) Preference indices (B) and interaction numbers (C) for Gr64f > CsChrimson and genetic controls with or without retinal. (D–E) Preference indices (D) and interaction numbers (E) as a function of time. (F) Experimental setup: both channels contain 100 mM sucrose mixed in 1% agar, with one triggering LED activation. (G–H) Preference indices (G) and interaction numbers (H) for Gr66a > CsChrimson and genetic controls with or without retinal. (I–J) Preference indices (I) and interaction numbers (J) as a function of time. Values are mean ± SEM. n = 17–25. Statistical test: two-way ANOVA with Tukey post-hoc: ns p>0.05, ***p<0.001.
Figure 2—figure supplement 4
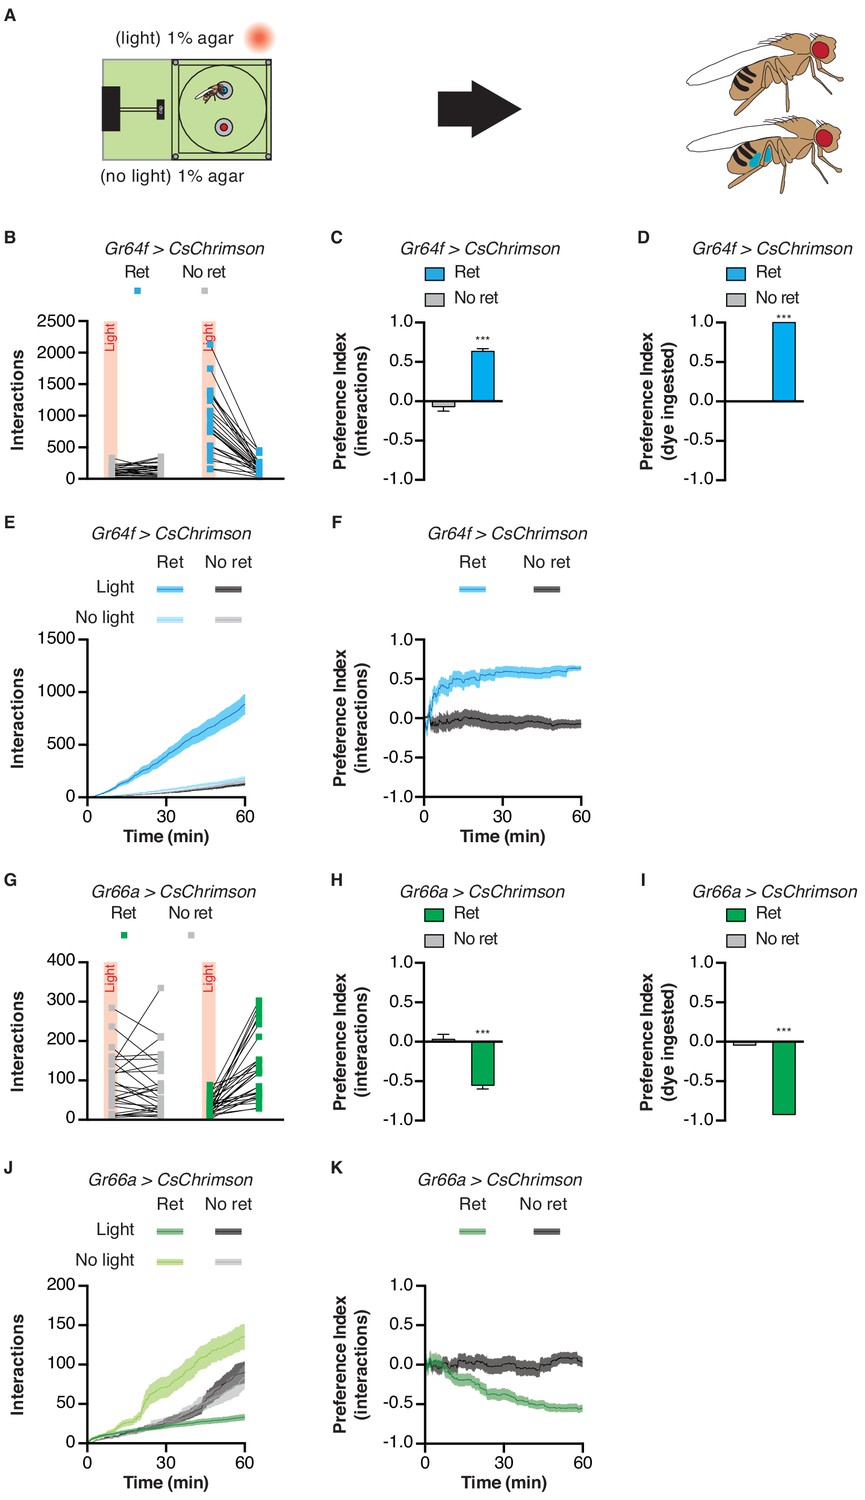
GRN activation in the STROBE drives ingestion behavior.
(A) Experimental setup: one channel contains 1% agar with blue dye, and the other has 1% agar with red dye. Fly abdomen color is determined following the experiment. (B) Interactions of Gr64f > CsChrimson flies in the presence or absence of retinal. (C) Preference Index calculated from the number of interactions. (D) Preference Index calculated from abdomen color. (E) Interaction numbers as a function of time. (F) Preference indices as a function of time. (G) Interactions of Gr66a > CsChrimson flies in the presence or absence of retinal. (H) Preference Index calculated from the number of interactions. (I) Preference Index calculated from abdomen color. (J) Interaction numbers as a function of time. (K) Preference indices as a function of time. Values are mean ± SEM (no error shown for dye experiments). n = 20–28. Statistical tests: t-test (for interactions based data) and Chi-square (for dye ingestion data). ***p<0.001.
Figure 3 with 2 supplements

Behavioral impact of GRN activation is modulated by starvation.
(A) Protocol: flies are subjected to increasing period of starvation (12 hr, 24 hr, 48 hr) prior to the STROBE experiment. (B) Experimental setup: both channels contain plain 1% agar. (C–D) The effect of starvation on light side preference (C) and food interaction numbers (D) of flies expressing CsChrimson in sweet neurons. (E–F) The effect of starvation on preference for the light side (E) and interaction numbers (F) of flies expressing CsChrimson in bitter neurons. Values represent mean ± SEM. n = 21–30. Statistical tests: two-way ANOVA with Bonferroni post hoc. ns p>0.05, *p<0.05, **p<0.01, ***p<0.001. Colored asterisks represent significance between sips on each side for the retinal group.
-
Figure 3—source data 1
This file contains all the raw numerical data for Figure 3 and its associated figure supplements.
- https://doi.org/10.7554/eLife.45636.017
Figure 3—figure supplement 1
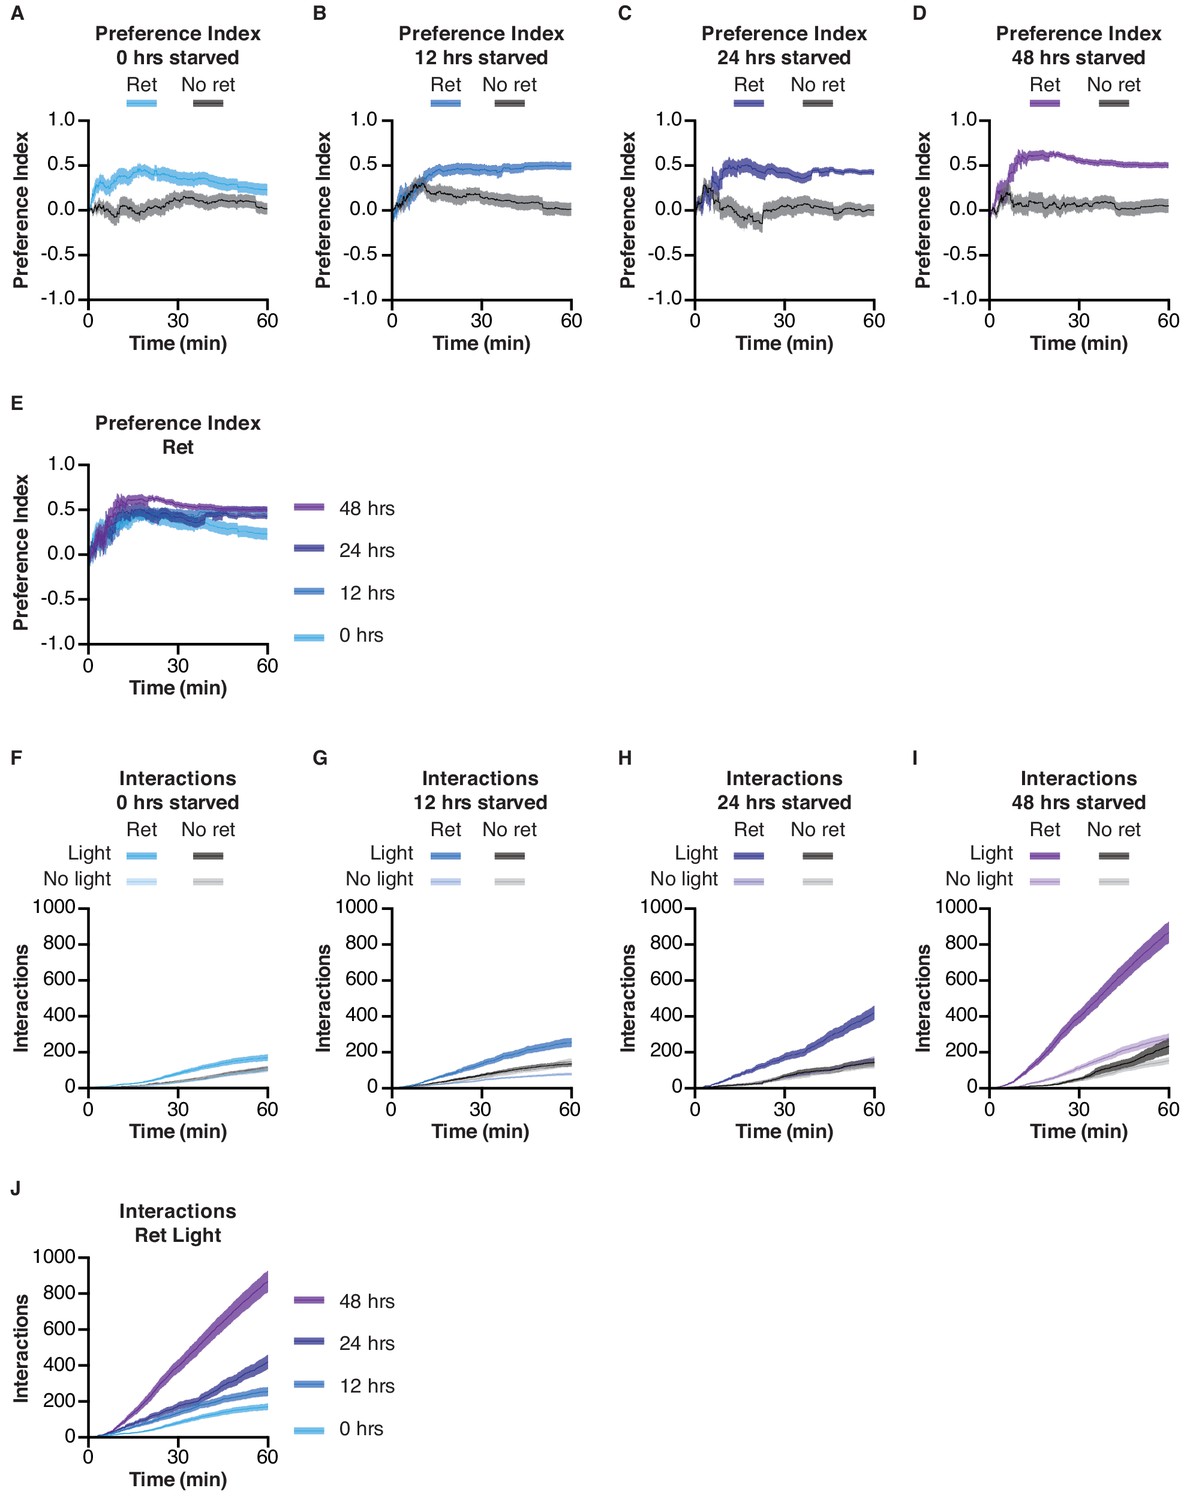
Behavioral dynamics during sweet GRN stimulation following different starvation times.
(A–D) Preference indices as a function of time, for Gr64f > CsChrimson flies in the STROBE following the indicated starvation times. Blue lines denote flies pre-fed retinal and gray lines are non-retinal controls. (E) Summary data for retinal-positive flies from all experiments. (F–I) Interaction numbers as a function of time, for Gr64f > CsChrimson flies in the STROBE with the indicated light intensities. (J) Summary data for retinal-positive flies from all experiments.
Figure 3—figure supplement 2

Behavioral dynamics during bitter GRN stimulation following different starvation times.
(A–D) Preference indices as a function of time, for Gr66a > CsChrimson flies in the STROBE following the indicated starvation times. Blue lines denote flies pre-fed retinal and gray lines are non-retinal controls. (E) Summary data for retinal-positive flies from all experiments. (F–I) Interaction numbers as a function of time, for Gr66a > CsChrimson flies in the STROBE with the indicated light intensities. (J) Summary data for retinal-positive flies from all experiments.
Figure 4 with 5 supplements
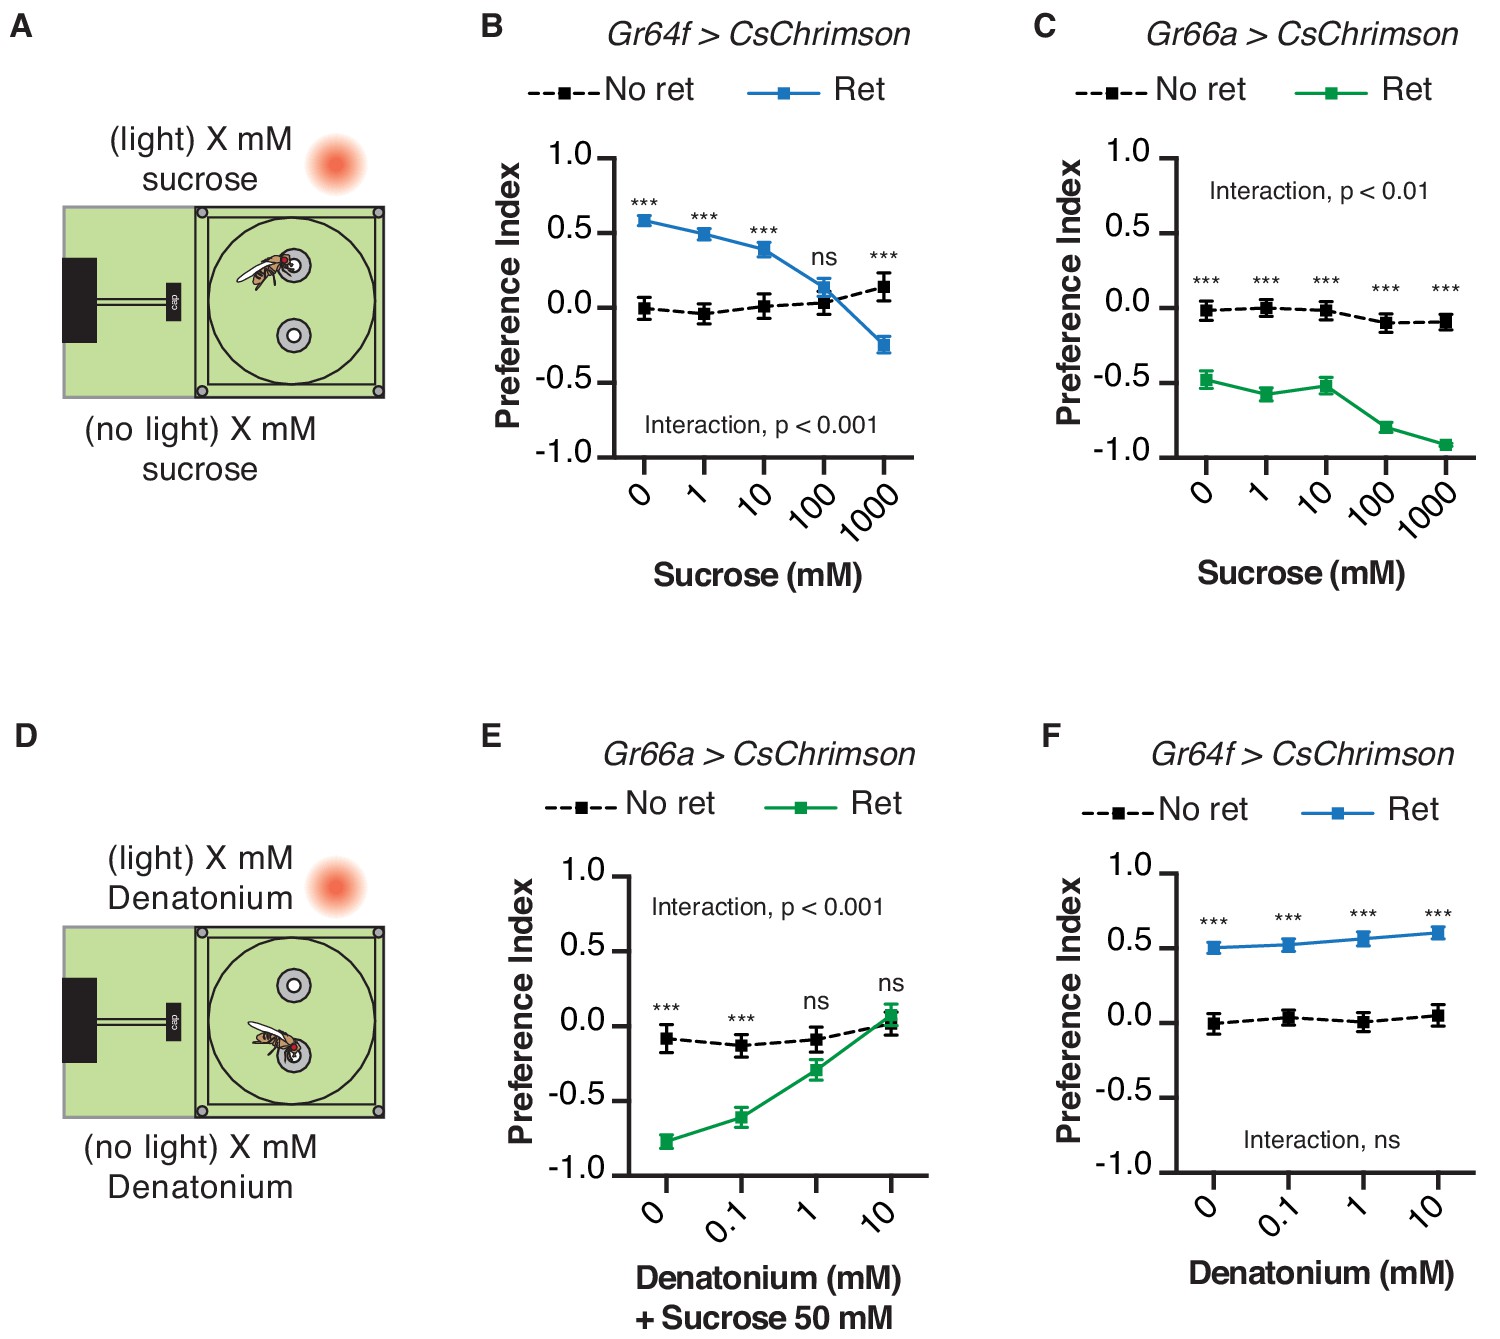
Chemical taste ligands suppress impact of light evoked GRN activity.
(A) Experimental setup: both channels contain the same sucrose concentration (1, 10, 100, or 1000 mM) in 1% agar. (B–C) The effect of sucrose concentration on the light side preference of Gr64f > CsChrimson (B) or Gr66a > CsChrimson (C). (D) Experimental setup: both channels contain the same denatonium concentration (0, 0.1, 1, or 10 mM). For Gr66a > CsChrimson activation, both channels also contain 50 mM sucrose. (E–F) The effect of denatonium concentration on the light side preference of Gr66a > CsChrimson (E) or Gr64f > CsChrimson (F). Values represent mean ± SEM. n = 25–51. Statistical tests: two-way ANOVA with Bonferroni post hoc. ns p>0.05; ***p<0.001.
-
Figure 4—source data 1
This file contains all the raw numerical data for Figure 4 and its associated figure supplements.
- https://doi.org/10.7554/eLife.45636.024
Figure 4—figure supplement 1
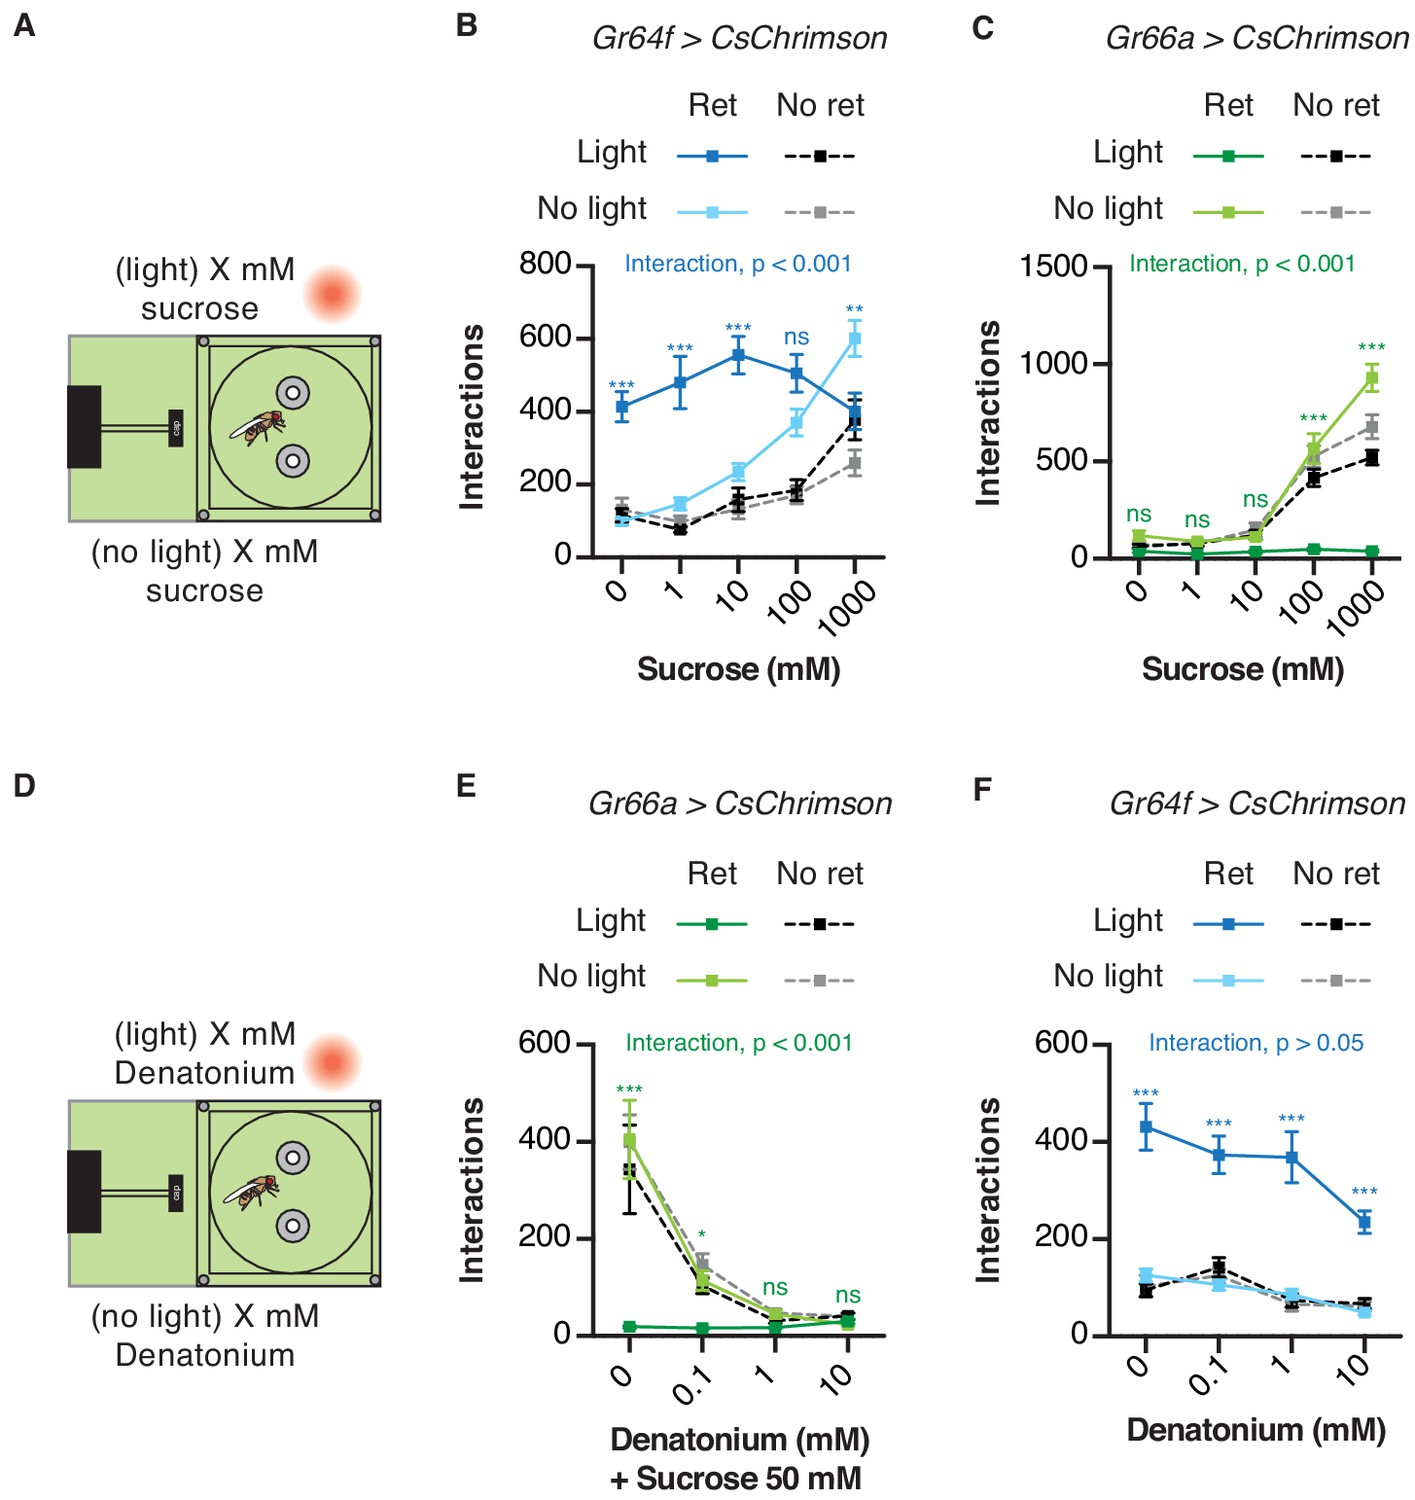
Chemical taste ligands suppress impact of light evoked GRN activity.
(A) Experimental setup: both channels contain the same sucrose concentration (0, 1, 10 100, or 1000 mM) mixed with 1% agar, with one triggering LED activation. (B–C) The effect of sucrose concentration on the number of food interactions detected on each channel for Gr64f > CsChrimson (B) or Gr66a > CsChrimson (C). These data are presented as preference indices in Figure 4B,C. (D) Experimental setup: both channels contain the same denatonium concentration (0, 0.1, 1, or 10 mM). For Gr66a > CsChrimson activation, both channels also contain 50 mM sucrose. (E–F) The effect of denatonium concentration on the number of food interactions detected on each channel for Gr66a > CsChrimson (E) or Gr64f > CsChrimson (F). These data are presented as preference indices in Figure 4E,F. Values are mean ± SEM. n = 25–51. Statistical test: two-way ANOVA with Bonferroni post hoc. ns p>0.05, *p<0.05, **p<0.01, ***p<0.001. Colored asterisks represent significance between sips on each side for the retinal group.
Figure 4—figure supplement 2
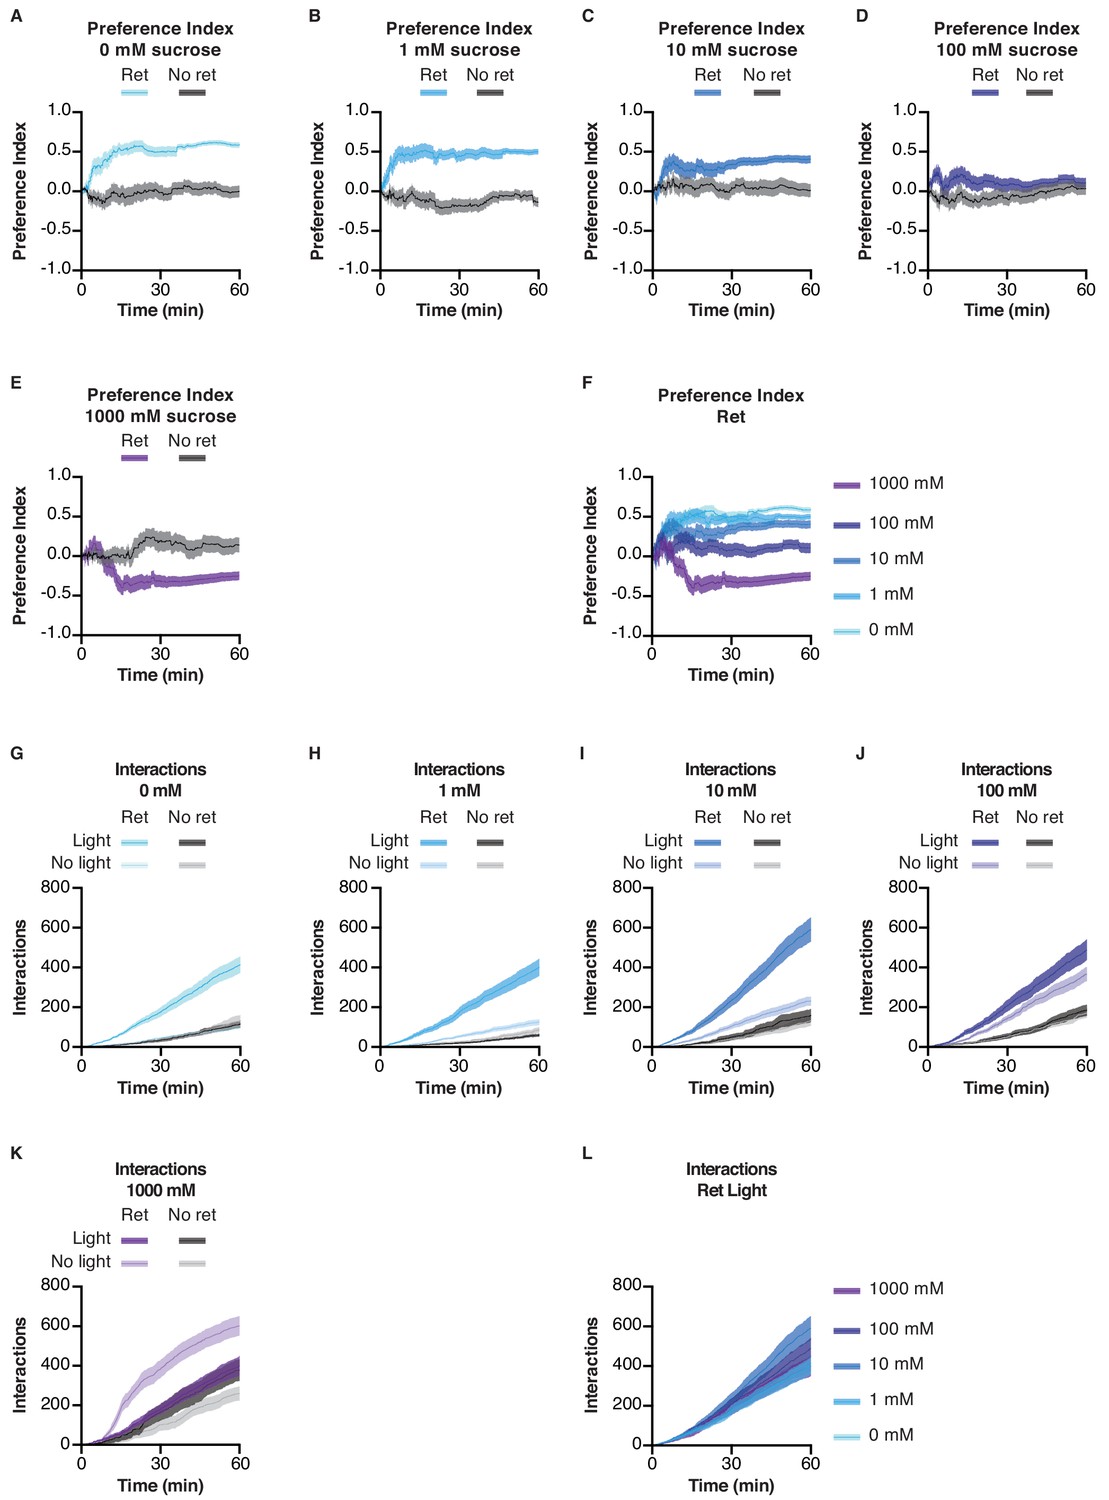
Behavioral dynamics during sweet GRN stimulation with sugar-containing food.
(A–E) Preference indices as a function of time, for Gr64f > CsChrimson flies in the STROBE with the indicated sucrose concentrations. Blue lines denote flies pre-fed retinal and gray lines are non-retinal controls. (F) Summary data for retinal-positive flies from all experiments. (G–K) Interaction numbers as a function of time, for Gr64f > CsChrimson flies in the STROBE with the indicated sucrose concentrations. (L) Summary data for retinal-positive flies from all experiments.
Figure 4—figure supplement 3
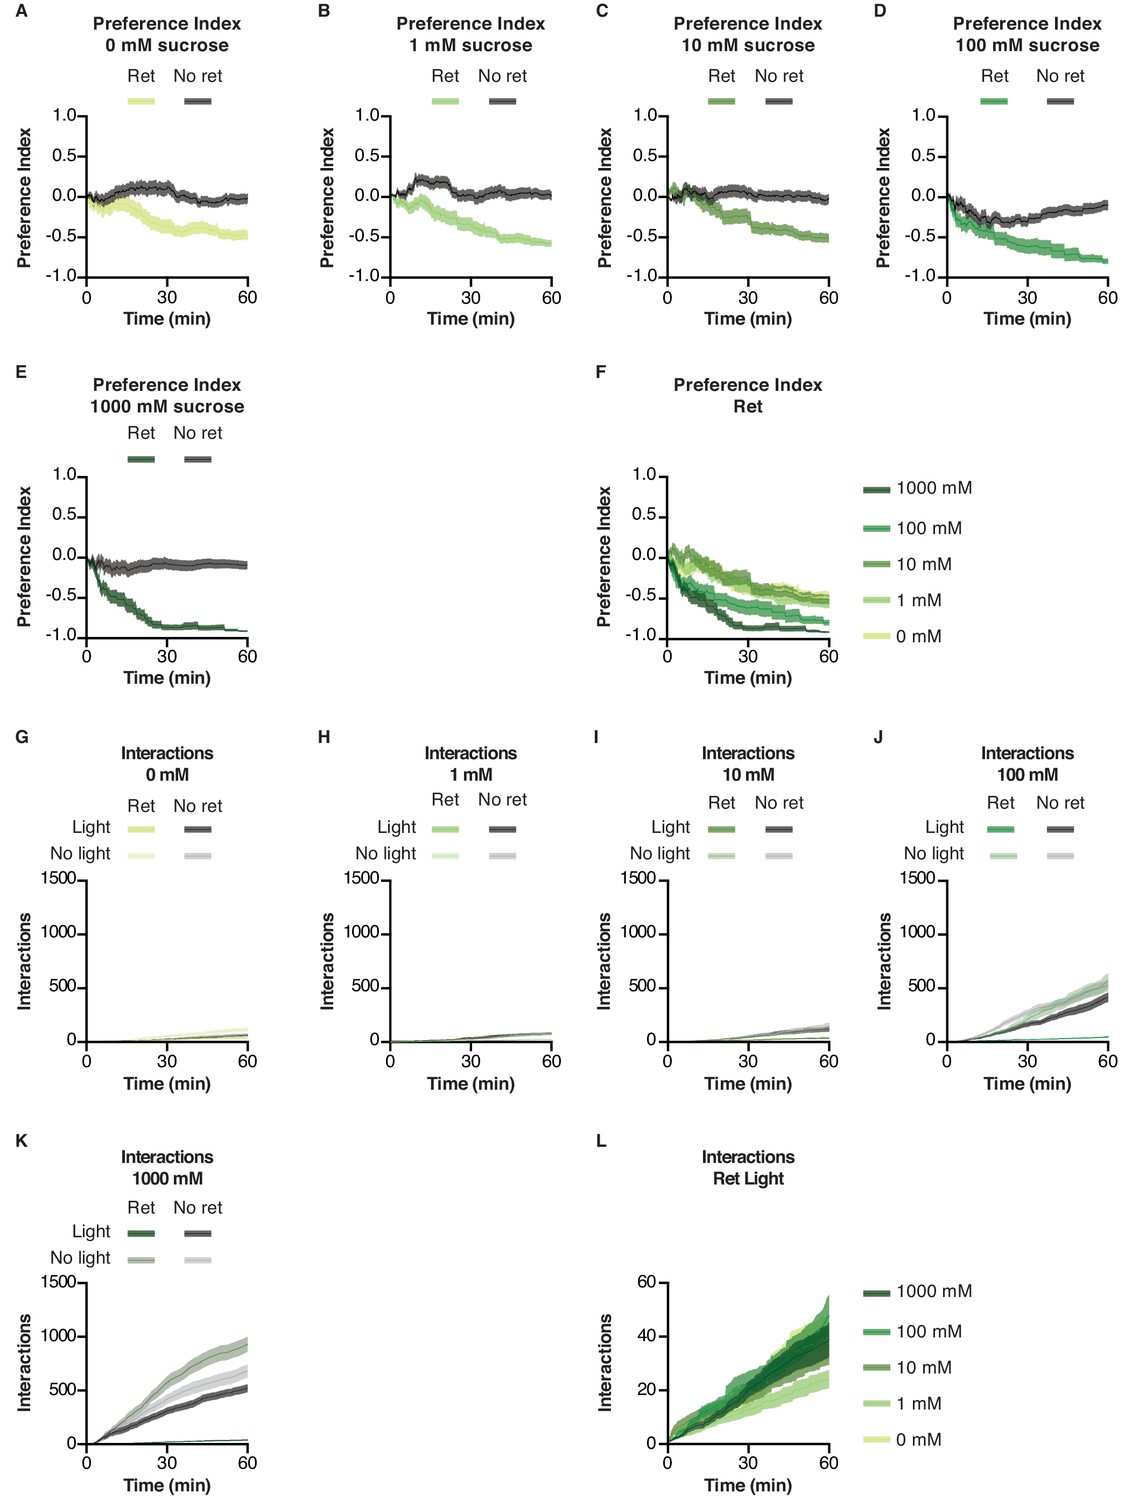
Behavioral dynamics during bitter GRN stimulation with sugar-containing food.
(A–E) Preference indices as a function of time, for Gr66a > CsChrimson flies in the STROBE with the indicated sucrose concentrations. Green lines denote flies pre-fed retinal and gray lines are non-retinal controls. (F) Summary data for retinal-positive flies from all experiments. (G–K) Interaction numbers as a function of time, for Gr66a > CsChrimson flies in the STROBE with the indicated sucrose concentrations. (L) Summary data for retinal-positive flies from all experiments.
Figure 4—figure supplement 4
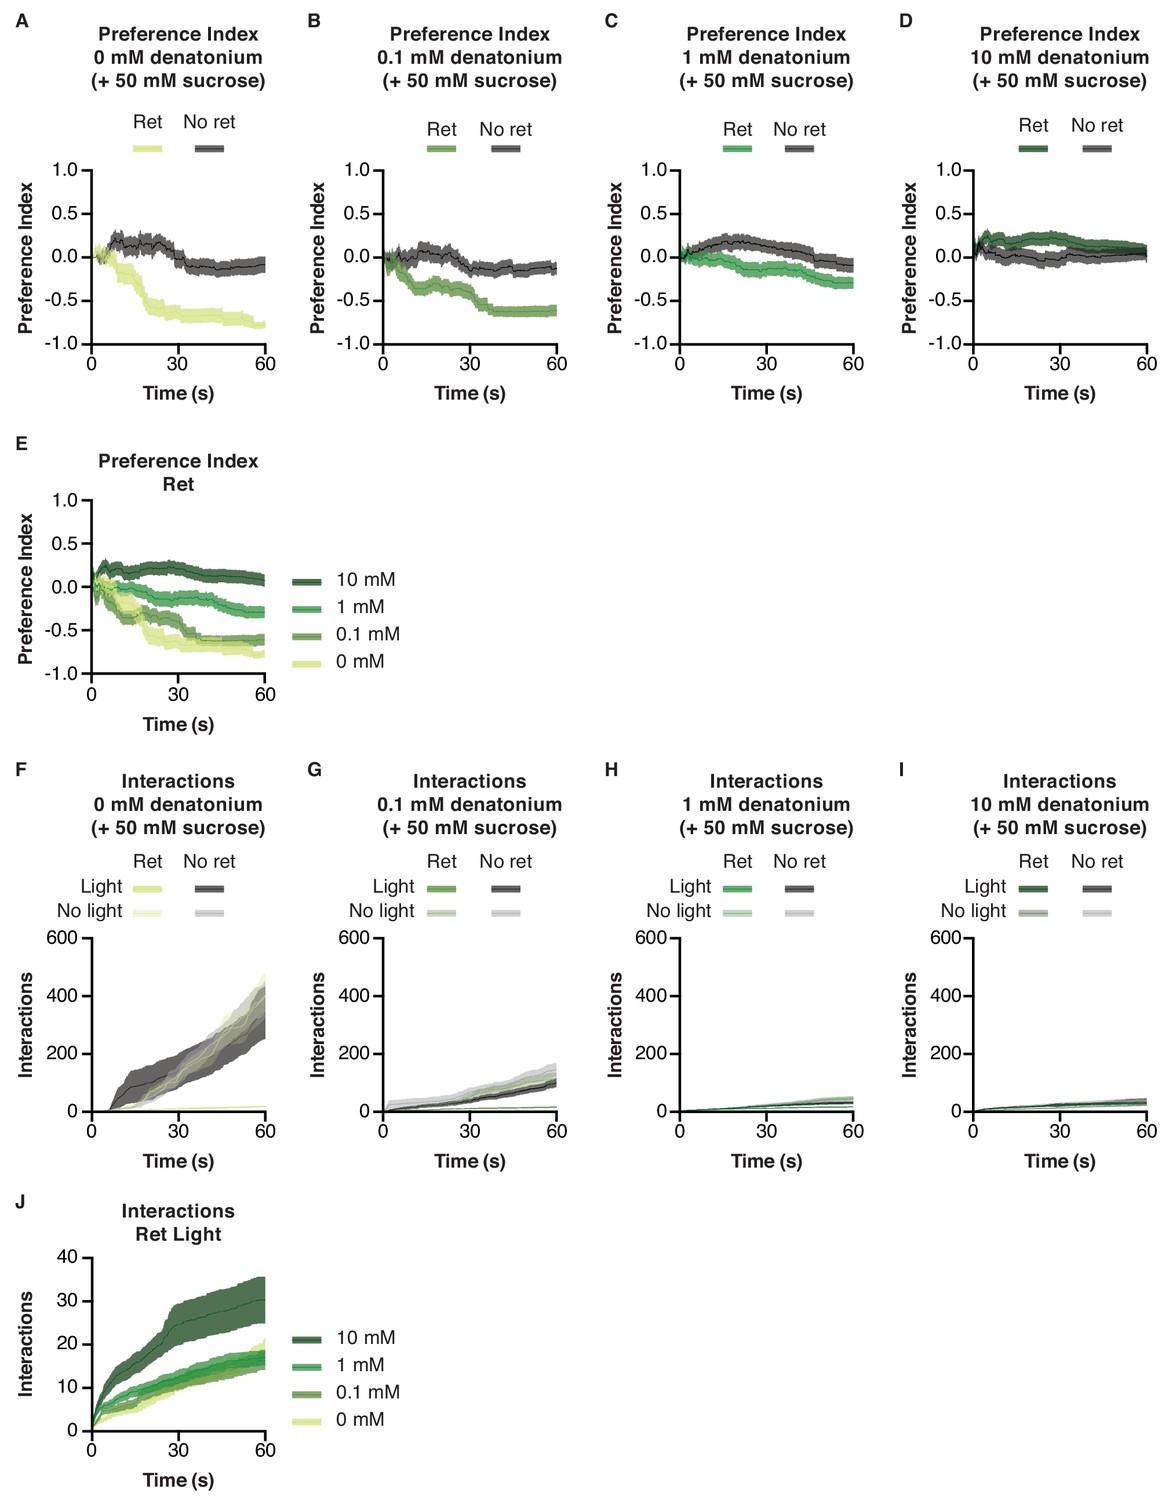
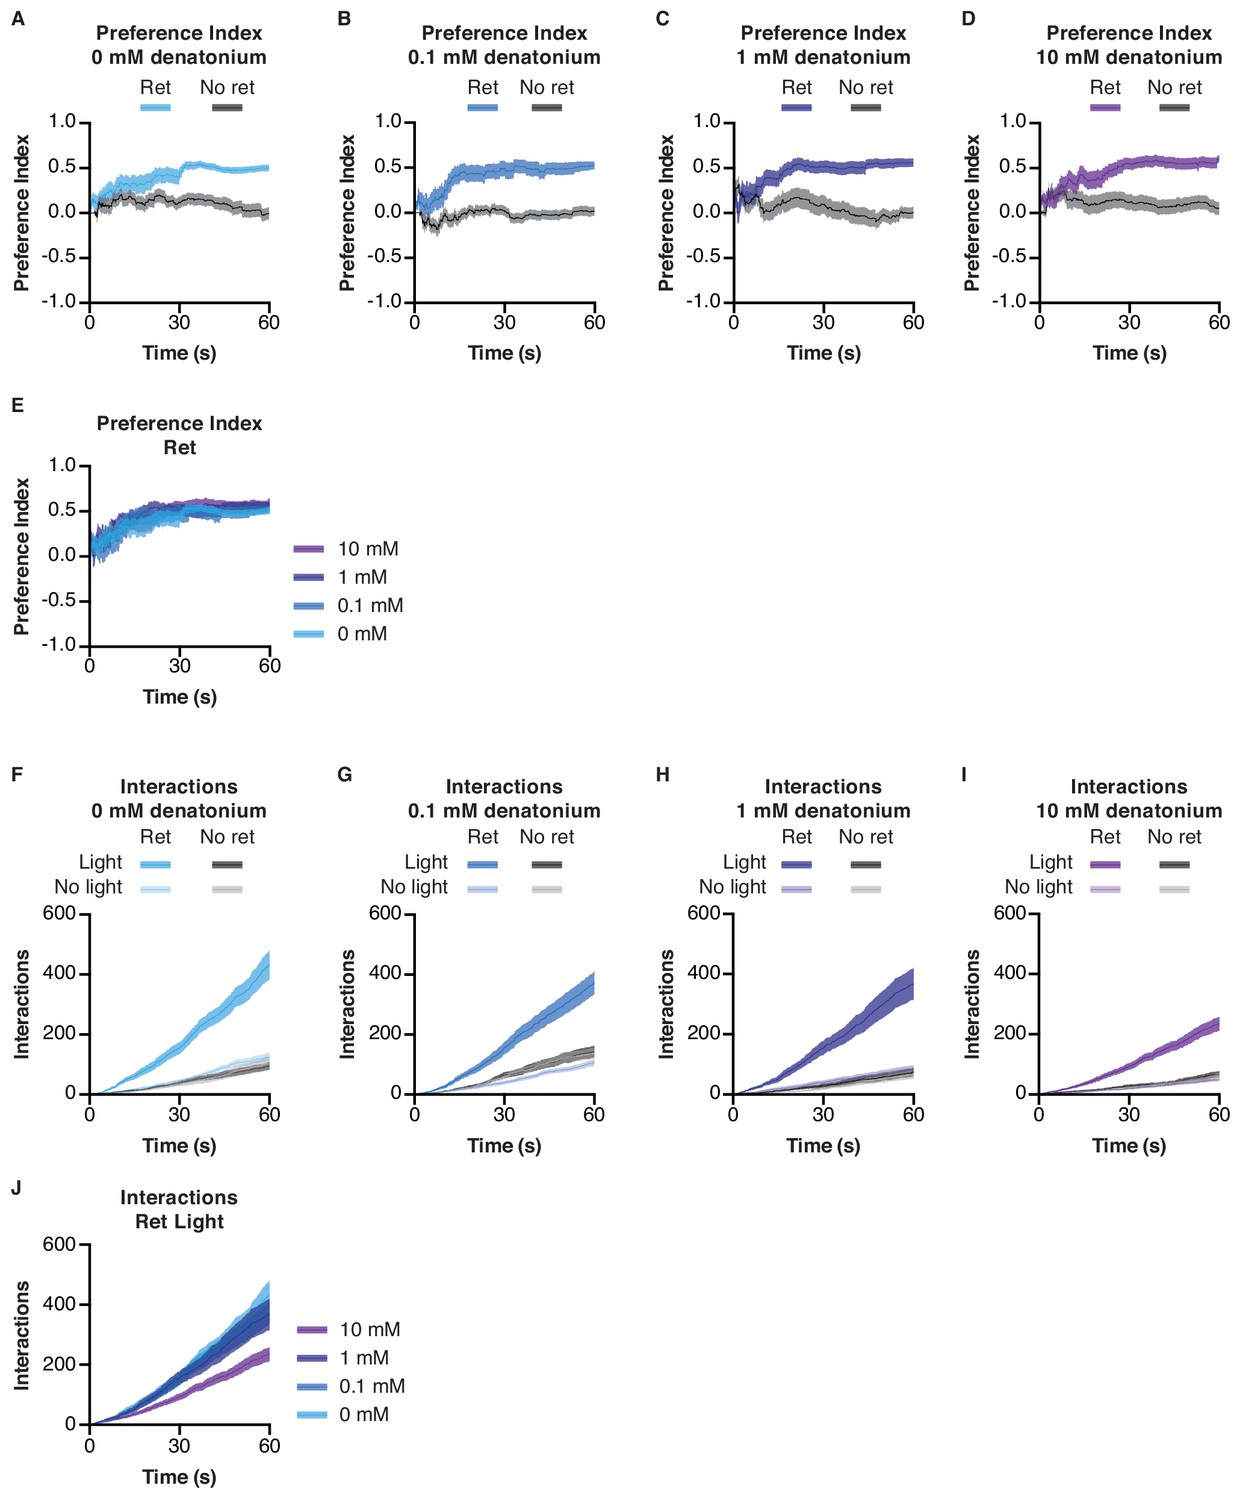
Behavioral dynamics during bitter GRN stimulation with bitter-containing food.
(A–D) Preference indices as a function of time for Gr66a > CsChrimson flies in the STROBE with the indicated denatonium concentrations. Green lines denote flies pre-fed retinal and gray lines are non-retinal controls. (E) Summary data for retinal-positive flies from all experiments. (F–I) Interaction numbers as a function of time, for Gr66a > CsChrimson flies in the STROBE with the indicated denatonium concentrations. (J) Summary data for retinal-positive flies from all experiments.
Figure 4—figure supplement 5
Behavioral dynamics during sweet GRN stimulation with bitter-containing food.
(A–D) Preference indices as a function of time, for Gr64f > CsChrimson flies in the STROBE with the indicated denatonium concentrations. Green lines denote flies pre-fed retinal and gray lines are non-retinal controls. (E) Summary data for retinal-positive flies from all experiments. (F–I) Interaction numbers as a function of time, for Gr64f > CsChrimson flies in the STROBE with the indicated denatonium concentrations. (J) Summary data for retinal-positive flies from all experiments.
Figure 5
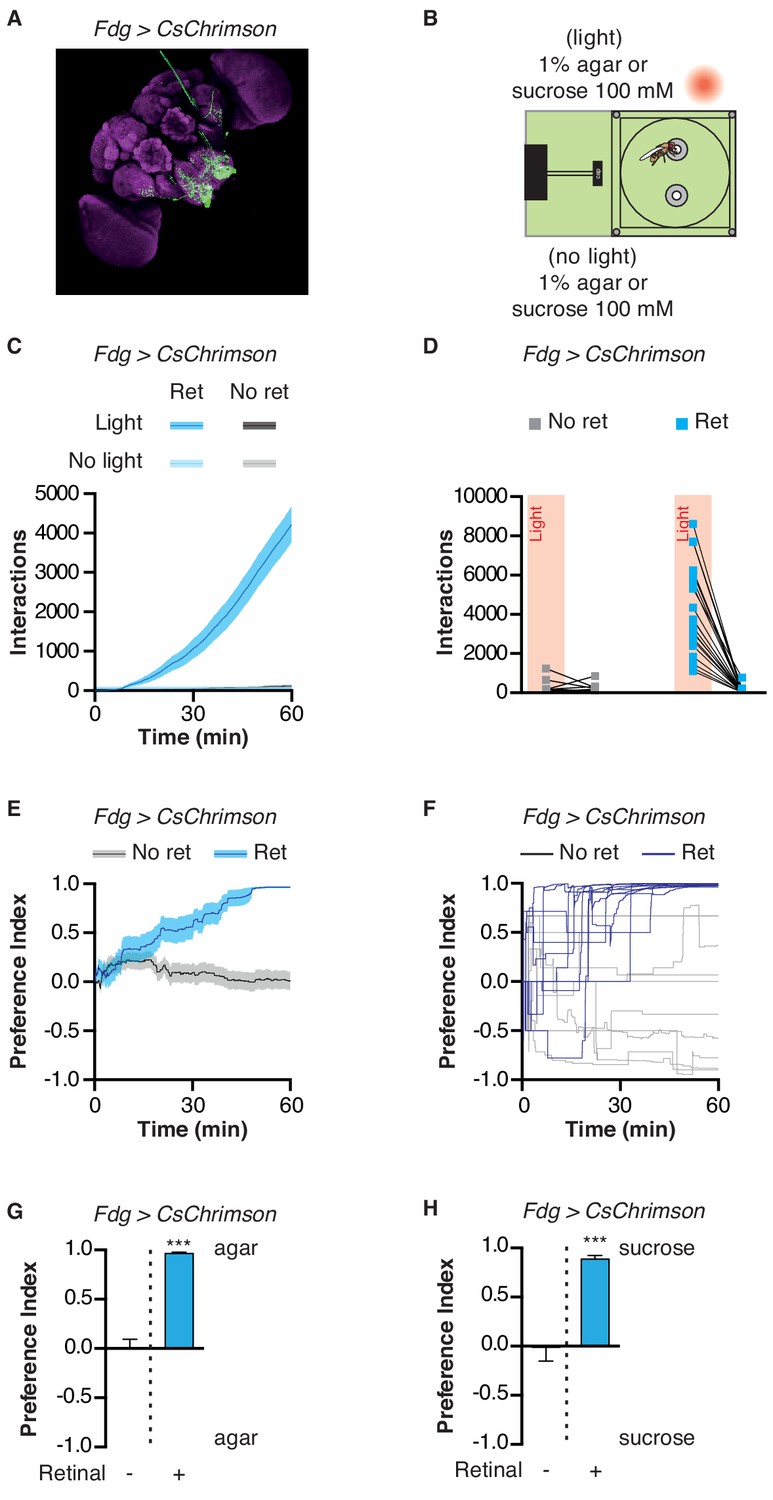
Activation of feeding command neurons elicits extreme sipping behavior.
(A) Immunofluorescent detection of Fdg > CsChrimson. (B) Experimental setup: both channels contain either 1% agar or 100 mM sucrose. (C) Cumulative food interaction numbers for the population of Fdg > Chrimson flies over the course of a 1 hr experiment. (D) Total interaction numbers for individual flies. (E–F) Preference index for Fdg > Chrimson flies over the course of a 1 hr experiment averaged (E) or for ten individual flies (F). (G–H) Preference index for Fdg > Chrimson flies after one hour spent in the STROBE with agar (G) or 100 mM sucrose (H) . Values are mean ± SEM. n = 14–33. Statistical tests: t-test. ***p<0.001.
-
Figure 5—source data 1
This file contains all the raw numerical data for Figure 5.
- https://doi.org/10.7554/eLife.45636.026
Figure 6 with 3 supplements
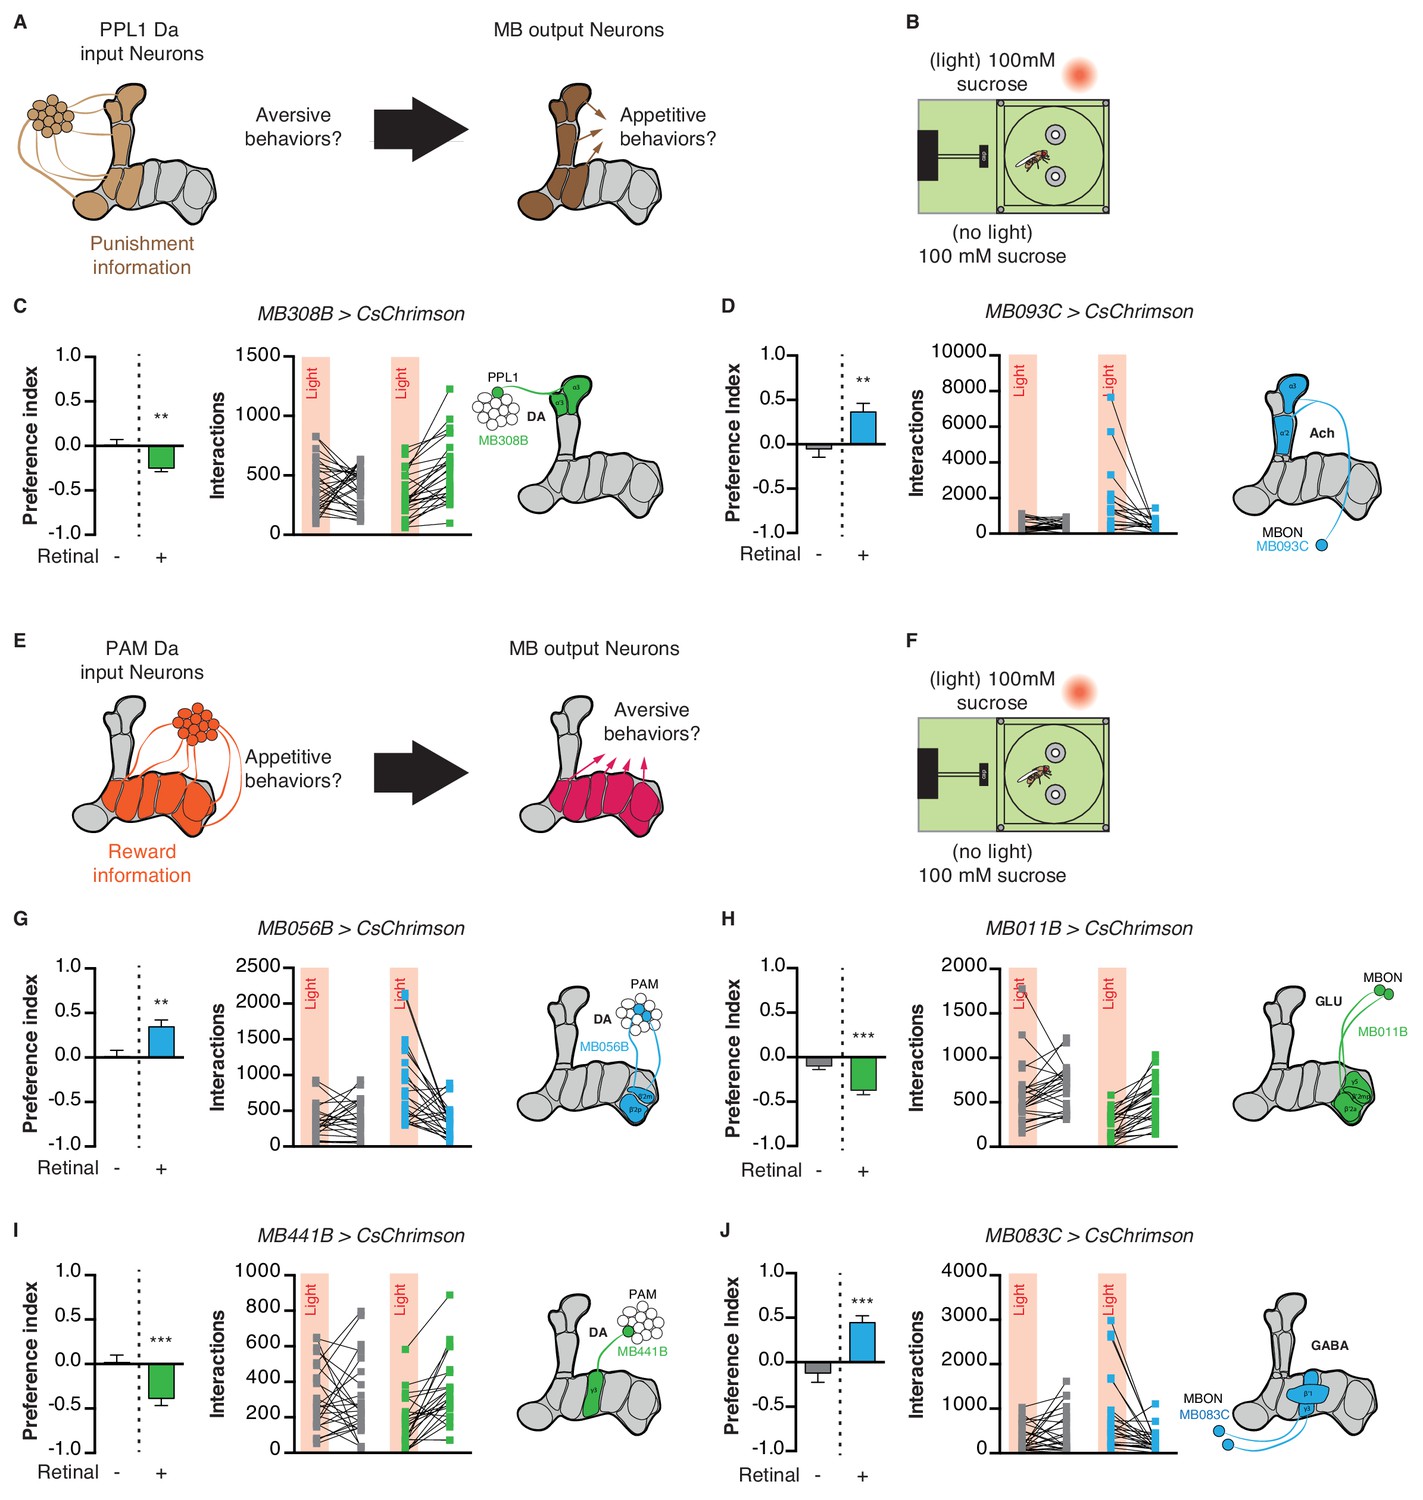
Manipulation of mushroom body extrinsic neurons modifies feeding behavior.
(A) Model for PPL1 input to the MB and corresponding output: PPL1 neurons signal punishment and are predicted to drive aversive behavior, while corresponding MBONs are predicted to be appetitive. (B) Experimental setup: both channels contain 100 mM sucrose in 1% agar. (C) Light side preference and interactions of flies expressing CsChrimson in PPL1 neurons α3,α’3 (MB308-GAL4). (D) Light side preference and interactions of flies expressing CsChrimson in MBON α3,α’two neurons (MB093C-GAL4). (E) Model for PAM input to the MB and corresponding output: PAM neurons signal reward and are predicted to drive appetitive behavior while corresponding MBONs are predicted to be aversive. (F) Experimental setup: both channels contain 100 mM sucrose in 1% agar. (G) Light side preference and interactions of flies expressing CsChrimson in PAM β2,β’two neurons (MB056B-GAL4). (H) Light side preference and interactions of flies expressing CsChrimson in MBON neurons post-synaptic to PAM β2,β’two neurons (MB011B-GAL4). (I) Light side preference and interactions of flies expressing CsChrimson in PAM γ3 neurons (MB441-GAL4). (J) Light side preference and interactions of flies expressing CsChrimson in MBON neurons post-synaptic to PAM γ3 neurons (MB083C-GAL4). Values are mean ± SEM. n = 18–29. Statistical test: t-test. **p<0.01, ***p<0.001.
-
Figure 6—source data 1
This file contains all the raw numerical data for Figure 6 and its associated figure supplements.
- https://doi.org/10.7554/eLife.45636.031
Figure 6—figure supplement 1
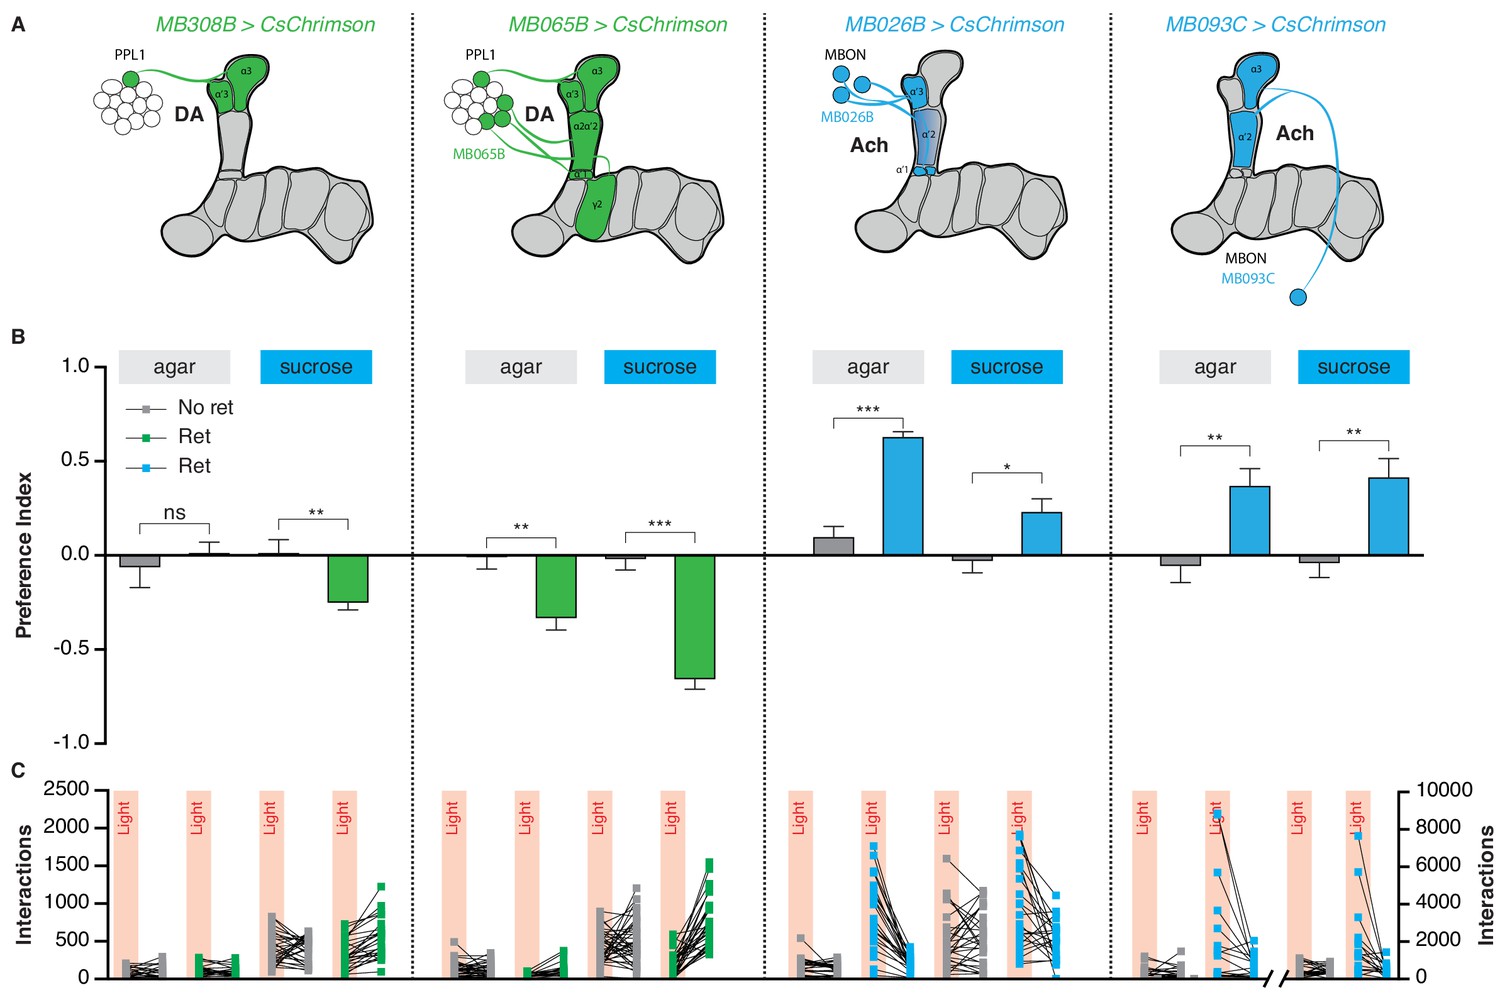
Manipulation of PPL1 DANs and their corresponding output neurons modifies feeding behavior.
(A) Schematics of the lines used in the experiment. (B–C) The effect of two PPL1 drivers and two MBON drivers innervating similar compartments on light side preference (B) and food interaction numbers (C) in the STROBE. Each experiment is shown with plain agar in both channels, and with sucrose in both channels. Values are mean ± SEM. n = 17–38. Statistical test: t-test. ns p>0.05; *p<0.05; **p<0.01, ***p<0.001.
Figure 6—figure supplement 2
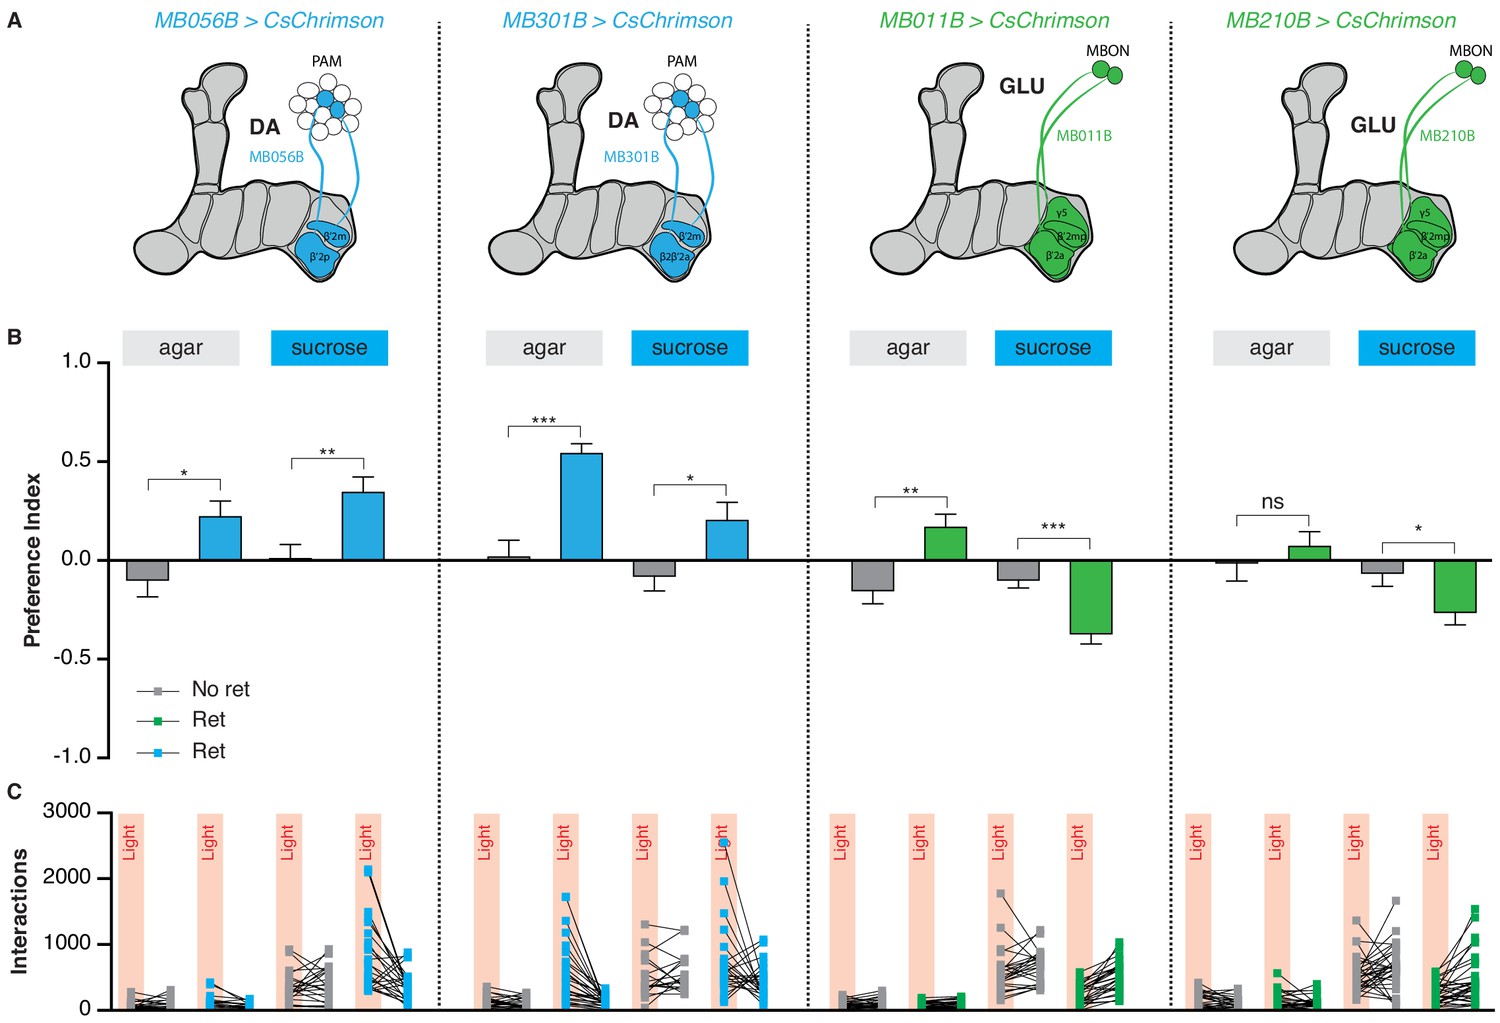
Manipulation of PAM DANs and their corresponding output neurons modifies feeding behavior.
(A) Schematics of the lines used in the experiment. (B–C) The effect of two PAM drivers and two MBON drivers innervating similar compartments on preference (B) and food interaction numbers (C) in the STROBE. Each experiment is shown with plain agar in both channels, and with sucrose in both channels (MB056B: n = 15, 16, 24, 24; MB301B: n = 25, 28, 18, 24; MB011B: n = 29, 27, 25, 27; MB210B, n = 24, 28, 30, 31). Values are mean ± SEM; statistical test: t-test; ns: p>0.05, *p<0.05, **p<0.01, ***p<0.001.
Figure 6—figure supplement 3
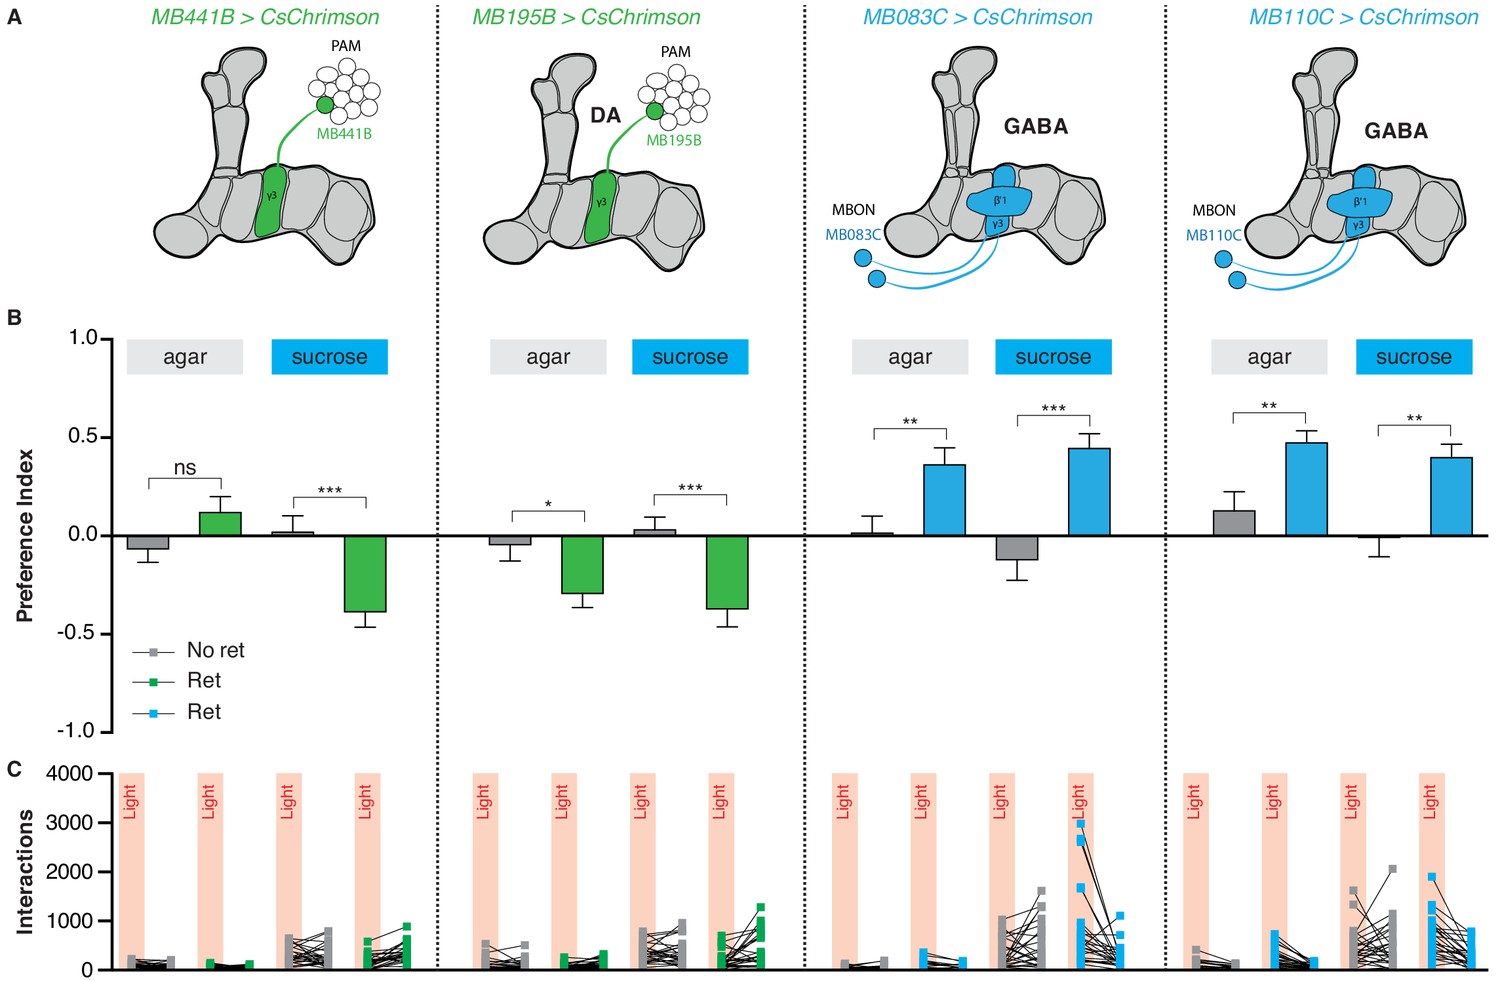
Manipulation of PAM γ3 DANs and their corresponding output neurons modifies feeding behavior.
(A) Schematics of the lines used in the experiment. (B–C) The effect of two PAM γ3 drivers and two MBON drivers innervating similar compartments on preference (B) and food interaction numbers (C) in the STROBE. Each experiment is shown with plain agar in both channels, and with sucrose in both channels. Values are mean ± SEM. n = 21–30. Statistical test: t-test. ns p>0.05, *p<0.05, **p<0.01, ***p<0.001.
Figure 7 with 3 supplements
Activation of mushroom body circuits drives ingestion behavior.
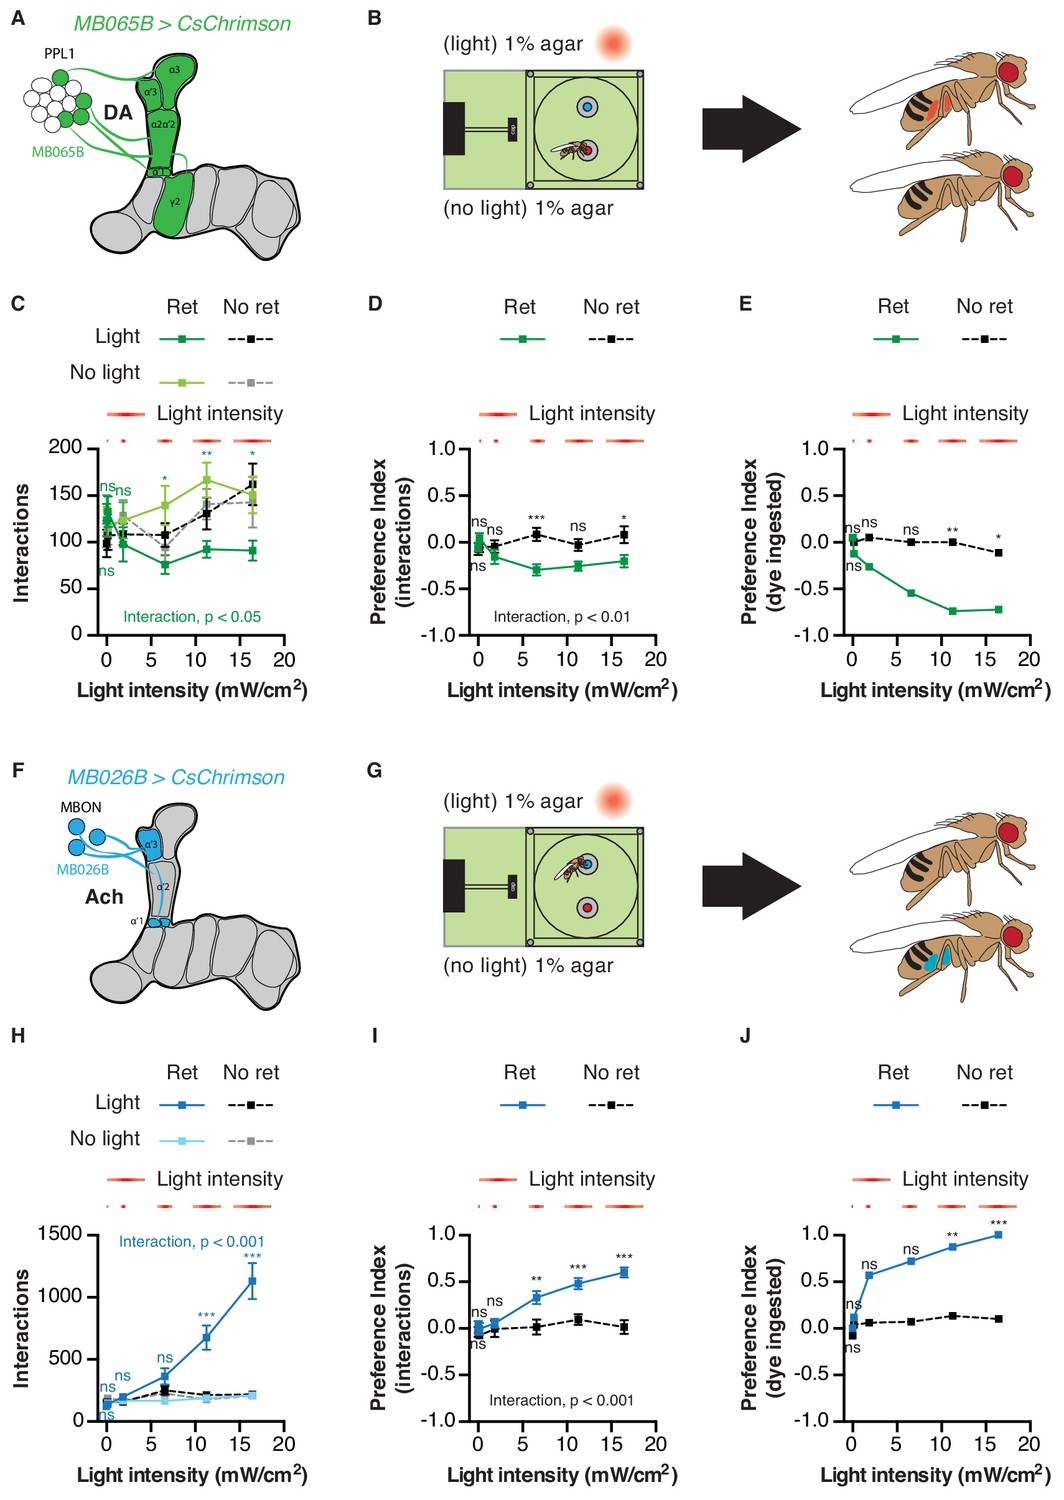
(A) Schematic of the PPL1 driver used. (B) Experimental setup: one channel contains 1% agar with blue dye, and the other has 1% agar with red dye. Fly abdomen color is determined following the experiment. (C) Food interactions from flies expressing CsChrimson in PPL1 DANs in the STROBE with increasing light intensity. Green lines indicate flies pre-fed retinal, and black/gray lines are non-retinal controls. (D–E) Light side preference indices calculated using interactions (D) or dye ingestion (E). (F) Schematic of the MBON driver used. (G) Experimental setup: one channel contains 1% agar with blue dye, and the other has 1% agar with red dye. Fly abdomen color is determined following the experiment. (H) Food interactions from flies expressing CsChrimson under control of MB026B-GAL4 in the STROBE with increasing light intensity. Blue lines indicate flies pre-fed retinal, and black/gray lines indicate non-retinal controls. (I–J) Light side preference indices calculated using interactions (I) or dye ingestion (J). Values are mean ± SEM. n = 19–30 for (C–E) and 14–27 for (H–J). Statistical test: two-way ANOVA with Bonferroni post hoc. ns p>0.05, *p<0.05, **p<0.01, ***p<0.001. Colored asterisks represent significance between sips on each side for the retinal group.
-
Figure 7—source data 1
This file contains all the raw numerical data for Figure 7 and its associated figure supplements.
- https://doi.org/10.7554/eLife.45636.036
Figure 7—figure supplement 1
Behavioral dynamics during PPL1 DAN stimulation.
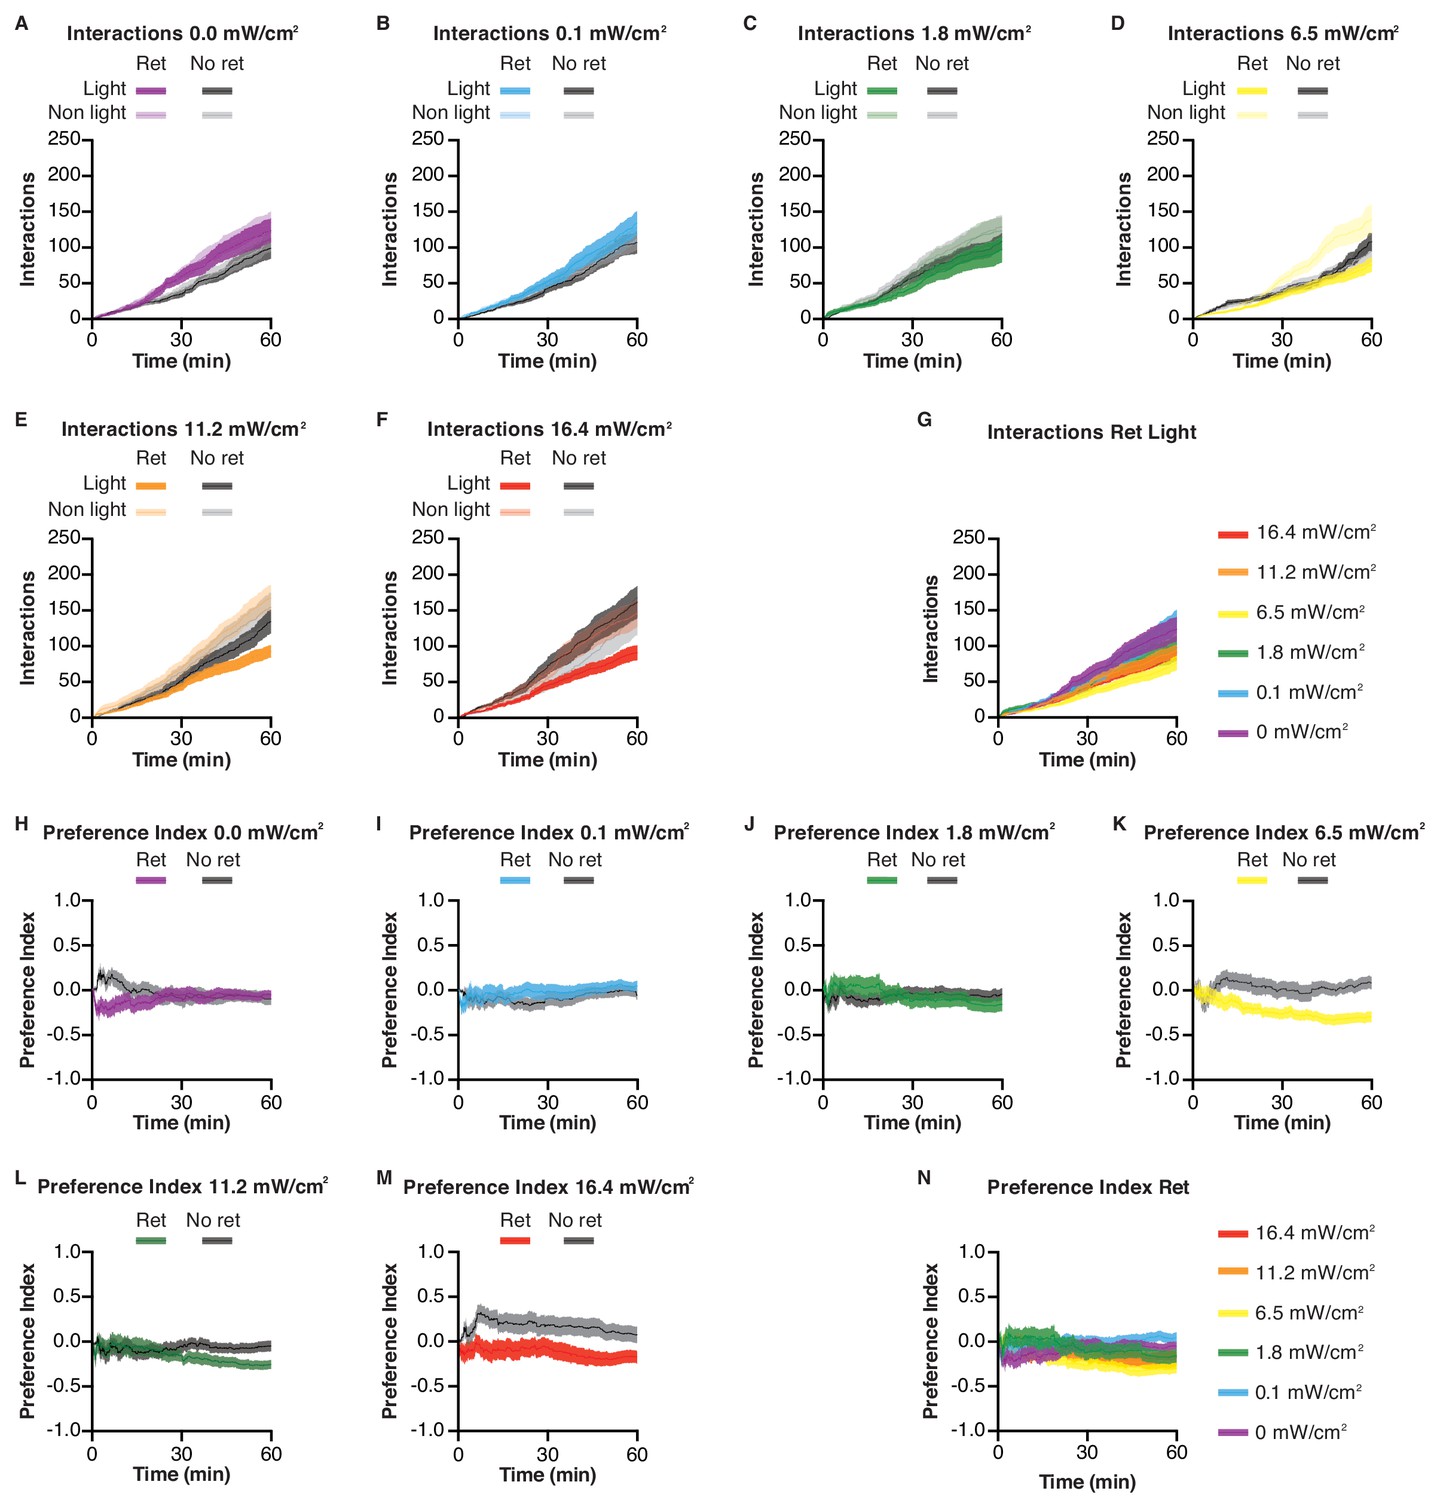
(A–F) Interaction numbers as a function of time, for MB065B > CsChrimson flies in the STROBE with the indicated light intensities. Green lines denote flies pre-fed retinal and gray lines are non-retinal controls. (G) Summary data for retinal-positive flies from all experiments. (H–M) Preference indices as a function of time, for MB065B > CsChrimson flies in the STROBE with the indicated light intensities. (N) Summary data for retinal-positive flies from all experiments.
Figure 7—figure supplement 2
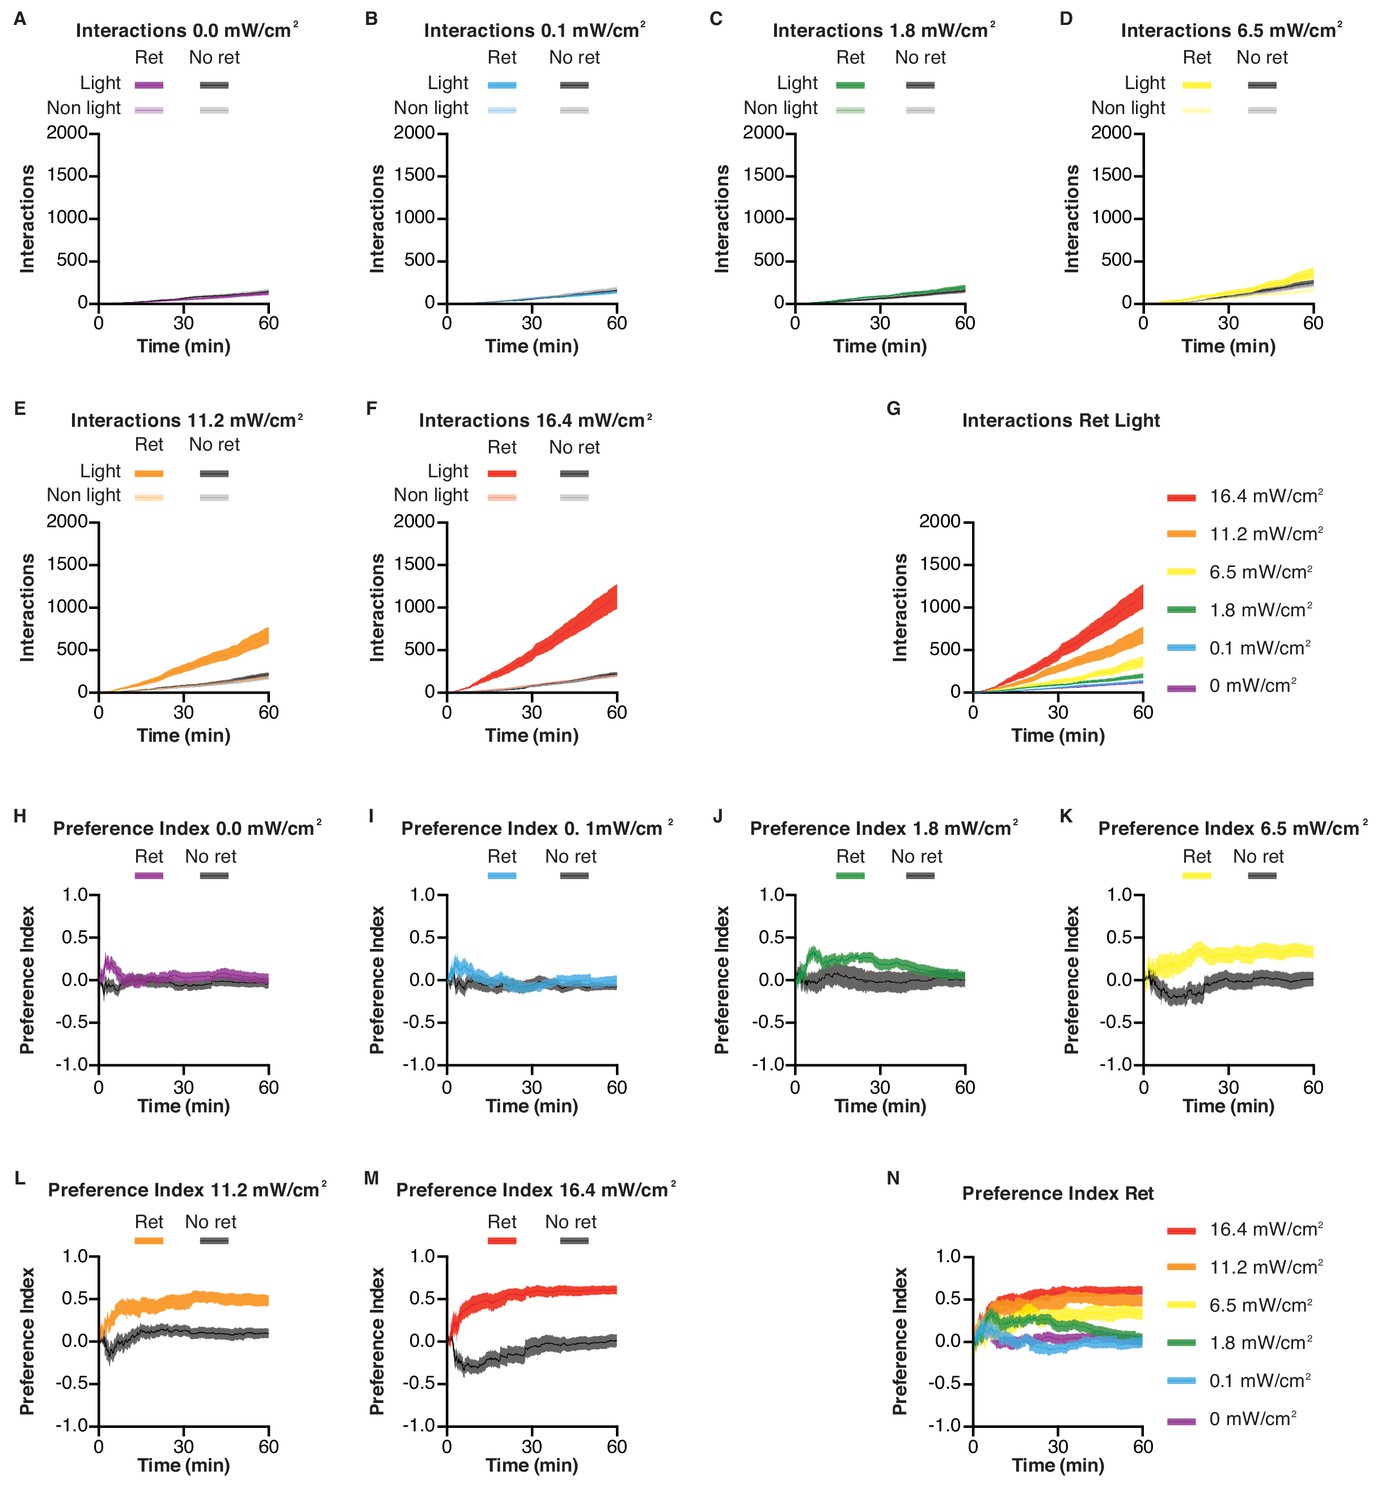
Behavioral dynamics during MBON stimulation.
(A–F) Interaction numbers as a function of time, for MB026B > CsChrimson flies in the STROBE with the indicated light intensities. Blue lines denote flies pre-fed retinal and gray lines are non-retinal controls. (G) Summary data for retinal-positive flies from all experiments. (H–M) Preference indices as a function of time, for MB026B > CsChrimson flies in the STROBE with the indicated light intensities. (N) Summary data for retinal-positive flies from all experiments.
Figure 7—figure supplement 3
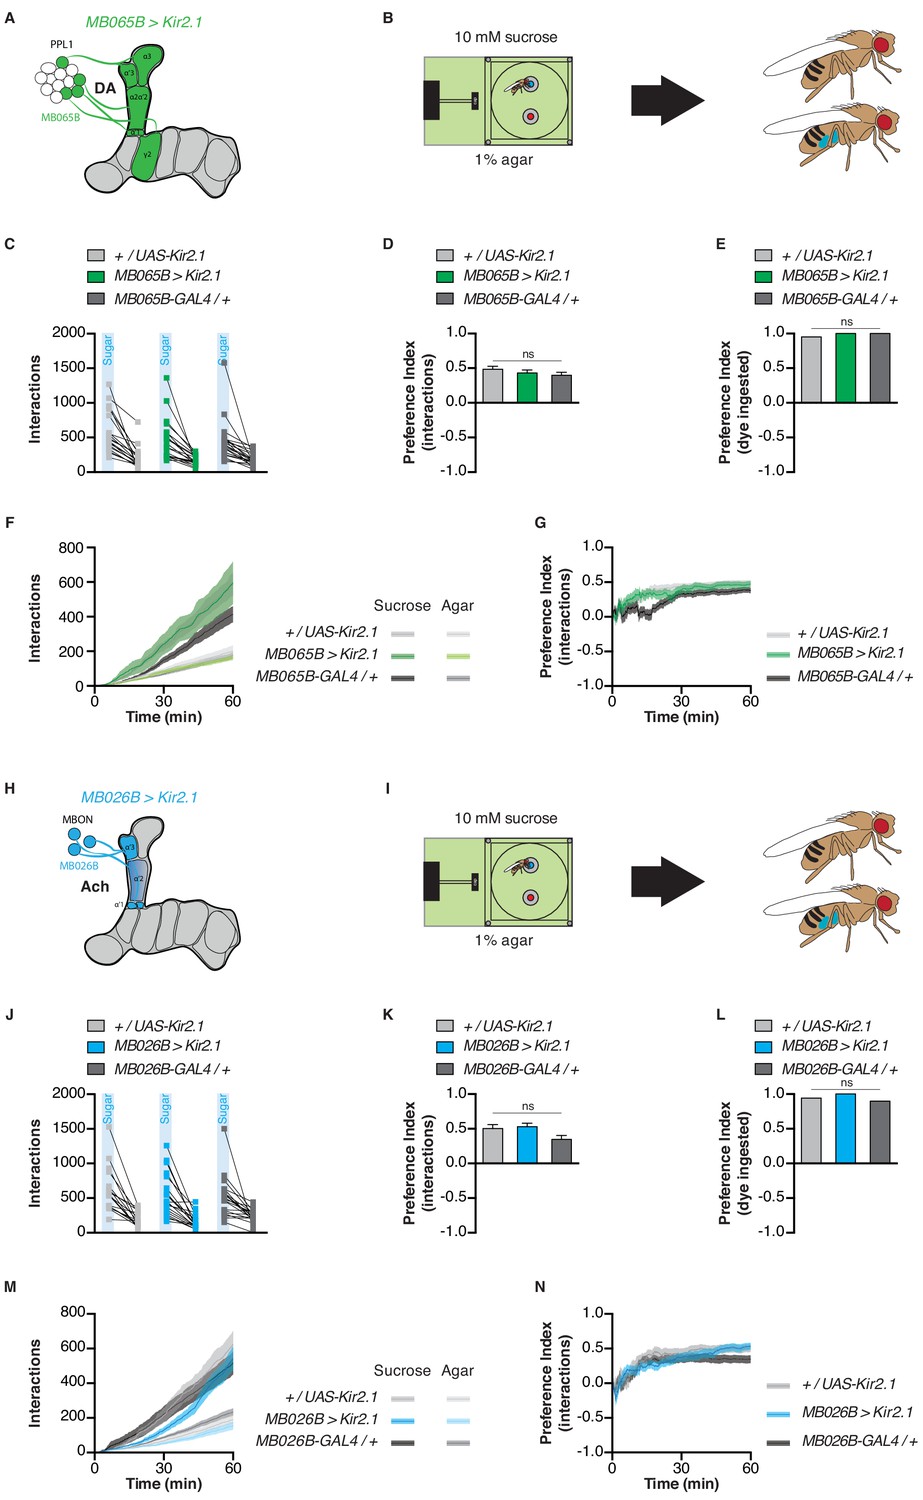
Silencing PPL1 or MB026B neurons has no effect on sugar feeding.
(A) Schematic of the PPL1 driver used. (B) Experimental setup: one channel contains 10 mM sucrose in 1% agar with either blue or red dye, and the other has 1% agar with dye of the other color. No LED illumination is triggered. Fly abdomen color is determined following the experiment. (C) Food interactions from flies expressing Kir2.1 in PPL1 DANs in the STROBE with no light stimulation. Connected dots indicate the sugar and plain agar interactions for the indicated genotypes. (D–E) Sugar preference indices for each genotype calculated using interactions (D) or dye ingestion (E). (F–G) Time courses of interactions (F) and preference (G) for indicated genotypes. (H) Schematic of the MBON driver used. (I) Experimental setup: one channel contains 10 mM sucrose in 1% agar with either blue or red dye, and the other has 1% agar with dye of the other color. No LED illumination is triggered. Fly abdomen color is determined following the experiment. (J) Food interactions from flies expressing Kir2.1 in MB026B neurons in the STROBE with no light stimulation. Connected dots indicate the sugar and plain agar interactions for the indicated genotypes. (K–L) Sugar preference indices for each genotype calculated using interactions (K) or dye ingestion (L). (M–N) Time course of interactions (M) and preference (N) for indicated genotypes. Values are mean ± SEM (no error shown for dye experiments). n = 17–21. Statistical tests: t-test (for interactions based data) and Chi-square (for dye ingestion data). ns p>0.05 (t-test), ns α >0.025 (Chi-square).
Videos
Video 1
This movie shows an individual fly feeding on the light-triggering food in a STROBE arena.
https://doi.org/10.7554/eLife.45636.006
Video 2
This movie shows the full STROBE system.
Each chamber contains a fly expressing CsChrimson under the control of Fdg-GAL4. The flies on the left side have been fed all-trans retinal. The flies on the right have not been fed retinal.
Additional files
-
Supplementary file 1
This is a zip file containing all the information needed to build and operate a STROBE system.
- https://doi.org/10.7554/eLife.45636.037
-
Transparent reporting form
- https://doi.org/10.7554/eLife.45636.038
Download links
A two-part list of links to download the article, or parts of the article, in various formats.
Downloads (link to download the article as PDF)
Open citations (links to open the citations from this article in various online reference manager services)
Cite this article (links to download the citations from this article in formats compatible with various reference manager tools)
Closed-loop optogenetic activation of peripheral or central neurons modulates feeding in freely moving Drosophila
eLife 8:e45636.
https://doi.org/10.7554/eLife.45636


