Transient protein accumulation at the center of the T cell antigen-presenting cell interface drives efficient IL-2 secretion
- University of Bristol, United Kingdom
- Carnegie Mellon University, United States
- University of Texas Southwestern Medical Center, United States
- National Human Genome Research Institute, National Institutes of Health, United States
- Albert Ludwig University of Freiburg, Germany
Figures
Figure 1 with 4 supplements

CD28 and Itk regulate IL-2 secretion and signaling organization.
(A) In vitro primed 5C.C7 T cells, wild type or Itk-deficient (‘Itk ko’), were activated by CH27 APCs and the indicated concentration of MCC peptide in the absence or presence of 10 µg/ml anti-CD80 plus anti-CD86 (‘full stimulus’ or ‘costimulation blockade’). IL-2 levels in the supernatant are given relative to stimulation of wild type 5C.C7 T cells under full stimulus conditions with 10 µM MCC with SEM. 4–8 experiments were averaged per condition. Statistical significance as determined separately for each MCC peptide concentration by 1-way ANOVA is indicated. (B) Relative levels of IL-2 mRNA are given upon 5C.C7 T cell activation similar to A with only 10 µM MCC. 3–18 experiments were averaged per condition. Statistical significance as determined by 1-way ANOVA is indicated. (C) Wild type and Itk-deficient ('Itk ko') 5C.C7 T cells expressing the indicated sensors were activated by CH27 B cell APCs (10 µM MCC) in the absence or presence of 10 µg/ml anti-CD80 plus anti-CD86 ((‘full stimulus’ or ‘costimulation blockade’) and percentage occurrence of patterns of interface enrichment (Figure 1—figure supplement 2A) is given in shades of red from −40 to 420 s relative to tight cell coupling. Cluster trees are given in pink.Sensors used and source data for panel Care given in Figure 1—figure supplements 2B–4, Figure 1—source data 1.
-
Figure 1—source data 1
Sensors used in Figure 1C,D.
Publications describing the sensors used in Figure 1C,D and representative 5C.C7 T cell imaging data are given.
- https://doi.org/10.7554/eLife.45789.008
Figure 1—figure supplement 1
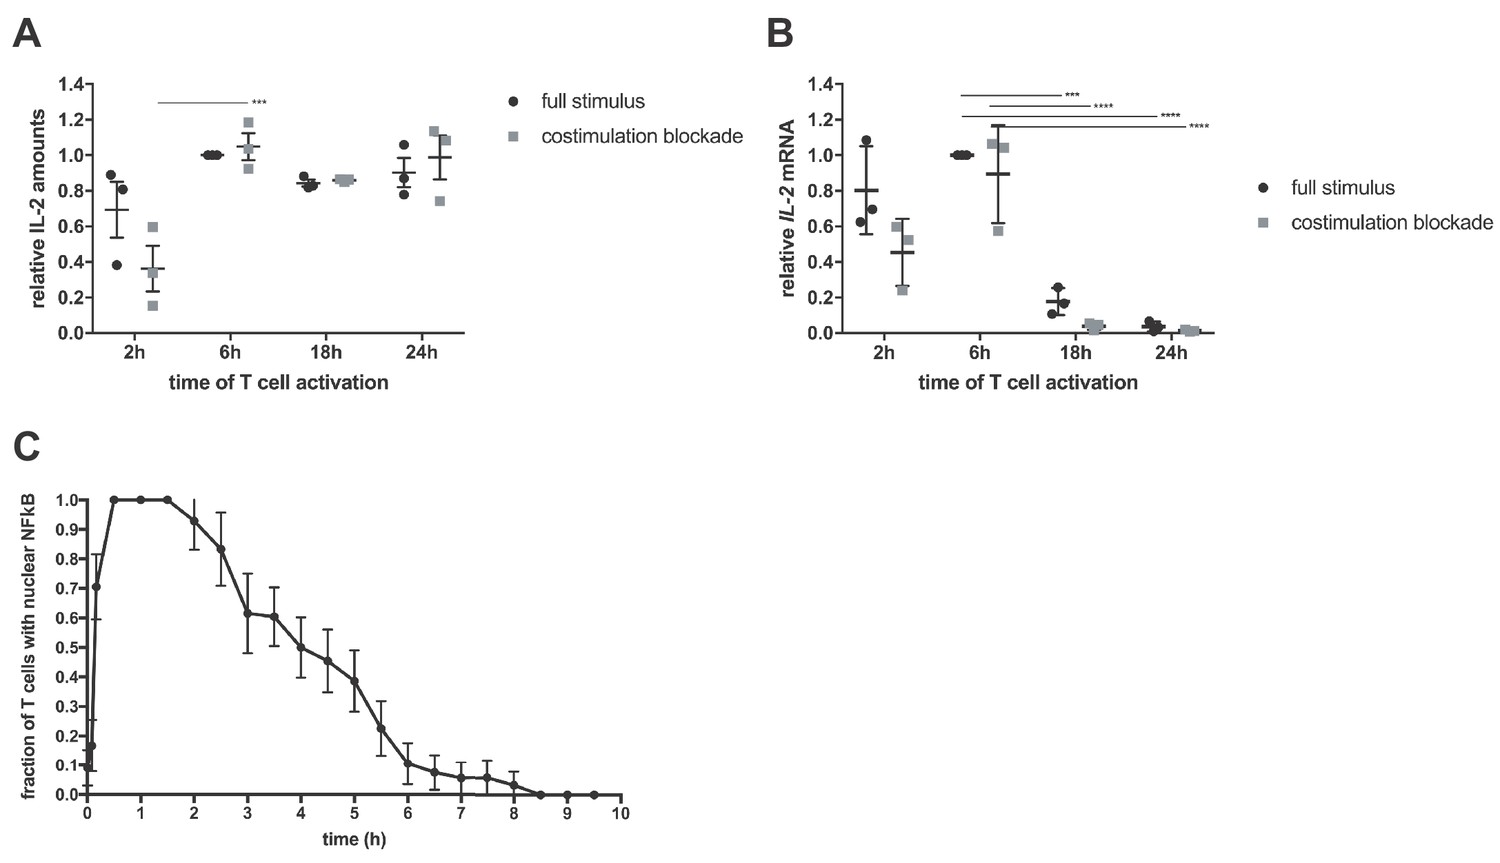
The generation of IL-2 mRNA is focused on the first 6 hr after cell couple formation.
(A) In vitro primed 5C.C7 T cells were activated by CH27 APCs and 10 µM of MCC peptide in the absence or presence of 10 µg/ml anti-CD80 plus anti-CD86 (‘full stimulus’ or ‘costimulation blockade’). IL-2 levels in the supernatant are given relative to stimulation of wild type 5C.C7 T cells under full stimulus conditions at 6 hr with SEM. Three experiments were averaged per condition. Statistical significance as determined by 2-way ANOVA with Sidak’s correction for multiple comparison is indicated. (B) Relative levels of IL-2 mRNA are given upon 5C.C7 T cell activation similar to A upon addition of a no peptide control. Three experiments were averaged per condition. Statistical significance as determined by 2-way ANOVA with Sidak’s correction for multiple comparison is indicated. (C) The graph displays the percentage of cell couples with nuclear NFκB accumulation relative to tight cell couple formation for 5C.C7 T cells activated with CH27 APCs (10 µM MCC). 24 cell couples from a single experiment were analyzed. *p<0.05, ***p<0.001, ****p<0.0001.
Figure 1—figure supplement 2
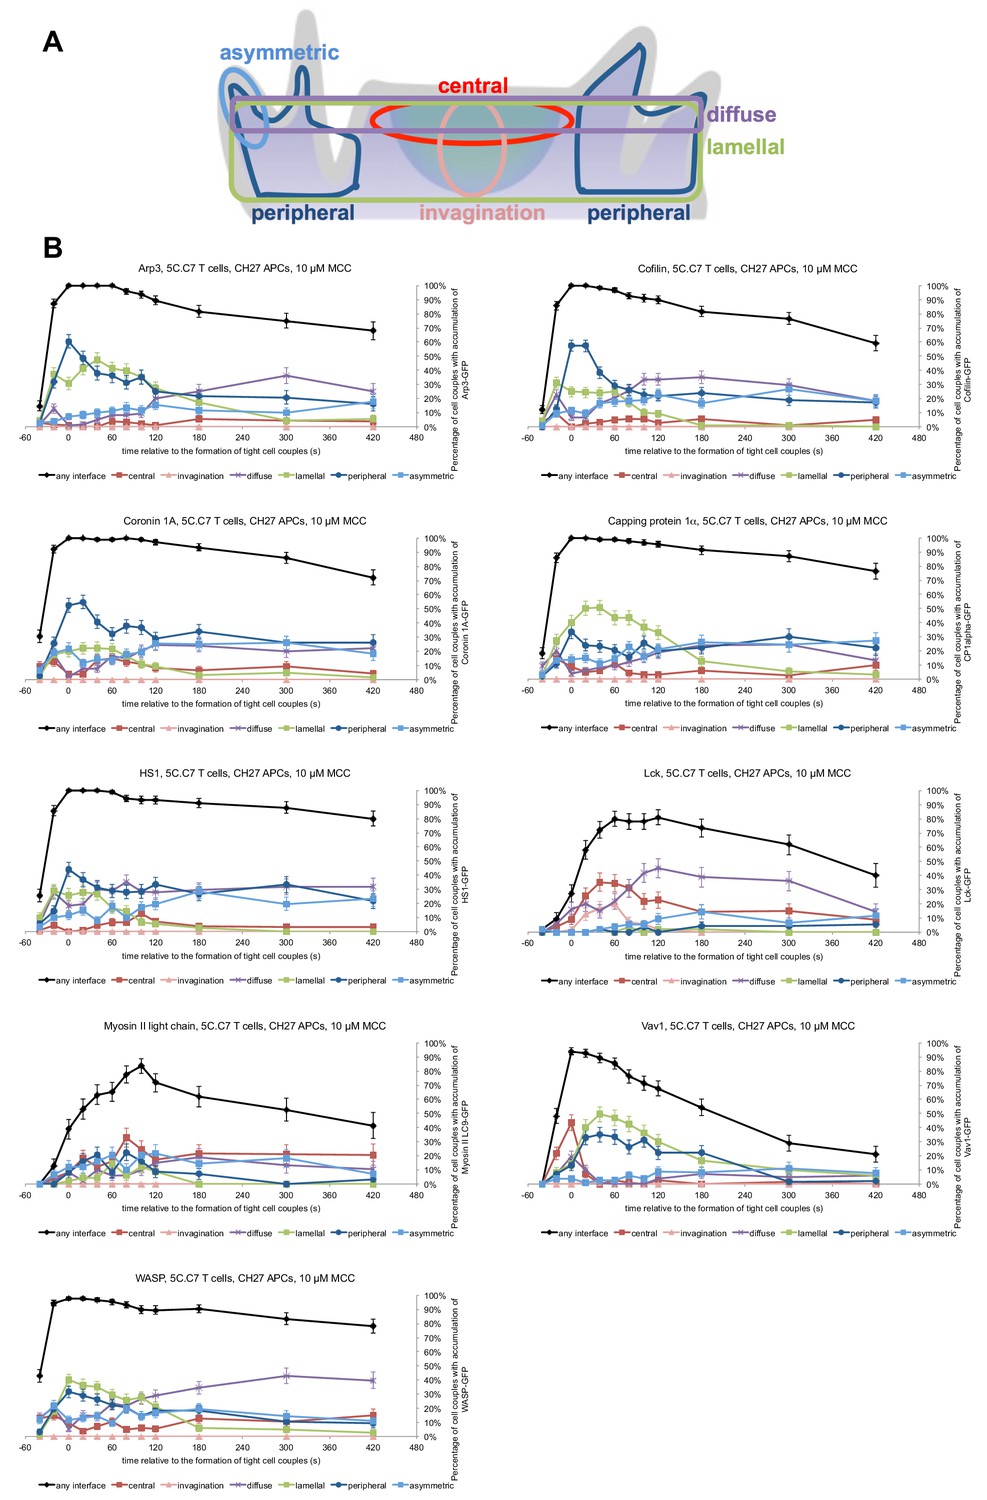
Sensor accumulation at the T cell:APC interface under full stimulus conditions.
(A) The panel graphically represents the six categories used to classify spatiotemporal sensor distribution as underpinned by defined cell biological structures at the T cell:APC interface (Roybal et al., 2013; Singleton et al., 2009). The antigen-presenting cell above the T cell is not shown. Central reflects the cSMAC, lamellal an F-actin-based lamella extending from the undulating T cell plasma membrane deep into the T cell, peripheral the part of the actin network stabilizing the interface edge. Diffuse reflects cortical accumulation, invagination enrichment in a transient large T cell invagination and asymmetric individual small lamellae. For all main figures the patterns ‘diffuse’ and ‘lamellal’ are combined as ‘diffuse/lamellal’, the patterns ‘asymmetric’ and ‘peripheral’ as ‘periphery’. (B) The graphs display the percentage of cell couples that displayed accumulation of the indicated sensor (Figure 1—source data 1) with the indicated patterns (A) relative to tight cell couple formation for wild type 5C.C7 T cells activated with CH27 B cell APCs (10 µM MCC peptide). 49–141 cell couples from 2 to 5 independent experiments were analyzed per condition, 869 total.
Figure 1—figure supplement 3
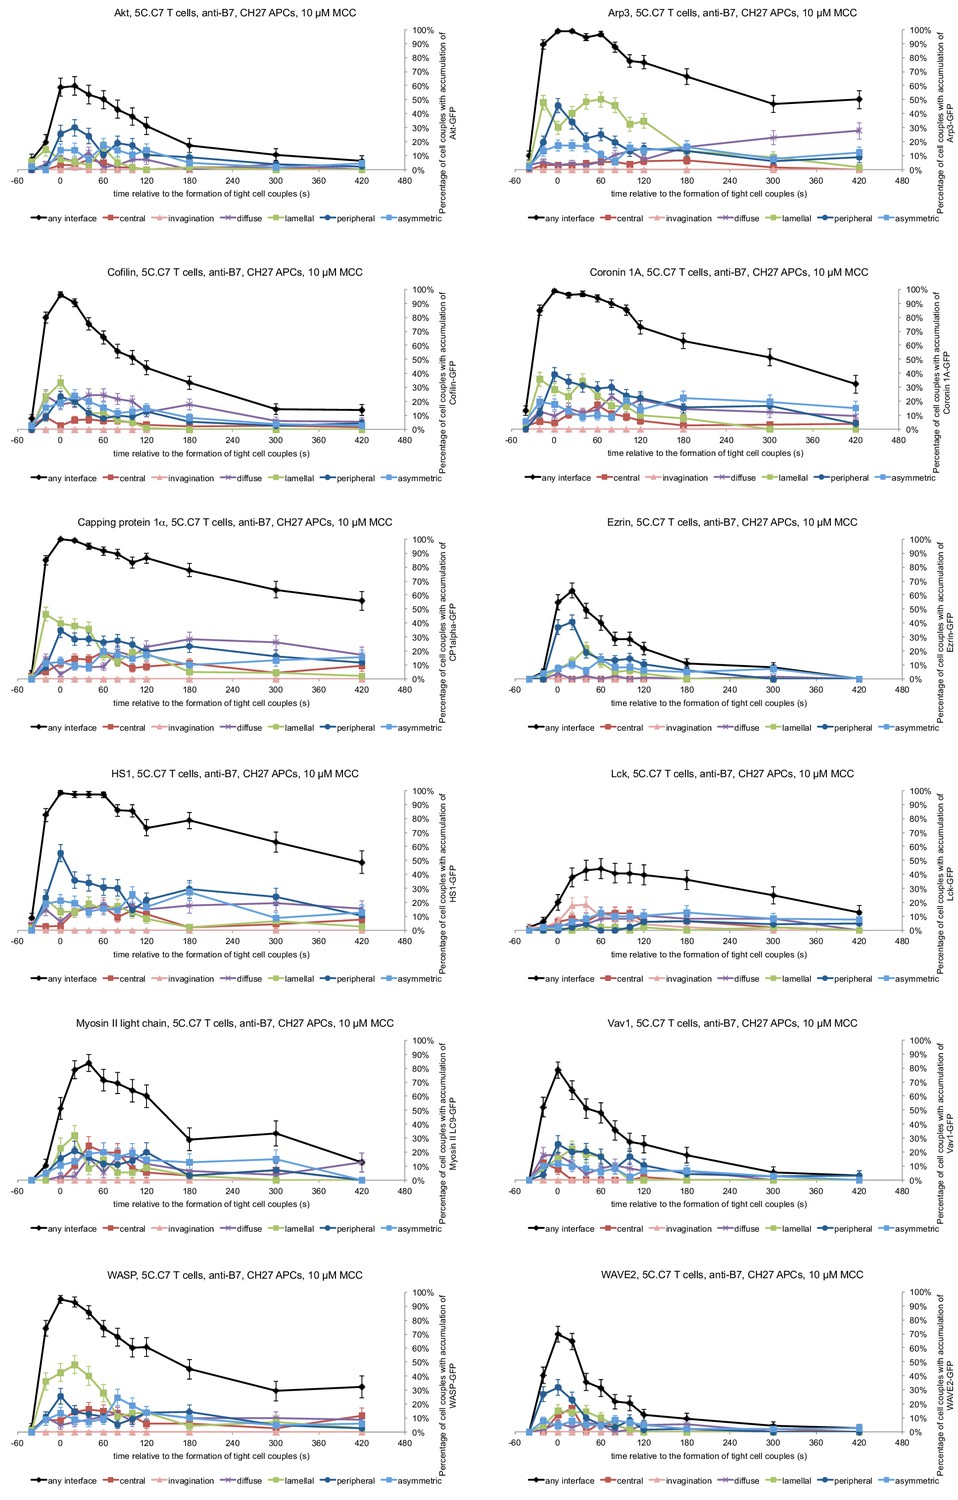
Sensor accumulation at the T cell:APC interface under costimulation blocked conditions.
The graphs display the percentage of cell couples that displayed accumulation of the indicated sensor (Figure 1—source data 1) with the indicated patterns (Figure 1—figure supplement 2A) relative to tight cell couple formation for wild type 5C.C7 T cells activated with CH27 B cell APCs (10 µM MCC peptide) in the presence of 10 µg/ml anti-CD80 plus anti-CD86. 39–107 cell couples from 2 to 4 independent experiments were analyzed per condition, 869 total.
Figure 1—figure supplement 4
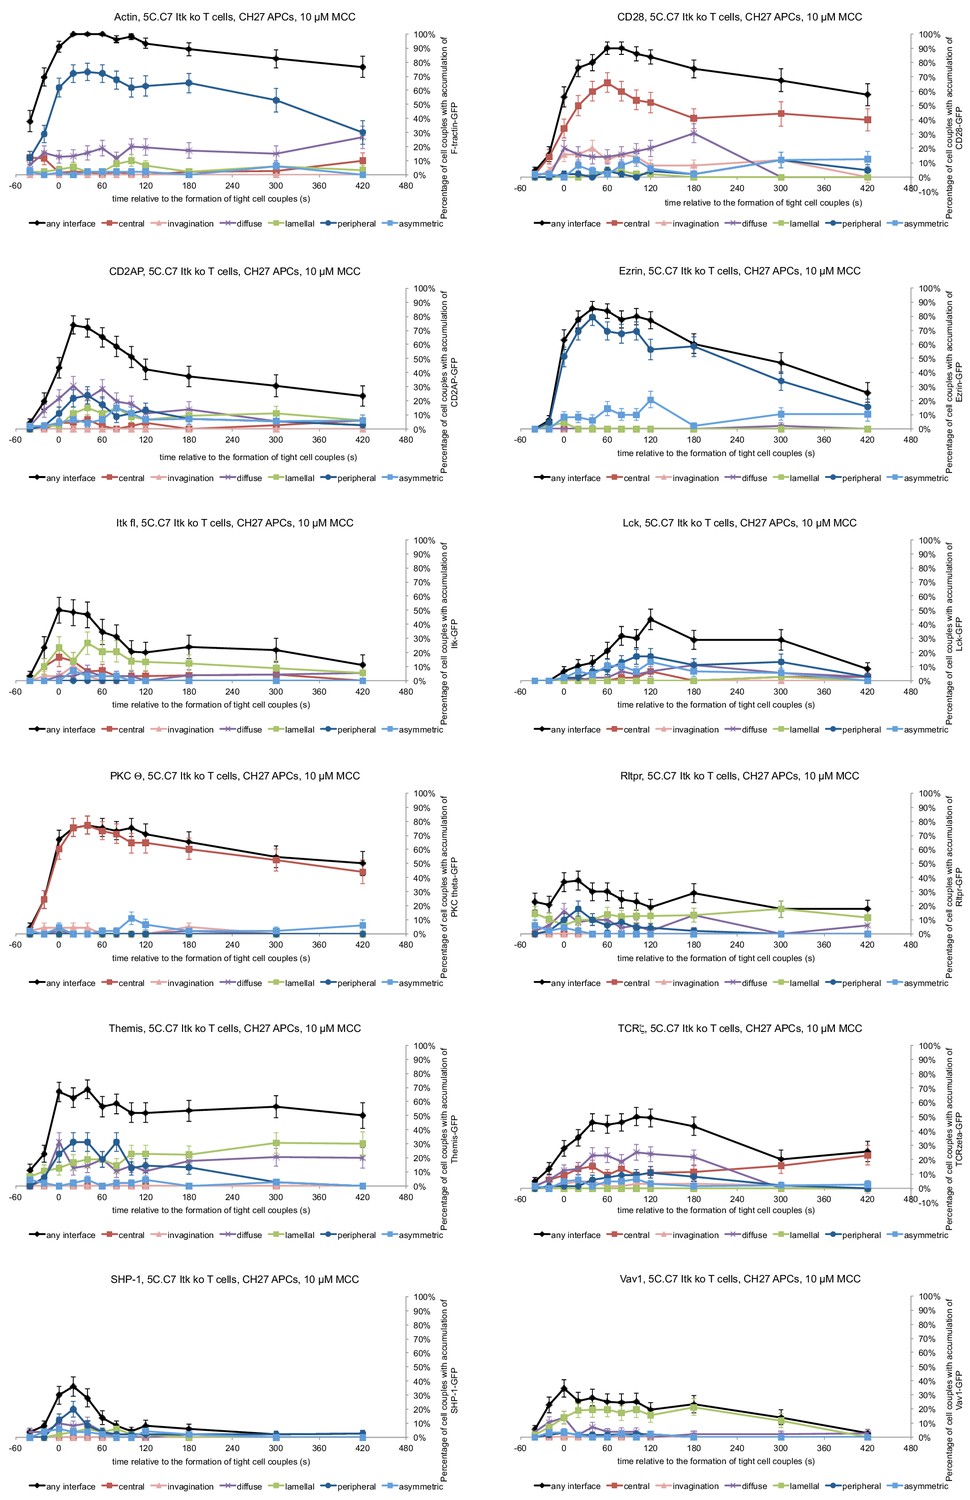
Sensor accumulation at the T cell:APC interface in the absence of Itk.
The graphs display the percentage of cell couples that displayed accumulation of the indicated sensor (Figure 1—source data 1) with the indicated patterns (Figure 1—figure supplement 2A) relative to tight cell couple formation for Itk-deficient 5C.C7 T cells activated with CH27 B cell APCs (10 µM MCC peptide). 30–65 cell from 2 to 4 independent experiments couples were analyzed per condition, 591 total.
Figure 2 with 2 supplements

LAT localization and activation is regulated by costimulation and Itk.
(A) An interaction of a LAT-GFP-transduced 5C.C7 T cell with a CH27 APC (10 μM MCC) is shown at the indicated time points (in minutes) relative to the time of formation of a tight cell couple. Differential interference contrast (DIC) images are shown in the top row, with top-down, maximum projections of 3-dimensional LAT-GFP fluorescence data in the bottom row. LAT-GFP fluorescence intensities are displayed in a rainbow-like false-color scale (increasing from blue to red). The scale bar corresponds to 5 µm. A corresponding video is available as Figure 2—Video 1. (B) The graphs display the percentage of cell couples with LAT accumulation in the indicated patterns (Figure 1—figure supplement 2A, ‘periphery’ is the sum of asymmetric and peripheral) relative to tight cell couple formation for wild type or Itk-deficient 5C.C7 T cells activated with CH27 APCs (10 µM MCC) in the absence or presence of 10 µg/ml anti-CD80 plus anti-CD86 (‘costimulation blockade’) as indicated. 47–77 cell couples from 2 to 5 independent experiments were analyzed per condition, 226 total. A statistical analysis is given in Figure 2—source data 1. (C) Itk-deficient 5C.C7 T cells were activated with CH27 APCs (10 µM MCC) in the presence of 10 µg/ml anti-CD80 plus anti-CD86 and 250 nM constitutively active Cofilin plus 1 µM constitutively active Rac1 as protein transduction reagents. LAT interface accumulation is given as in B. 30 cell couples from a single experiment were analyzed. Statistical significance is given in Figure 2—source data 1. (D) 5C.C7 T cells were activated as in B for the indicated times. Band intensities of α-LAT pY191 blots (Figure 2—figure supplement 1) as normalized to the 1 min time point under full stimulus conditions are given. 5–7 experiments were averaged per condition. Statistical significance as determined separately for each time point by 1-way ANOVA is indicated.
-
Figure 2—source data 1
Statistical significance of differences in LAT accumulation under different T cell activation conditions is given for the indicated patterns as determined by proportion’s z-test.
No entry indicates p>0.05. 0.000 indicates p<0.0005. Gray scale is used to visualize the level of significance.
- https://doi.org/10.7554/eLife.45789.010
Figure 2—figure supplement 1
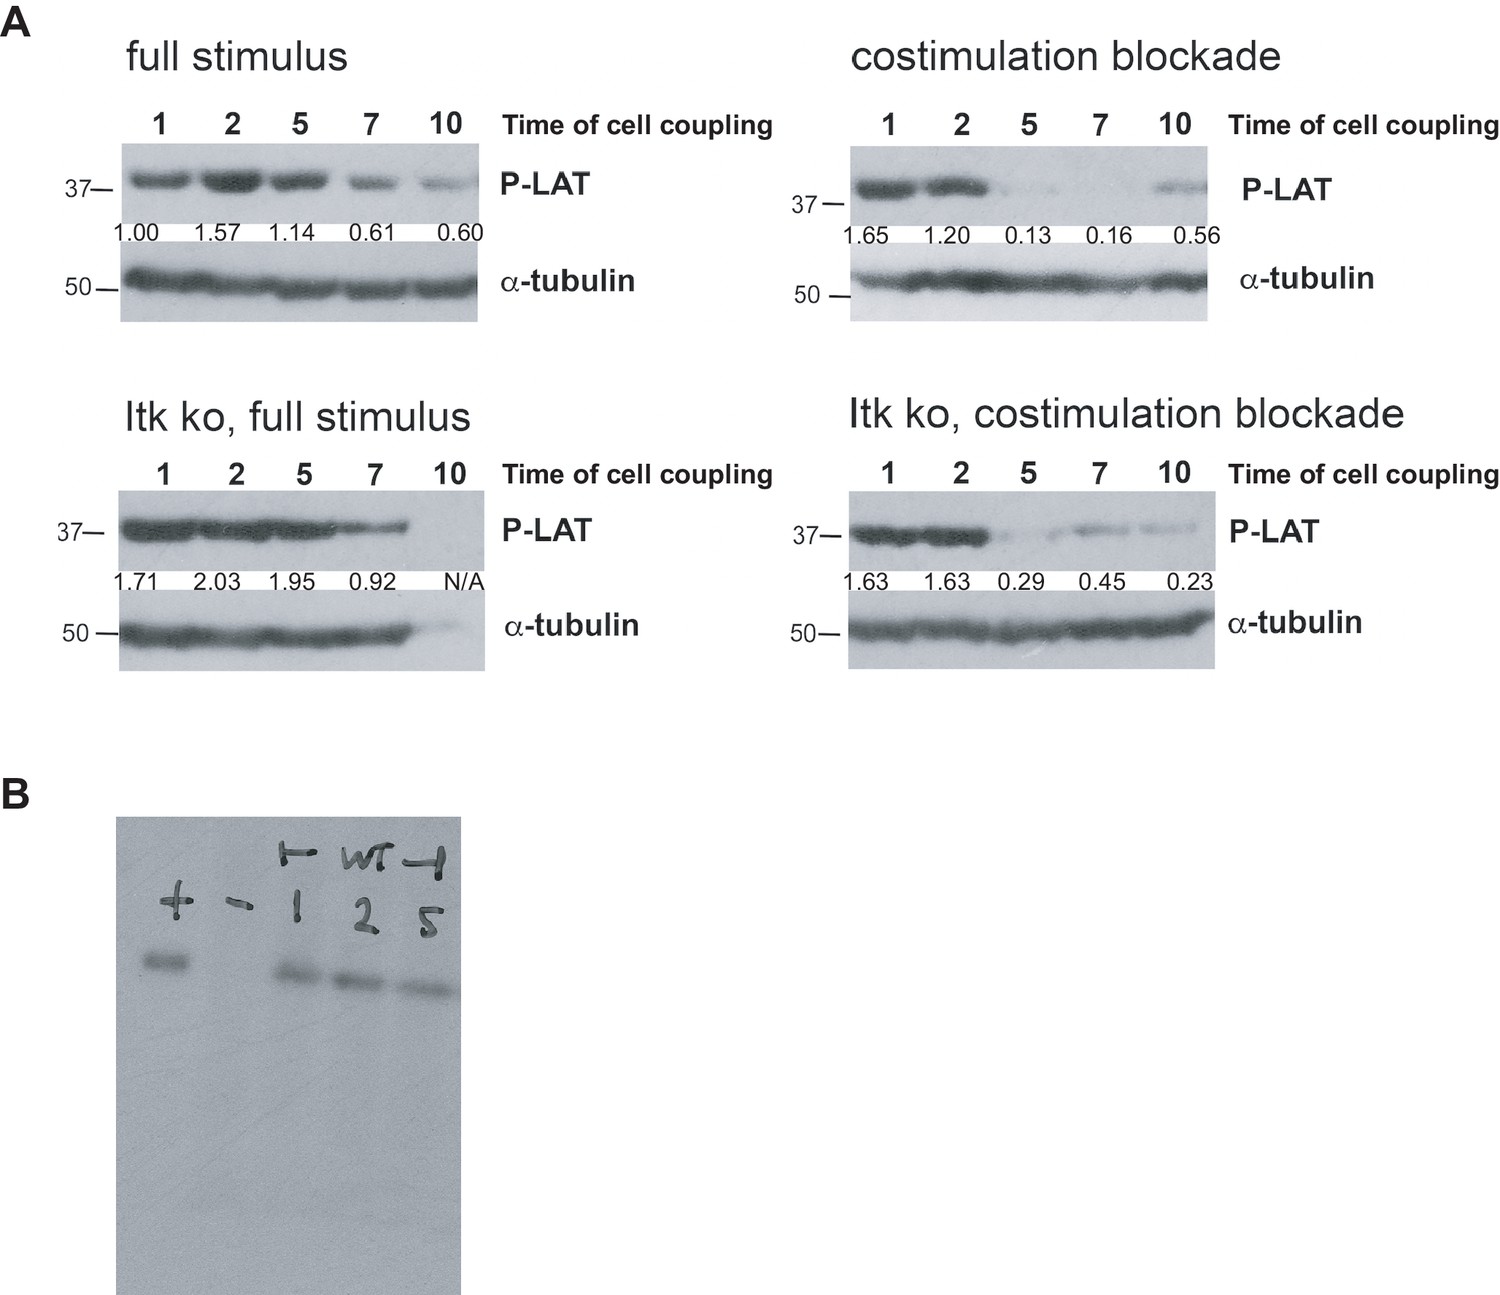
Representative phospho-LAT Y191 western blots.
(A) Wild type or Itk-deficient 5C.C7 T cells were activated with CH27 B cells and 10 µm MCC in the presence or absence of 10 µg/ml anti-CD80 plus anti-CD86. At the given time points (in minutes) T cell:APC cell extracts were blotted for LAT phosphorylation at Y191. Blots were stripped and reblotted with an anti-alpha tubulin antibody as a loading control. Phospho-LAT Y191 band intensities as normalized to loading control are given under the phospho-LAT blots. Molecular weights of marker bands (in kD) are given at the right. One representative blot of eight is shown. (B) 5C.C7 T cells were activated with CH27 B cells and 10 µm MCC for the indicated times (in minutes) with the additional controls of stimulation with pervanadate (‘+’) and 5C.C7 T cell CH27 B cell interactions in the absence of MCC peptide (‘–‘). One representative blot of three is shown.
Figure 2—video 1
Representative interactions of 5C. C7 T cells retrovirally transduced to express the indicated GFP fusion proteins with CH27 B cell lymphoma APCs and 10 μM MCC peptide in the presence or absence of 10 µg/ml anti-CD80 plus anti-CD86 (‘costimulation blockade’) are shown in Figure 2—Video 1, Figure 4—Videos 1–3, Figure 7—Videos 1–3 and Figure 8—Video 1.
DIC images are shown on the top, with matching top-down, maximum projections of 3D sensor fluorescence data on the bottom. The sensor fluorescence intensity is displayed in a rainbow-like, false-color scale (increasing from blue to red). 20 s intervals in video acquisition are played back as two frames per second. The 5C.C7 T cell in Figure 2—Video 1 is transduced with LAT-GFP and responds to a full stimulus. Cell coupling occurs in frame 4 (2s indicated video time).
Figure 3 with 3 supplements
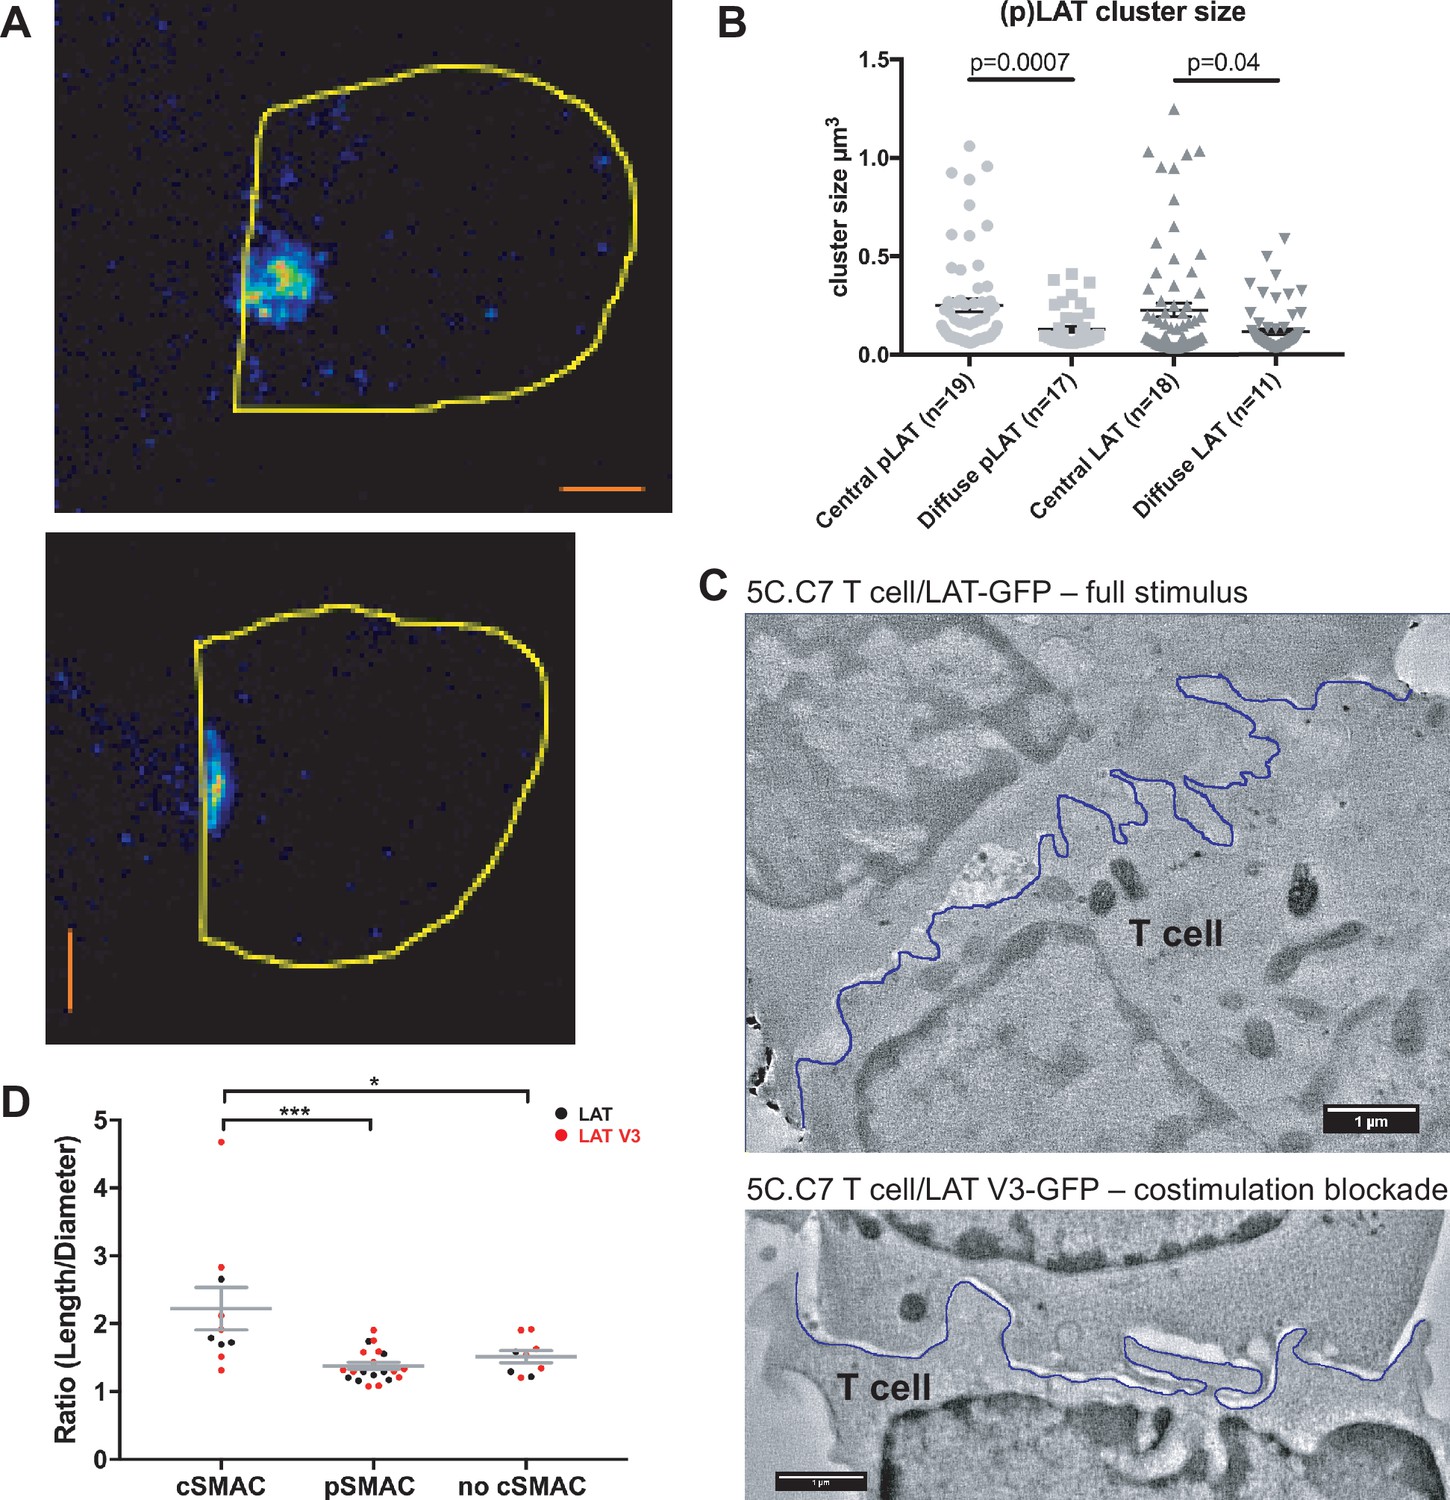
The cSMAC consists of multiple smaller complexes and is associated with extensive membrane undulations.
(A) Two representative STED midplane images are given of 5C.C7 T cells activated by CH27 APCs (10 µm MCC) for 4.5 min and stained with α-LAT pY191. Staining fluorescence intensity is given in rainbow-like false-color scale (increasing from blue to red). The T cell outline is given in yellow. The scale bars correspond to 1 µm. (B) For experiments as in A LAT and LAT pY191 cluster size is given separately for cell couples with central or diffuse LAT accumulation as indicated (number of cell couples analyzed in two independent experiments in parentheses). Statistical significance as determined separately for ‘LAT’ and ‘pLAT’ by Student’s test is indicated. (C) Midplane sections are given for two EM tomograms from a CLEM experiment. 5C.C7 T cells expressing LAT-GFP (top) or LAT V3-GFP (bottom)(see Figure 4B) were activated by CH27 APCs under full stimulus (top) or costimulation blocked (bottom) conditions, respectively. Upon formation of a cell couple with central LAT-GFP or LAT V3-GFP accumulation cell were fixed and processed for EM. The T cell plasma membrane at the cellular interface is traced in blue. Videos of the entire EM tomogram reconstructions are given as Figure 3—Videos 1 and 2. (D) In cell couples processed as in C membrane undulations were determined as the ratio of the length of the plasma membrane (‘length’) to a straight-line interface diameter of the same region (‘diameter) in single images of EM sections. In cell couples with central LAT-GFP (black symbols) or LAT V3-GFP (red symbols) accumulation the interface center (‘cSMAC’) and periphery (‘pSMAC’) were measured separately. Peripheral regions were measured twice per cell, once to the left and once to the right of the central region. In control cell couples without central LAT-GFP (black symbols) or LAT V3-GFP (red symbols) accumulation (‘no cSMAC’) the entire interface was analyzed. Cell couples are derived from two independent experiments per condition. Statistical significance as determined by 1-way ANOVA is indicated (*p<0.05, ***p<0.001).
Figure 3—figure supplement 1
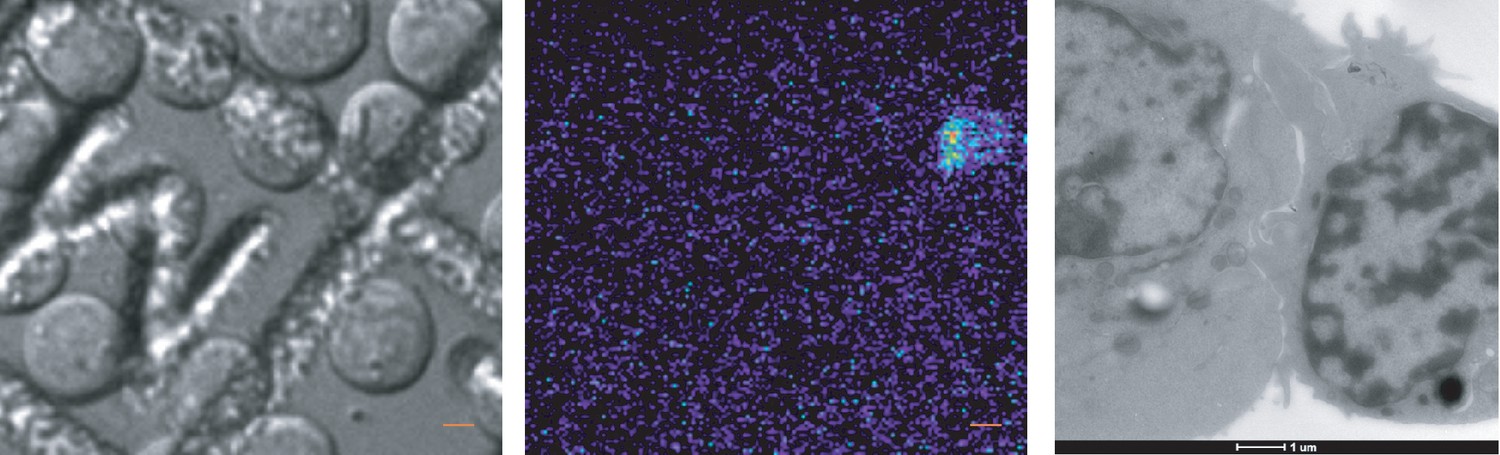
CLEM work flow.
Wild type 5C.C7 T cells expressing LAT-GFP were imaged upon activation with CH27 APCs and 10 µm MCC on a finder grid using DIC and spinning disk confocal fluorescence microscopy. The left and middle panels show one representative field with a cell couple on the top right. The orange scale bars correspond to 5 µm. Upon detection of central LAT accumulation the sample was immediately fixed and processed for electron microscopy. The corresponding thin section electron micrograph is shown on the right. The scale bar corresponds to 1 µm.
Figure 3—video 1
Representative EM tomograms are shown in Figure 3—Videos 1 and 2.
Reconstructed Z-sections are first shown without tracing and subsequently with the T cell and APC plasma membranes at the interface traced in blue and red, respectively. The 5C.C7 T cell in Figure 3—Video 1 is transduced with LAT-GFP and responds to a full stimulus. It displayed central LAT-GFP accumulation at the time of fixation.
Figure 3—video 2
The video is displayed similar to Figure 3—Video 1.
The 5C.C7 T cell in Figure 3—Video 2 is transduced with LAT V3-GFP and responds to a full stimulus upon costimulation blockade. It displayed central LAT-GFP accumulation at the time of fixation.
Figure 4 with 4 supplements
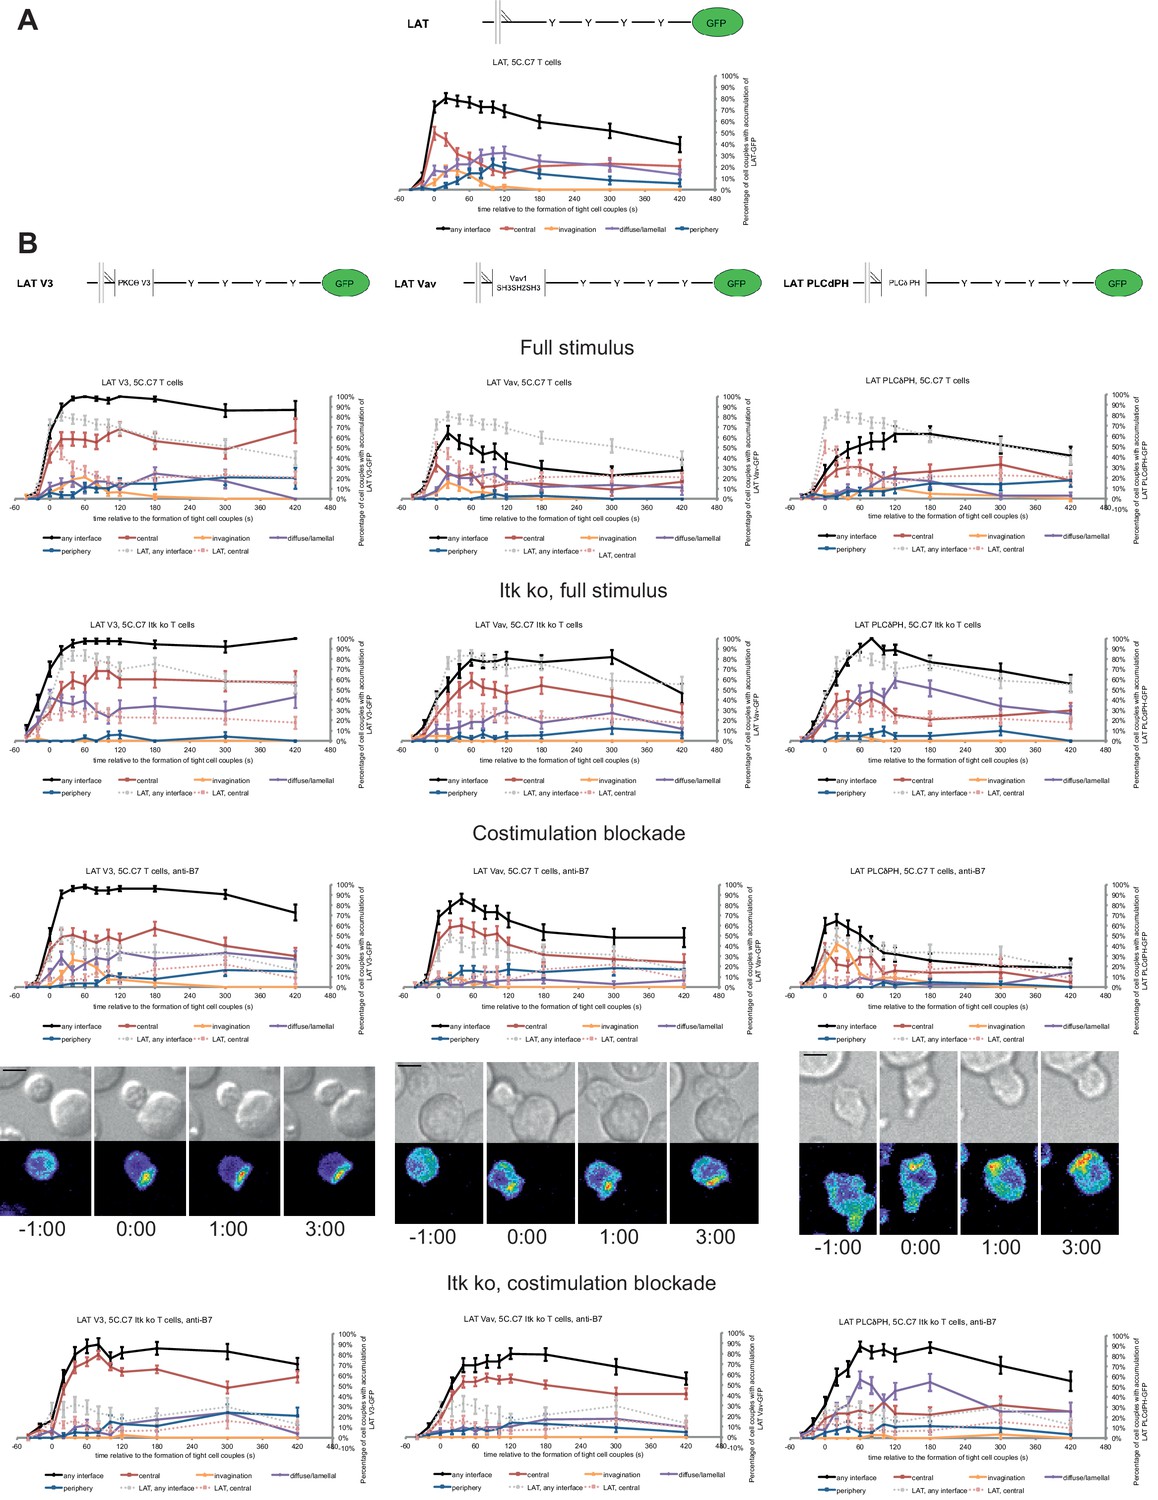
LAT localization can be controlled by fusion with protein domains with a strong interface localization preference.
(A) A schematic representation of LAT-GFP is given (top) with LAT accumulation data under full stimulus conditions (bottom, from Figure 2B) as a reference for the rest of the figure. (B) On top schematic representations are given for the three fusion proteins of LAT with protein localization domains as indicated. Corresponding imaging data are given in the respective columns below: wild type or Itk-deficient 5C.C7 T cells transduced to express the spatially targeted LAT construct indicated on the top of the column were activated with CH27 APCs (10 µM MCC) in the absence or presence of 10 µg/ml anti-CD80 plus anti-CD86 (‘costimulation blockade’) with different T cell activation conditions given in separate rows as indicated. Each individual graph gives the percentage of cell couples that displayed accumulation of the spatially targeted LAT construct with the indicated patterns as in Figure 2B relative to tight cell couple formation in solid colors. Broken gray and red lines indicate accumulation of non-targeted LAT-GFP in any or the central interface pattern, respectively, under the same T cell activation conditions (from Figure 2B) for reference. For costimulation blocked conditions representative imaging data are given similar to Figure 2A. Corresponding videos are available as Figure 4—Videos 1–3. 37–53 cell couples from 2 to 5 independent experiments were analyzed per condition, 551 total. Statistical analysis is given in Figure 4—source data 1.
-
Figure 4—source data 1
Statistical significance of differences in accumulation of spatially targeted as compared to non-targeted LAT under different T cell activation conditions is given for the indicated patterns as determined by proportion’s z-test.
No entry indicates p>0.05. 0.000 indicates p<0.0005. Gray scale is used to visualize the level of significance.
- https://doi.org/10.7554/eLife.45789.019
Figure 4—figure supplement 1
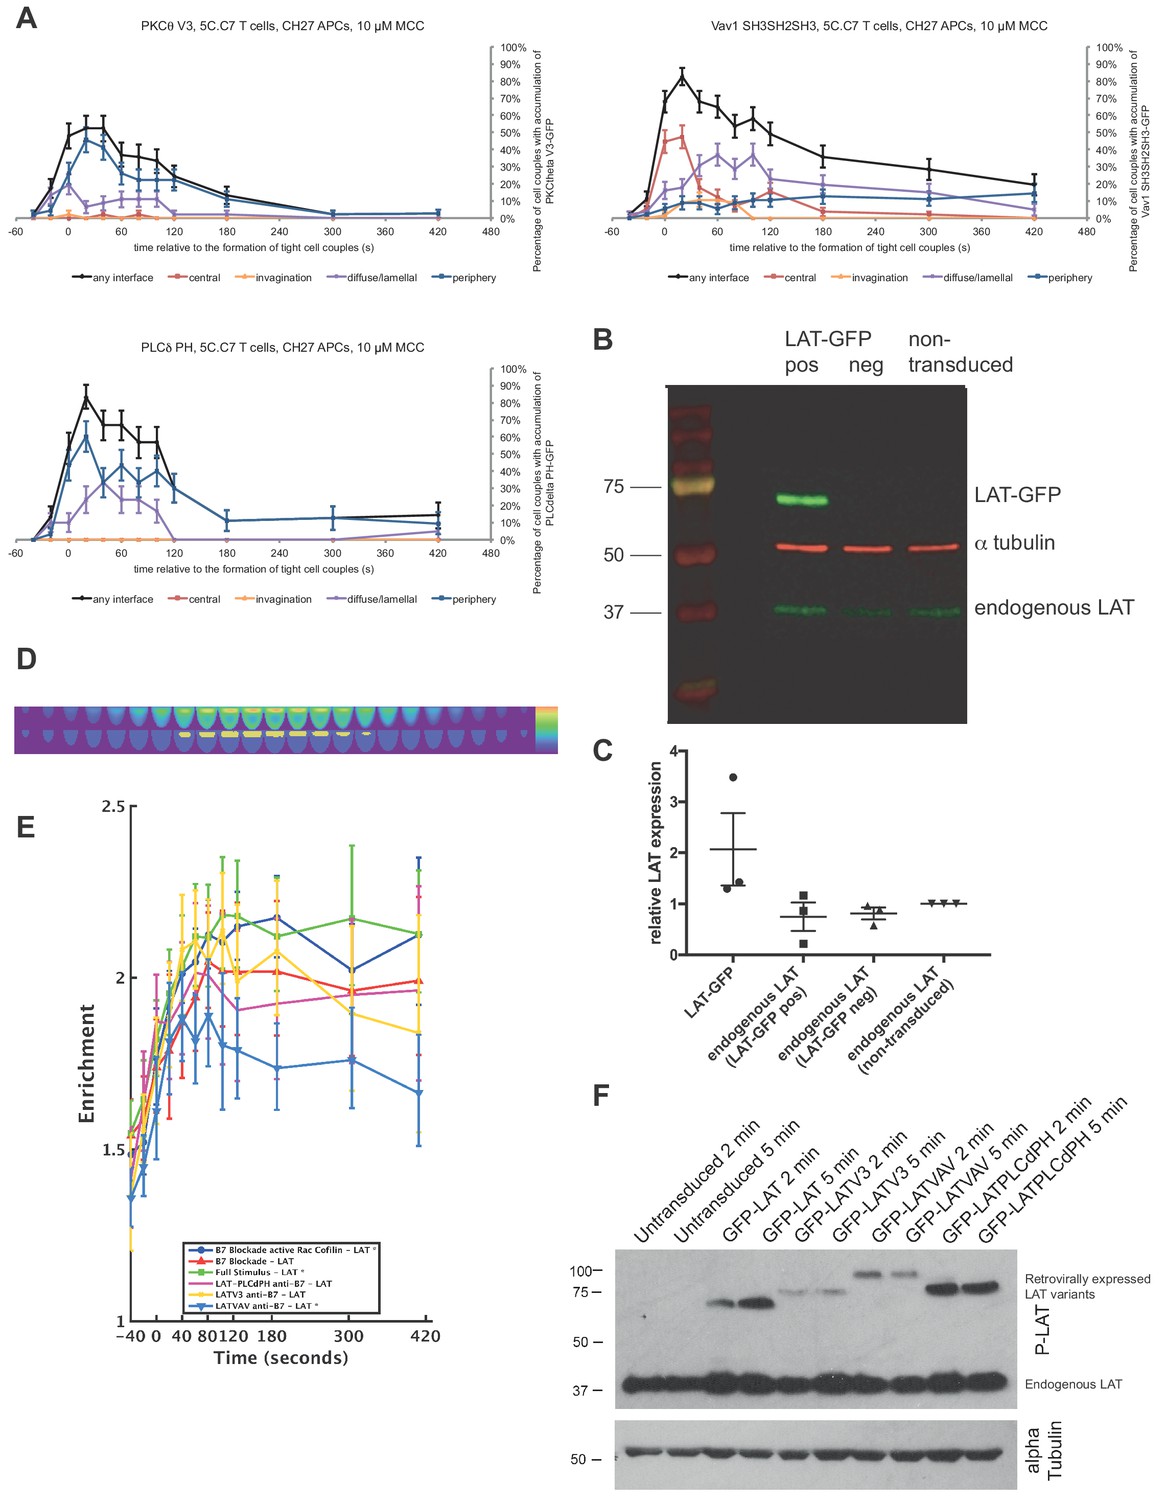
Patterning of isolated targeting domains and interface recruitment of LAT-GFP and spatially targeted version thereof.
(A) The graphs give the percentage of cell couples that displayed accumulation of the isolated targeting domains, LAT V3, LAT Vav, and LAT PLCδPH as indicated, with the indicated patterns as in Figure 2B relative to tight cell couple formation for wild type 5C.C7 T cells activated with CH27 B cell APCs (10 µM MCC peptide). 30–57 cell couples from 2 to 3 independent experiments were analyzed per condition, 133 total. (B) Wild type 5C.C7 T cells were transduced to express LAT-GFP and sorted for LAT-GFP positive (LAT-GFP pos) and LAT-GFP negative (LAT-GFP neg) T cells or left non-transduced. Cell extracts were blotted for LAT (green) and α tubulin (red) as a loading control. One representative blot of three is shown. (C) LAT band intensities were quantified and are shown relative to endogenous LAT in the non-transduced cells. The GFP intensity used to sort LAT-GFP-positive 5C.C7 T cells corresponds to 6*105 molecules per cell (Singleton et al., 2009). (D, E) For the quantification of the accumulation of LAT and targeted versions thereof at the T cell:APC interface we applied a computational image quantification as recently described in detail (Roybal et al., 2016). We identified a core region (B) of sensor enrichment as defined as the 10% most fluorescent voxels of the average probability distribution across all cells, for all time points, and for all sensors. Using this core region, we calculated the ratio of the amount of the sensor in the region to the average amount across the whole cell. This was done for all time points either under conditions of full stimulus or costimulation blockade as indicated. Imaging data analyzed are the same as in Figures 2 and 3. (F) Wild type 5C.C7 T cells retrovirally transduced to express the indicated LAT constructs were activated with CH27 B cell APCs and 10 µm MCC in the presence of 10 µg/ml anti-CD80 plus anti-CD86. At the given time points T cell:APC cell extracts were blotted for LAT phosphorylation at Y191. Blots were stripped and reblotted with an anti-alpha tubulin antibody as a loading control. One representative blot of two is shown.
Figure 4—video 1
The video is displayed similar to Figure 2—Video 1.
The 5C.C7 T cell in Figure 4—Video 1 is transduced with LAT V3-GFP and responds to a full stimulus upon costimulation blockade. Cell coupling occurs in frame 4 (2s indicated video time).
Figure 4—video 2
The video is displayed similar to Figure 2—Video 1.
The 5C.C7 T cell in Figure 4—Video 2 is transduced with LAT Vav-GFP and responds to a full stimulus upon costimulation blockade. Cell coupling occurs in frame 5 (2s indicated video time).
Figure 4—video 3
The video is displayed similar to Figure 2—Video 1.
The 5C.C7 T cell in Figure 4—Video 3 is transduced with LAT PLCδ PH-GFP and responds to a full stimulus upon costimulation blockade. Cell coupling occurs in frame 5 (2s indicated video time).
Figure 5 with 1 supplement
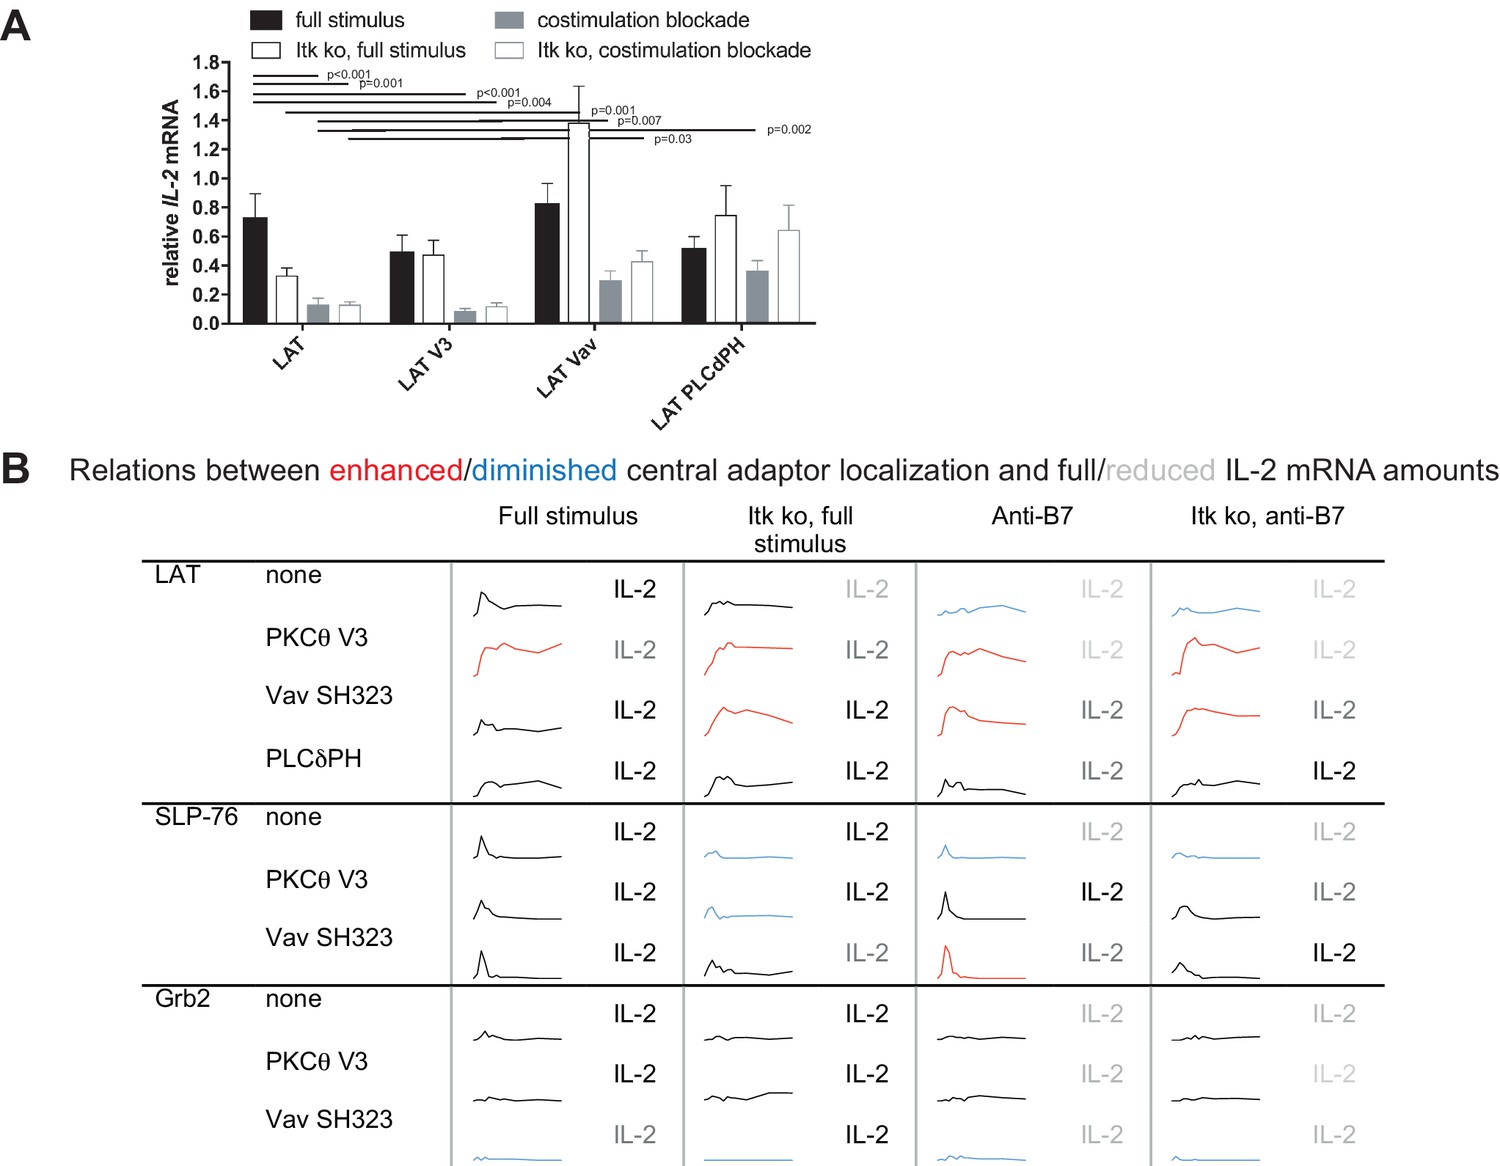
Restoration of LAT centrality enhances IL-2 mRNA generation.
(A) Wild type or Itk-deficient (‘Itk ko’) 5C.C7 T cells expressing LAT-GFP or a spatially targeted variant thereof as indicated were activated by CH27 APCs (10 µM MCC) in the absence or presence of 10 µg/ml anti-CD80 plus anti-CD86 (‘costimulation blockade’). IL-2 mRNA amounts are given relative to IL-2 mRNA in non-transduced 5C.C7 T cells under full stimulus conditions. 3–9 experiments were averaged per condition. Statistical significance of differences as determined by 2-way ANOVA is given for comparisons of interest. (B) Sensor accumulation at the interface center and IL-2 mRNA amounts are summarized. Traces are the percentage cell couples with central accumulation from Figures 4, 7 and 8. Red indicates enhanced central accumulation relative to non-targeted signaling intermediate under full stimulus conditions at at least half of the time points with substantial central accumulation, blue similarly indicates diminished central accumulation. Four shades of gray indicated level of IL-2 mRNA relative to non-targeted signaling intermediate under full stimulus conditions > 75%, 50–75%, 25–50% and <25%.
Figure 5—figure supplement 1
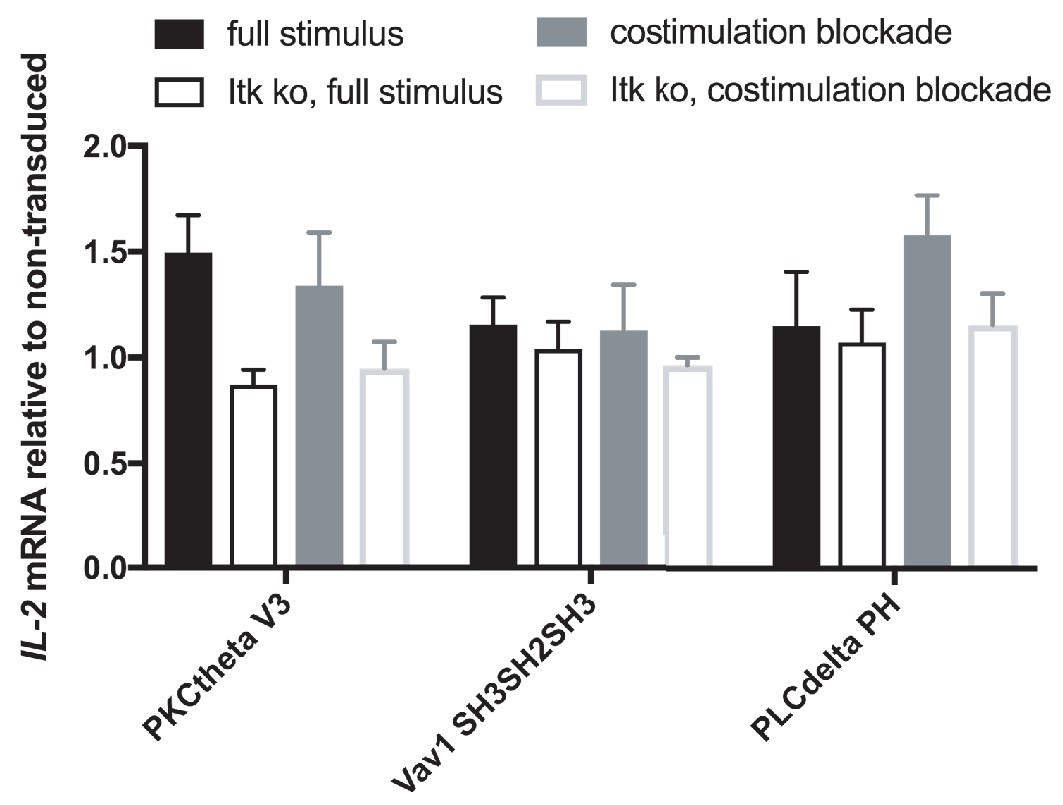
IL2 mRNA amounts upon expression of the isolated targeting domains.
Wild type or Itk-deficient (‘Itk ko’) 5C.C7 T cells were transduced to express the isolated targeting domains, LAT V3, LAT Vav, and LAT PLCδPH as indicated, and reactivated by CH27 APCs (10 µM MCC peptide) in the absence or presence of 10 µg/ml anti-CD80 plus anti-CD86 (‘costimulation blockade’). IL-2 mRNA amounts are given relative to IL-2 mRNA in non-transduced 5C.C7 T cells under full stimulus conditions. 3–6 experiments were averaged per condition. None of the differences were significant as calculated with 2-way ANOVA.
Figure 6
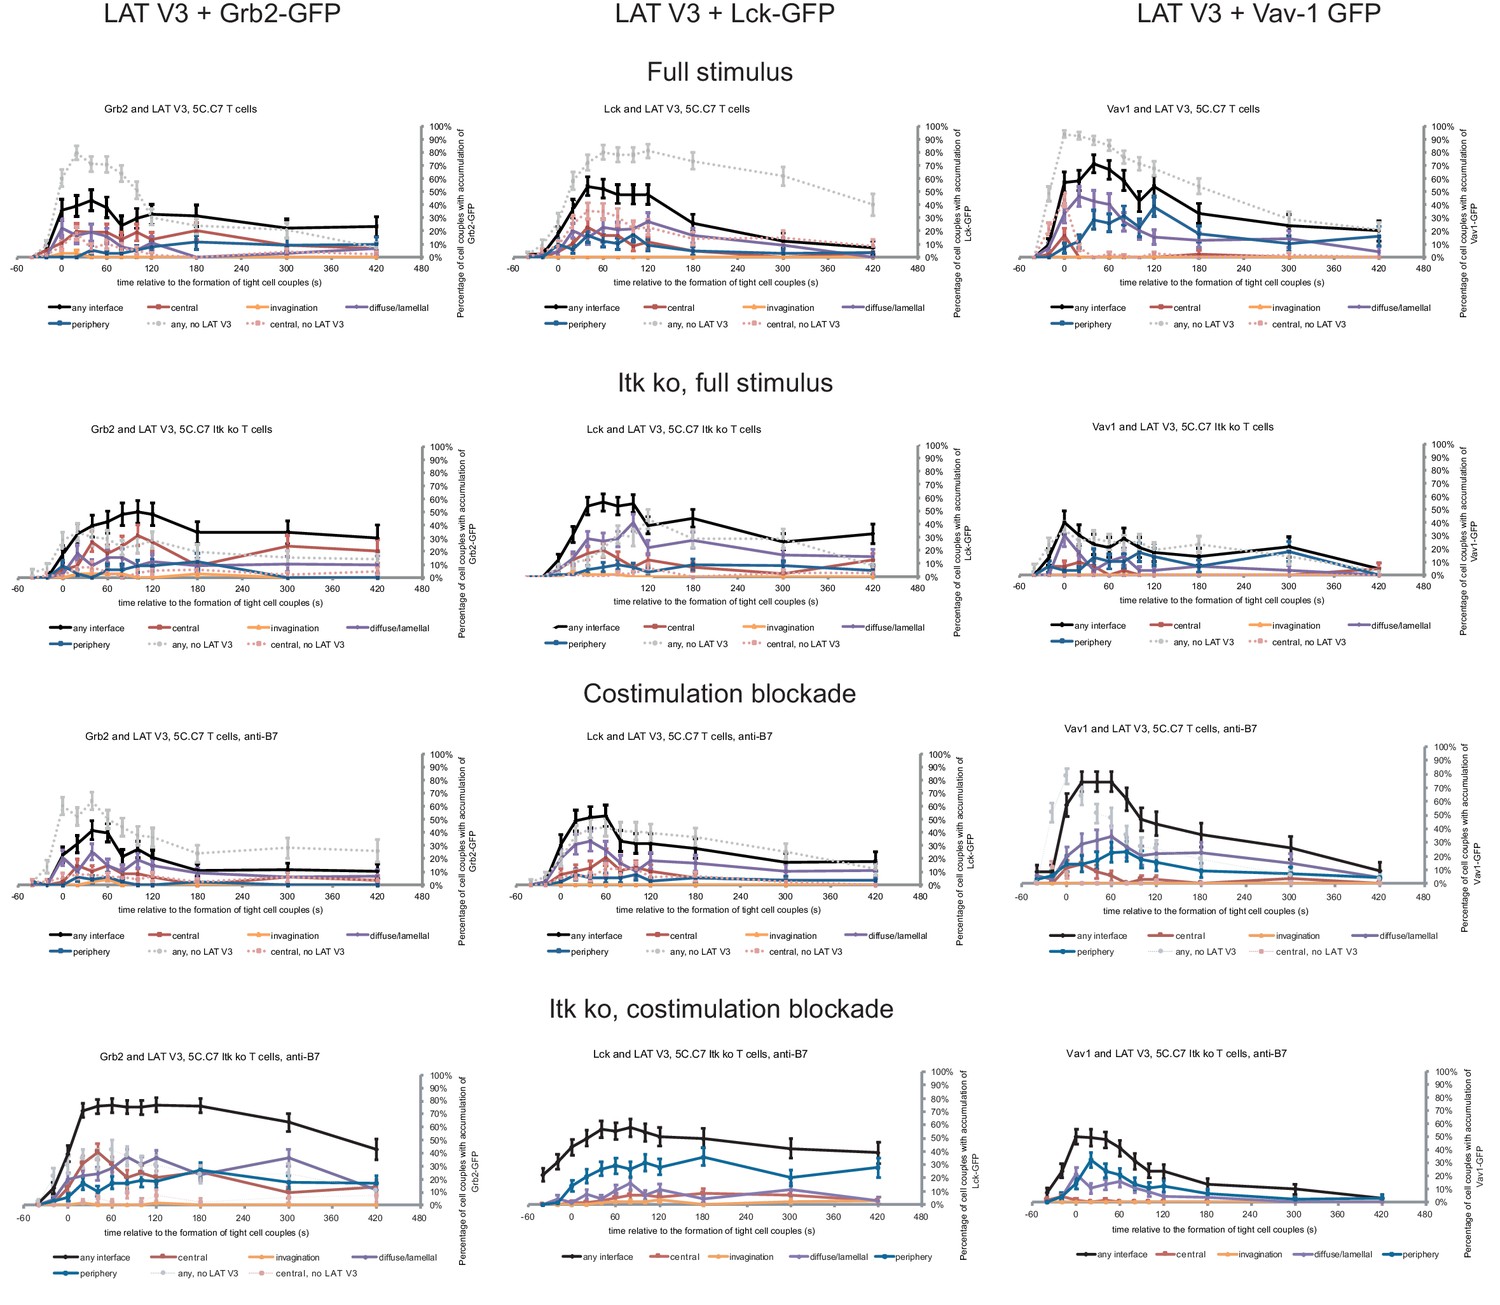
Restoration of LAT centrality only modestly affects centrality of other signaling intermediates.
Wild type and Itk-deficient 5C.C7 T cells were transduced to express LAT V3 together with the indicated GFP-tagged signaling intermediate and activated with CH27 APCs (10 µM MCC) in the absence or presence of 10 µg/ml anti-CD80 plus anti-CD86 (‘costimulation blockade’) with different T cell activation conditions given in separate rows as indicated. Each individual graph gives the percentage of cell couples that displayed accumulation of the GFP-tagged signaling intermediate with the indicated patterns as in Figure 2B relative to tight cell couple formation in solid colors. Broken gray and red lines indicate accumulation of the signaling intermediate in the absence of LAT V3 in any or the central interface pattern, respectively, under the same T cell activation conditions (from Figure 8; Figure 1—figure supplements 2B–4). 30–72 cell couples from 2 to 5 independent experiments were analyzed per condition, 582 total. Statistical analysis is given in Figure 6—source data 1.
-
Figure 6—source data 1
Statistical significance of differences in accumulation of Grb2, Lck and Vav1 in the presence as compared to absence of LATV3 under different T cell activation conditions is given for the indicated patterns as determined by proportion’s z-test.
No entry indicates p>0.05. 0.000 indicates p<0.0005. Gray scale is used to visualize the level of significance.
- https://doi.org/10.7554/eLife.45789.026
Figure 7 with 3 supplements
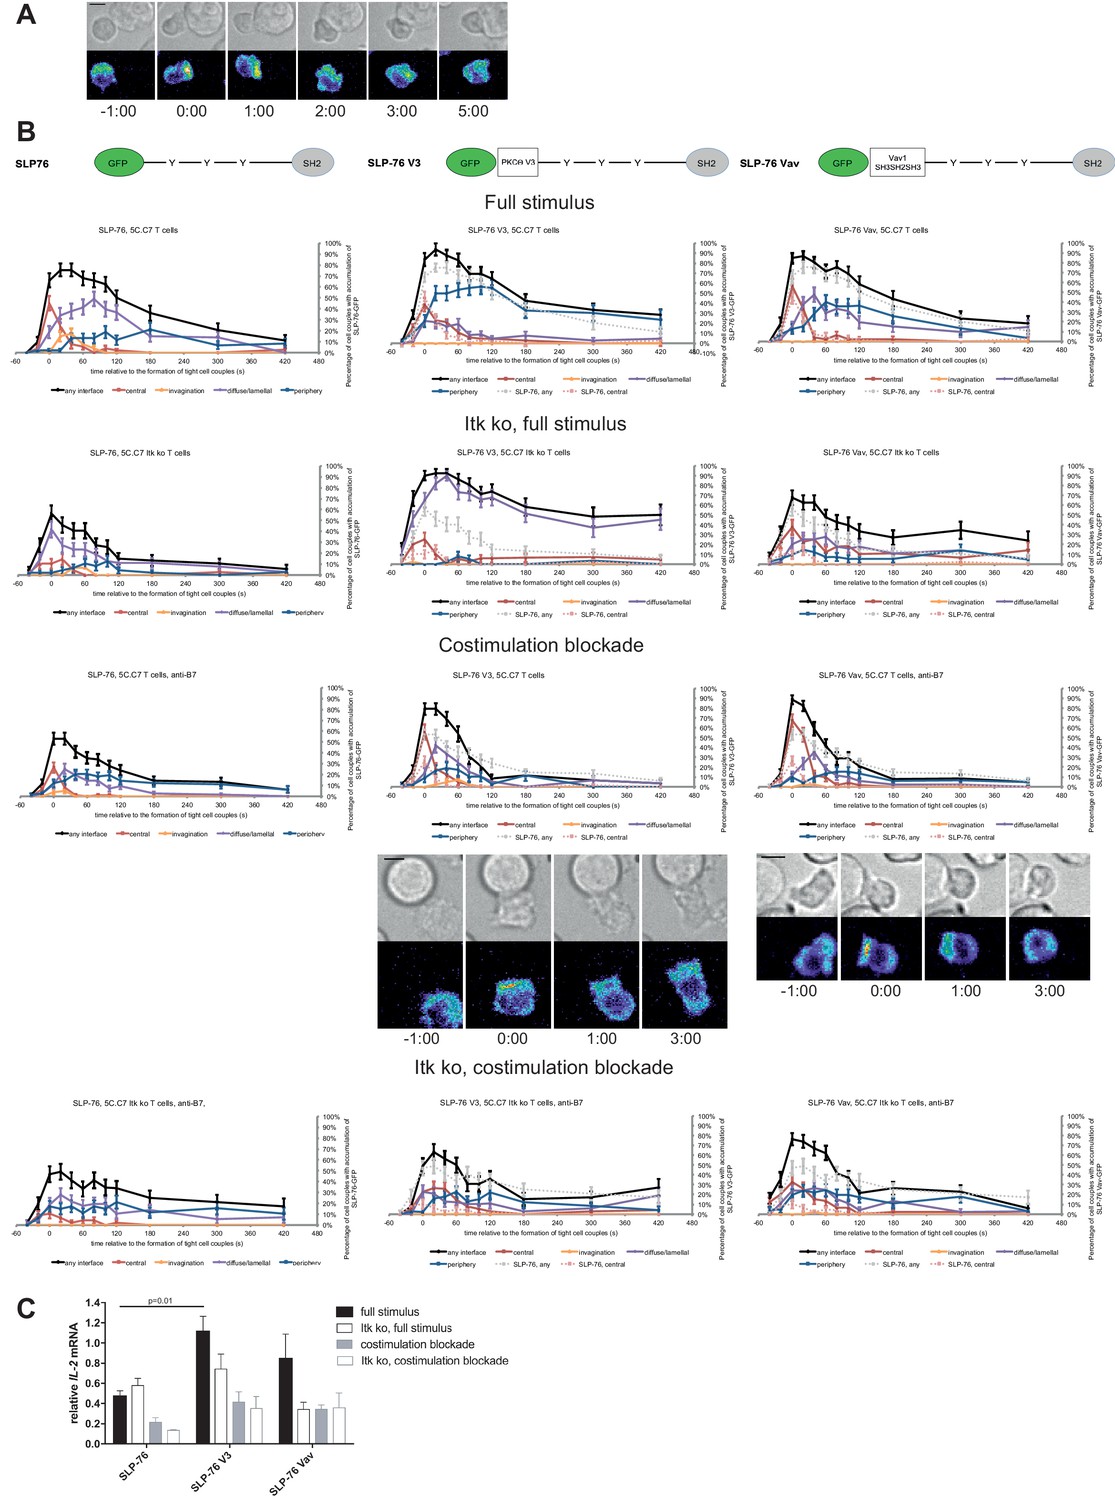
SLP-76 localization is regulated by costimulation and Itk and restoration of early SLP-76 centrality enhances IL-2 mRNA generation.
(A) An interaction of a SLP-76-GFP-transduced 5C.C7 T cell with a CH27 APC (10 μM MCC) is shown at the indicated time points (in minutes) relative to the time of formation of a tight cell couple as in Figure 2A. A corresponding video is available as Figure 7—Video 1. (B) On top schematic representations are given for SLP-76-GFP and the two fusion proteins of SLP-76 with protein domains as indicated. Corresponding imaging data are given in the respective columns below: wild type or Itk-deficient 5C.C7 T cells transduced to express SLP-76 or the spatially targeted SLP-76 construct indicated on the top of the column were activated with CH27 B cell APCs (10 µM MCC) in the absence or presence of 10 µg/ml anti-CD80 plus anti-CD86 (‘costimulation blockade’) with different T cell activation conditions given in separate rows as indicated. Graphs give the percentage of cell couples that displayed accumulation of the non-targeted (on the left) or spatially targeted SLP-76 construct (middle and right) with the indicated patterns as in Figure 2B relative to tight cell couple formation in solid colors. Broken gray and red lines indicate accumulation of non-targeted SLP-76-GFP in any or the central interface pattern, respectively, under the same T cell activation conditions. For costimulation blocked conditions representative imaging data are given below the graphs similar to Figure 2A. Corresponding videos are available as Figure 7—Videos 2 and 3. 39–83 cell couples from 2 to 5 independent experiments were analyzed per condition, 586 total. Statistical analysis is given in Figure 7—source data 1. (C) Wild type or Itk-deficient (‘Itk ko’) 5C.C7 T cells expressing SLP-76-GFP or a spatially targeted variant thereof as indicated were activated by CH27 APCs (10 µM MCC) in the absence or presence of 10 µg/ml anti-CD80 plus anti-CD86 (‘costimulation blockade’). IL-2 mRNA amounts are given relative to IL-2 mRNA in non-transduced 5C.C7 T cells under full stimulus conditions. 2–8 experiments were averaged per condition. Statistical significance of differences as determined by 2-way ANOVA is given for a comparison of interest.
-
Figure 7—source data 1
Statistical significance of differences in SLP-76 accumulation and in accumulation of spatially targeted compared to non-targeted SLP-76 under different T cell activation conditions is given for the indicated patterns as determined by proportion’s z-test.
No entry indicates p>0.05. 0.000 indicates p<0.0005. Gray scale is used to visualize the level of significance.
- https://doi.org/10.7554/eLife.45789.028
Figure 7—video 1
The video is displayed similar to Figure 2—Video 1.
The 5C.C7 T cell in Figure 7—Video 1 is transduced with SLP-76-GFP and responds to a full stimulus. Cell coupling occurs in frame 4 (2s indicated video time).
Figure 7—video 2
The video is displayed similar to Figure 2—Video 1.
The 5C.C7 T cell in Figure 7—Video 2 is transduced with SLP-76 V3-GFP and responds to a full stimulus upon costimulation blockade. Cell coupling occurs in frame 4 (2s indicated video time).
Figure 7—video 3
The video is displayed similar to Figure 2—Video 1.
The 5C.C7 T cell in Figure 7—Video 3 is transduced with SLP-76 Vav-GFP and responds to a full stimulus upon costimulation blockade. Cell coupling occurs in frame 5 (2s indicated video time).
Figure 8 with 3 supplements
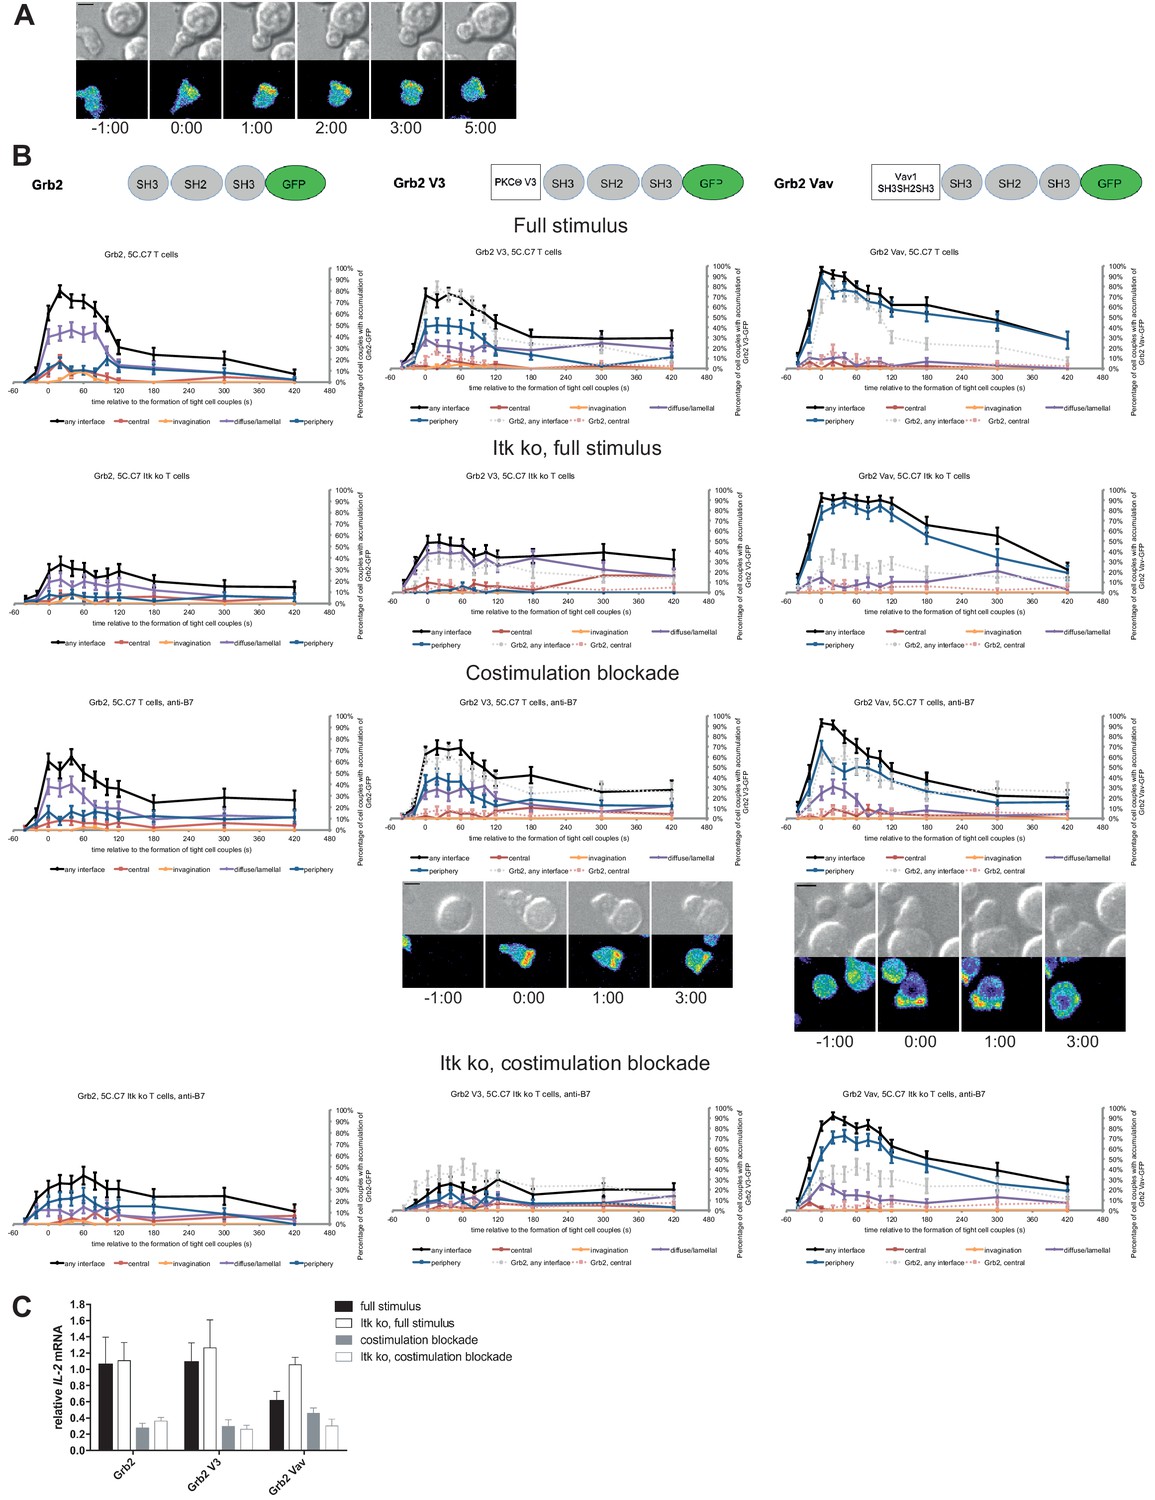
Grb2 localization is regulated by costimulation and Itk and doesn’t regulate IL-2 mRNA generation.
(A) An interaction of a Grb2-GFP-transduced 5C.C7 T cell with a CH27 APC (10 μM MCC) is shown at the indicated time points (in minutes) relative to the time of formation of a tight cell couple as in Figure 2A. A corresponding video is available as Figure 8—Video 1. (B) On top schematic representations are given for Grb2-GFP and the two fusion proteins of Grb2 with protein domains as indicated. Corresponding imaging data are given in the respective columns below: wild type or Itk-deficient 5C.C7 T cells transduced to express the spatially targeted Grb2 construct indicated on the top of the column were activated with CH27 APCs (10 µM MCC) in the absence or presence of 10 µg/ml anti-CD80 plus anti-CD86 (‘costimulation blockade’) with different T cell activation conditions given in separate rows as indicated. Graphs give the percentage of cell couples that displayed accumulation of the non-targeted (on the left for reference) or spatially targeted Grb2 construct (middle and right) with the indicated patterns as in Figure 2B relative to tight cell couple formation in solid colors. Broken gray and red lines indicate accumulation of non-targeted Grb2-GFP in any or the central interface pattern, respectively, under the same T cell activation conditions. For costimulation blocked conditions representative imaging data are given below the graphs similar to Figure 2A. Corresponding videos are available as Figure 8—Videos 2 and 3. 41–62 cell couples from 2 to 5 independent experiments were analyzed per condition, 591 total. Statistical analysis is given in Figure 8—source data 1. (C) Wild type or Itk-deficient (‘Itk ko’) 5C.C7 T cells expressing Grb2-GFP or a spatially targeted variant thereof as indicated were activated by CH27 APCs (10 µM MCC) in the absence or presence of 10 µg/ml anti-CD80 plus anti-CD86 (‘costimulation blockade’). IL-2 mRNA amounts are given relative to IL-2 mRNA in non-transduced 5C.C7 T cells under full stimulus conditions. 2–5 experiments were averaged per condition.
-
Figure 8—source data 1
Statistical significance of differences in Grb2 accumulation and in accumulation of spatially targeted as compared to non-targeted Grb2 under different T cell activation conditions is given for the indicated patterns as determined by proportion’s z-test.
No entry indicates p>0.05. 0.000 indicates p<0.0005. Gray scale is used to visualize the level of significance.
- https://doi.org/10.7554/eLife.45789.033
Figure 8—video 1
The video is displayed similar to Figure 2—Video 1.
The 5C.C7 T cell in Figure 8—Video 1 is transduced with Grb2-GFP and responds to a full stimulus. Cell coupling occurs in frame 5 (2s indicated video time).
Figure 8—video 2
The video is displayed similar to Figure 2—Video 1.
The 5C.C7 T cell in Figure 8—Video 2 is transduced with Grb2 V3-GFP and responds to a full stimulus upon costimulation blockade. Cell coupling occurs in frame 4 (2s indicated video time).
Figure 8—video 3
The video is displayed similar to Figure 2—Video 1.
The 5C.C7 T cell in Figure 8—Video 3 is transduced with Grb2 Vav-GFP and responds to a full stimulus upon costimulation blockade. Cell coupling occurs in frame 5 (2s indicated video time). A second T cell activates at the left edge of the filed in frame 7 (3s indicated video time).
Author response image 1
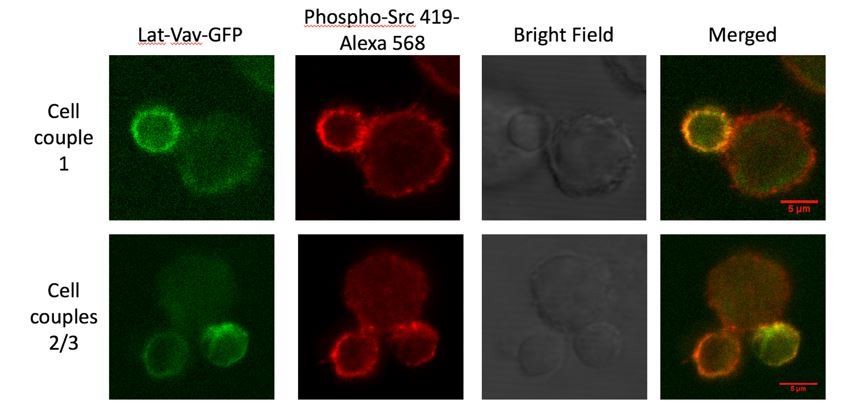
Representative anti-phospho Src staining experiment.
Given are 3 5C.C7/LAT-Vav-GFP T cell CH27 B cell APC couples after one minute of interaction under full stimulus conditions as fixed and stained with anti-phospho Src 419-Alexa 568 and imaged by confocal microscopy. Limiting LAT-Vav-GFP fluorescence and lack of central phospho Src kinase family staining are evident.
Author response image 2
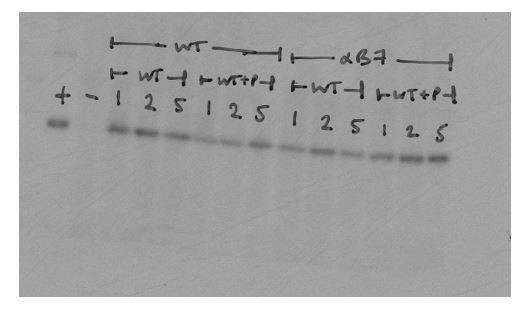
anti-phospho LAT Western blot with no peptide control.
5C.C7 T cells were activated with CH27 B cell APCs for the indicated time in minutes under full stimulus (‘wt’) and costimulation blocked (‘αB7’) conditions, lysed and blotted with an anti-LAT pY191 antibody. T cells were treated with pervanadate as a positive control (‘+’) and activated with CH27 B cell APCs in the absence of MCC agonist peptide as a negative control (‘–‘). The ‘WT+P’ conditions include treatment of T cells with a protein transduction reagent and have not been further pursued as part of this manuscript.
Tables
Key resources table
| Reagent type (species) or resource | Designation | Source or reference | Identifiers | Additional information |
|---|---|---|---|---|
| Genetic reagent (M. musculus) | 5C.C7 TCR transgenic | Davis lab, Stanford (Seder et al., 1992) | RRID:MGI:3799371 | |
| Genetic reagent (M. musculus) | 5C.C7 TCR transgenic, Itk ko | This paper | generated by crossing 5C.C7 TCR transgenic with Itk-deficient B6 mice (Schaeffer et al., 1999) (RRID:MGI:4356470). | |
| Cell line (Mus musculus) | CH27 | Davis lab, Stanford | RRID:CVCL_7178 | |
| Cell line (Homo sapiens) | Phoenix E | Nolan lab, Stanford | RRID:SCR_003163 | |
| Antibody | Anti - LAT pY191 (Rabbit polyclonal) | Cell Signaling | Cat#3584, RRID:AB_2157728 | WB (1:1000), Immunostaining (1:100) |
| Antibody | Anti-LAT (Rabbit polyclonal) | Cell Signaling | Cat#9166, RRID:AB_2283298 | WB (1:1000), Immunostaining (1:50) |
| Antibody | Anti-rabbit IgG, Alexa Fluor 488 (Donkey polyclonal) | Molecular Probes | Cat#R37118, 1:1000, RRID:AB_2556546 | Immunostaining (1:1000) |
| Antibody | Anti - GAPDH Clone 14C10 (Rabbit monoclonal) | Cell Signaling | Cat#2118, RRID:AB_561053 | WB (1:1000) |
| Antibody | Anti- alpha Tubulin Clone DM1A (Mouse monoclonal) | Thermo Fisher Scientific | Cat#62204, RRID:AB_1965960 | WB (1:1000) |
| Antibody | Anti – CD80 Clone16–10-A1 (Armenian Hamster monoclonal) | BD Pharmingen | Cat#553736 | Blocking at 10 µg/ml |
| Antibody | Anti – CD86 Clone GL1 (Rat monoclonal) | BD Pharmingen | Cat#553689 | Blocking at 10 µg/ml |
| Peptide, recombinant protein | MCC | Davis lab, Stanford | Sequence: ANERADLIAYLKQATK | |
| Commercial assay or kit | RNeasy Micro Kit | Qiagen | Cat#74004 | |
| Commercial assay or kit | AMV First-Strand cDNA synthesis kit | Invitrogen | Cat#12328032 | |
| Commercial assay or kit | SYBR Green PCR master mix | Life Technologies | Cat#4344463 | |
| Commercial assay or kit | IL-2 OptEIA ELISA | BD Biosciences | Cat#555148 | |
| Sequence-based reagent | qPCR Oligonucleotides, IL-2 | This paper | AGCTGTTGATGGACCTA and CGCAGAGGT CCAAGTTCAT | |
| Software, algorithm | Metamorph image analysis software | Molecular Devices | RRID:SCR_002368 | |
| Software, algorithm | Amira image analysis software | VSG | RRID:SCR_007353 |
Additional files
-
Transparent reporting form
- https://doi.org/10.7554/eLife.45789.037
Download links
A two-part list of links to download the article, or parts of the article, in various formats.
Downloads (link to download the article as PDF)
Open citations (links to open the citations from this article in various online reference manager services)
Cite this article (links to download the citations from this article in formats compatible with various reference manager tools)
Transient protein accumulation at the center of the T cell antigen-presenting cell interface drives efficient IL-2 secretion
eLife 8:e45789.
https://doi.org/10.7554/eLife.45789


