Gain-of-function mutations in the UNC-2/CaV2α channel lead to excitation-dominant synaptic transmission in Caenorhabditis elegans
- University of Massachusetts Medical School, United States
- Mount Sinai Hospital, Canada
- The Rockefeller University, United States
- University of Toronto, Canada
Figures
Figure 1
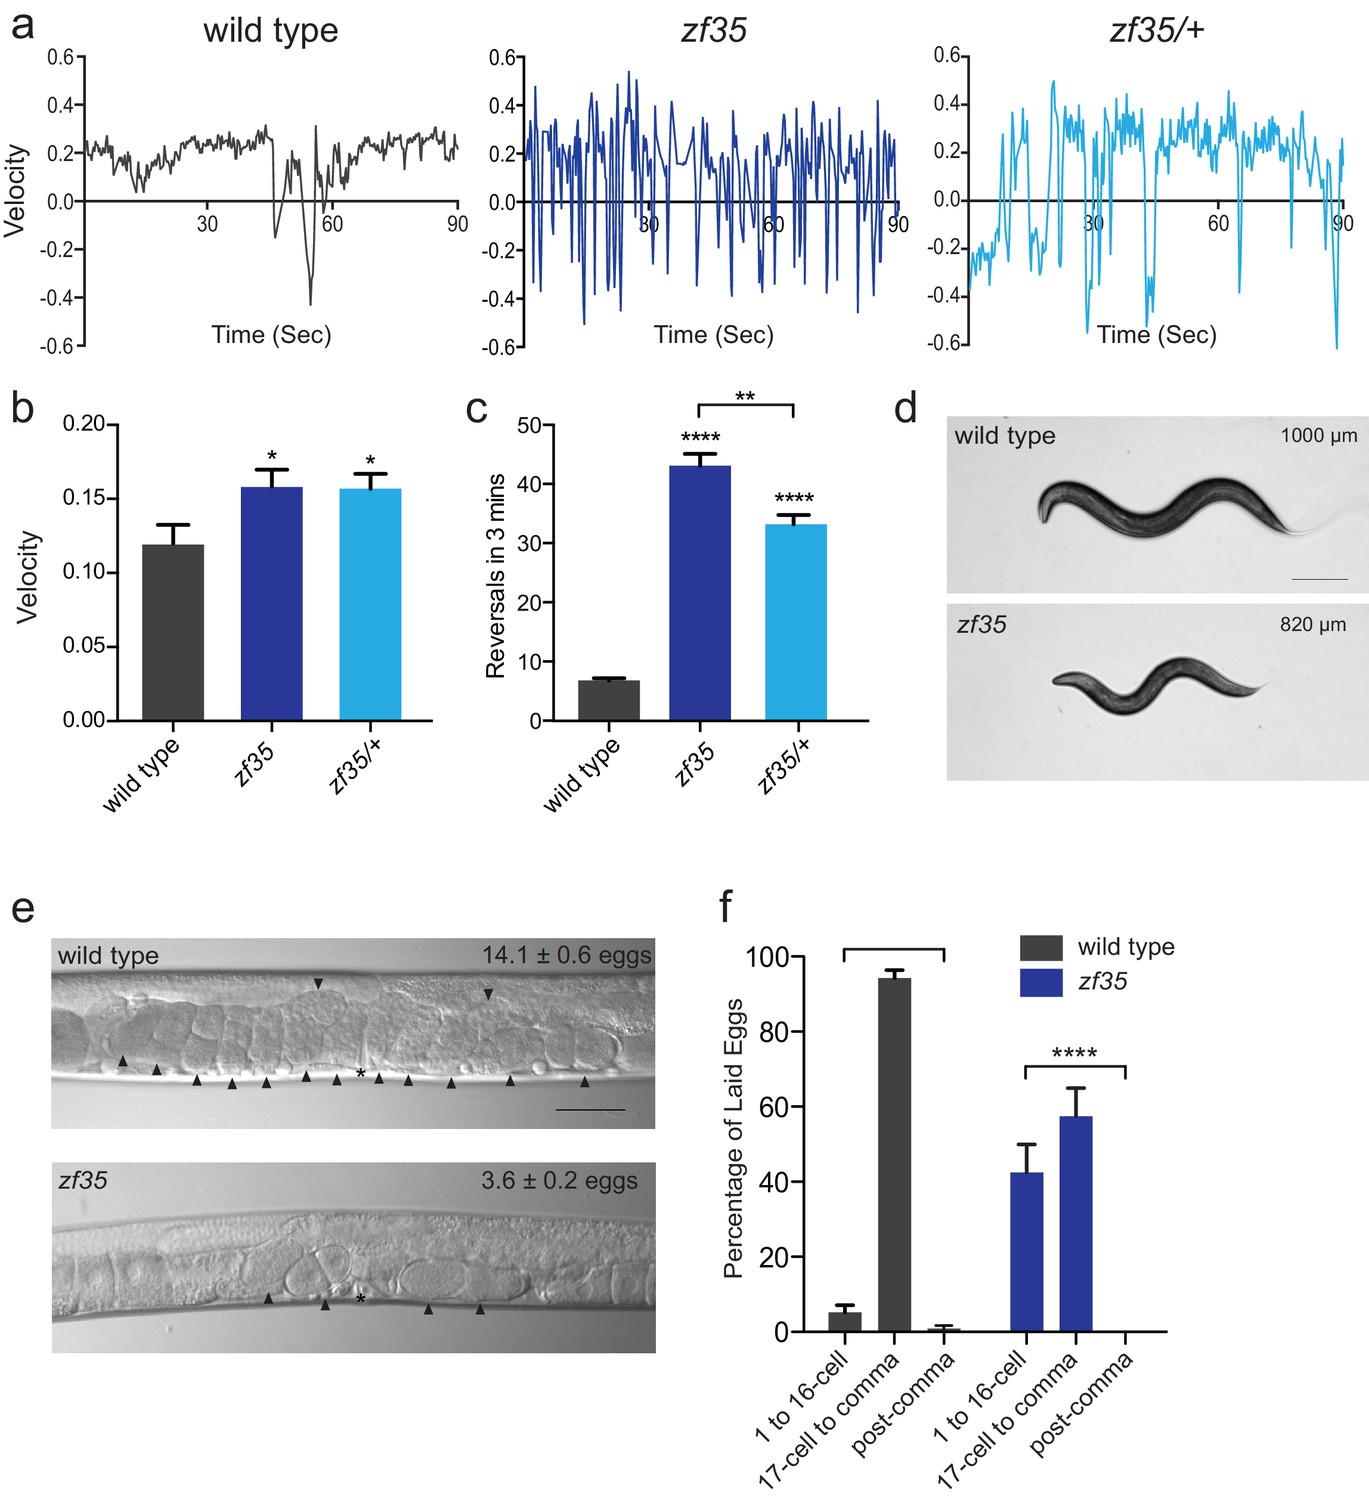
zf35 animals are hyperactive in both locomotion and egg-laying behaviors.
(a) Representative traces from single worm tracking showing instantaneous velocity of indicated genotypes on OP50 thin lawn plates (see Materials and methods). Positive and negative values indicate forward and backward locomotion, respectively. Transition from positive to negative values indicates reversal events. (b) Shown is the average velocity for the wild-type (0.118 ± 0.01 worm lengths/s, n = 9), zf35 (0.156 ± 0.01 worm lengths/sec, n = 10), zf35 /+ (0.155 ± 0.01 worm lengths/s, n = 10) animals (c) Quantification of the reversal frequency in 3 min on regular OP50 plates: average reversal numbers made by wild type (6.8 ± 0.4 reversals, n = 59), zf35 (43.1 ± 2.0 reversals, n = 59) and zf35/+ (33.2 ± 1.6 reversals, n = 23). Error bars represent SEM for at least three trials. Statistical difference from wild type *p<0.05, ****p<0.0001, one-way ANOVA with Dunnett’s multiple comparisons test. Statistical difference between zf35 and zf35/+ **p<0.01, unpaired t-test. (d) Representative images of wild type and zf35 animals. Average of midline lengths of the wild type: 1.00 ± 0.04 mm, n = 88 and zf35: 0.82 ± 0.03 mm, n = 75. Scale bar is 200 µm. (e) Representative Nomarski images of unlaid eggs in adult wild-type and zf35 animals. Arrowheads indicate eggs; asterisk denotes the position of the vulva. The average numbers of eggs in the uterus: wild type (14.1 ± 0.6 eggs, n = 80), zf35 (3.6 ± 0.2 egg, n = 86) animals. Scale bar, 50 µm. (f) Embryonic stages of freshly laid eggs of the wild type and zf35 mutants. 43% of the laid eggs from zf35 animals are at 1–16 cell stage, while only 5% from the wild type laid eggs are at 1–16 cell stage. Five independent trials with 75 animals for each genotype. Statistical difference from wild type ****p<0.0001, Chi-squared test.
-
Figure 1—source data 1
Source data for Figure 1.
- https://doi.org/10.7554/eLife.45905.003
Figure 2 with 1 supplement
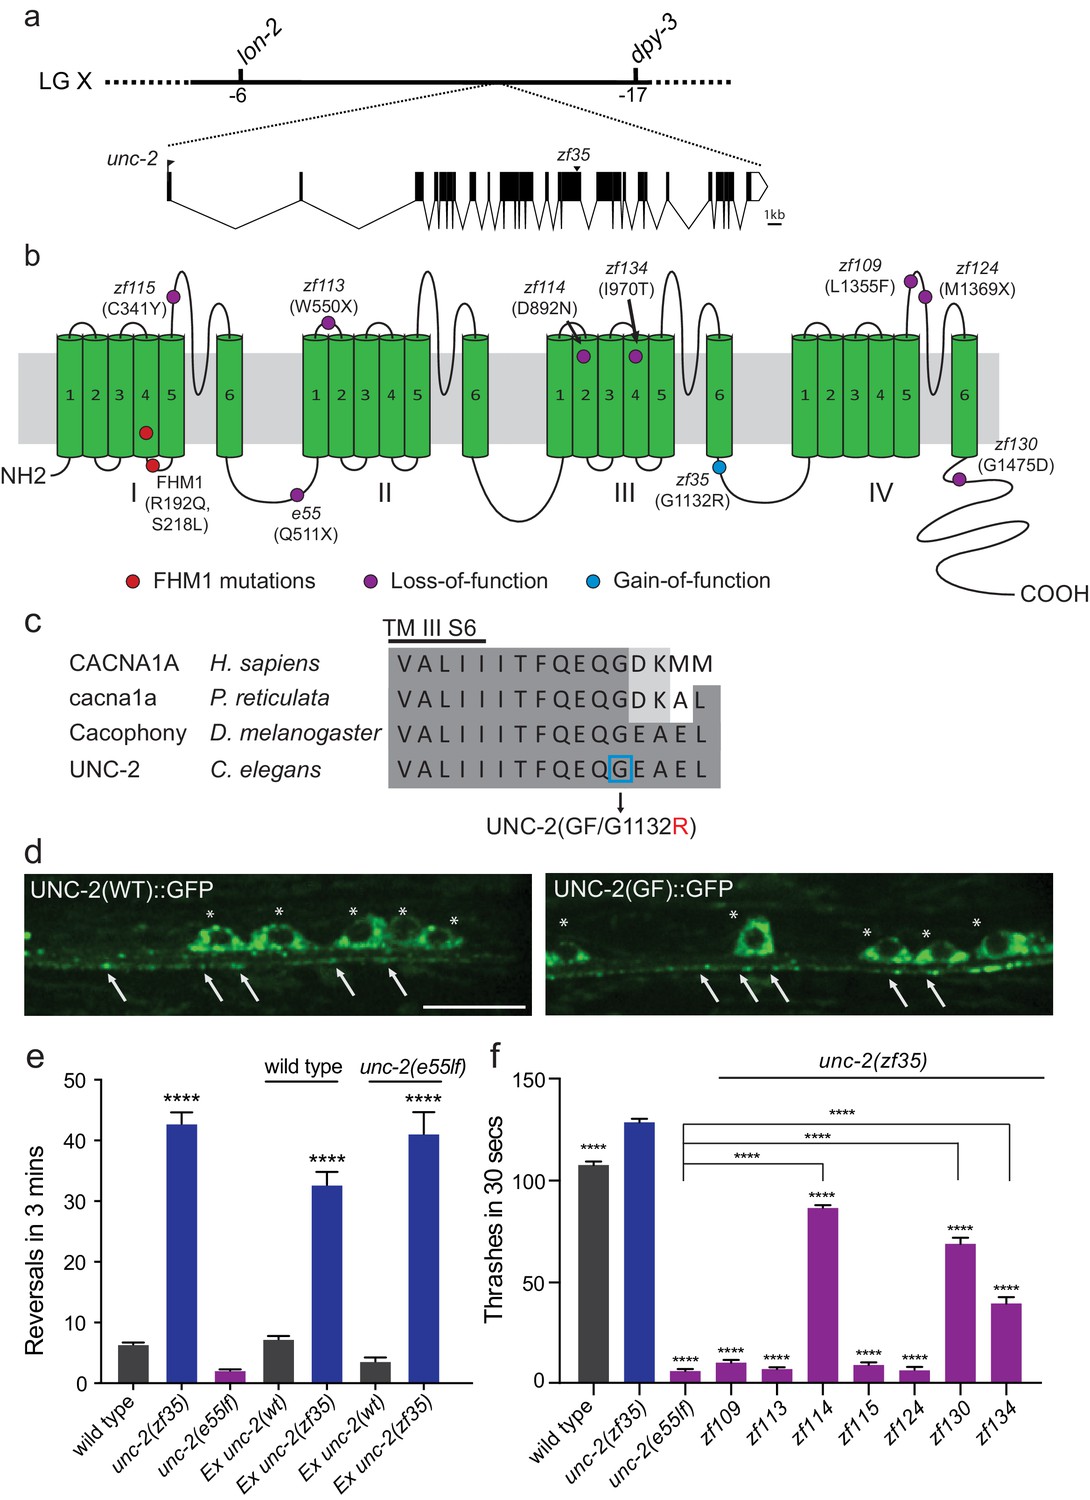
zf35 is a novel allele of the CaV2α subunit gene unc-2.
(a) The genetic map and gene structure of unc-2. Coding sequences are represented as black boxes. The zf35 allele is a single nucleotide transition (GGA to AGA) resulting in a glycine to arginine (G to R) amino acid substitution at position 1132. (b) Diagram of the secondary structure of UNC-2/CaV2α. UNC-2/CaV2α consists of four domains (I–IV) each containing six alpha-helix transmembrane (TM) segments (S1 – S6). The UNC-2 (G1132R) mutation localizes in the intracellular loop between TM domain III and IV, indicated by the blue circle. Purple circles indicate positions of intragenic unc-2(zf35) suppressors, red circles indicate the location of human FHM1 mutations. (c) The G1132R mutation occurs in a highly conserved region of the CaV2α subunit. Amino acid alignment of C-terminus region of the transmembrane III alpha-helix segment 6 (III S6) and the beginning of the third intracellular loop of CaV2α subunits from human (Homo sapiens, CACNA1A), rainbow fish (Poecilia reticulata, cacna1a), fly (Drosophila melanogaster, Cacophony) and nematode (C. elegans. UNC-2). Identities are shaded in dark gray, similarities in light gray. Location of the G1132R mutation is indicated. (d) Representative images of GFP tagged UNC-2(WT) and UNC-2(GF/G1132) in the ventral nerve cord. Asterisks point the cell bodies of the motor neurons and arrows indicate the presynaptic sites. Both constructs are expressed under pan-neuronal promoter tag-168. Scale bar, 10 μm. (e) Quantification of the reversal frequency: wild type (6.6 ± 0.4, n = 70), unc-2(zf35) (43.3 ± 1.9, n = 65), unc-2(e55lf) (2.4 ± 0.2, n = 59), wild-type animals expressing unc-2(wt) transgene (7.5 ± 0.6, n = 10) and unc-2(zf35) transgene (33 ± 2.1, n = 22), and unc-2(e55lf) rescued with unc-2(wt) transgene (3.8 ± 0.7, n = 12) and unc-2(zf35) transgene (41.3 ± 3.6, n = 21). Error bars represent SEM for at least three trials with indicated totaling animals number. Statistical difference from wild type ****p<0.0001, one-way ANOVA with Dunnett’s multiple comparisons test. (f) Intragenic unc-2(lf) mutations suppress unc-2(zf35) hyperactive locomotion. Shown are numbers of thrashes in 30 s in M9 for the wild type (107.0 ± 14.0, n = 60), unc-2(zf35) (128.1 ± 13.5, n = 60), unc-2(lf) (4.8 ± 2.1, n = 57), unc-2(zf35 zf109) (6.9 ± 4.3, n = 53); unc-2(zf35 zf113) (5.6 ± 3.7 thrashes, n = 57); unc-2(zf35 zf114) (80.2 ± 9.9, n = 60); unc-2(zf35 zf115) (6.9 ± 3.8, n = 56); unc-2(zf35 zf124) (5.3 ± 3.1, n = 57); unc-2(zf35 zf130) (67.1 ± 22.5, n = 58); unc-2(zf35 zf134) (31.2 ± 17.9, n = 50). Error bars represent SEM. Statistical difference from unc-2(zf35) mutants unless otherwise indicated, ****p<0.0001, one-way ANOVA with Tukey’s multiple comparisons test.
-
Figure 2—source data 1
Source data for Figure 2.
- https://doi.org/10.7554/eLife.45905.007
Figure 2—figure supplement 1
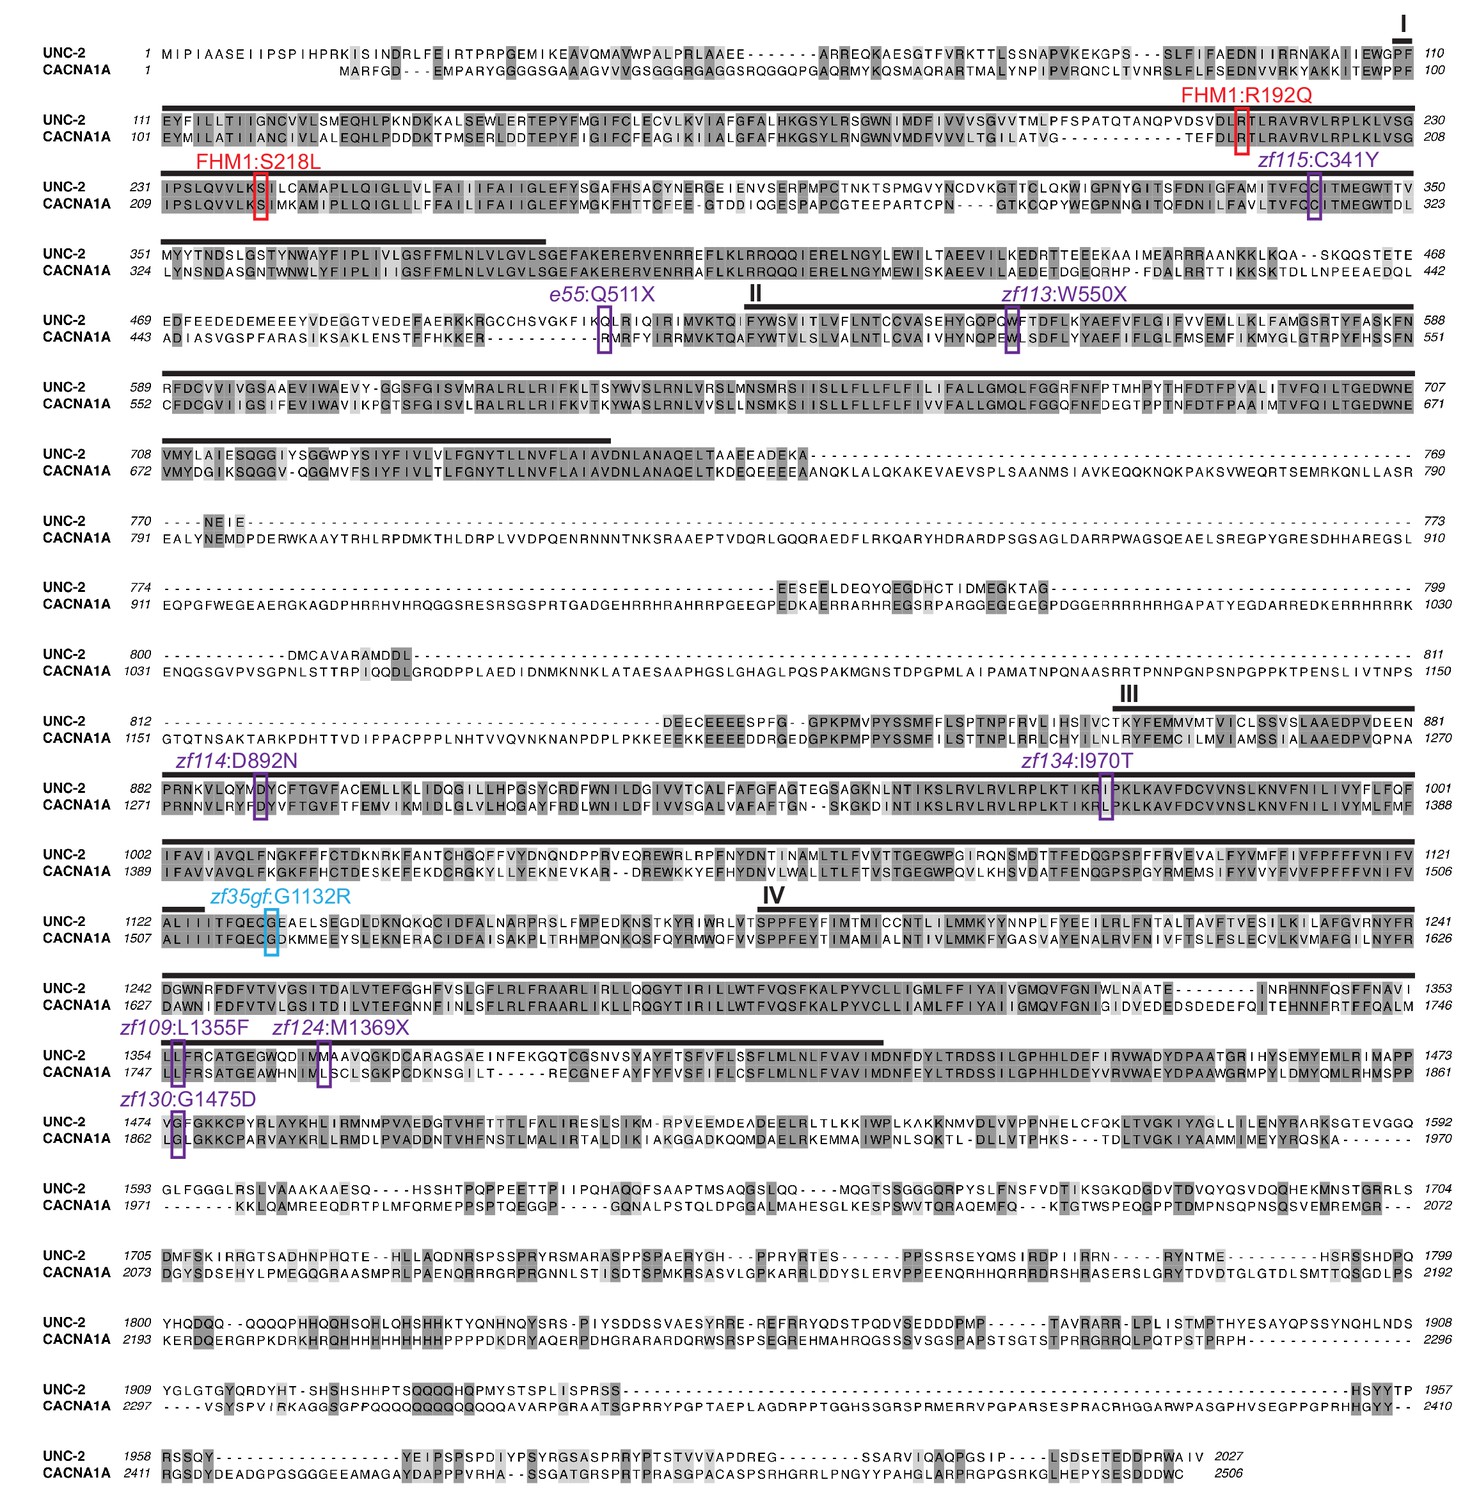
Amino acid alignment of human CACNA1A and C. elegans UNC-2 proteins.
Identities are shaded in dark gray, similarities in light gray. Black bars indicate the four homologous domains (I–IV) each containing six hydrophobic membrane-spanning segments. UNC-2 and CACNA1A are highly similar (68% similarity). Mutations are indicated in colored rectangles: the UNC-2(GF/G1132R) mutation is indicated in blue. The human CACANA1A FHM1 amino acid substitutions (red) and deduced amino acid changes of unc-2(zf35) intragenic suppressors mutations (purple) are indicated.
Figure 3
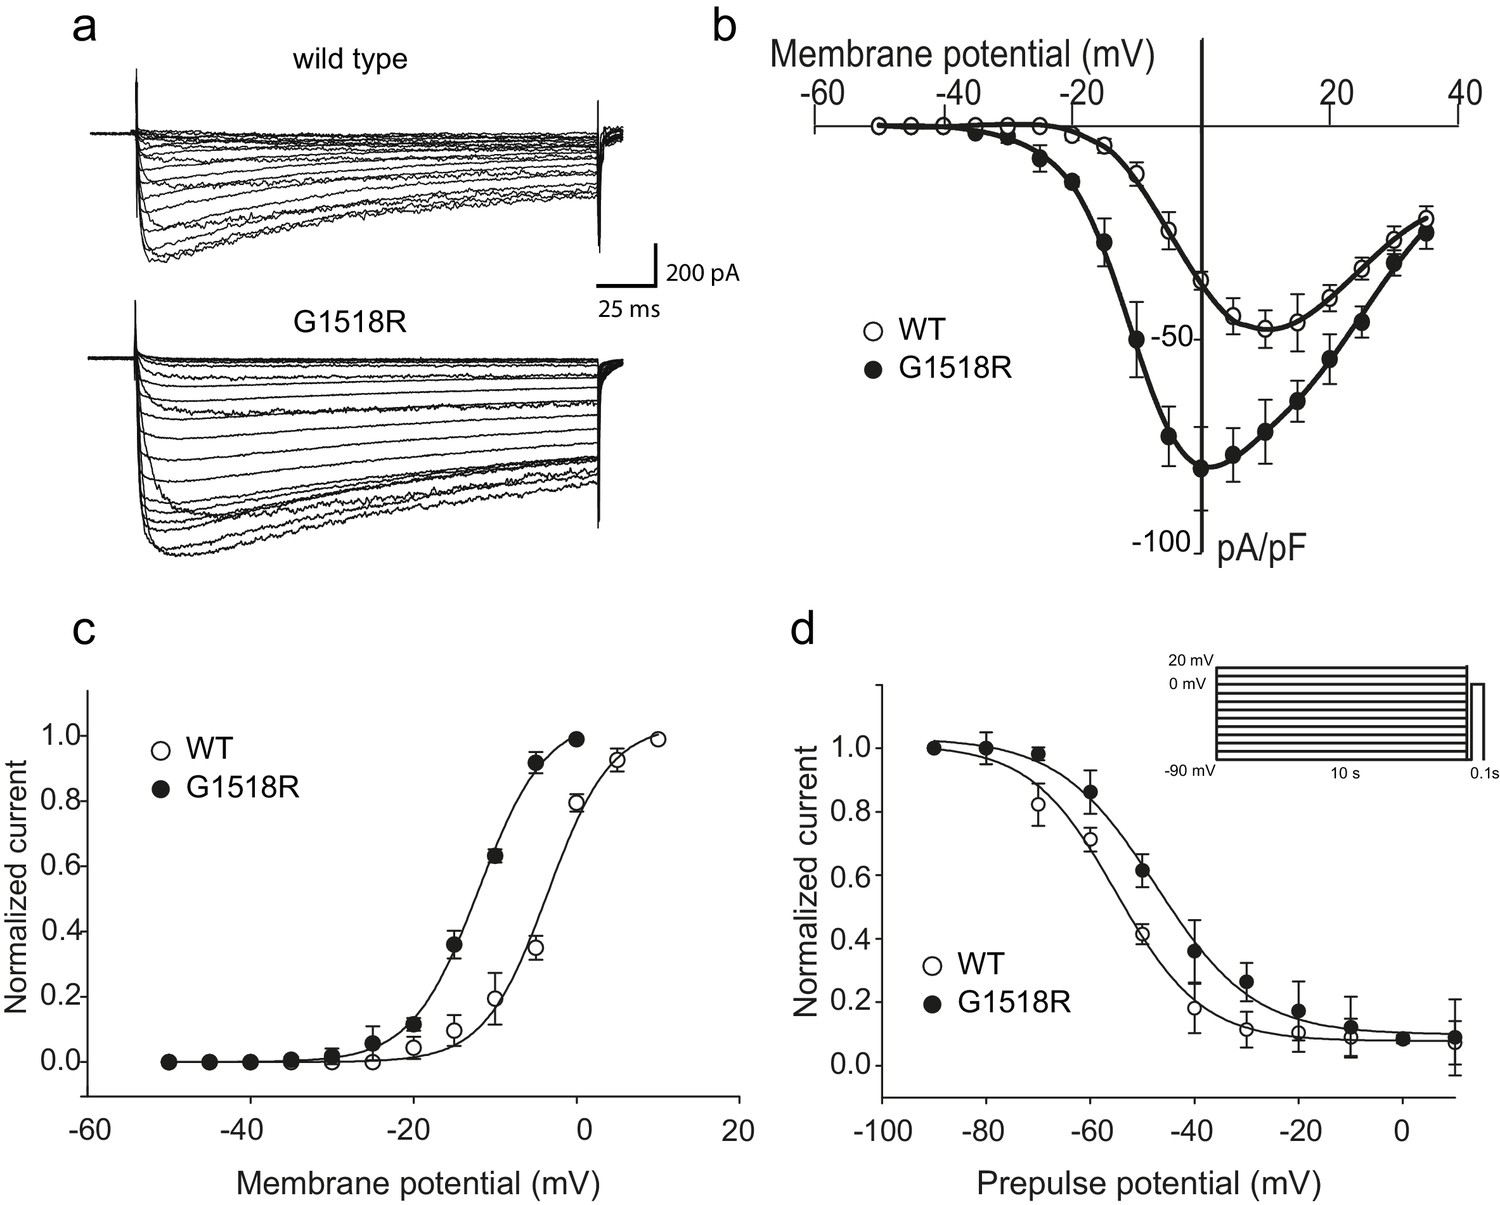
The UNC-2(G1132R) corresponding mutation in human CACNA1A, CaV2.1α, subunit results in increased channel activity.
(a) Representative macro-currents of wild type and G1518R CaV2.1 channels. Currents were generated by stepping membrane potential to voltages between −55 and 40 mV in 5 mV increments for 200 ms from a holding potential of −120 mV. (b) Voltage dependence of whole-cell current density for wild type and G1518R CaV2.1 channels. Current density values were obtained by dividing current amplitudes and cell capacitance. (Wild type, n = 13; G1518R, n = 11). (c) Voltage dependence of Ba2+ current activation. The activation curve of G1518R exhibits a significant shift of the V0.5 value towards more negative membrane potentials. (d) Steady-State inactivation curves. The G1518R mutation causes a slight positive shift in the midpoint voltage in the steady-state inactivation curves (V0.5inact= -55.0 ± 1.0 and −47.3 ± 1.0 for wild type and G1518R, respectively). Currents were normalized to the maximal value obtained at the test pulse and plotted as a function of the prepulse potential. Data were fitted with the Boltzmann equation: (Imax=(1+exp[(V-V0.5)/kin]) - 1). All recordings were carried out in Ba2+ solution to exclude the effects from calcium-dependent inactivation.
-
Figure 3—source data 1
Source data for Figure 3.
- https://doi.org/10.7554/eLife.45905.009
Figure 4
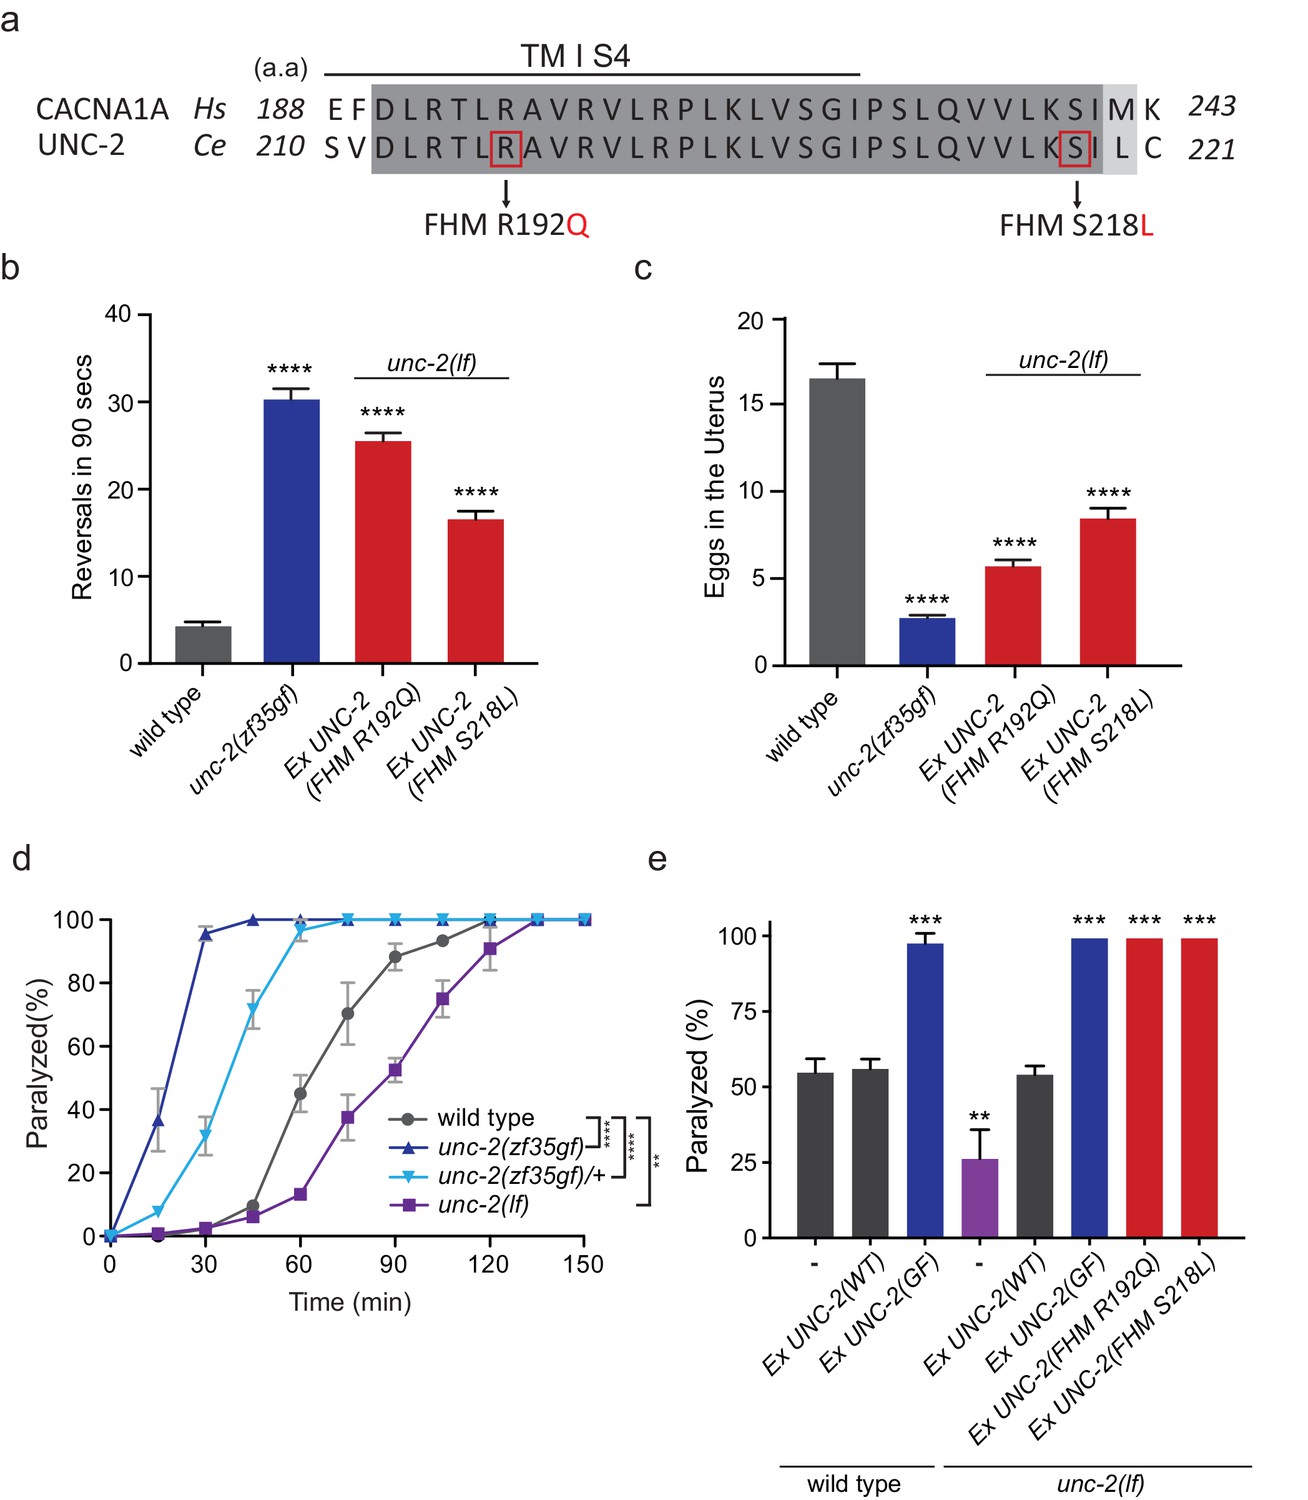
FHM1 mutations in unc-2 gene result in a hyperactive phenotype.
(a) The amino acid alignment of the conserved region of transmembrane domain I membrane-spanning segments 4 (TM I S4) and the following linker region from human (CACNA1A) and worm (UNC-2) CaV2α subunits. Identities are dark gray and similarities are light gray. Indicated are the known human FHM1 mutations: R192Q and S218L. (b) Shown is the average number of reversals in 90 s on thin lawn OP50 plates: wild type (4.2 ± 0.5, n = 29), unc-2(zf35gf) (30.3 ± 1.2, n = 20), Ptag-168::UNC-2(R192Q) (25.5 ± 0.9, n = 34), and Ptag-168::UNC-2(R192Q) (16.5 ± 0.9, n = 33). (c) Average numbers of eggs in the adult uterus: wild type (16.5 ± 0.8 eggs, n = 23), unc-2(zf35gf) (2.7 ± 0.2, n = 35), Ptag-168::UNC-2(R192Q) (5.7 ± 0.4, n = 37), and Ptag-168::UNC-2(S218L) (8.4 ± 0.6, n = 32). Each bar represents the mean ± SEM for at least three trials with indicated totaling animals number. Statistical difference from wild-type, ****p<0.0001, one-way ANOVA with Dunnett’s multiple comparisons test. (d) Quantification of paralysis on 1 mM aldicarb. Each data point represents the mean ± SEM of the percentage of animals paralyzed every 15 min. 50% of the wild-type animals were paralyzed at 60 min. unc-2(lf) animals were resistant to the effects of aldicarb and reached 50% paralysis at 90 min. Homozygous unc-2(zf35gf) mutants were sensitive to aldicarb; 50% of the unc-2(zf35gf) mutants were paralyzed at 20 min. 50% of heterozygous unc-2(zf35gf) mutants paralyzed at 40 min. Three independent trials with at least 50 animals for each genotype; **p<0.01, ****p<0.0001, two-way ANOVA with Tukey’s multiple comparisons test. (e) Quantification of paralysis percentage on 1 mM aldicarb at the 60 min time point: 55.5% ± 4.5 of wild type, 56.7% ± 3.3 of Ptag-168::UNC-2(WT) and 98.3% ± 3.3 of Ptag-168::UNC-2(GF) expressed in wild-type animals, 27.1% ± 7.3 of unc-2(lf) animals, 54.8% ± 2.9 of Ptag-168::UNC-2(WT), 100% of Ptag-168::UNC-2(GF), and 100% of Ptag-168::UNC-2(R192Q) and Ptag-168::UNC-2(S218L) in unc-2(lf) background. **p<0.01, ***p<0.001, one-way ANOVA with Dunnett’s multiple comparisons test.
-
Figure 4—source data 1
Source data for Figure 4.
- https://doi.org/10.7554/eLife.45905.011
Figure 5
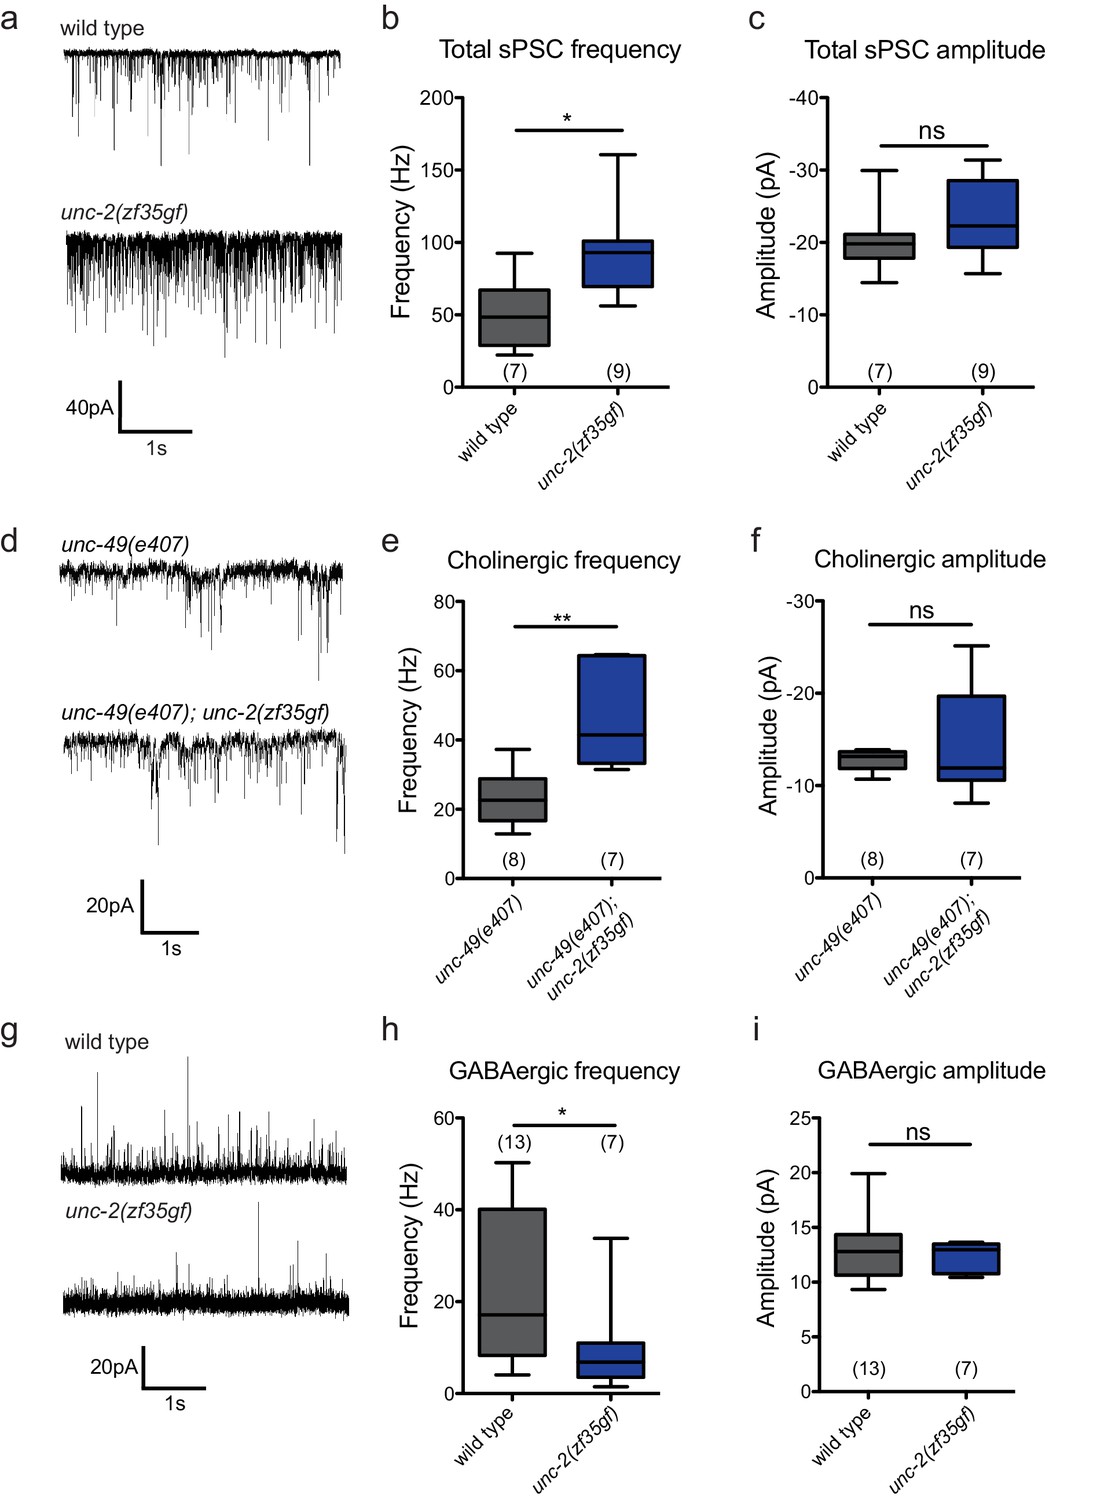
The unc-2(zf35gf) mutation leads to increased spontaneous EPSCs and decreased spontaneous IPSCs.
(a) Representative traces of total spontaneous postsynaptic currents (sPSCs) from ventral body wall muscles in wild-type and unc-2(zf35gf) mutants. (b and c) Mean spontaneous PSC frequency and amplitude of wild-type and unc-2(zf35gf) mutants. (d) Representative traces of spontaneous cholinergic EPSCs in unc-49 and unc-49; unc-2(zf35gf) mutants. (e and f) Mean spontaneous EPSC frequency and amplitude unc-49 and unc-49; unc-2(zf35gf) mutants. (g) Representative traces of spontaneous GABAergic IPSCs in wild-type and unc-2(zf35gf) mutants. (h and i) Mean IPSC frequency and amplitude of wild-type animals and unc-2(zf35gf) mutants. Error bars depict SEM. *p<0.05, **p<0.01, two-tailed Student’s t test.
-
Figure 5—source data 1
Source data for Figure 5.
- https://doi.org/10.7554/eLife.45905.013
Figure 6 with 4 supplements

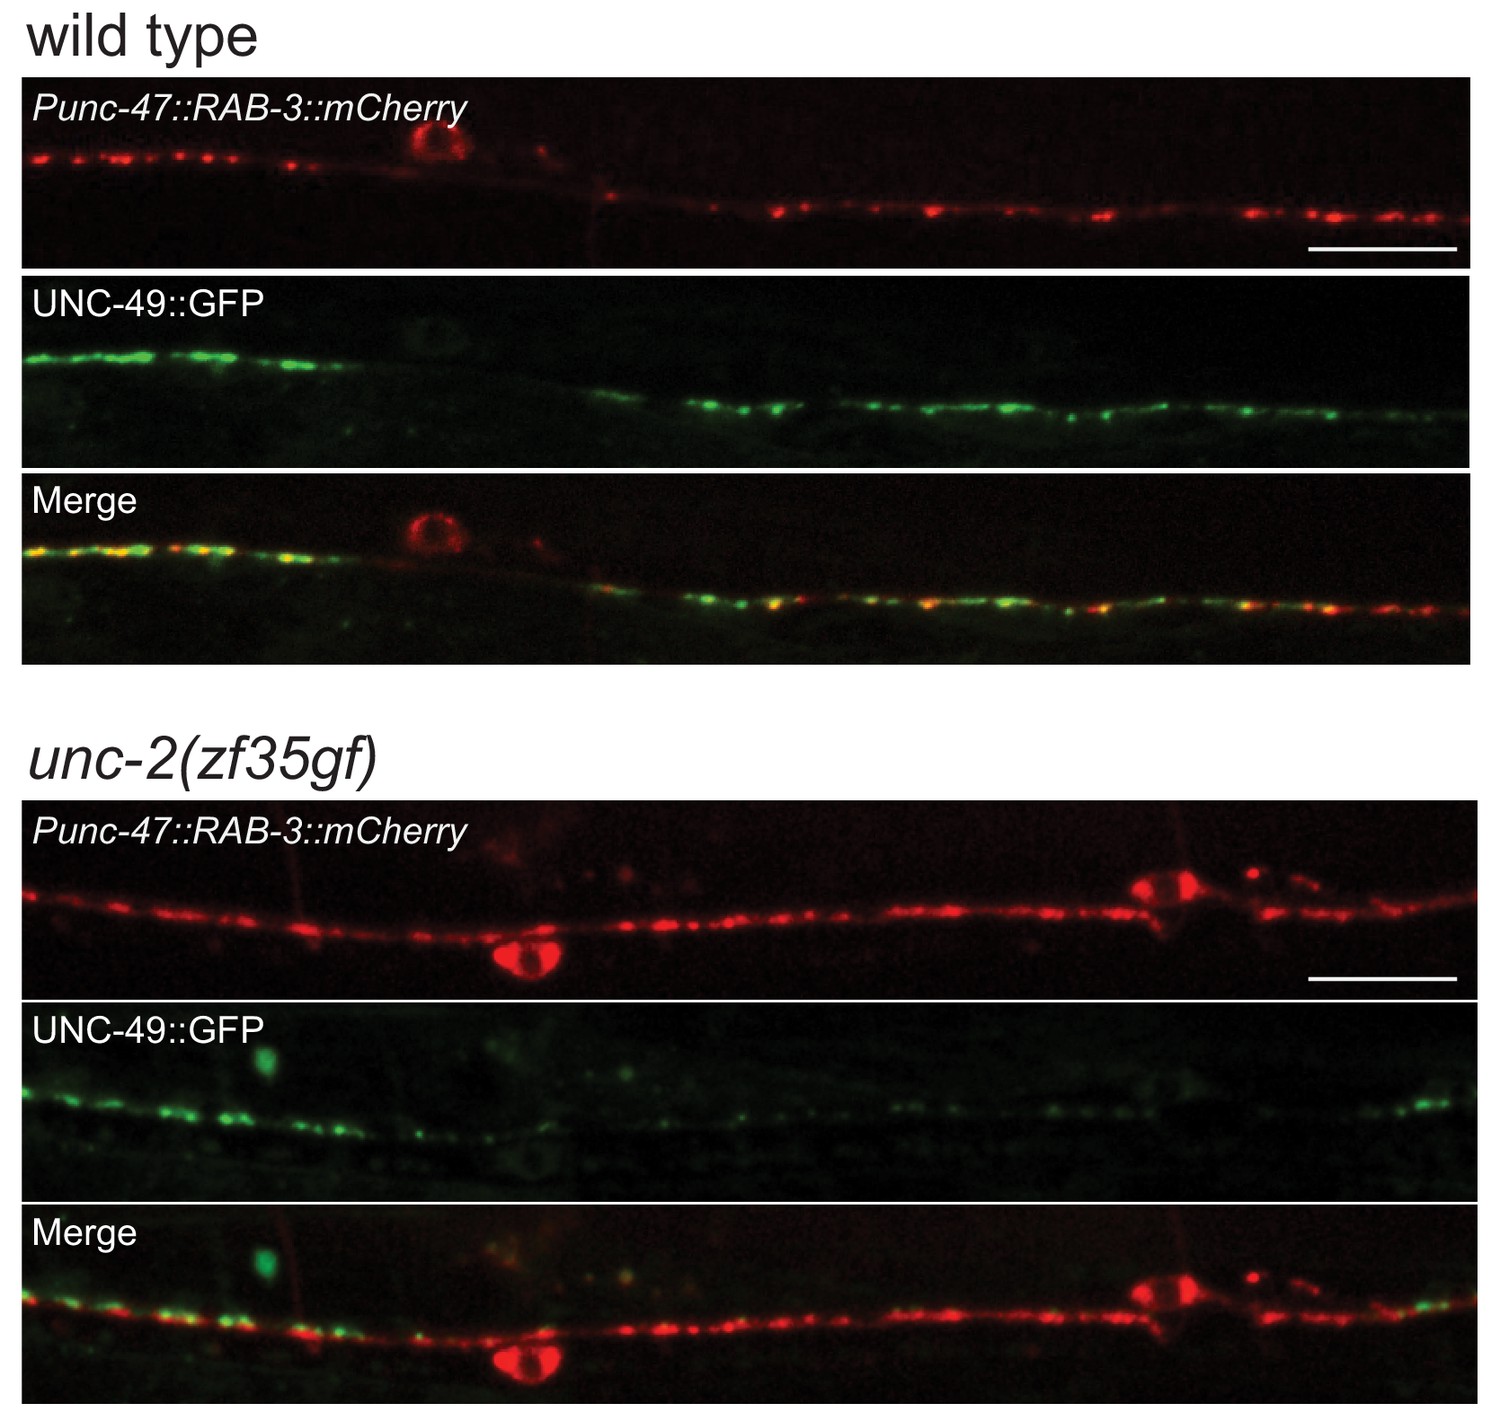
unc-2(zf35gf) mutants have decreased GABAA receptor expression at the NMJ.
(a and c) Representative images of cholinergic synapses in wild type and unc-2(zf35gf) mutants. Presynaptic sites are labeled with synaptic vesicle marker RAB-3::mCherry while postsynaptic nicotinic acetylcholine receptors are labeled by UNC-29::GFP. Scale bar represents 10 μm. (b and d) Quantification of the fluorescence intensity of RAB-3::mCherry and UNC-29::GFP along the ventral nerve cord at cholinergic synapses in wild type and unc-2(zf35gf) animals. Arbitrary fluorescence units of individual animals are normalized to the mean value of the wild type. Normalized fluorescence of cholinergic RAB-3::mCherry: 0.99 ± 0.76, n = 21 in wild type and 1.36 ± 0.18, n = 14 in unc-2(zf35gf) mutants. UNC-29::GFP: 0.97 ± 0.05, n = 35 in wild type and 1.19 ± 0.06, n = 38 in unc-2(zf35gf) mutants. (e and g) Representative images of GABAergic synapses in wild type and unc-2(zf35gf) mutants. Presynaptic sites are labeled with synaptic vesicle marker RAB- 3::mCherry while postsynaptic GABA receptors are labeled by UNC-49::GFP. Scale bar represents 10 μm. (f and h) Quantification of the fluorescence intensity of RAB-3::mCherry and UNC-49::GFP along the ventral nerve cord at GABAergic synapses in wild-type and unc-2(zf35gf) animals. Arbitrary fluorescence units of individual animals are normalized to the mean value of the wild type. Normalized fluorescence of GABAergic RAB-3::mCherry: 1 ± 0.07, n = 18 in wild type and 1.25 ± 0.08, n = 20 in unc-2(zf35gf) mutants. UNC-49::GFP: 1 ± 0.09, n = 18 in wild-type and 0.75 ± 0.06, n = 20 in unc-2(zf35gf) animals. For all the quantification above, error bars depict SEM. *p<0.05, ****p<0.0001, two-tailed Student’s t test.
-
Figure 6—source data 1
Source data for Figure 6.
- https://doi.org/10.7554/eLife.45905.022
Figure 6—figure supplement 1
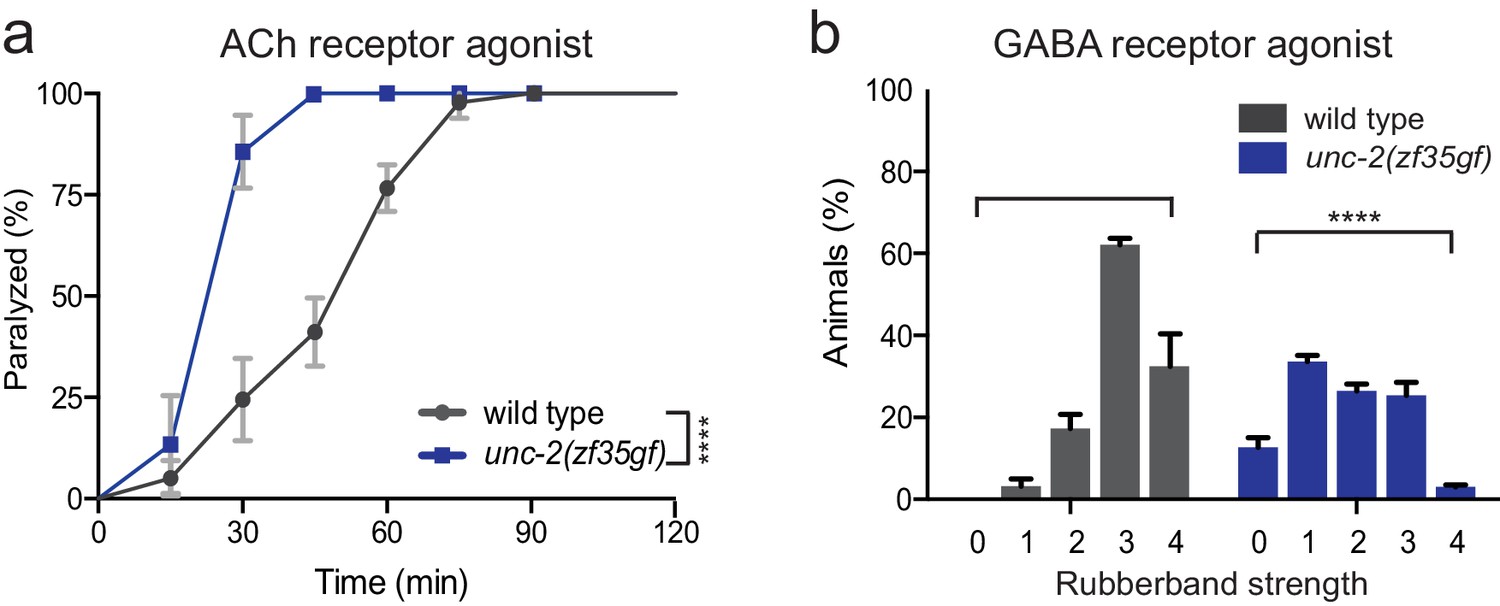
unc-2(zf35gf) mutants are hypersensitive to the AChR agonist, levamisole and resistant to the GABA receptor agonist, muscimol.
(a) Quantification of movement on 0.5 mM levamisole. Each data point represents the mean ± SEM of the percentage of animals paralyzed by levamisole every 15 min for at least three trials, totaling a minimum of 50 animals. ****p<0.0001, two-way ANOVA with Tukey’s multiple comparisons test. (b) Percentage of animals that displayed the muscimol-induced rubberband phenotype on 1 mM muscimol plates at 60 min time point. Severity of muscimol-induced phenotype increases from 0 (normal locomotion) to 4 (complete flaccid). See Materials and methods for scoring details. Wild-type animals: category 0: 0%, category 1: 3 ± 2.9%, category 2: 17 ± 5.8%, category 3: 62 ± 2.7% and category 4: 32 ± 13.7%. unc-2(zf35gf): category 0: 12 ± 3.3%, category 1: 33 ± 2.2%, category 2: 26 ± 2.4%, category 3: 25 ± 4.5% and category 4 and 3 ± 1%. Error bars depict SEM. ***p<0.001, Chi-squared test.
-
Figure 6—figure supplement 1—source data 1
Source data for Figure 6—figure supplement 1.
- https://doi.org/10.7554/eLife.45905.016
Figure 6—figure supplement 2

unc-2(zf35gf) mutants have an increased RAB-3 puncta density and a reduced UNC-49 puncta density along the nerve cord.
(a) Quantification of RAB-3::mcherry puncta density along the nerve cord of wild type and unc-2(zf35gf) animals. Shown are puncta numbers per 50 μm: wild type (19.8 ± 0.56, n = 27), unc-2(zf35gf) (23.2 ± 0.5, n = 26) (b) Quantification of the UNC-49::GFP puncta density along the nerve cord of wild-type and unc-2(zf35gf) animals. Shown are puncta numbers per 50 μm: wild type (14.4 ± 1.05, n = 27), unc-2(zf35gf) (7.2 ± 1.06, n = 26). For the quantification above, error bars depict SEM. ***p<0.001, ****p<0.0001, two-tailed Student’s t test.
-
Figure 6—figure supplement 2—source data 1
Source data for Figure 6—figure supplement 2.
- https://doi.org/10.7554/eLife.45905.018
Figure 6—figure supplement 3
Representative images of GABAergic synapses pre- and post-synaptic apposition in wild-type and unc-2(zf35gf) animals.
Presynaptic sites are labeled with synaptic vesicle marker RAB-3::mCherry while postsynaptic GABA receptors are labeled by UNC-49::GFP. In unc-2(zf35gf) mutants RAB-3::mCherry puncta are observed without punctate UNC-49::GFP apposition. Scale bar represents 10 μm.
Figure 6—figure supplement 4
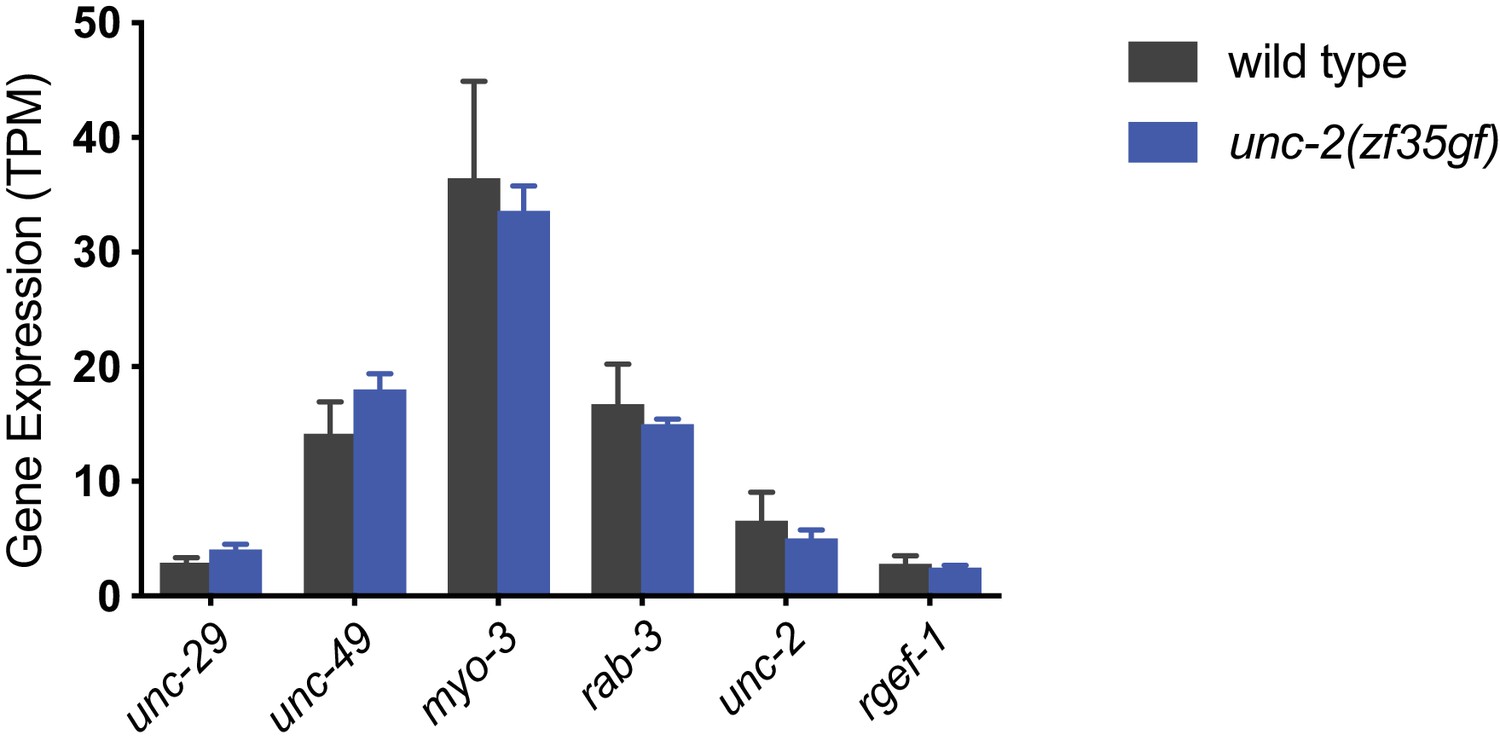
wild-type and unc-2(zf35gf) animals have similar unc-29 and unc-49 mRNA levels.
Normalized RNA-seq reads (Transcript abundance counts, TPM) for genes encoding the acetylcholine receptor unc-29, GABAA receptor unc-49 and muscle myosin myo-3, as well as neuron-specific genes: rab-3, rgef-1 and unc-2. Experiments were performed in triplicate on young adults for wild type and unc-2(zf35gf) animals. For the analysis, Illumina sequencing adapters were trimmed using bbduk.sh utility in BBMap package (https://sourceforge.net/projects/bbmap/). Transcript abundance counts (in TPM, transcripts per million) were calculated for each sample using the kallisto software (Bray et al., 2016) with the C. elegans mRNA transcripts from WormBase release WS254 as a reference. A detailed analysis of the RNA-seq data will be presented elsewhere.
-
Figure 6—figure supplement 4—source data 1
Source data for Figure 6—figure supplement 4.
- https://doi.org/10.7554/eLife.45905.021
Figure 7 with 3 supplements
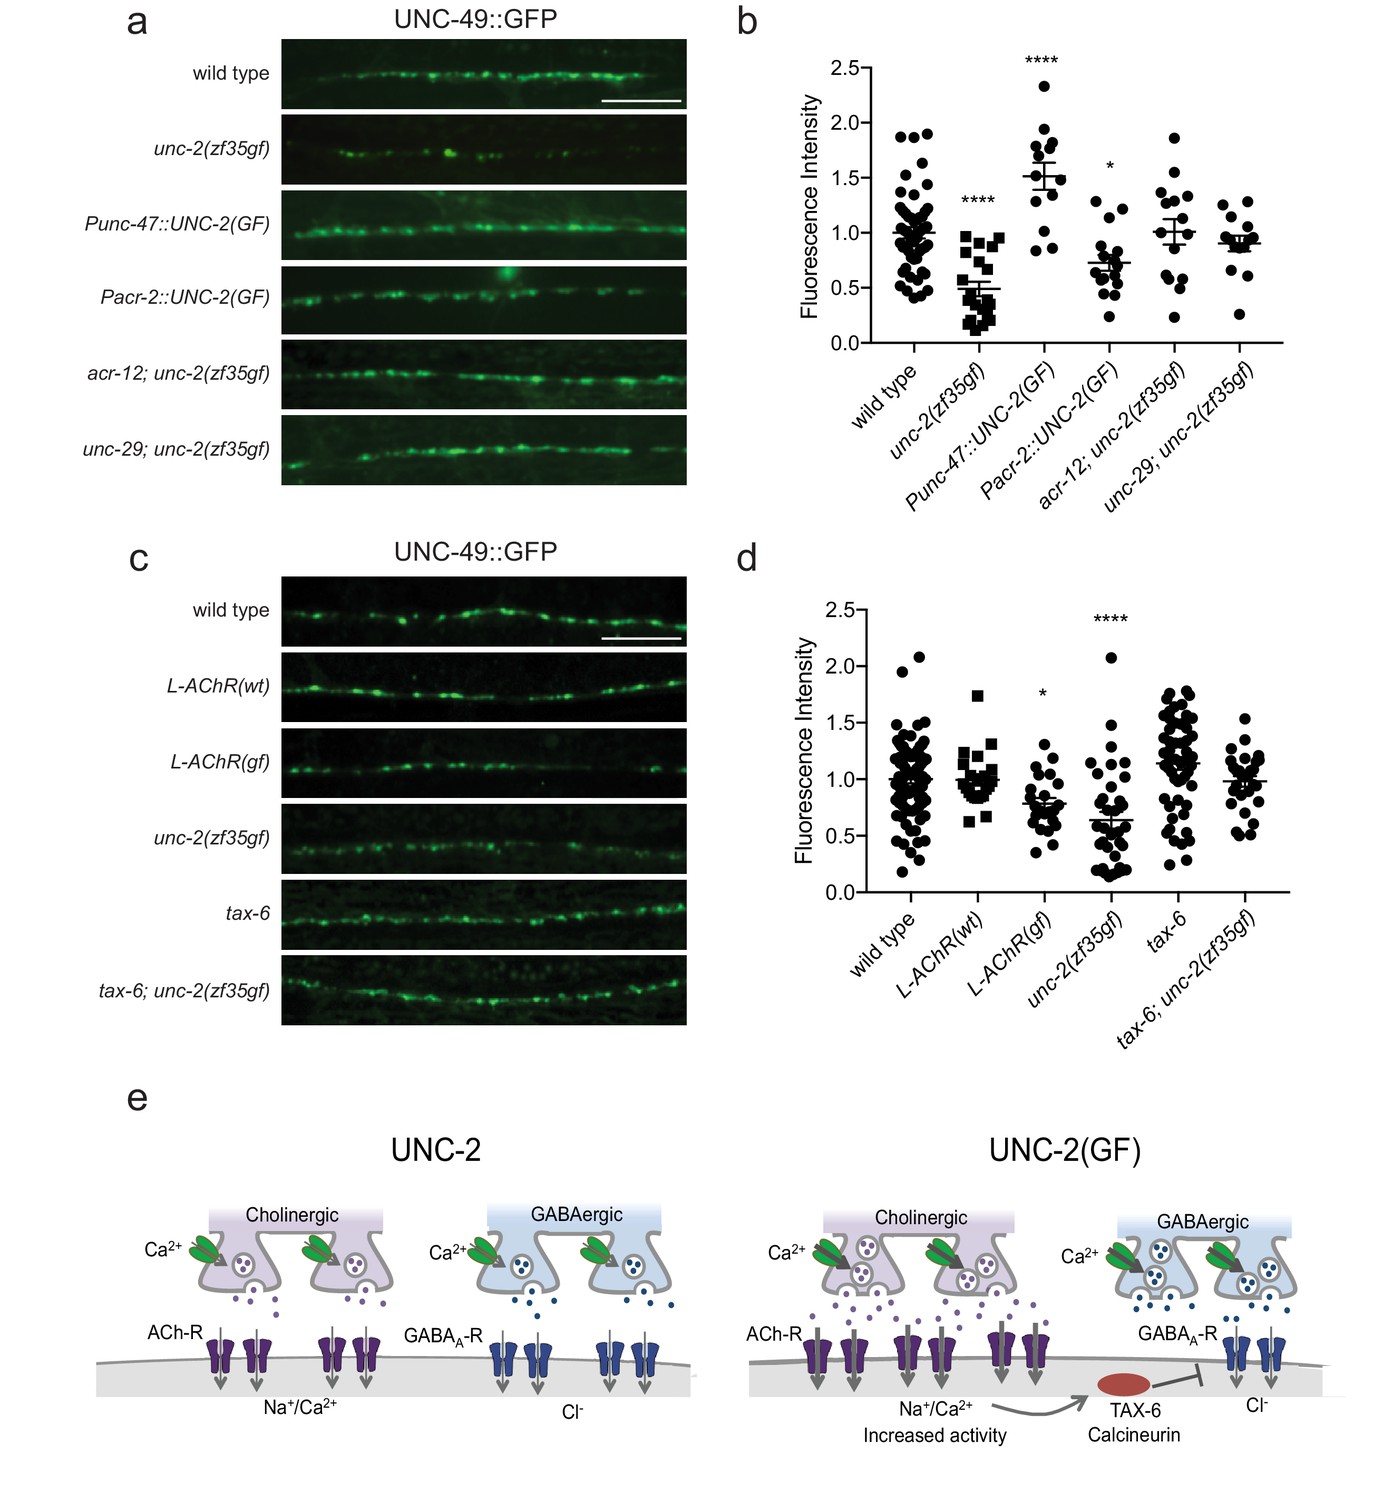
The reduction of GABAA receptor in unc-2(zf35gf) mutants is dependent on nicotinic acetylcholine receptor mediated signaling.
(a and c) Representative images of GABAergic post-synaptic sites labeled with UNC-49::GFP of indicated genotypes. Scale bar represents 10 μm (b) Quantification of the fluorescence intensity of UNC-49::GFP along the nerve cord. Arbitrary fluorescence units of individual animals are normalized to the mean value of wild type. Normalized UNC-49::GFP fluorescence: wild type (1 ± 0.06, n = 41), unc-2(zf35gf) (0.4 ± 0.07, n = 15), Punc-47::UNC-2(GF) (1.5 ± 0.12, n = 13), Pacr-2::UNC-2(GF) (0.7 ± 0.07, n = 16), acr-12; unc-2(zf35gf) (1 ± 0.11, n = 15) and unc-29; unc-2(zf35gf) (0.9 ± 0.07, n = 14). (d) Quantification of the fluorescence intensity of UNC-49::GFP along the nerve cord of indicated genotypes. Arbitrary fluorescence units of individual animals are normalized to the mean value of wild type. Normalized UNC-49::GFP fluorescence: wild type (1 ± 0.04, n = 82), L-AChR(WT) (1 ± 0.05, n = 22), L-AChR(GF) (0.8 ± 0.05, n = 23), unc-2(zf35gf) (0.6 ± 0.07, n = 36), tax-6 (1.1 ± 0.06, n = 54), tax-6; unc-2(zf35gf) (1 ± 0.05, n = 29). For all the quantification above, error bars depict SEM. *p<0.05, ****p<0.0001, one-way ANOVA with Dunnett’s multiple comparisons. (e) Model: The UNC-2 gain-of-function mutation shifts the E/I balance to an excitation-dominant transmission through the destabilaztion of GABA synapses in a TAX-6/calcineurin-dependent manner (See text for explanation).
-
Figure 7—source data 1
Source data for Figure 7.
- https://doi.org/10.7554/eLife.45905.030
Figure 7—figure supplement 1
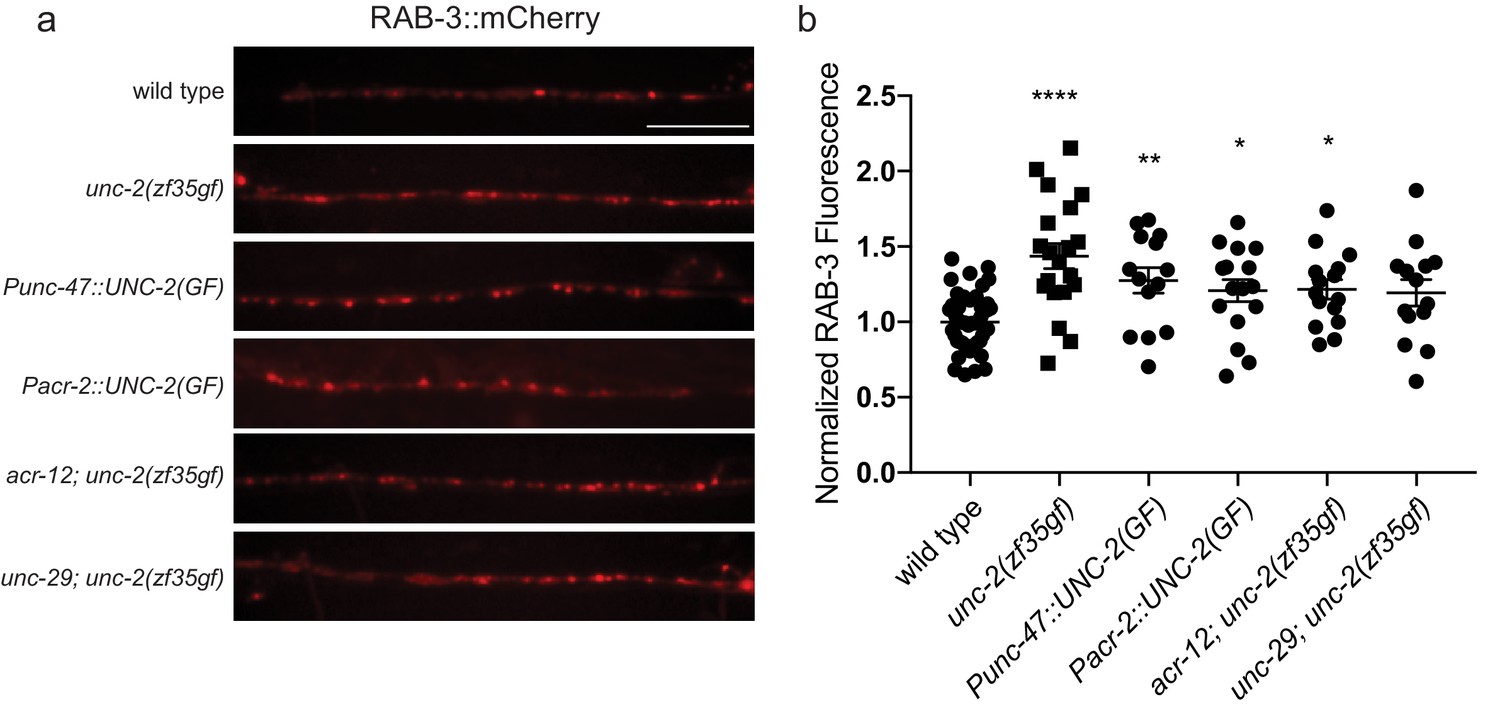
Quantification of RAB-3 vesicle marker in GABAergic synapses.
(a) Representative images and (b) quantification of GABAergic presynaptic sites labeled with RAB-3::mCherry for indicated genotypes. Scale bar represents 10 μm. Arbitrary fluorescence units of individual animals are normalized to the mean value of the wild type. Normalized RAB-3::mCherry fluorescence: wild type (1 ± 0.05, n = 51), unc-2(zf35gf) (1.4 ± 0.07, n = 20), Punc-47::UNC-2(GF) (1.3 ± 0.08, n = 14), Pacr-2::UNC-2(GF) (1.2 ± 0.08, n = 16), acr-12; unc-2(zf35gf) (1.2 ± 0.06, n = 15) and unc-29; unc-2(zf35gf) (1.2 ± 0.08, n = 14). In the Punc-47::UNC-2(GF) and Pacr-2::UNC-2(GF) lines, the unc-2(zf35gf) transgene is specifically expressed in GABAergic or cholinergic motor neurons, respectively. Error bars depict SEM. *p<0.05, **p<0.01, ***p<0.0001, one-way ANOVA with Dunnett’s multiple comparisons.
-
Figure 7—figure supplement 1—source data 1
Source data for Figure 7—figure supplement 1.
- https://doi.org/10.7554/eLife.45905.025
Figure 7—figure supplement 2
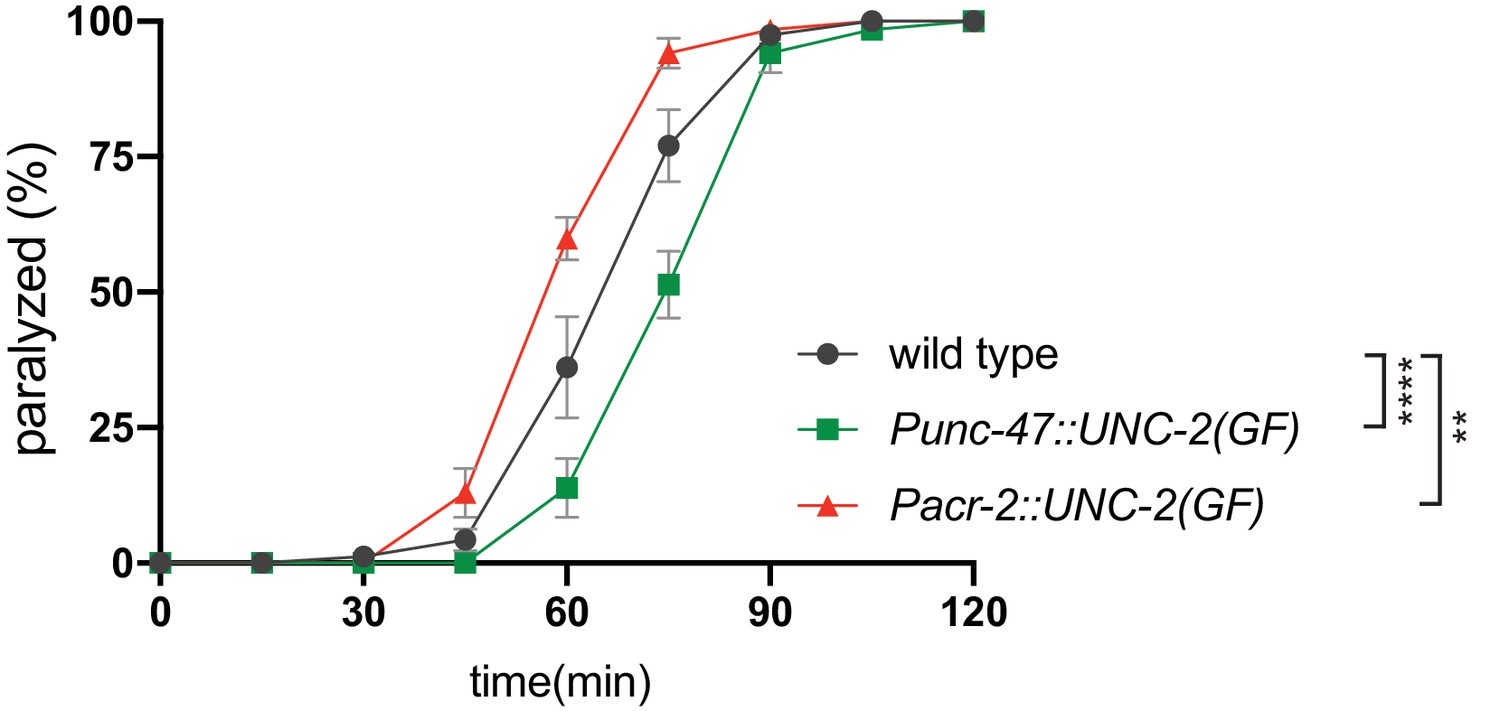
Cell-specific expression of unc-2(zf35gf) transgene in cholinergic or GABAergic motor neurons confers corresponding aldicarb response.
Quantification of paralysis on 1 mM aldicarb. Each data point represents the mean ± SEM of the percentage of animals paralyzed every 15 min. Expression of the unc-2(zf35gf) transgene in cholinergic motor neurons (Pacr-2::UNC-2(GF)) makes animals hypersensitive to aldicarb, whereas expression in GABAergic neurons (Punc-47::UNC-2(GF)) increases resistance to aldicarb. Five independent trials with totaling at least 50 animals for each genotype. **p<0.01, ****p<0.0001, two-way ANOVA with Tukey’s multiple comparisons test.
-
Figure 7—figure supplement 2—source data 1
Source data for Figure 7—figure supplement 2.
- https://doi.org/10.7554/eLife.45905.027
Figure 7—figure supplement 3

Knocking down tax-6 gene expression in non-neuonal cells is sufficient to suppress the reduction of UNC-49::GFP in unc-2(zf35gf) mutants.
Representative images and quantification of the fluorescence intensity of UNC-49::GFP along the nerve cord of indicated genotypes and treatments. Arbitrary fluorescence units of individual animals are normalized to the mean value of the wild type. Normalized UNC-49::GFP fluorescence: wild type treated with control RNAi (1 ± 0.14, n = 13), unc-2(zf35gf) treated with control RNAi (0.62 ± 0.07, n = 25), wild type treated with tax-6 RNAi (1.26 ± 0.13, n = 17), unc-2(zf35gf) treated with tax-6 RNAi (1.02 ± 0.07, n = 26). For all the quantification above, error bars depict SEM. *p<0.05, **p<0.01, one-way ANOVA with Tukey’s multiple comparisons.
-
Figure 7—figure supplement 3—source data 1
Source data for Figure 7—figure supplement 3.
- https://doi.org/10.7554/eLife.45905.029
Videos
Video 1
unc-2(zf35) mutants have an increased reversal frequency.
Videos of locomotor behavior of the wild-type and unc-2(zf35) animals on NGM agar plates with seeded OP50.
Additional files
-
Transparent reporting form
- https://doi.org/10.7554/eLife.45905.031
Download links
A two-part list of links to download the article, or parts of the article, in various formats.
Downloads (link to download the article as PDF)
Open citations (links to open the citations from this article in various online reference manager services)
Cite this article (links to download the citations from this article in formats compatible with various reference manager tools)
Gain-of-function mutations in the UNC-2/CaV2α channel lead to excitation-dominant synaptic transmission in Caenorhabditis elegans
eLife 8:e45905.
https://doi.org/10.7554/eLife.45905


