Cas9+ conditionally-immortalized macrophages as a tool for bacterial pathogenesis and beyond
- University of California, Berkeley, United States
Figures
Figure 1 with 1 supplement
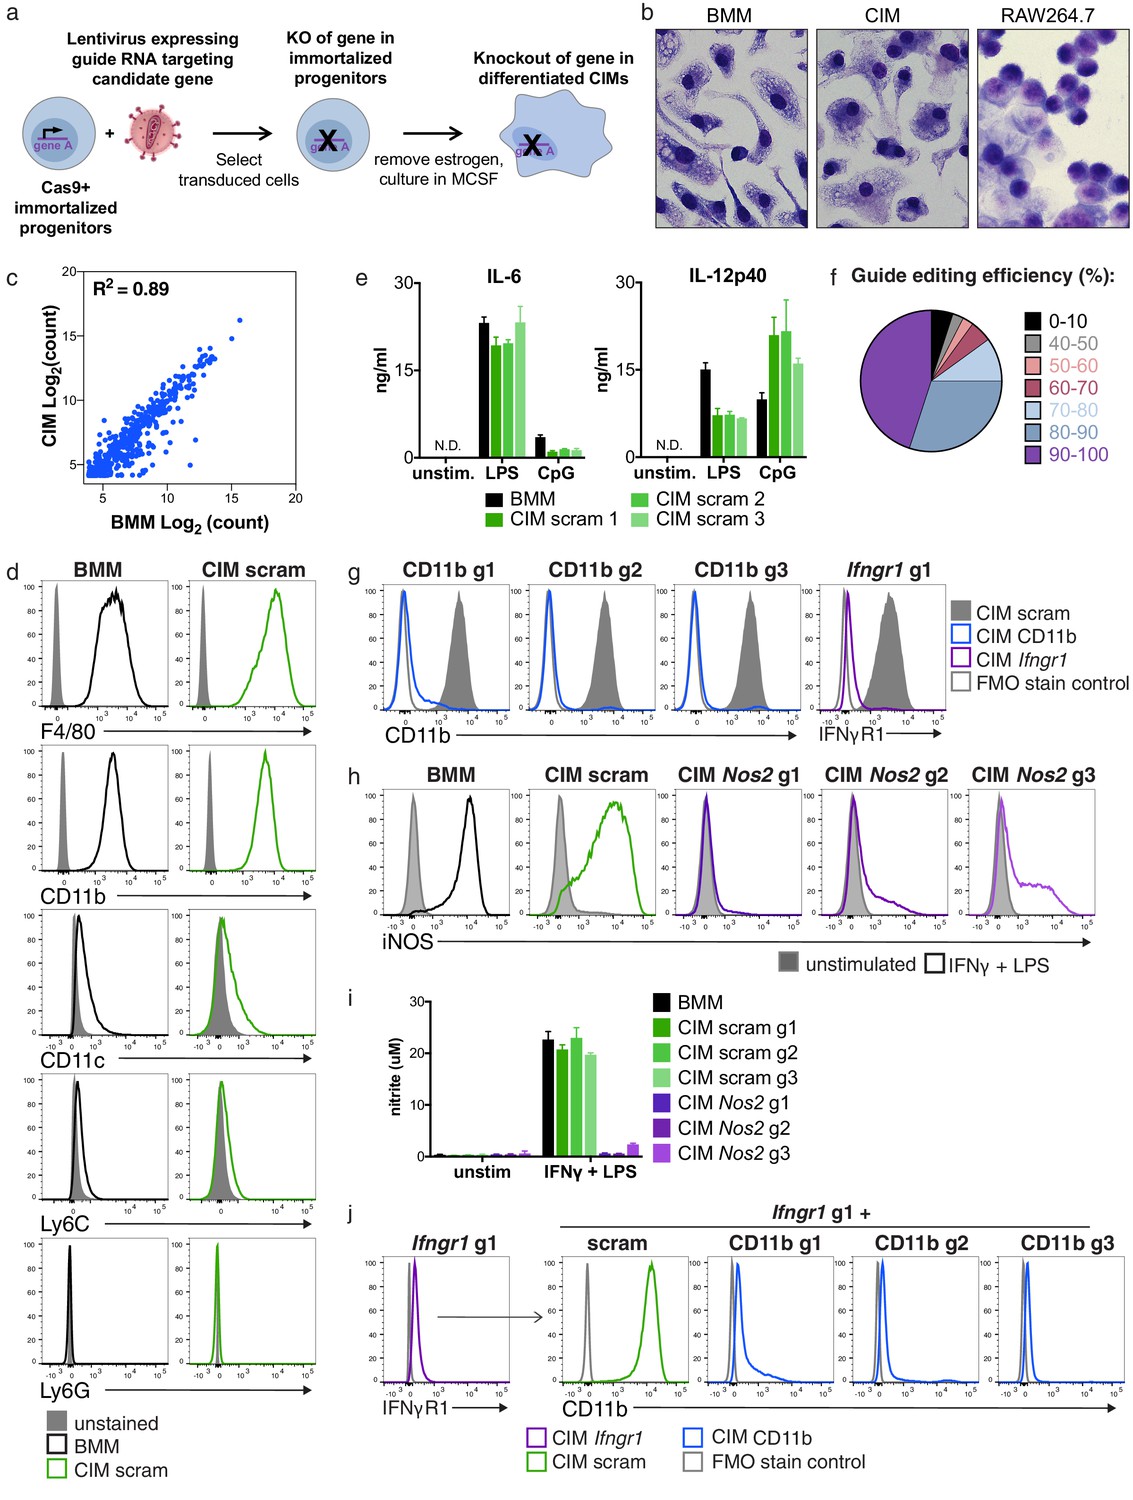
Cas9+ CIMs as a tractable system for genome-editing in macrophages.
(a) Graphic overview of gene editing in Cas9+ CIMs. (b) BMMs (left panel), CIMs (middle), or RAW 264.7 cells (right) were visualized with Diff-Quick stain. (c) mRNA levels in BMMs and CIMs was quantified using a Nanostring nCounter. Data are representative of two independent experiments and are presented as log transformed normalized transcript counts of the average of technical duplicates from one experiment. (d) BMMs or CIMs transduced with a scramble guide (CIM scram) were analyzed by flow cytometry for expression of the indicated myeloid cell markers. Data are representative of three independent experiments. (e) IL-6 and IL-12p40 production by BMMs or CIM scram stimulated with the TLR4 ligand LPS or the TLR9 ligand CpG was measured by ELISA. N.D. – none detected. Data are representative of three independent experiments each performed in triplicate, mean ± SD are shown. (f) Genomic DNA from CIMs transduced with 40 guides targeting 17 genes was analyzed for genomic editing by TIDE analysis. (g) CIMs transduced with a scramble guide or guides targeting CD11b or Ifngr1 were stained with the indicated antibodies. Fluorescence minus one (FMO) stained samples were used as controls. (h and I) BMMs or CIMs transduced with a scramble guide or guides targeting Nos2 were stimulated overnight with LPS + IFNγ or left unstimulated and then analyzed by flow cytometry for expression of iNOS (h); nitric oxide production in cell-free supernatants was analyzed by Griess assay (i). Data are representative of two independent experiments each performed in triplicate, mean ± SD are shown. (j) CIM progenitors previously transduced with a lentivirus containing puromycin resistance and a guide targeting Ifngr1 were subsequently transduced with lentivirus containing hygromycin resistance and scramble guide or guides targeting CD11b.
Figure 1—figure supplement 1
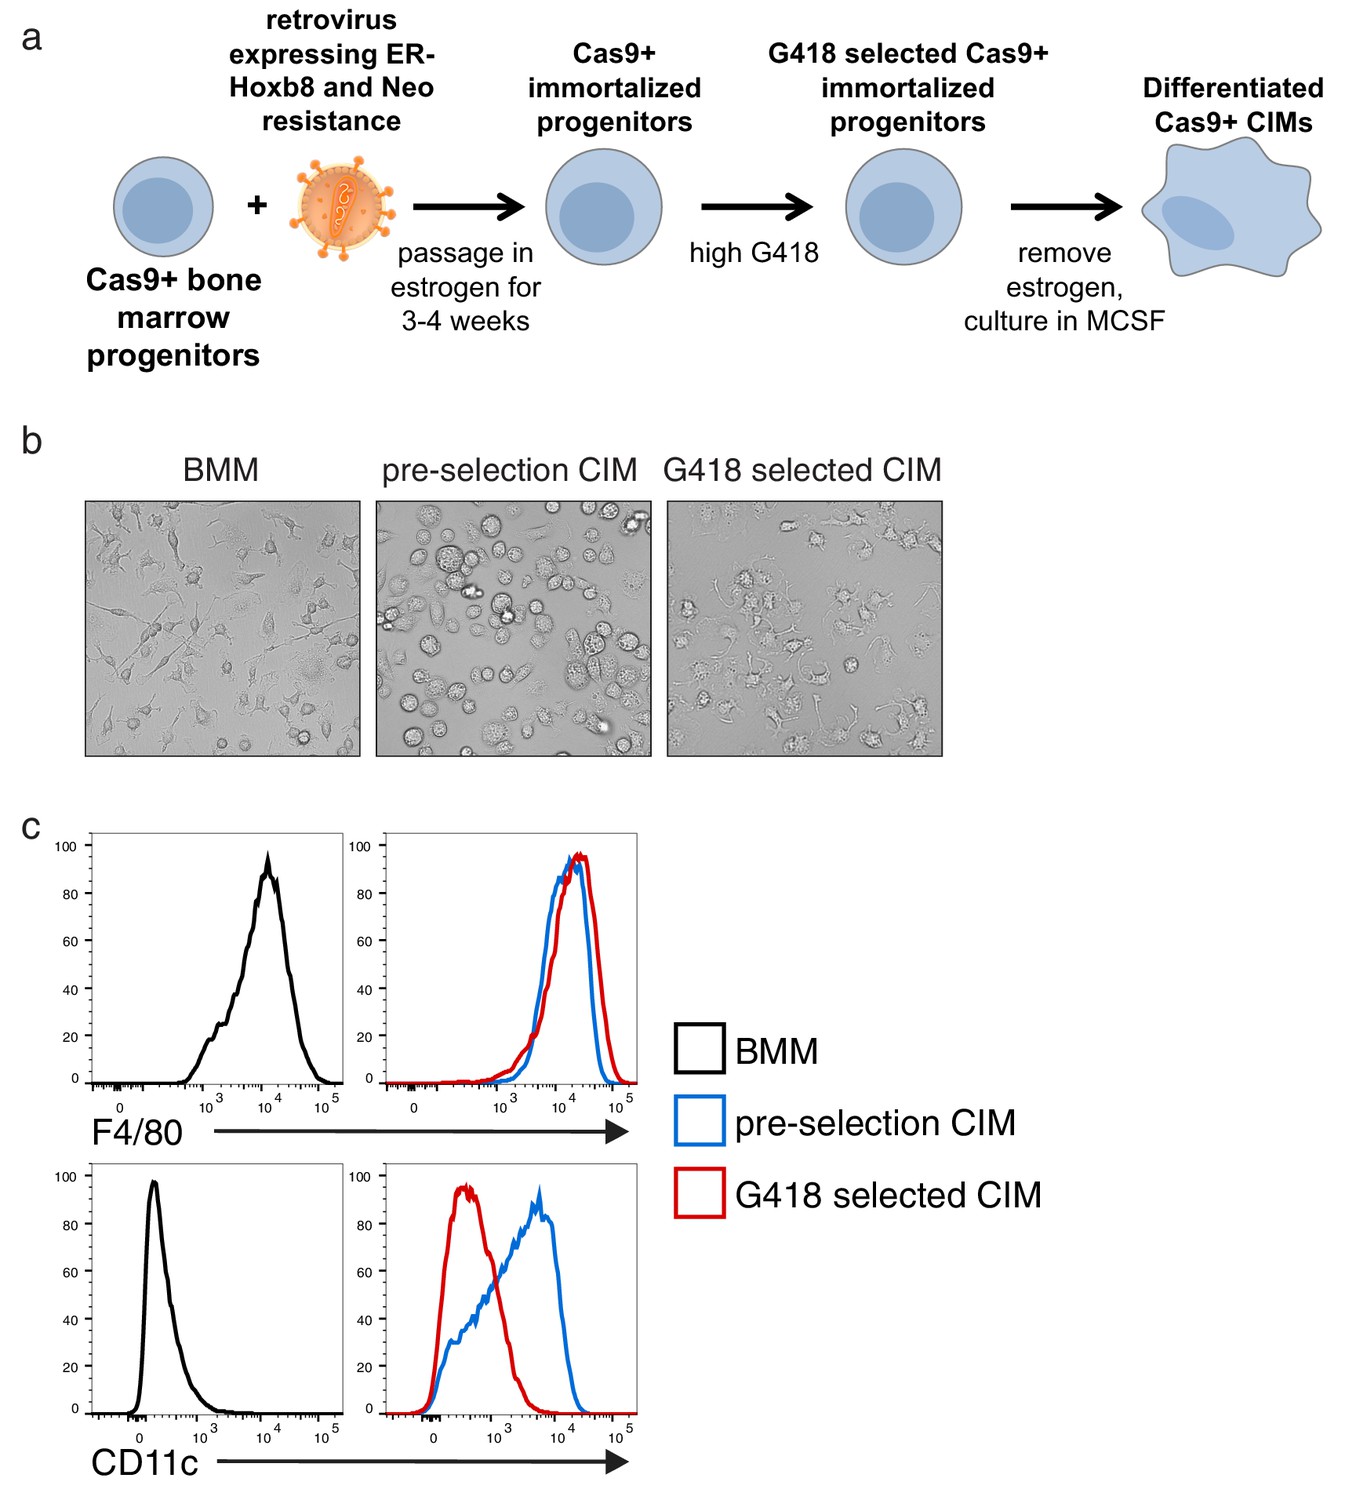
Re-selection of CIM progenitors that more closely resembled BMMs.
(a) Graphic overview of generation of Cas9+ CIMs. After generation of immortalized Cas9+ CIM progenitors, cells were re-selected with high concentrations of G418. (b) CIM morphology pre and post G418 selection. (c) BMMs or CIMs pre and post G418 selection were analyzed by flow cytometry for expression of the indicated myeloid cell markers.
Figure 2
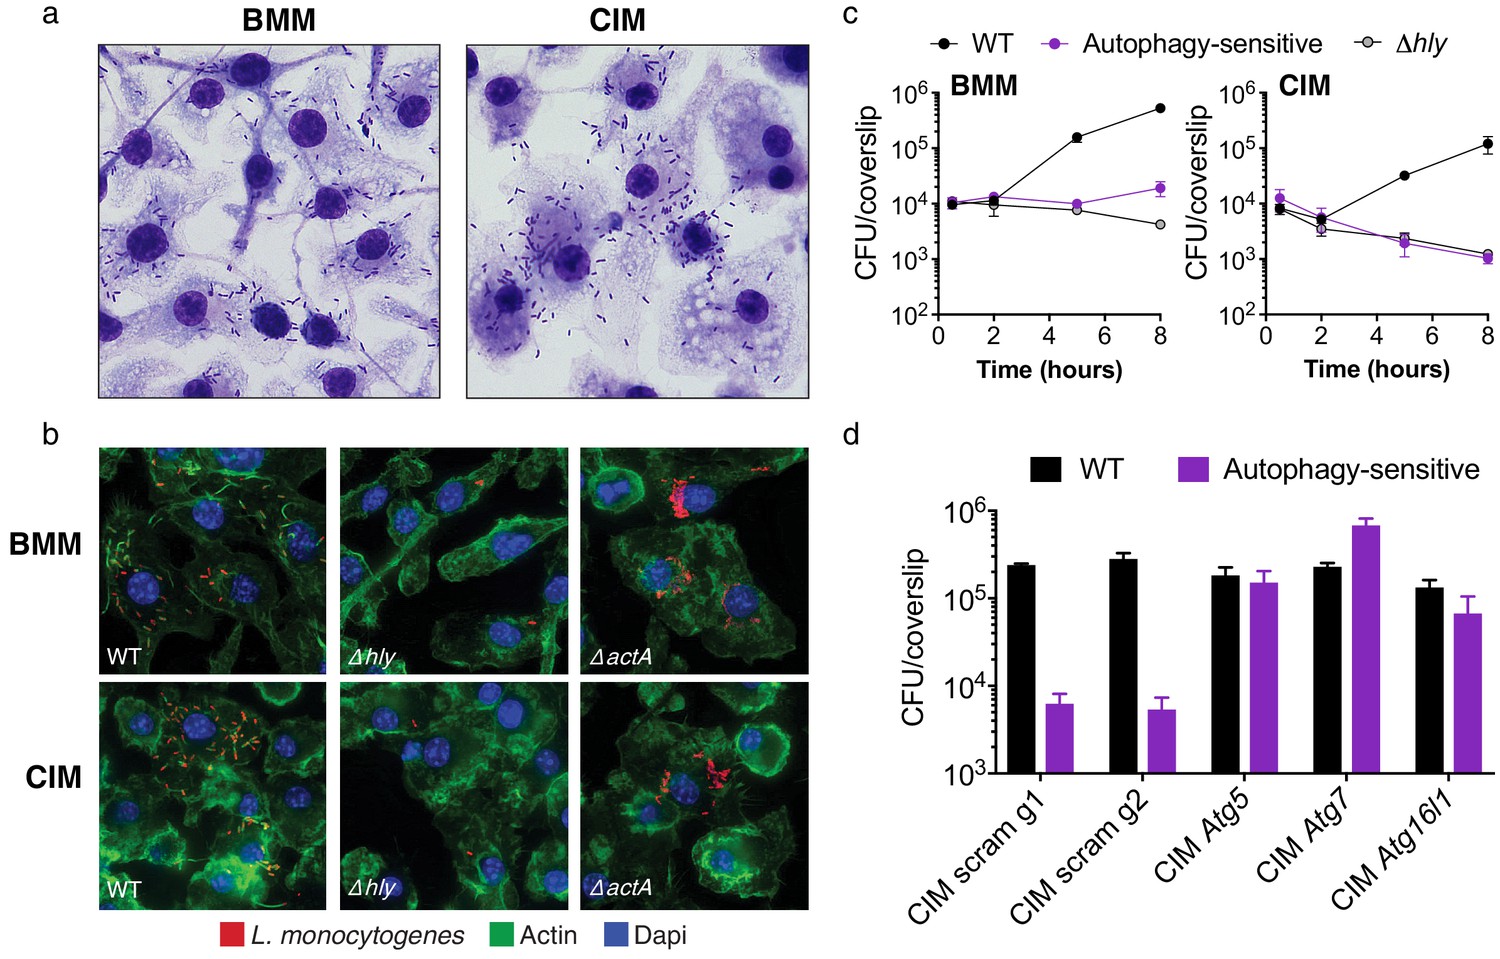
Cas9+ CIMs as an in vitro model for Listeria monocytogenes infection.
(a) BMMs (left panel) or CIMs (right) were infected with WT Listeria monocytogenes at MOI = 0.25 and monolayers were visualized with Diff-Quick stain at 8 hr post-infection. Data are representative of two independent experiments. (b) BMMs (top three panels) or CIMs (lower panels) were infected for 5 hr with three strains of L. monocytogenes: WT, Δhly, and ΔactA at MOI = 1.5. Nuclei shown in blue, bacterial cells in red, and F-actin in green. (c) BMMs (left panel) or CIMs transduced with a scramble gRNA were infected with three strains of L. monocytogenes: WT, an autophagy-sensitive strain that lacks ActA, PlcA and PlcB (Mitchell et al., 2018) and Δhly at MOI = 0.25. Bacterial densities were enumerated by CFU at t = 0.5 h and indicated hours post-infection. Data are representative of two independent experiments each performed in triplicate, mean ± SD are shown. (d) CIMs transduced with the indicated gRNAs were infected with WT L. monocytogenes or the autophagy-sensitive L. monocytogenes mutant at MOI = 0.75 and bacterial density was enumerated by CFU at t = 8 hr. Data are representative of two independent experiments each performed in triplicate, mean ± SD are shown.
Figure 3 with 1 supplement
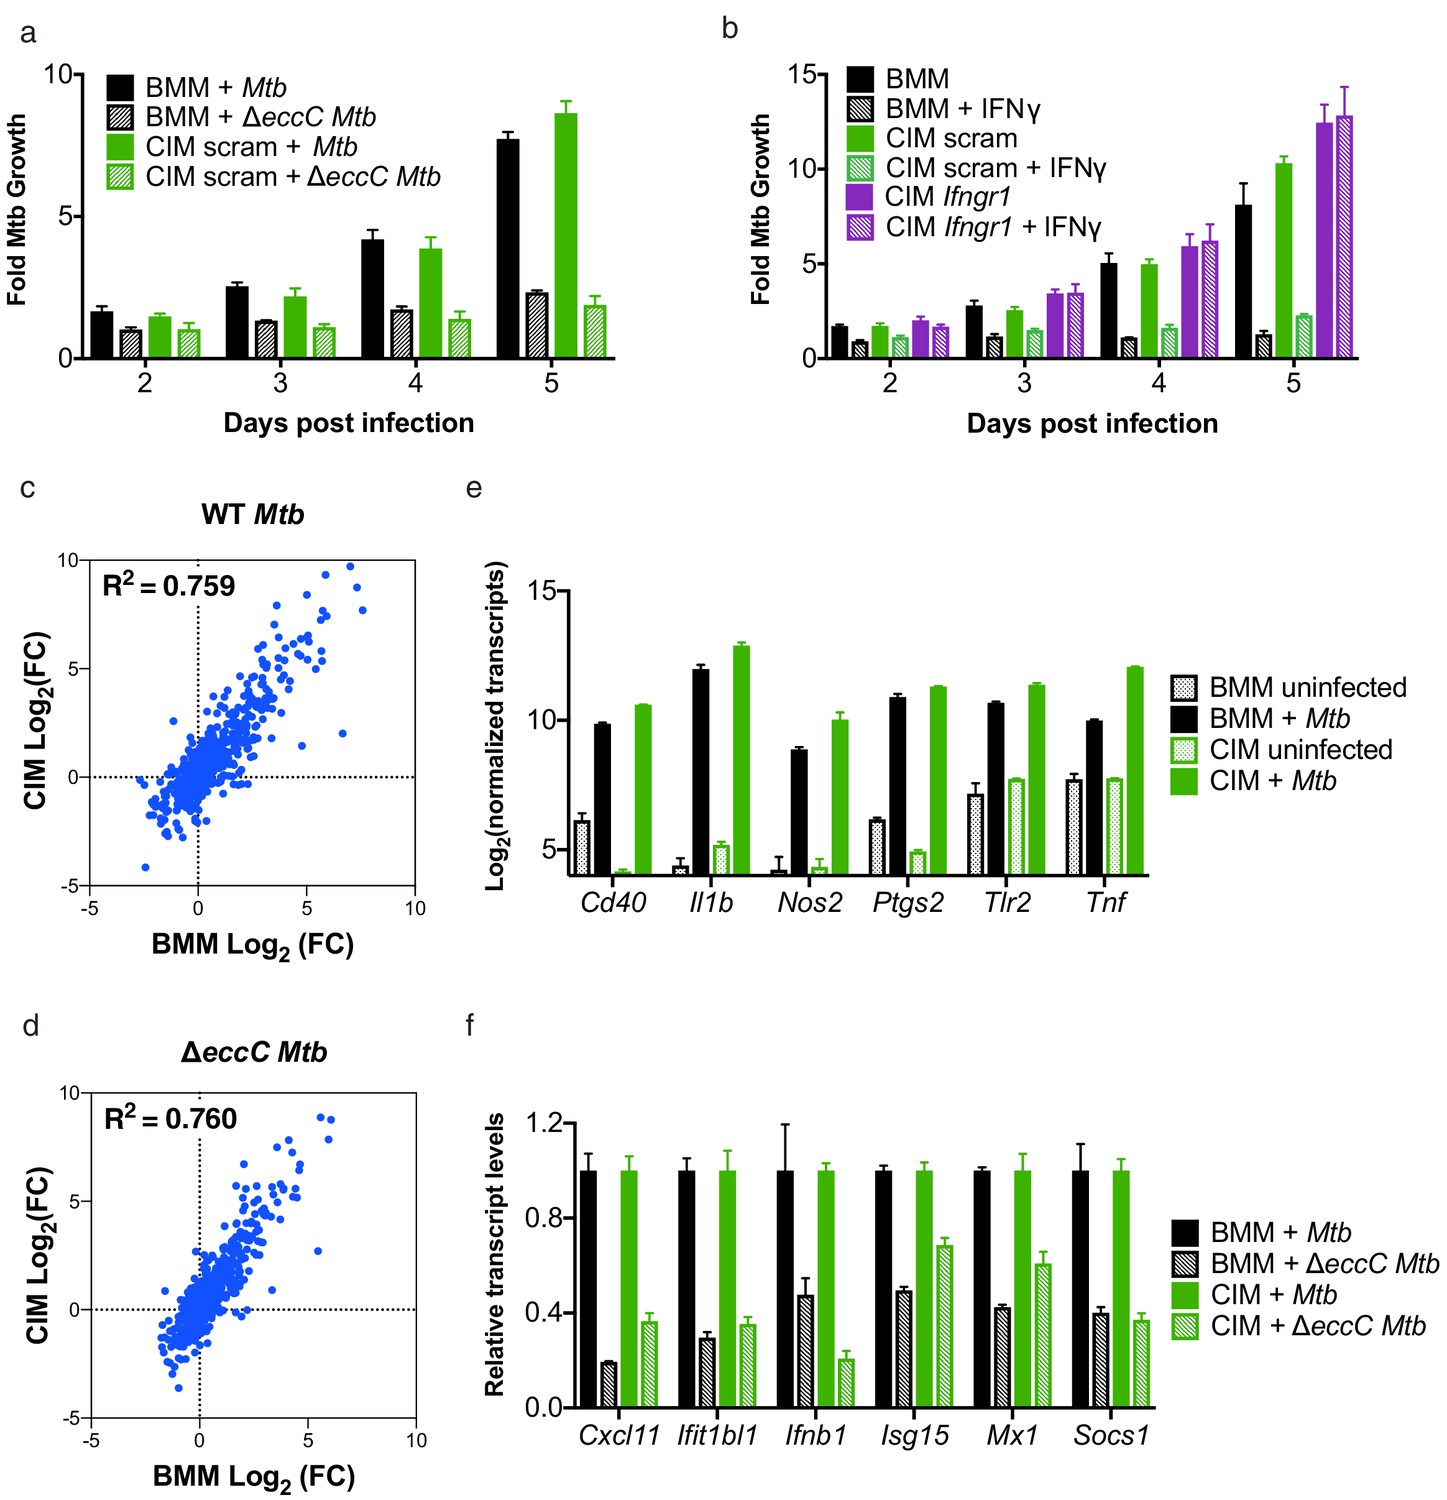
Cas9+ CIMs as an in vitro model for Mycobacterium tuberculosis infection.
(a) Luminescent bacterial growth assay. BMMs (black) vs. CIMs transduced with a scramble guide (green) were infected with M. tuberculosis-Erdman (solid bars) or a ΔeccC M. tuberculosis-Erdman strain (patterned bars) carrying the luxCDABE reporter operon at MOI = 0.5. Data are representative of two independent experiments each performed in triplicate, mean ± SD are shown. (b) Luminescent bacterial growth assay as in a, BMMs (black), CIMs transduced with a scramble guide (green), or CIMs transduced with a guide targeting Ifngr (purple) were infected with M. tuberculosis-Erdman Lux. Patterned bars indicate conditions where the different cell types were treated with IFNγ prior to and throughout infection. Fold-change in luminescence is reported as M. tuberculosis growth relative to t = 0 for each condition. Data are representative of four independent experiments each performed in triplicate, mean ± SD are shown. (c–f) mRNA levels in BMMs and CIMs, either uninfected or infected with WT (c) or ΔeccC M. tuberculosis (d) at MOI = 5 at 6 hr post infection were quantified using a Nanostring nCounter. Data are representative of two independent experiments. Source data is available as Figure 3—source data 1. c and (d) Data are presented as fold changes of infected/uninfected values of the average of technical duplicates from one experiment. (e) Log-transformed, normalized transcript counts for the indicated genes obtained from BMMs (black) vs. CIMs (green) before (patterned bars) or after infection with WT M. tuberculosis (solid bars). (f) Transcript counts for the indicated genes obtained from BMMs (black) vs. CIMs (green) infected with WT M. tuberculosis (solid bars) or M. tuberculosis ΔeccC (patterned bars). Transcripts were normalized to counts in WT M. tuberculosis infected macrophages.
-
Figure 3—source data 1
mRNA levels in BMMs and CIMs, uninfected or infected with M.
tuberculosis.
- https://doi.org/10.7554/eLife.45957.007
Figure 3—figure supplement 1

Weak correlation between gene induction by RAW 264.7 cells and BMMs or CIMs in response to M. tuberculosis.
mRNA levels in BMMs, CIMs, or RAW 264.7 cells either uninfected or infected with WT or ΔeccC M. tuberculosis at MOI = 5 at 6 hr post infection were quantified using a Nanostring nCounter. Data are from one experiment and are presented as fold changes of infected/uninfected values. Gene induction was compared between (a) untransduced CIMs vs CIMs transduced with a scramble gRNA (b) BMMs and RAW 264.7 cells and (C) CIMs and RAW 264.7 cells. Source data is available as Figure 3—source data 1.
Tables
Key resources table
| Reagent type (species) or resource | Designation | Source or reference | Identifiers | Additional information |
|---|---|---|---|---|
| Strain, strain background (M. musculus) | WT C57BL/6J | Jackson Laboratory | Stock No: 000664 | |
| Genetic reagent (M. musculus) | Rosa26-Cas9 knockin mouse | Jackson Laboratory | Stock No: 026179 | Platt et al., 2014 |
| Recombinant DNA reagent | ER-Hoxb8-MSCV-Neo | Wang et al., 2006 | ||
| Recombinant DNA reagent | pLentiGuide-Puro | Addgene | 52963 | |
| Recombinant DNA reagent | lenti-sgRNA hygro | Addgene | 104991 | |
| Strain, strain background (M. tuberculosis) | Erdman strain | BEI Cat # NR-15404 | ||
| Genetic reagent (M. tuberculosis) | ΔeccC (Erdman, ΔeccCa1-ΔeccCb1) | Rosenberg et al., 2015 | ||
| Genetic reagent (M. tuberculosis) | Lux (Erdman expressing the luxCDABEoperon) | Braverman et al., 2016 | ||
| Genetic reagent (M. tuberculosis) | ΔeccC Lux | Penn et al., 2018 | ||
| Strain, strain background (L. monocytogenes) | 10403S strain | PMID: 24667708 | ||
| Genetic reagent (L. monocytogenes) | ΔactA | PMID: 10931865 | DP-L3078 | |
| Genetic reagent (L. monocytogenes) | Δhly | PMID: 7960143 | DP-L2161 | |
| Genetic reagent (L. monocytogenes) | ΔactA PlcAH86APlcBH69G | Mitchell et al., 2018 | DP-L6586 | |
| Commercial assay or kit | nCounter Mouse Myeloid Innate Immunity Panel | NanoString |
Additional files
-
Supplementary file 1
List of gRNA sequences and primers used to determine editing efficiency.
- https://doi.org/10.7554/eLife.45957.008
-
Transparent reporting form
- https://doi.org/10.7554/eLife.45957.009
Download links
A two-part list of links to download the article, or parts of the article, in various formats.
Downloads (link to download the article as PDF)
Open citations (links to open the citations from this article in various online reference manager services)
Cite this article (links to download the citations from this article in formats compatible with various reference manager tools)
Cas9+ conditionally-immortalized macrophages as a tool for bacterial pathogenesis and beyond
eLife 8:e45957.
https://doi.org/10.7554/eLife.45957


