Impact of precisely-timed inhibition of gustatory cortex on taste behavior depends on single-trial ensemble dynamics
- Brandeis University, United States
Figures
Figure 1
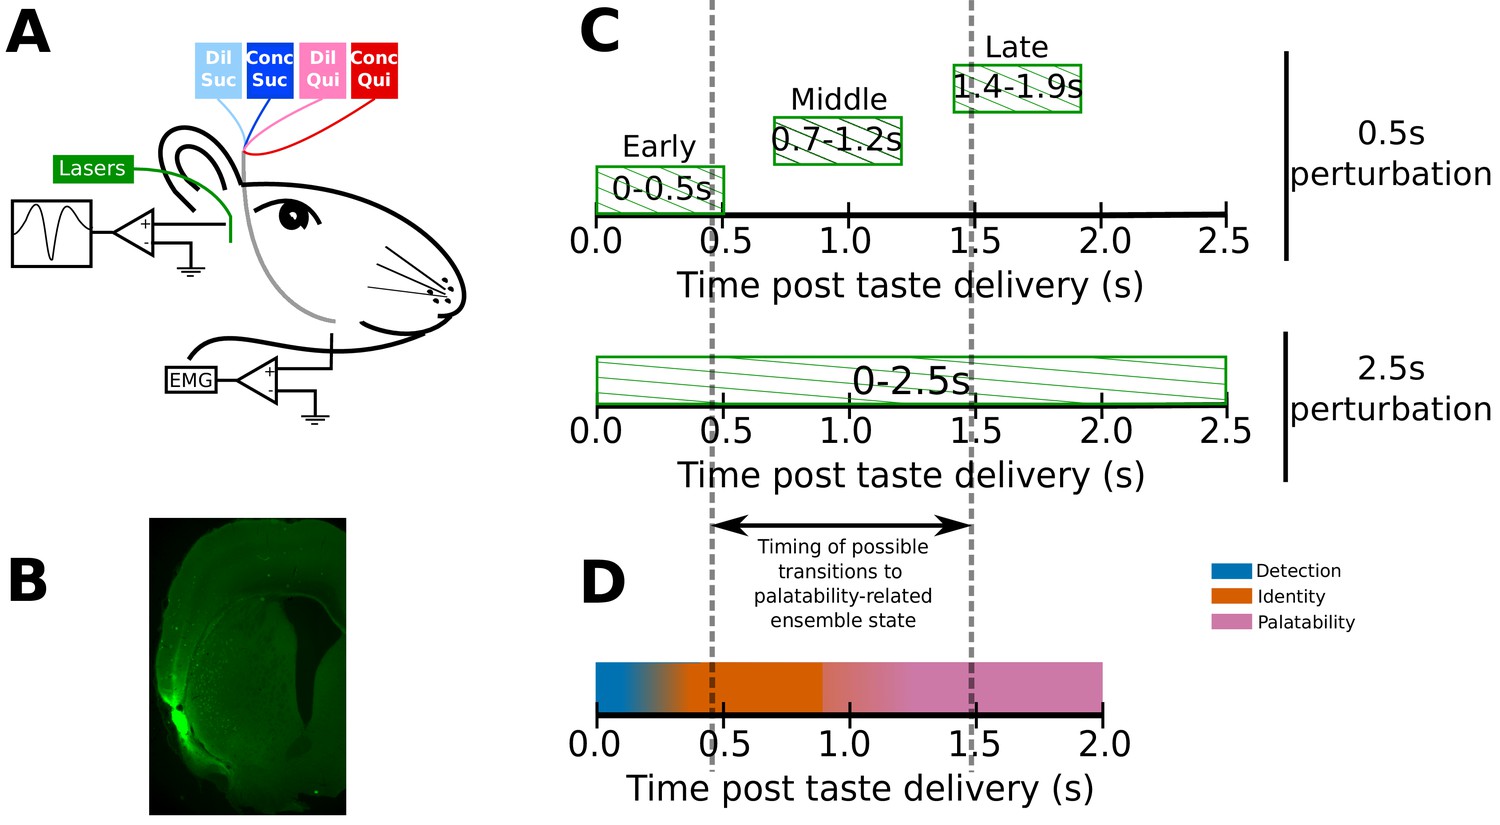
Experimental paradigm.
(A) 4–6 weeks after receiving surgeries for virus injections, rats were implanted with opto-trodes and EMG electrodes. Post recovery, they were given intra-oral infusions of Dil Suc (30mM Sucrose), Conc Suc (300mM Sucrose), Dil Qui (0.1mM Quinine-HCl) and Conc Qui (1mM Quinine-HCl), and ArchT-expressing GC neurons were briefly inhibited by green (532 nm) laser light. (B) Coronal slice from a subject, showing ArchT expression (visualized by the GFP tag) localized in gustatory cortex (GC). A small lesion, left by the tip of the opto-trode is visible in the middle of the GFP expressing region, and had no general impact on behavior (see below). (C) Inhibition protocol used in the study: two types of optogenetic perturbations, short (0.5s) or long (2.5s), were delivered in separate experimental sessions. Short perturbations were delivered at one of three possible time points on any individual trial, and are referenced as follows in the text: (1) 0–0.5s - early 0.5s perturbations, (2) 0.7–1.2s - middle 0.5s perturbations, and (3) 1.4–1.9s - late 0.5s perturbations. Not shown, but delivered in all sessions, were control trials with no perturbations. Grey dashed lines mark the approximate range of the ensemble transitions to palatability/decision-related firing. (D) A schematic of the temporal structure of single-neuron coding across the first 2.0s of taste responses in GC. Immediately following taste presentation, responses are nonspecific, indicating only the presence of fluid on the tongue (‘detection’ epoch, in teal). The next two temporal epochs of GC firing are taste specific: the first codes the physio-chemical identity of the stimulus (‘identity’ epoch, in orange); following a transition (that can happen anywhere between 0.5–1.5s post stimulus on individual trials, see grey dashed lines, and on average happens midway through this period) firing rates change to reflect palatability and the upcoming consumption decision (‘palatability’ epoch, in pink).
Figure 2
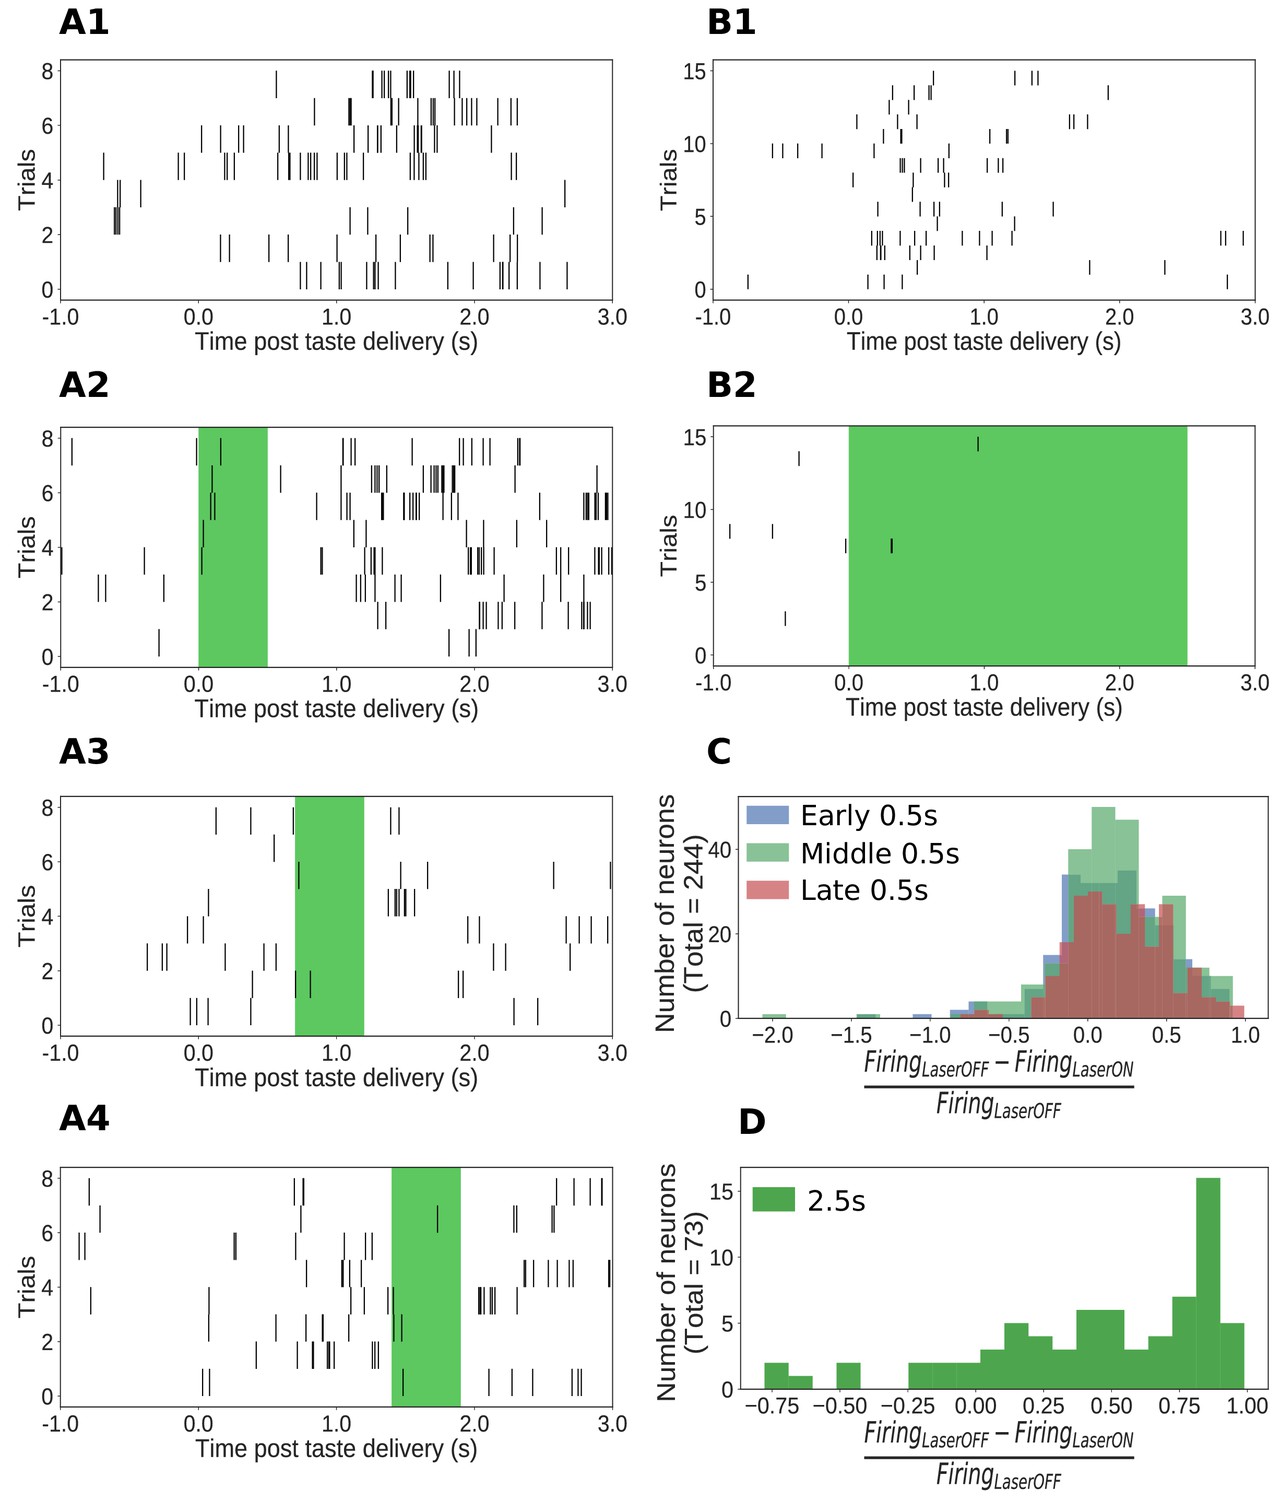
Impact of ArchT-mediated optogenetic perturbation on GC neurons.
(A1-A4) Rasters of spiking in an example single GC neuron in a 0.5s perturbation session; each hash mark is an action potential. Activity is robustly suppressed during laser stimulation. (B1-B2) Analogous data from an example single GC neuron in a 2.5s perturbation session, also showing clear inhibition during laser stimulation. (C) Histogram of changes in firing rates (plotted as a fraction of the firing rate on control trials, x-axis) produced by 0.5s perturbations across the entire sample (y-axis = number of neurons). The majority of neurons show robust firing suppression when perturbed (fraction > 0), but a small group of neurons actually increased their firing rates in response to perturbation, presumably due to network-level effects (fraction < 0). (D) Analogous histogram of changes in firing rate produced by 2.5s perturbation. Almost all neurons were affected by the perturbation: the large majority are suppressed, but a small minority show elevated firing rates in response to perturbation.
Figure 3
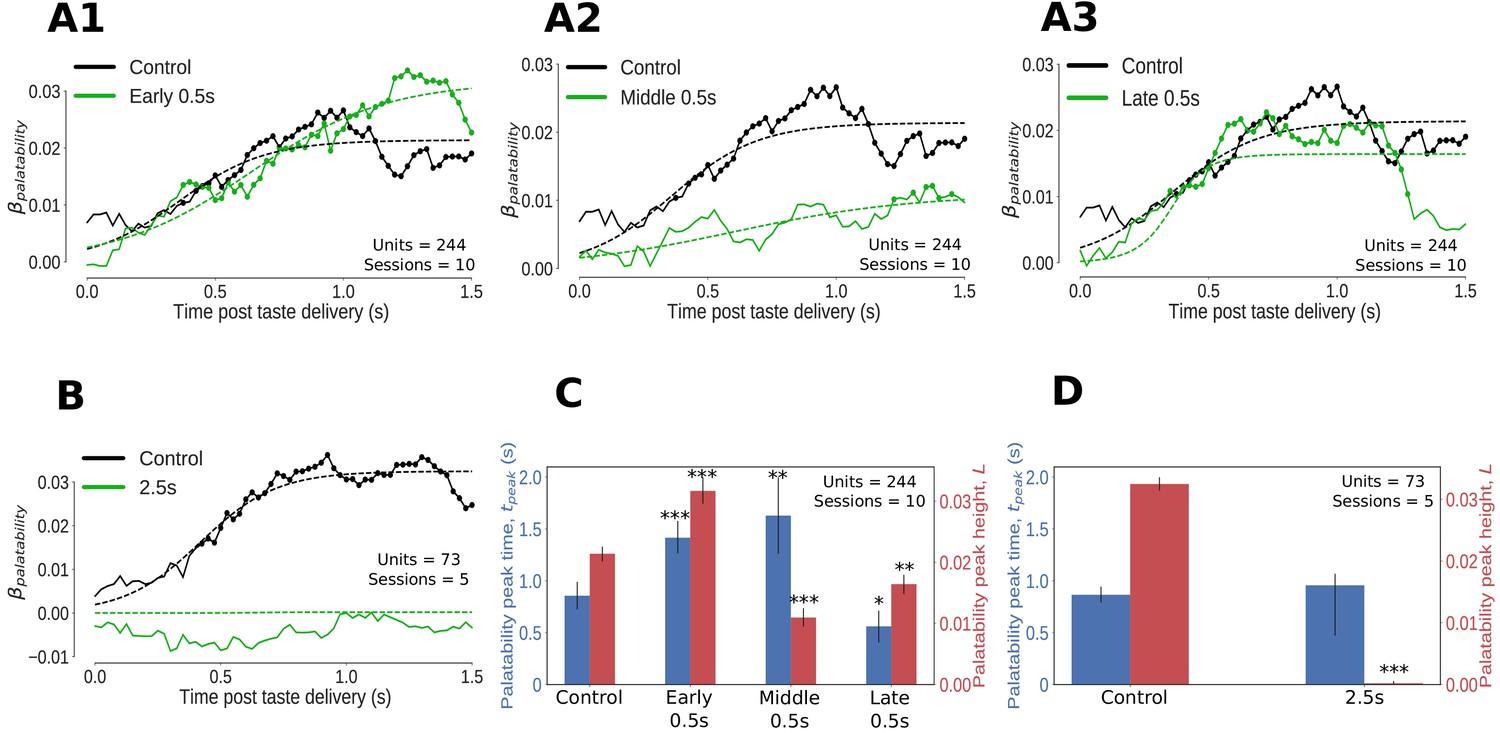
Impact of optogenetic perturbations on palatability relatedness of the firing of GC neurons.
(A, B) Coefficients (palatability-relatedness, y-axis) obtained from the regression of trial-averaged firing rates on palatability ranks of the taste stimuli across time (x-axis). The solid lines depict the mean regression coefficient across time for the entire data sample; coefficients significantly different from 0 at the 1% level are marked by dots. The dashed lines are logistic sigmoid fits for each condition. A1-A3 display the impact of 0.5s perturbations beginning at 0 (early), 0.7 (middle) or 1.4s (late) on palatability-related firing in GC; B shows the analogous graph for 2.5s perturbations of GC neurons - disruption of GC firing for 2.5s wipes out the entirety of the palatability response. (C, D) The post-stimulus latency (blue bars and y-axis) and height (red bars and y-axis) of the peak (95% of the asymptote) of the sigmoid fits in A, B. Error bars denote 95% Bayesian credible intervals; each optogenetic condition was compared with control (laser-off) trials from the same sessions (first pair of bars in both figures) and statistically significant differences are marked with asterisks (*: p<0.05, **: p<0.01, ***: p<0.001). (C) On control (no-laser) trials, GC neurons asymptote to peak palatability firing ∼0.8s post stimulus. Early and middle 0.5s perturbations delay the peak of palatability firing by ∼0.5s; the magnitude of this peak, however, is the smallest for the middle perturbation. Late 0.5s perturbations, beginning after palatability-related firing has mostly subsided, produce a small change in the magnitude and timing of its peak compared to control trials - though significant, this minor shift in peak palatability firing can be entirely attributed to the decrement in the palatability index only after the laser is switched on at 1.4s (A3). (D) During 2.5s perturbation sessions, GC neurons asymptote to peak palatability firing ∼0.8s post stimulus on control trials where the lasers are off, just like the 0.5s control. The 2.5s perturbation, by disrupting the palatability response completely, is fit by a flat sigmoid whose peak magnitude overlaps 0, although the latency to peak is similar to that of control (no-laser) trials.
Figure 4

Bayesian spectrum analysis (BSA) of anterior digastric EMG recordings - probability of gaping calculated in terms of the total posterior probability of 4–6Hz movements.
(A1-A2) Two representative Conc Qui trials. The animal’s mouth movements can be seen as bursts of higher-amplitude (y-axis) EMG activity (blue) following taste delivery - the onset of gaping, as detected on video, is marked. The time series of the envelope of the EMG signal (black line) are the data subjected to BSA. (B1-B2) Result of BSA brought to bear on a pair of individual Conc Qui trials. The calculated probability of gaping (y-axis, black lines) matches up with individual gapes (grey vertical hash marks) picked by a previously published quadratic classifier that achieved 75% accuracy. (C1-C2) The trial-averaged probability of gaping (across a set of no-laser control trials) calculated with BSA (solid line) matches up with the peri-stimulus ‘gaping rate’ produced from the gapes identified by the quadratic classifier (dotted line, same set of control trials) in response to both Dil Qui (C1) and Conc Qui (C2). While correlating well with the quadratic classifier, BSA avoids multiple pitfalls of that technique (and is easier to apply, see Materials and methods). (D) The probability of gaping calculated with BSA rises reliably just before the first gape, detected either on video (black) or by the quadratic classifier (grey). The black dashed line (0 on the x axis) indicates the time of the first gape. (E) KL divergence between the probability of gaping to Conc and Dil Qui (higher values indicate larger differences in their gaping distributions, same trials as in (C1, C2). As expected, the distributions of gaping probability on Conc and Dil Qui trials are initially similar (while non-specific investigative licks happen) and diverge out at ∼1s post stimulus once gaping begins. (F) The cumulative sum of the KL divergence in E across time. The jump in KL divergence around the mean onset time of gaping is seen as a change in slope of its cumulative sum. We fit two straight lines to the cumulative sum and pick their intersection as the mean onset of gaping across this set of trials.
Figure 5
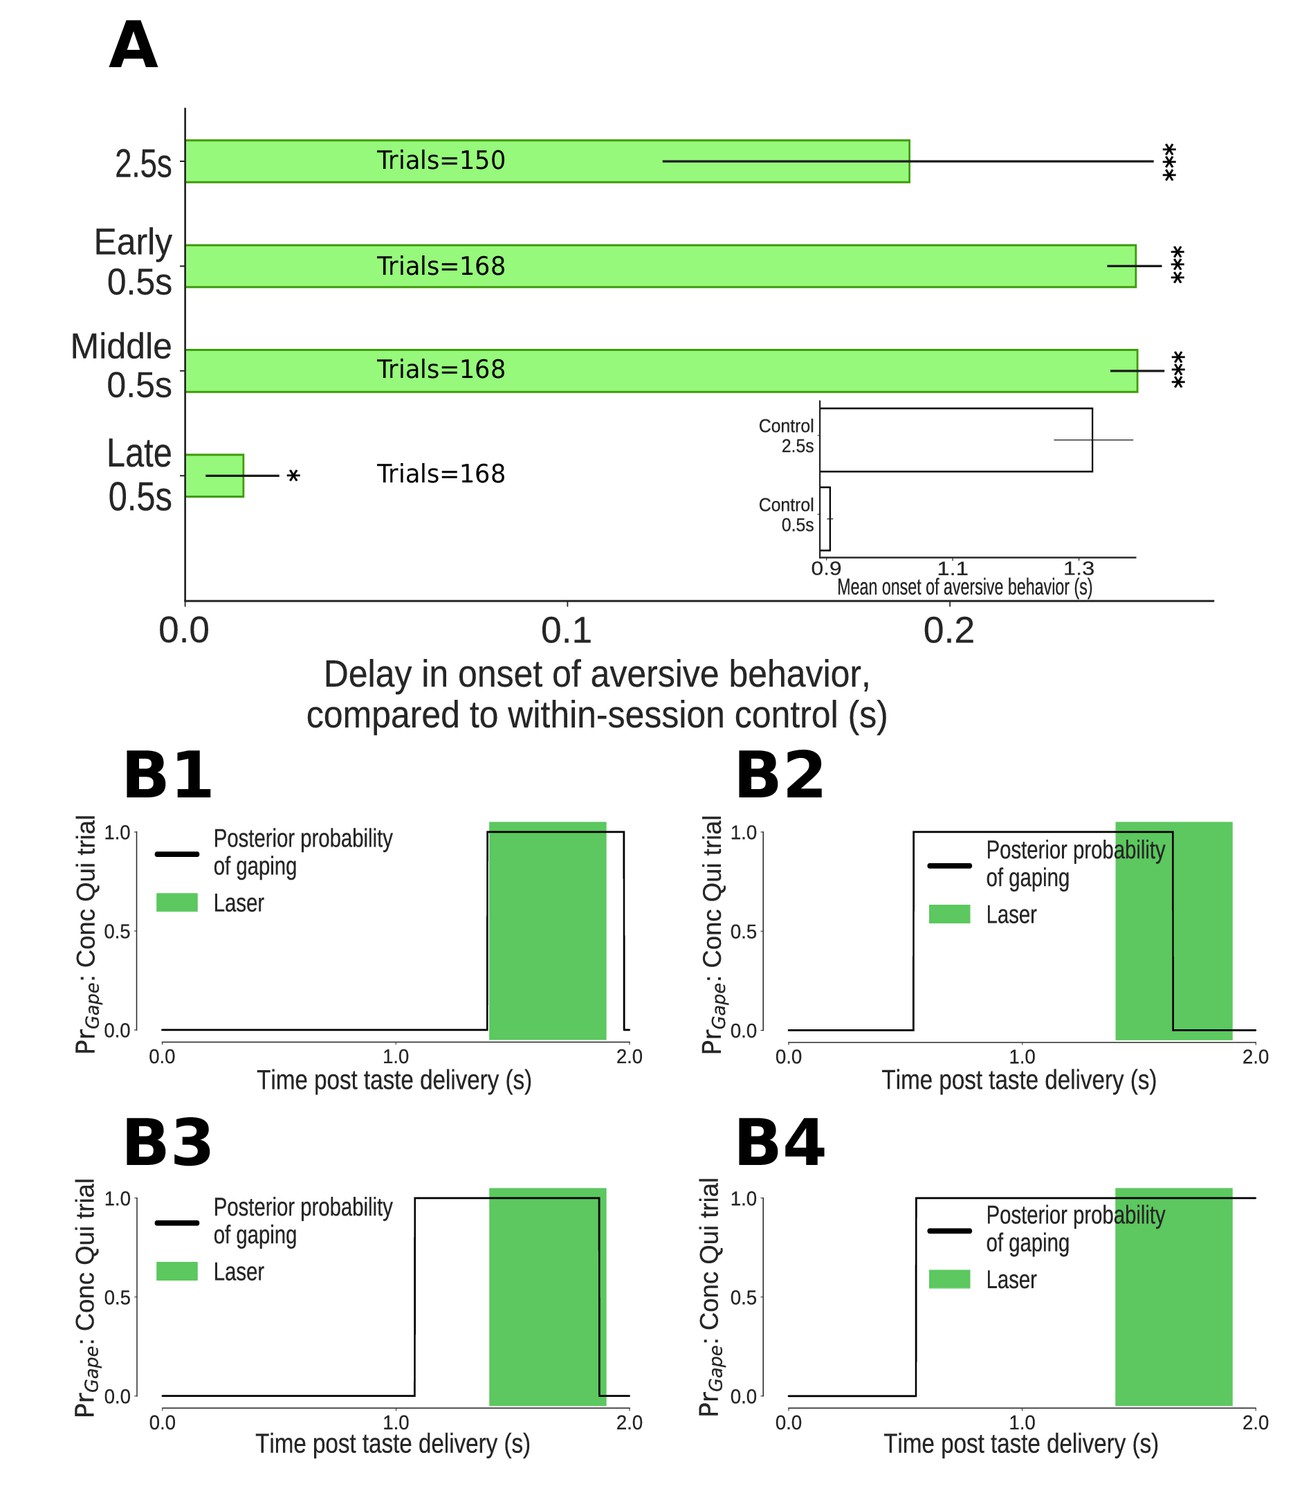
The impact of 0.5s perturbations of GC neurons on gaping (4–6Hz aversive orofacial behaviors) depends on when they were delivered.
(A) Onset times of gaping under different perturbation conditions, reported as delay in onset times compared to control (no-laser) trials from the same sessions. The x-axis presents the mean delay in gape onset times compared to control trials; the extent of their 95% Bayesian credible intervals are shown by the error bars. We indicate statistically significant delays with asterisks (*: p<0.05, **: p<0.01, ***: p<0.001). Early and middle 0.5s perturbations of the taste response delay the onset of gaping (to the same degree as 2.5s perturbation). Late 0.5s perturbations of GC neurons produce a minor (but marginally significant) delay in the onset of gaping. (A, Inset) Latency of gaping in control (no-laser) trials in 0.5s and 2.5s perturbation sessions. The 2.5s controls show a delayed onset, likely due to lasting effects of the (relatively) long optogenetic perturbation. (B1-B4) Four representative Conc Qui trials with late 0.5s perturbations (1.4–1.9s post taste delivery). On each of these trials, the probability of 4–6Hz aversive orofacial responses is unaffected by the onset of the laser, confirming that GC perturbation fails to disrupt ongoing bouts of gaping.
Figure 6
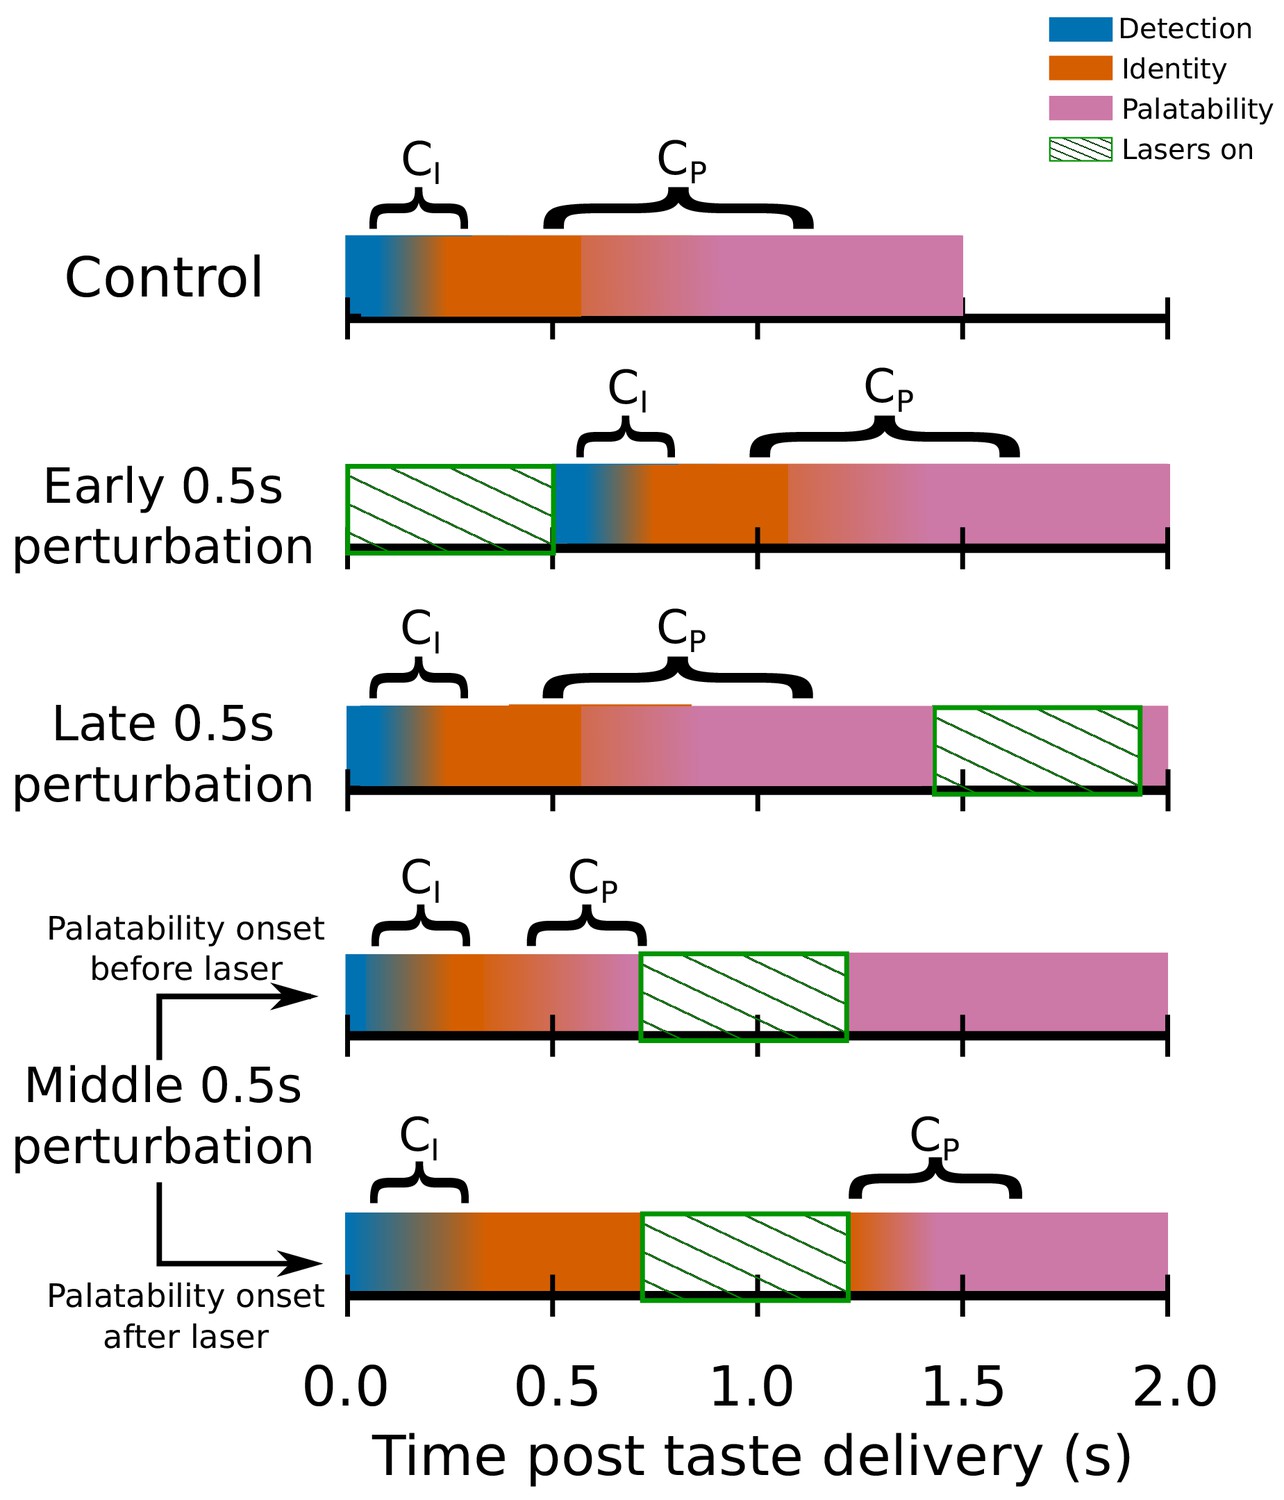
Switchpoint model of GC ensemble responses to tastes, which were assumed (on the basis of our previous work) to consist of 3 states of population firing as follows: (1) Detection: a brief, initial state of nonspecific responses with identical population distributions of activity for each tastant in our battery; (2) Identity: responses related to the chemical identity of the taste stimulus with two population firing rate distributions, one each for Suc and Qui; (3) Palatability: population firing rich in palatability and consumption-decision related information with four population distributions of activity, one for each of the four tastants in our stimulus battery.
, the first change point in the model denotes the shift from detection to identity firing, while marks the transition between the identity and palatability-related ensemble states. The fact that both and have massive trial-to-trial variability is denoted by the colors for each of the three states gradually blending across time. The model assumed that and could not occur during the optogenetic perturbation of GC (denoted by periods of green diagonally hatched regions): each row shows how the search for change points is hypothesized to be impacted by GC perturbation; note the two distinct possibilities with regard to middle 0.5s perturbation (lasers on from 0.7s to 1.2s post stimulus) trials.
Figure 7
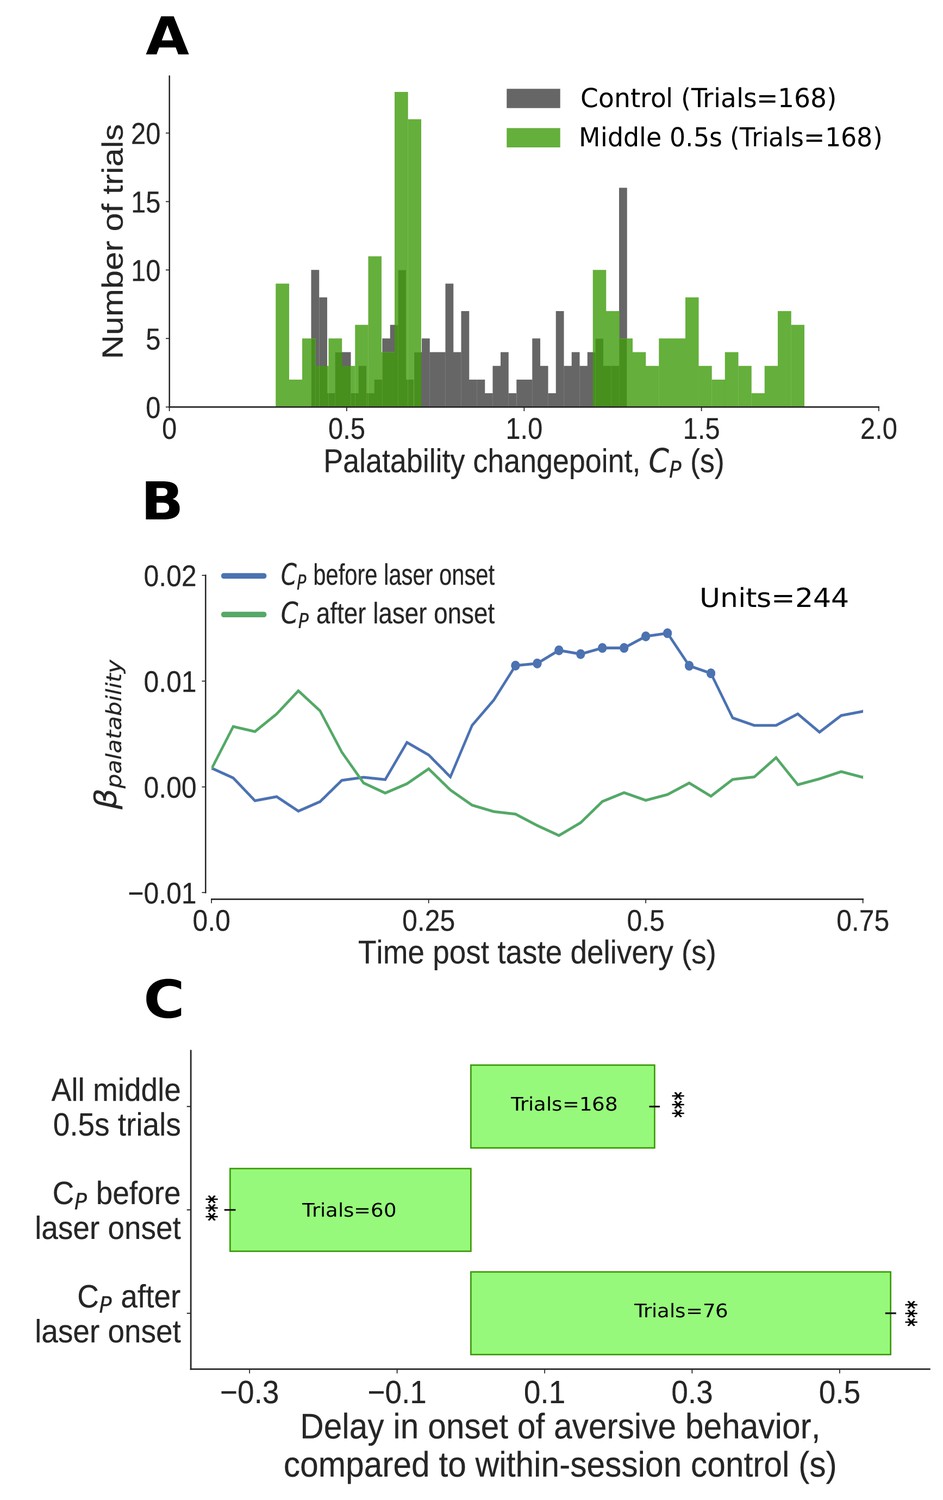
The impact of middle 0.5s perturbation (0.7–1.2s post taste delivery) on GC neural activity and aversive orofacial behavior varies from trial to trial, depending on the progress of taste dynamics.
(A) Distribution of change-points into the palatability-related ensemble state () identified in Qui trials (in green). We could not examine the time period of perturbation, from 0.7s to 1.2s, because firing during this period was deeply confounded by laser-induced inhibition: as we concatenated the pre- and post-perturbation periods, an abnormally large number of change points (mostly artifacts, see text for details) are localized to the time of splicing (compare to change points identified in control trials, in grey). Due to these artifacts, we ignored trials with change points within 50ms of laser onset (i.e, between 0.65s and 0.7s). (B) Correlation (quantified in terms of coefficient of regression) of trial-averaged firing rates of GC neurons with palatability of the taste stimuli in two subsets of trials - those in which the ensemble transition into palatability-related firing () was identified to have occurred prior to perturbation (blue line), and those in which it did not (green line). Coefficients significantly different from 0 at the 5% level are marked by dots; these coefficients differ from 0 only within the trials in which the palatability-related ensemble state appeared before the onset of perturbation. (C) The impact of middle 0.5s perturbation on the onset of aversive orofacial behavior, quantified in terms of the delay of behavior onset compared to control trials within the same session (x-axis) (*: p<0.05, **: p<0.01, ***: p<0.001). The top bar, which is all middle 0.5s perturbations aggregated, is repeated from Figure 5A. The middle 0.5s perturbation delays the onset of gaping, but only if it begins before the palatability-related ensemble transition (measured by the palatability change point, ) - in fact, on trials where palatability information appears before the laser has been switched on (i.e, before 0.65s), gaping begins earlier than on control trials (as expected, see text).
Additional files
-
Transparent reporting form
- https://doi.org/10.7554/eLife.45968.009
Download links
A two-part list of links to download the article, or parts of the article, in various formats.
Downloads (link to download the article as PDF)
Open citations (links to open the citations from this article in various online reference manager services)
Cite this article (links to download the citations from this article in formats compatible with various reference manager tools)
Impact of precisely-timed inhibition of gustatory cortex on taste behavior depends on single-trial ensemble dynamics
eLife 8:e45968.
https://doi.org/10.7554/eLife.45968


