Skin vasculature and hair follicle cross-talking associated with stem cell activation and tissue homeostasis
- Cornell University, United States
Figures
Figure 1 with 1 supplement
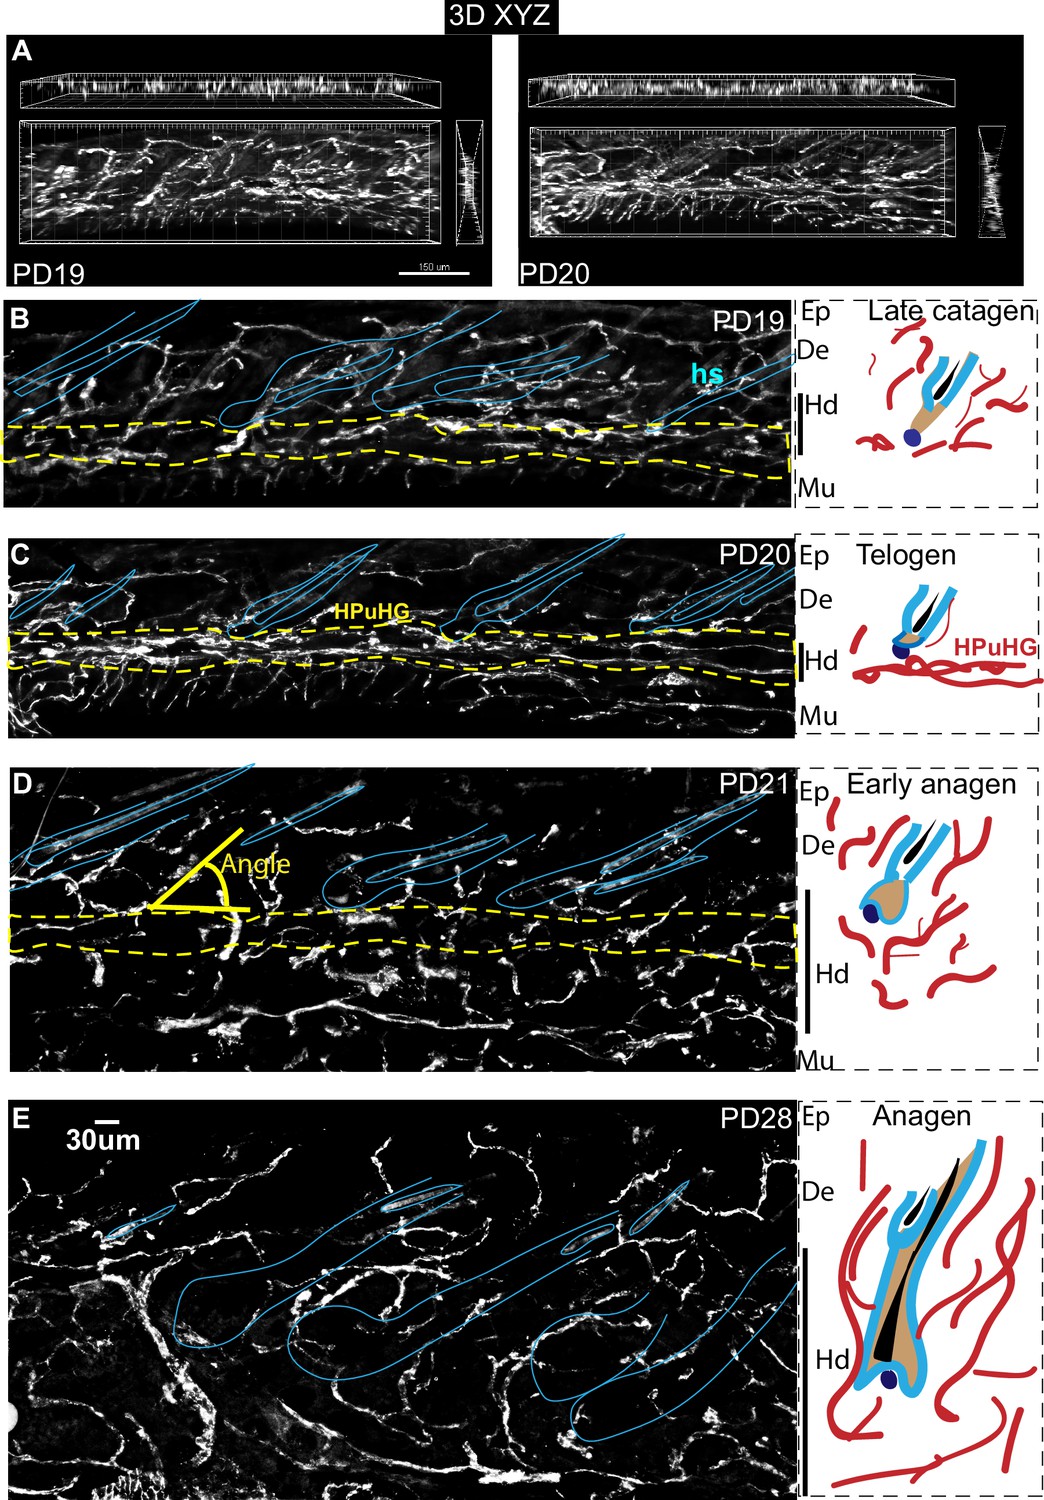
Transient horizontal plexus under hair germ (HPuHG) precedes hair follicle stem cell activation in hair cycle.
(A–E). CD31 images using widefield fluorescence microscopy, with optical Z-stacks and deconvolution from 70 µm thick skin sections, shown as maximal projection images. Yellow-dotted line indicates the region of HPuHG. Solid yellow line shows the angle of vasculature branch relative to the epidermis. Corresponding region of epidermis (Ep), dermis (De), hypodermis (Hd), and muscle (Mu) are noted immediately on the right of each microscopic image. This demarcation is apparent in images prior to DAPI channel splitting and contrasting in Photoshop. Both the hair follicles and old hair shafts which show non-specific signal in antibody staining of skin were highlighted with light blue line. Panels on right show schematic of the hair cycle stage, which was extracted from DAPI staining of these skin sections (not shown) and from analysis of adjacent thin sections from the same mice (Figure 1—figure supplement 1, left panels). The hair cycle stages were confirmed by Ki67 and caspase staining of samples from adjacent skin sections (Figure 3 and Figure 1—figure supplement 1, right panels). In cartoons red cables represent schematic of vasculature arrangement that reveal dense horizontal plexus under the hair germ (HPuHG) at telogen. The number of mice analyzed per stage is shown in Figure 2. Ep, Epidermis. De, Dermis. Hd, Hypodermis. Mu, Muscle.
Figure 1—figure supplement 1
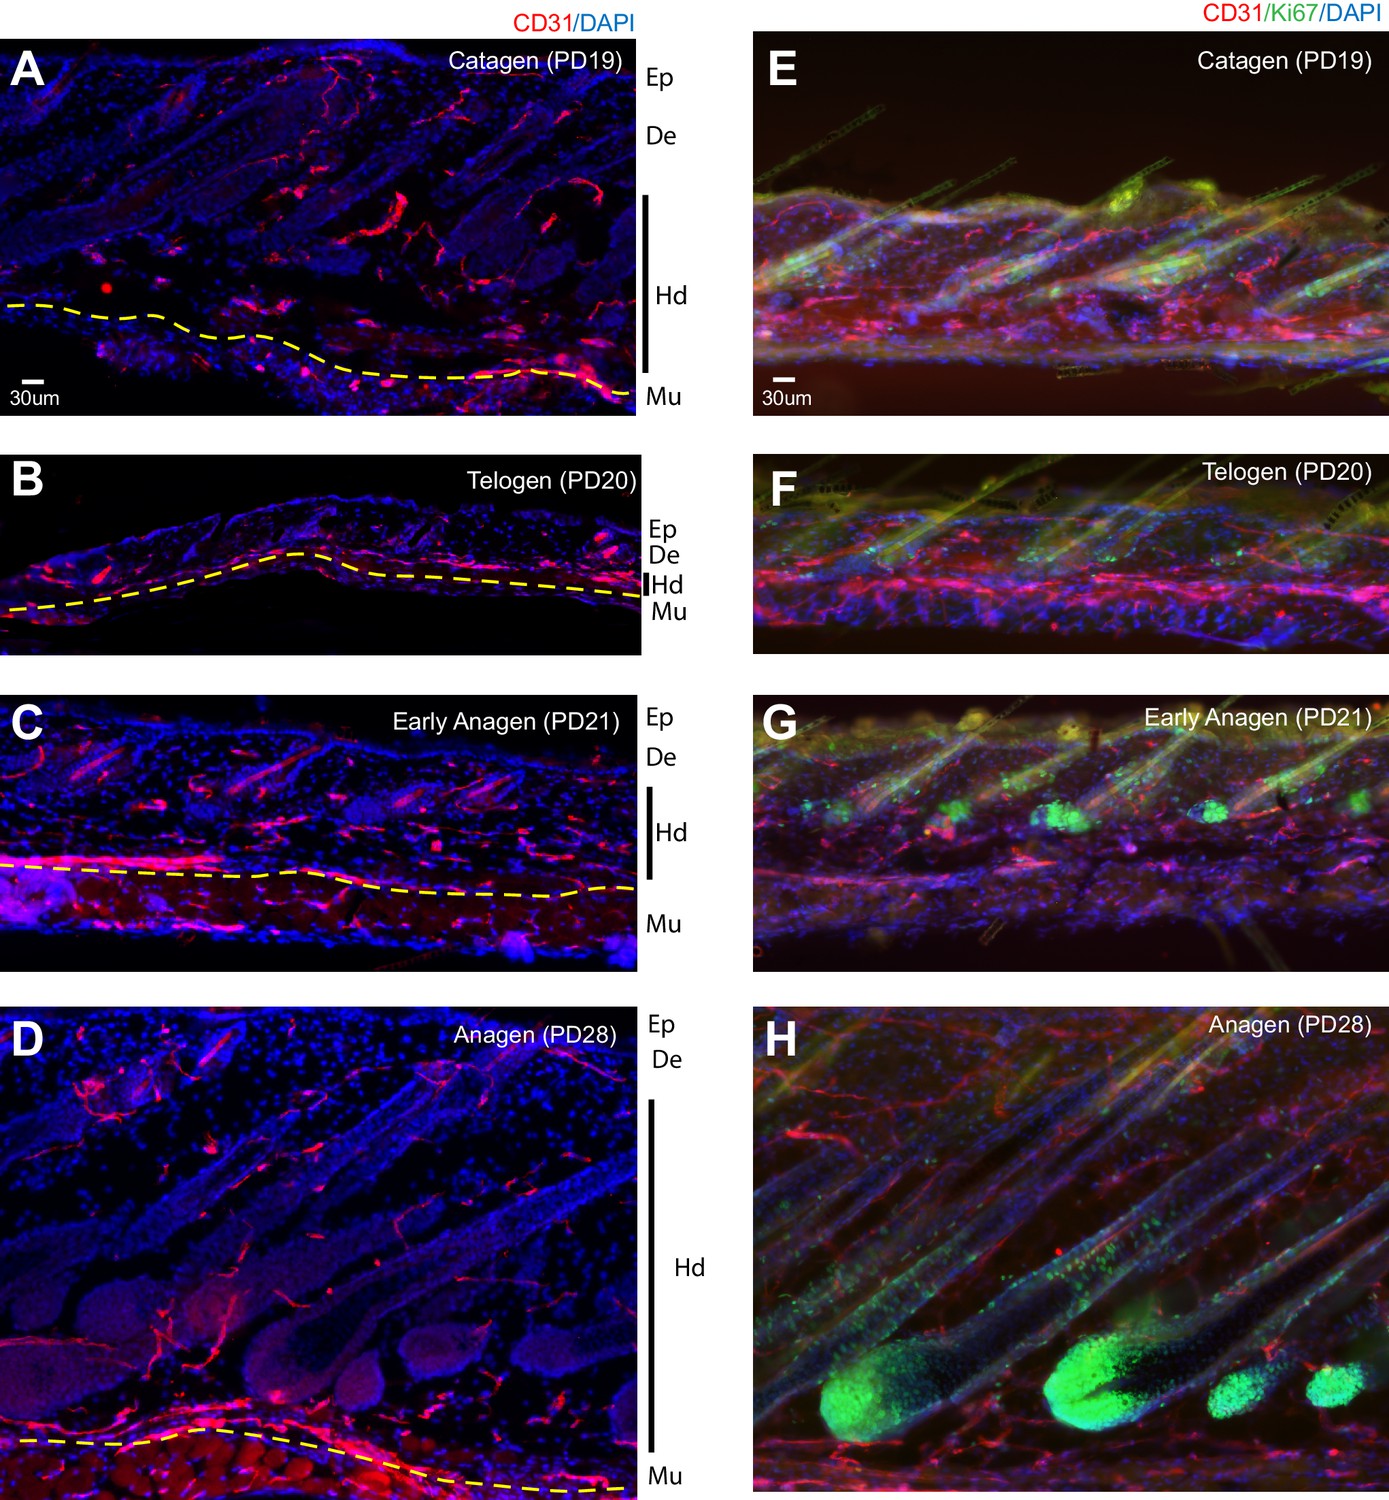
Imaging of thin and thick skin sections reveals remodeling of vasculature at different hair cycle stages.
(A–D) Wide field microscopy images of 10 µm skin sections from wild type C57/Bl6 mice at ages and hair cycle stages indicated, stained for endothelial marker CD31 and DAPI for nuclei. Ep, epidermis; De, dermis; Hd, hypodermis; Mu, muscle. (E–H) Wide field microscopy images of 70 µm skin sections from wild type C57/Bl6 mice at ages and hair cycle stages indicated, stained with endothelial marker CD31, proliferation marker Ki67, and Dapi for nuclei.
Figure 2
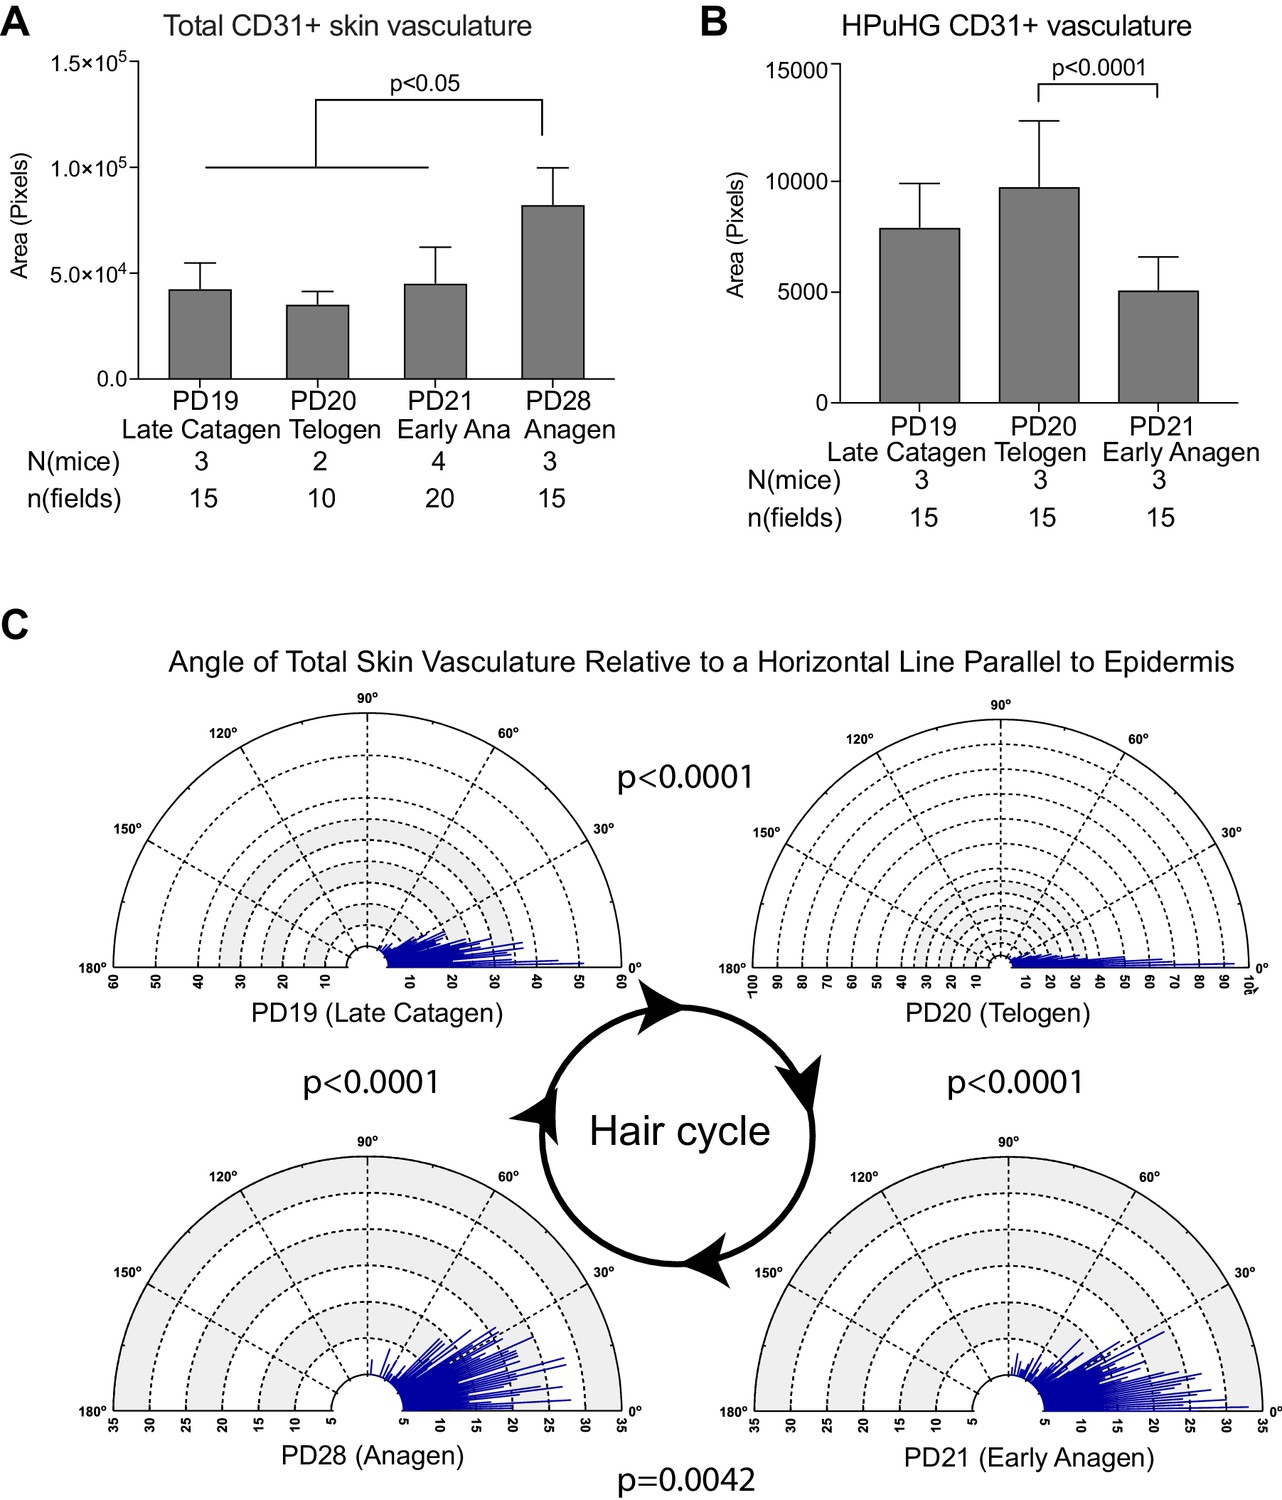
Quantification of CD31+ skin vasculature organization during hair cycle.
(A) Quantification of total CD31+ area per skin field at different hair cycle stages (as shown in Figure 1) shows significant increase of vasculature at anagen. The total CD31+ area is defined by outlining CD31+ area in dermis and hypodermis using freehand selection on z-stack wide field light microscope images of 70 μm skin sections immunostained with CD31 and Dapi. in N = 5 images/mouse. Error bars represent standard deviation. (B) Quantification of CD31+ area in HPuHG region per skin field at different hair cycle stages shows significant decrease in the transition from telogen to anagen. HPuHG region is determined by drawing a stripe of 72-wide pixels immediately underneath the hair follicle. CD31+ area in HPuHG is determined by CD31+ area in this selected region. N = 5 images/mouse. Error bars represent standard deviation. (C) Distribution of angles of vasculature branches relative to the epidermis at different hair stages. Angles were measured by connecting the end point of individual vasculature branch with the nearest branch point, and measuring the relative angle of this line to a horizontal line that is parallel to the epidermis. Blue lines represent the number (count) of vasculature branches at specific angles. Count coordinates are on the radius (y-axis) of polar graph, and angular coordinates are on the circumference (x-axis). P-values from Kolmogorov-Smirnov two-sample test indicate the distribution changes from one hair cycle stage to the other. Note predominant horizontal distribution at telogen (n = 3 mice per stage, N = 5 images/mouse).
-
Figure 2—source data 1
Spreadsheet of original quantification of CD31+ vasculature in total skin (for Figure 2A).
- https://doi.org/10.7554/eLife.45977.005
-
Figure 2—source data 2
Spreadsheet of original quantification of CD31+ vasculature in HPuHG region (for Figure 2B).
- https://doi.org/10.7554/eLife.45977.006
-
Figure 2—source data 3
Spreadsheet of original quantification of angles of CD31+ vasculature (for Figure 2C).
- https://doi.org/10.7554/eLife.45977.007
Figure 3

CD31+ vasculature undergoes proliferation at anagen and apoptosis at catagen.
(A–F) Skin sections from mice in Figure 1 at late catagen (PD19), telogen (PD20), early anagen (PD21), and anagen (PD28) stained for CD31 and Ki67 or activated Caspase 3, imaged using confocal microscopy and Z-stacks (A,C,D,E) and shown as maximal projections. (B, F) Quantification was done by comparing Z-stack maximal projections with individual optical slices to verify co-localization. Caspase-3 quantification (B) was difficult to count as individual cells, and is shown as a semi-quantitative measure where ‘+++” means most frequent and “– “means absent. Strongly positive Ki67 cells are peripherally associated with vasculature, but are not actually CD31+ as shown by analysis of both individual confocal optical sections and projections through stack. Double positive CD31+/Ki67+ cells display lower Ki67 signal at telogen and early anagen than the vasculature-associated cells, and are shown as enlarged and differentially enhanced insets in dotted white boxes. Note their presence at the bottom of the skin below the hair follicles. Note patches of CD31+/Ki67+ cells at full anagen (E) and robust proliferation of the endothelium at this stage quantified in (F). Error bars represent standard deviation.
-
Figure 3—source data 1
Number of Ki67+ CD31+ double positive cells during hair cycle (for Figure 3F).
- https://doi.org/10.7554/eLife.45977.009
Figure 4 with 1 supplement
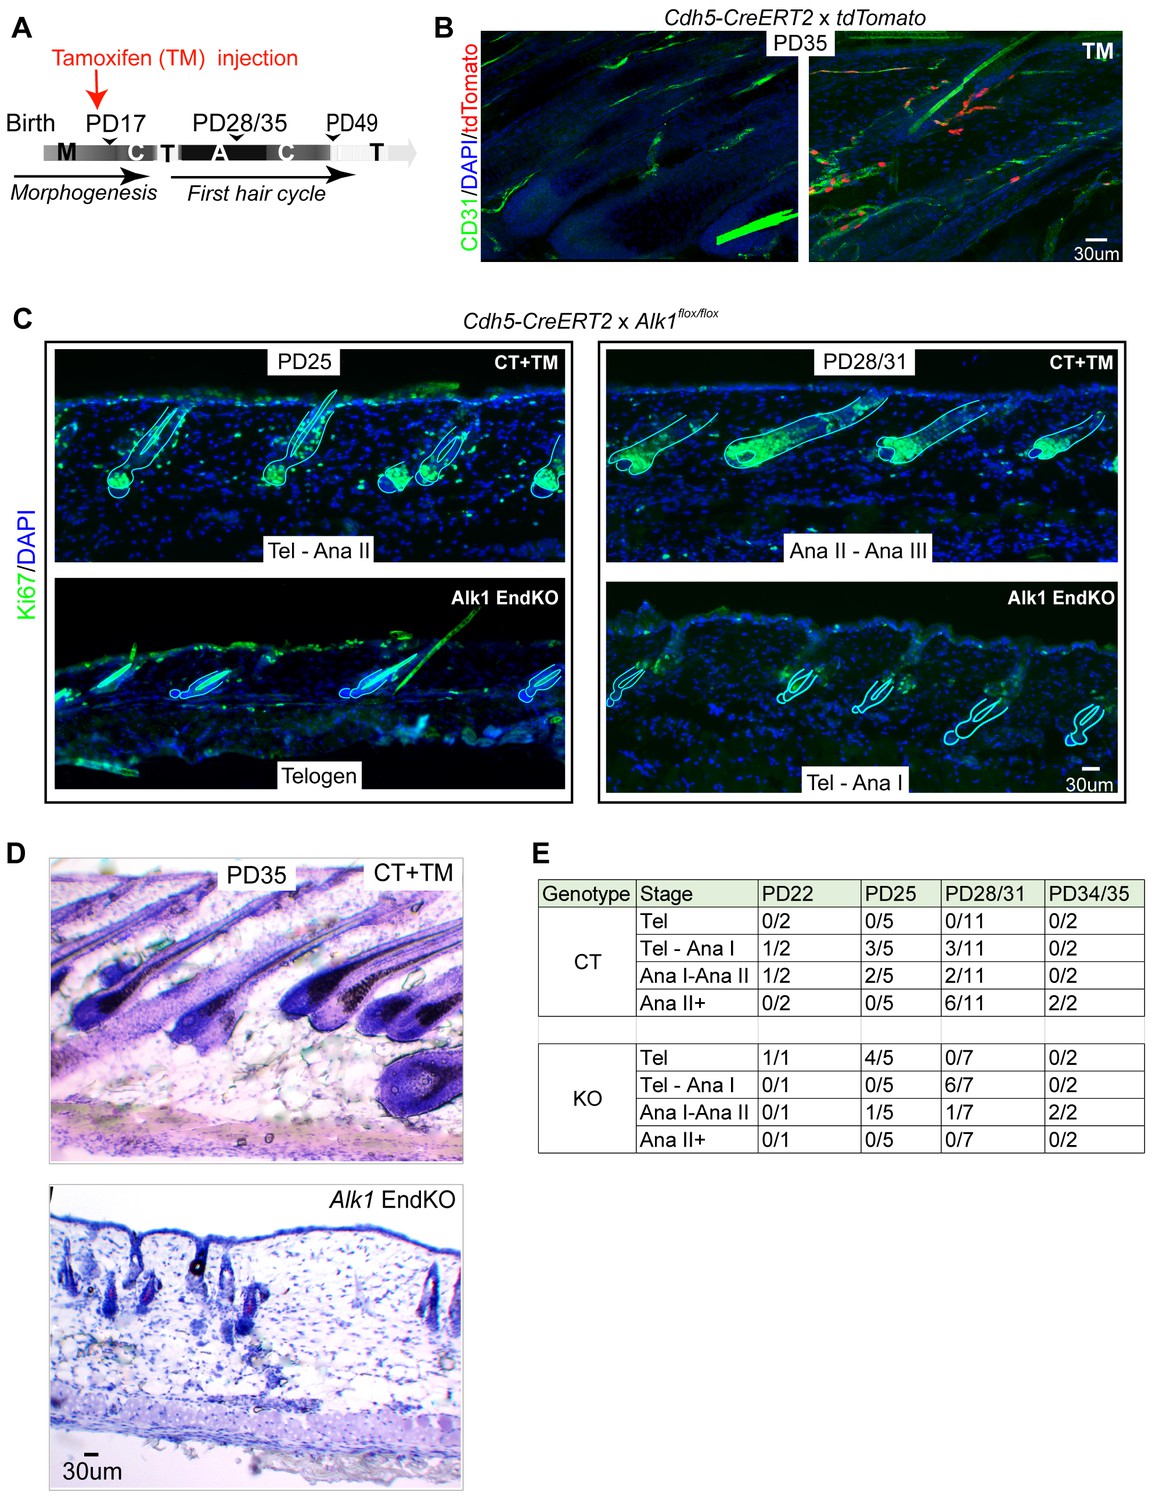
Endothelial-specific Alk1 knockout delays HFSC activation and hair cycle.
(A) Schematic of tamoxifen (TM) inductions using the endothelial-specific Cdh5-CreERT2, with hair cycle stages indicated at postnatal days. M, morphogenesis; C, catagen, T, telogen, A, anagen. (B) Skin sections from Rosa26-tdTomato reporter mice crossed with Cdh5-CreERT2, induced with tamoxifen (TM) at PD17, and sacrificed at PD35, show specific induction in the CD31+ vasculature. (C) Skin sections from Alk1flox/flox mice crossed with Cdh5-CreERT2 and induced with tamoxifen (TM) at PD17 show different hair cycle stages as indicated by morphology and staining for Ki67 at PD25 and at PD28/31. (D) Same as (C) but stained with hematoxylin and Eosin and mice were sacrificed at PD35. (E) Number of littermate control (CT) Alk1 End KO (KO) mice at specific indicated hair stage obtained from Ki67 staining/total number of mice analyzed at each age/genotype group. For instance, at PD25 we analyzed a total of 5 control (CT) mice of which three were at Tel-AnaI and two were at Ana I-II. Also see Table 1 for more detailed information on each mouse and its respective hair cycle stage.
Figure 4—figure supplement 1
Phenotype of Alk1 endothelial knockout skin.
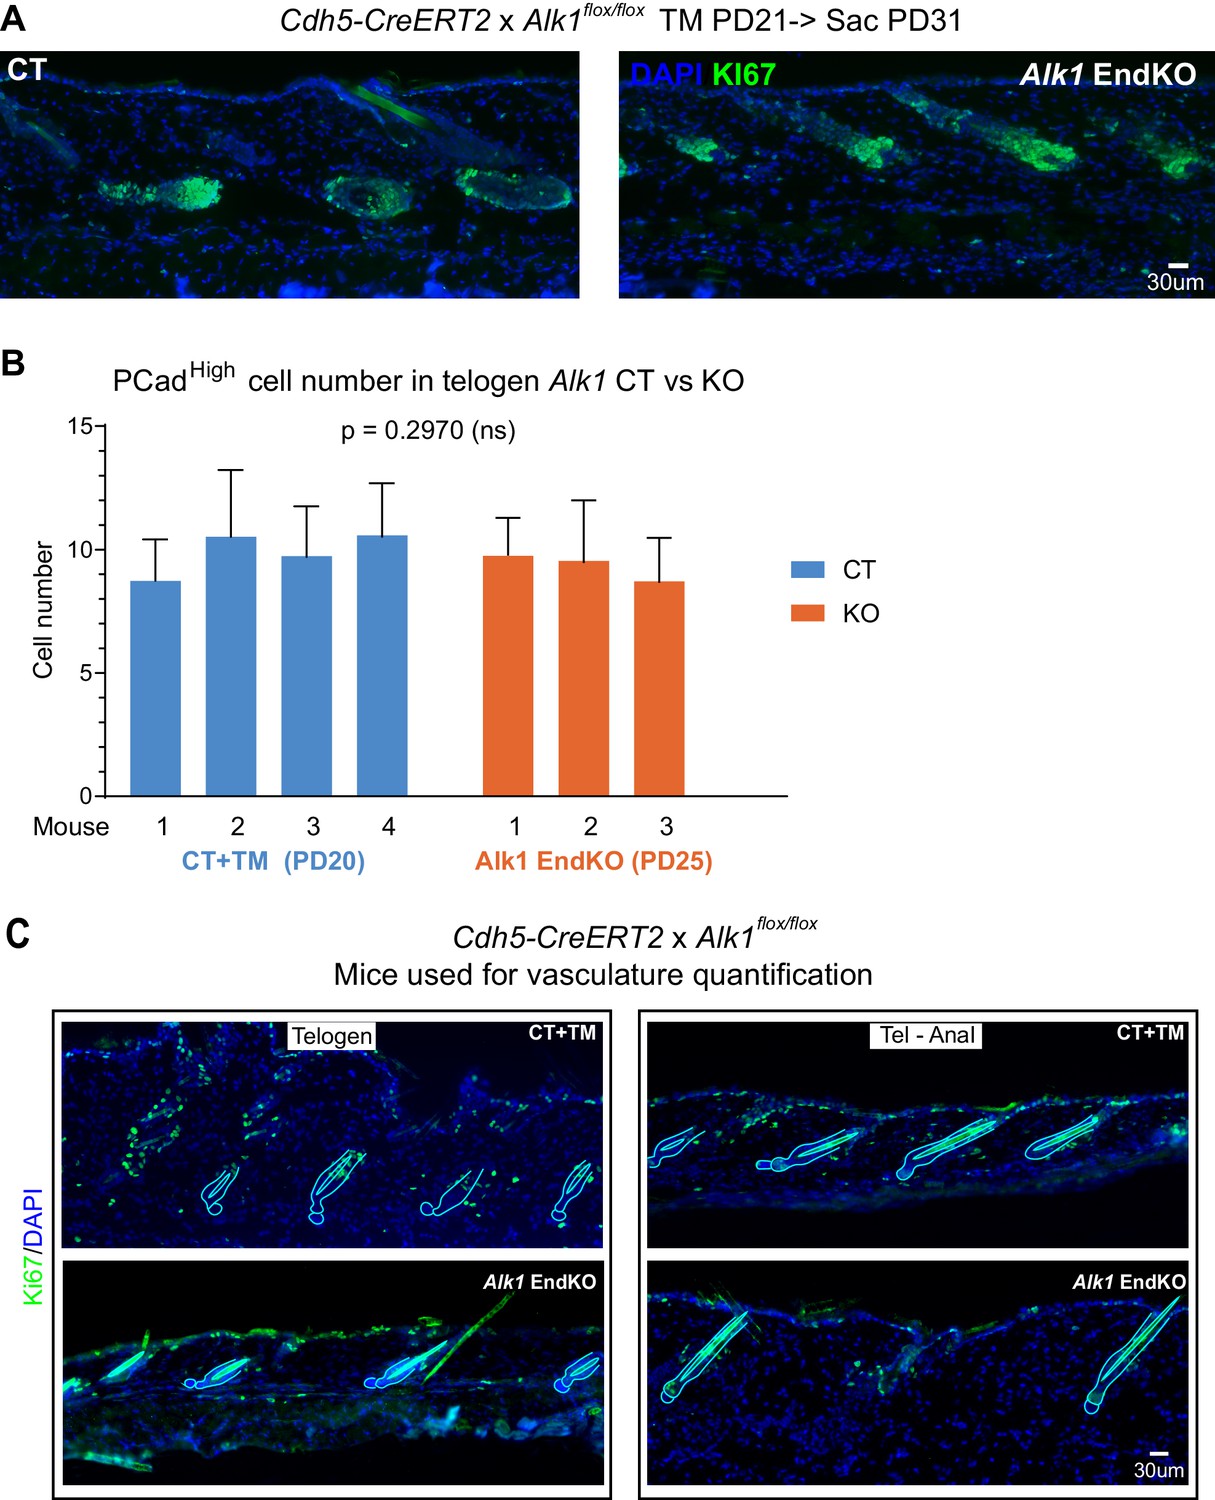
(A) Images of skin sections from Alk1 EndKO and CT mice induced with TM at PD21 show anagen induction by PD31 (see also Table 1). (B) Quantification of Pcadhigh cells of stage-matched Alk1 EndKO and CT mice at telogen indicates no significant difference between the two genotypes. P-value was calculated using REML approach. 10–20 hair follicles were analyzed per mouse. Error bars represent standard deviation. (C) Images of skin sections stained with Ki67, a proliferation marker, from Alk1 EndKO and CT mice used for vasculature quantification in Figure 5B. Hair follicles and hair shafts are outlined by light blue line.
Figure 5 with 1 supplement
Increased vasculature density in Alk1 endothelial knockout skin in horizontal plexus under the hair germ (HPuHG).
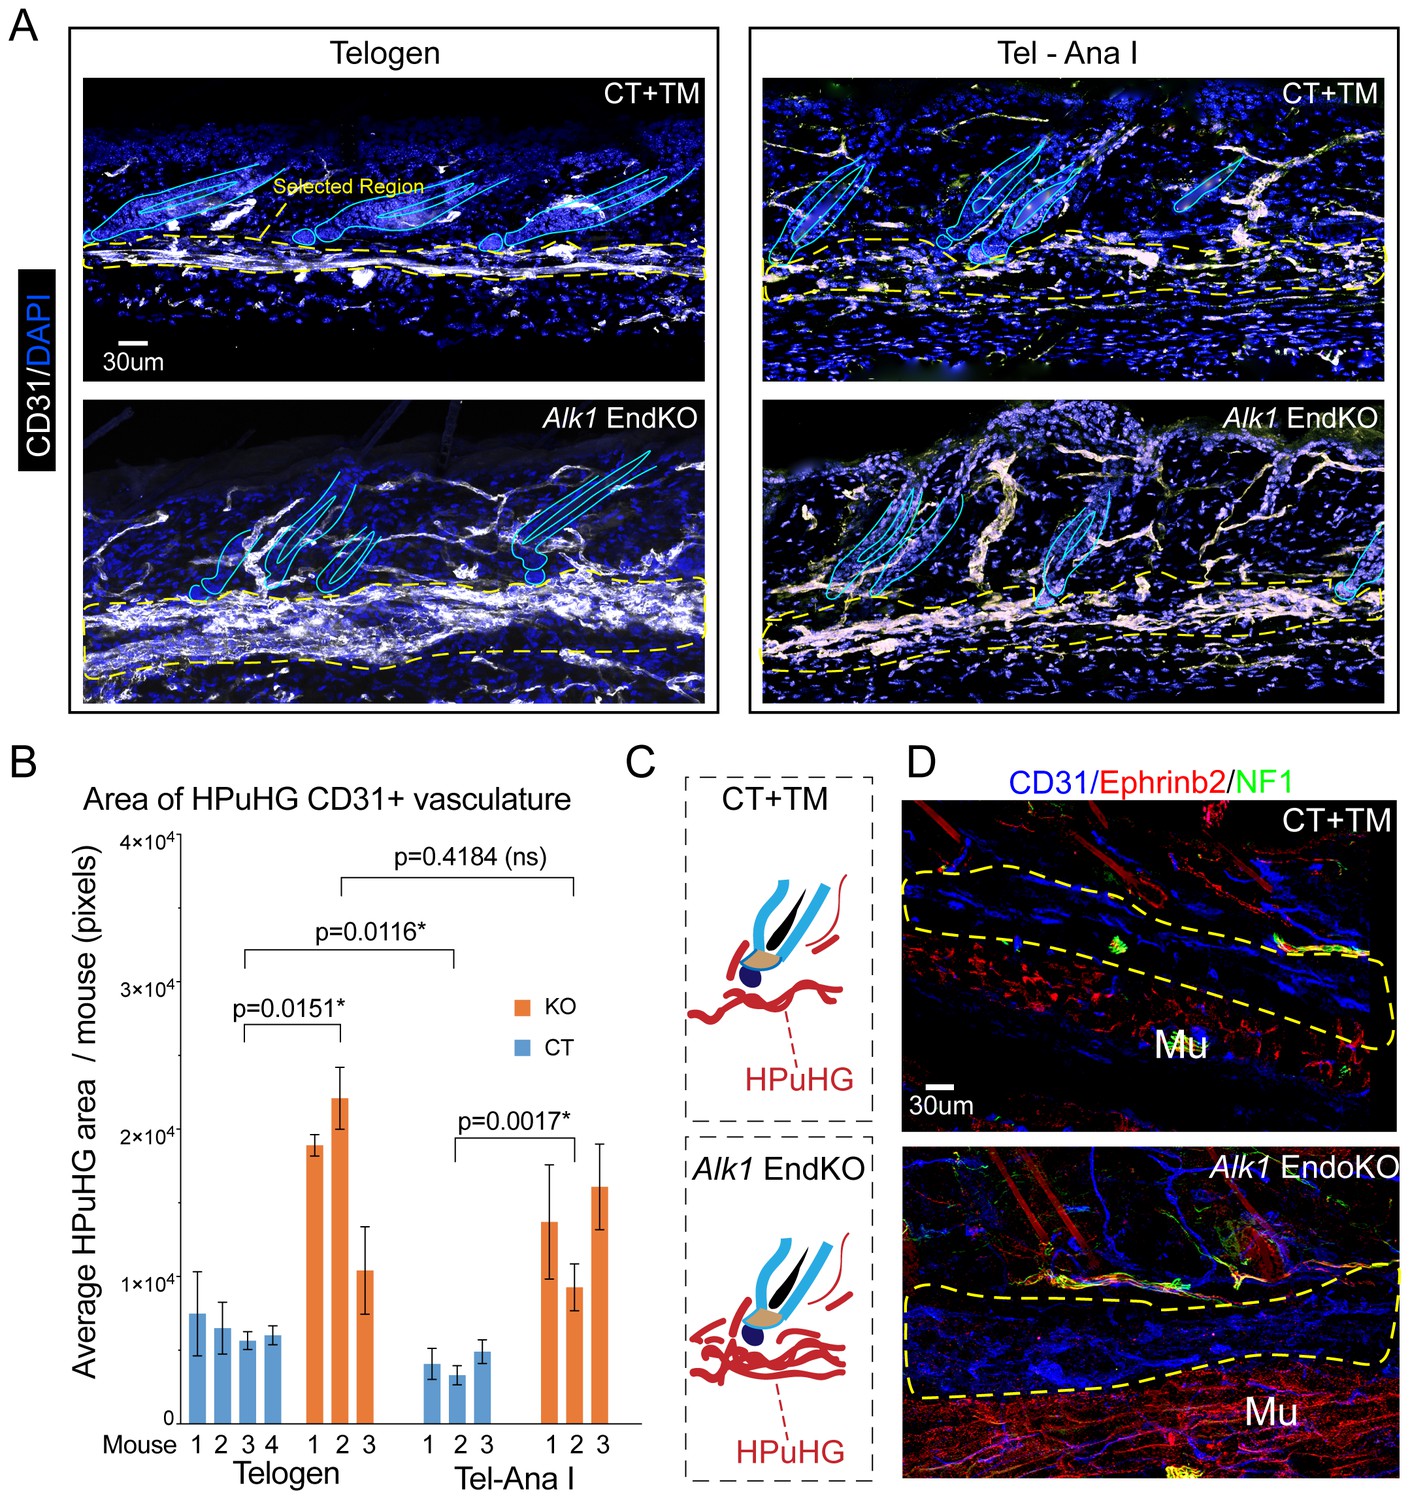
(A) Skin sections from Alk1flox/flox mice with Cdh5-CreERT2 (EndKO) or without (CT) were injected with tamoxifen (TM) at PD17 and sacrificed at different ages between ~PD 22-PD28, were stage matched in two groups: Telogen (no KI67+ cells in the hair germ and Tel-AnaI (when some hair follicles show rare Ki67 cells in the hair germ). Images are maximum projections through confocal microscope optical Z-stacks of 60 µm sections. Note visibly denser cables of CD31+ vasculature in the horizontal plexus under the hair germ (HPuHG) in the Alk1 EndKO. (B) Quantification in ‘selected region’ under the hair germ (shown in yellow dotted line in A), which encompass the characteristic HPuHG structure, revealed an increase in CD31+ vasculature area in HPuHG in the Alk1 EndKO skin. CD31+ vasculature in the HPuHG was manually defined in each image and the area in each image was plotted as average per mouse with error bars among individual images. REML approach was used to obtain p values between mice of the two genotypes. See also Figure 5—figure supplement 1A–D for more details and additional quantifications. Also note a decrease in HPuHG area between Telogen and Tel-Ana I in CT mice (p=0.0116), as also noted in our analysis of WT C57BL/6 mice in Figure 1 and 2. In contrast to CT mice, Alk1 EndKO mice maintain an abnormally dense HPuHG that does not change significantly between stages analyzed (p=0.4184). N = 4–6 images per mouse. Error bars represent standard deviation. (C) Schematic of vasculature arrangement in CT+TM and Alk1 EndKO. (D) Skin section of stage-matched Alk1 CT+TM and KO mice at Telogen – Anagen I transition stage (when rare Ki67+ cells are present in hair germ). Stainings for CD31+ (general vasculature), Ephrib2 (arteries) and NF1 (nerves) show prominent non-arterial vasculature (Eprinb2lowCD31high) in the HPuHG that is increased in the Alk1 EndKO. Note strong arterial presence (Eprinb2highCD31low) in the region below the HPuHG, which contains the subcutaneous muscle.
-
Figure 5—source data 1
Spreadsheet of original quantification of HPuHG CD31+ vasculature in Alk1 EndKO and CT (for Figure 5B).
- https://doi.org/10.7554/eLife.45977.015
Figure 5—figure supplement 1

Increase in CD31+ vasculature density in horizontal plexus under the hair germ (HPuHG) in Alk1 endothelial knockout.
(A) Example of Cdh5-CreERT2 x Alk1flox/flox mouse skin (Alk1 EndKO) with regions of interest analyzed in Figure 5. Blue line shows how the CD31+ vasculature in the HPuHG was delineated, dotted yellow line indicated a ‘selected region’ under the hair germ (HG), and white line encompasses the total skin area under the hair germ and above the muscle. Ep, epidermis; De, dermis; Hd, hypodermis; Mu, muscle. (B) Density is shown as ratio of the area of HPuHG as defined above, as the CD31+ vasculature in the selected region under the hair germ, divided by the actual skin area of the ‘selected region’. This analysis accounts for any small variations in the area of the ‘selected region’ under the hair germ, and demonstrates higher density of vasculature per skin unit area in the region immediately underneath the hair germ in the Alk1 EndKO. N = 5 images/mouse. Error bars represent standard deviation. (C) Total skin area under hair germ shows variations from mouse to mouse with no significant differences between control (CT) and Alk1 End KO mouse groups. N = 5 images/mouse. Error bars represent standard deviation. (D) REML analysis shows significant increase in the HPuHG in Alk1 EndKO skin that is independent of total skin area under the hair germ. N = 5 images/mouse. (E) Images of skin from Alk1 EndKO and control mice sacrificed at PD31 were stained for CD31 and Ephrinb2. Note branching of vasculature in EndKO skin at this stage, accompanied by robust increase in overall CD31 signal throughout the skin when compared with control mice.
Figure 6 with 1 supplement
Increased BMP4 protein in the endothelial Alk1 KO skin underneath the hair germ.
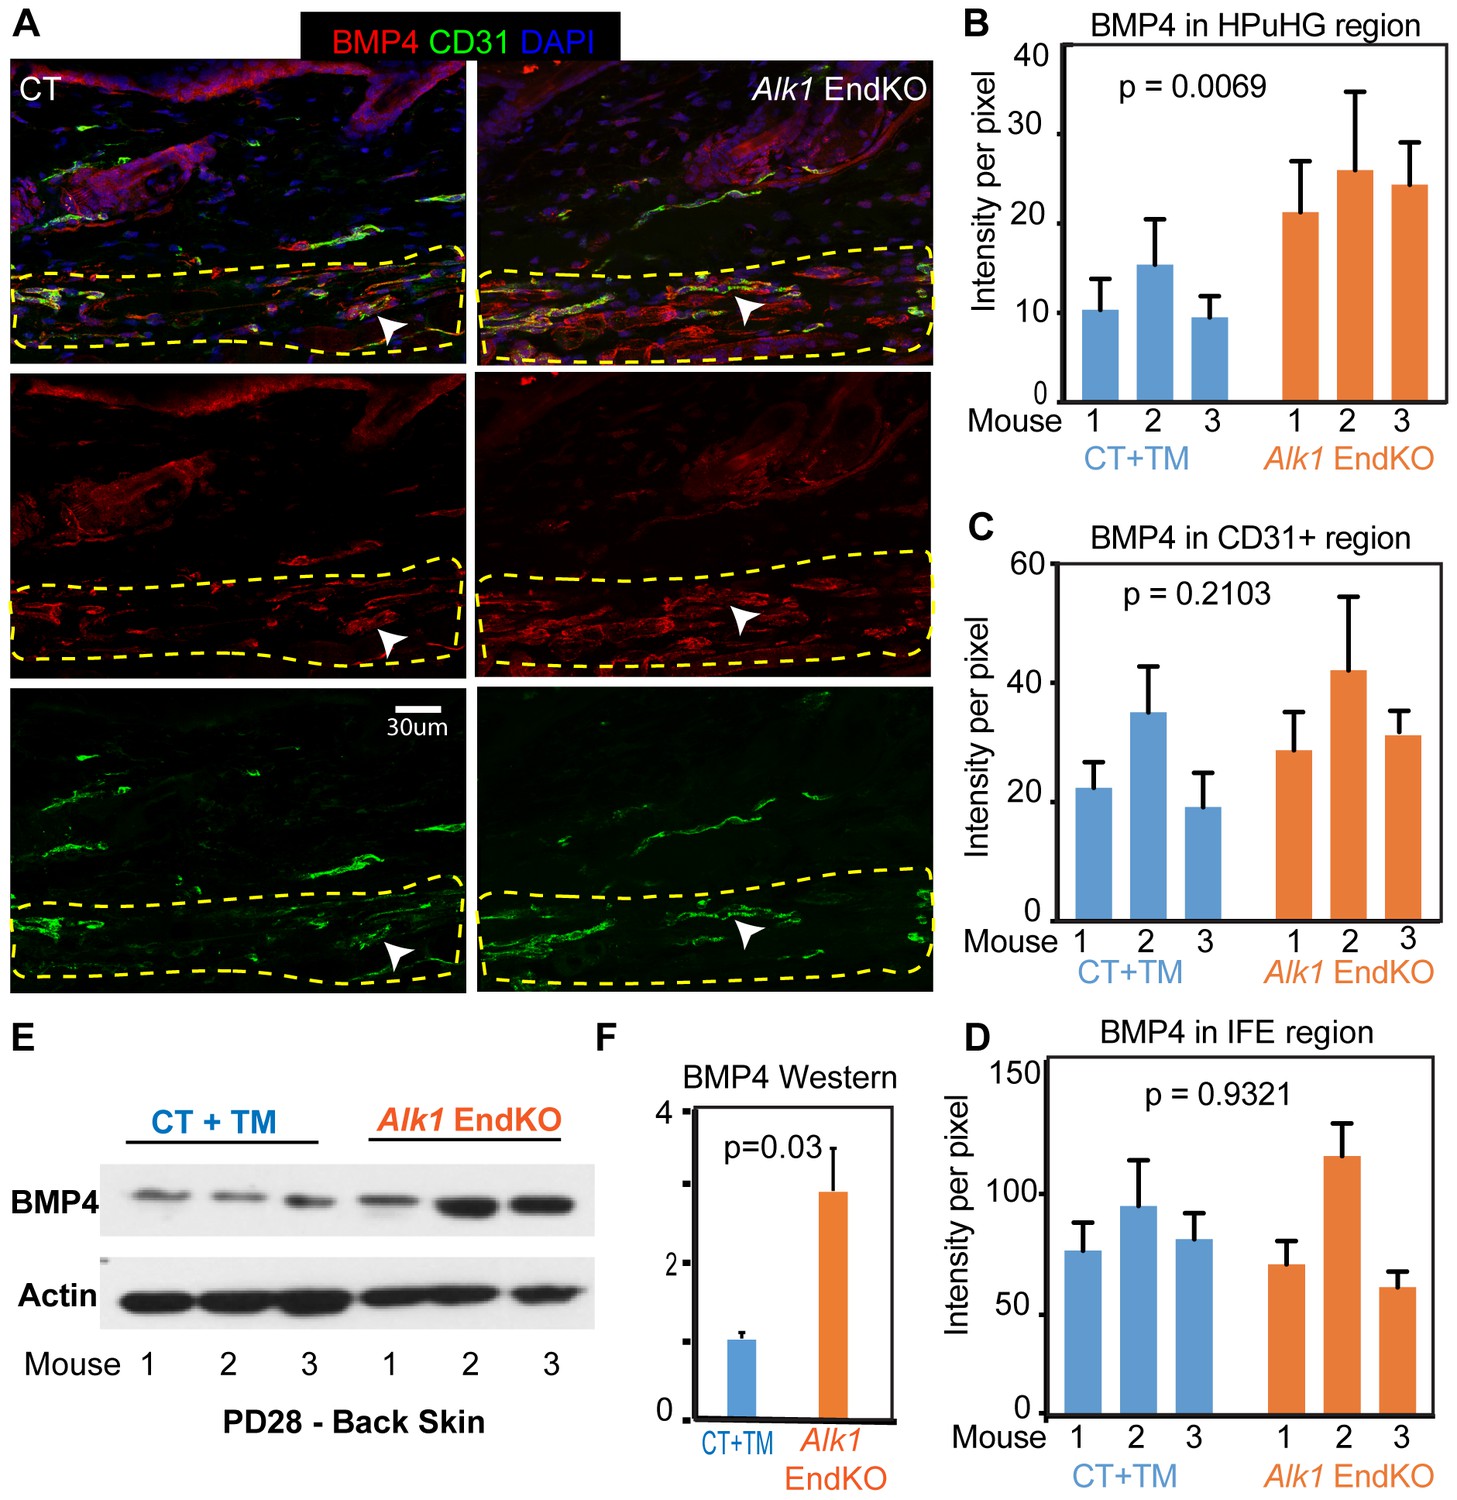
(A) Representative images of skin stained with BMP4 antibodies show prominent expression in the HPuHG region in vessel-like structure. Note increased BMP4 in the HPuHG region in the Alk1 EndKO skin. BMP4 vessel-like structures with low CD31 staining in the HPuHG may suggest possible molecular heterogeneity in vasculature in this region. (B) Quantification of average BMP4 intensity in selected HPuHG region. HPuHG region is determined by drawing a stripe of 72 pixels immediately underneath the hair follicle. Its intensity was measured in ImageJ and then subtracting average background intensity from three randomly selected background areas to get the final intensity value. Alk1 EndKO have significantly higher intensity compared to CT+TM. P-value was obtained using REML approach in the JMP software. See also Figure 6—figure supplement 1A for additional images. N = 9–16 images/mouse. Error bars represent standard deviation. (C) Quantification of BMP4 intensity in CD31+ vasculature in HPuHG region indicates no significant difference between CT+TM and Alk1 EndKO. CD31+ area was outlined by freehand tool in ImageJ and intensity was measured. The final intensity was calculated by subtracting average background intensity. P-value was obtained using REML approach in the JMP software. N = 9–16 images/mouse. Error bars represent standard deviation. (D) Quantification of BMP4 intensity in IFE region (see Figure 6—figure supplement 1A) indicates no significant difference between CT+TM and Alk1 EndKO. P-value was obtained using REML approach. N = 8–10 images/mouse. Error bars represent standard deviation. (E) Western blot of back skin tissue showed increased BMP4 expression in the Alk1 EndKO. See also Figure 6—figure supplement 1B,C for additional data. (F) Quantification of western blot in (E) showing BMP4 signal normalized to actin signal in each sample.
-
Figure 6—source data 1
Spreadsheet of original quantification of BMP4 in Alk1 EndKO skin (for Figures 6B, C and D).
- https://doi.org/10.7554/eLife.45977.018
Figure 6—figure supplement 1
BMP4 levels in Alk1 EndKO skin.
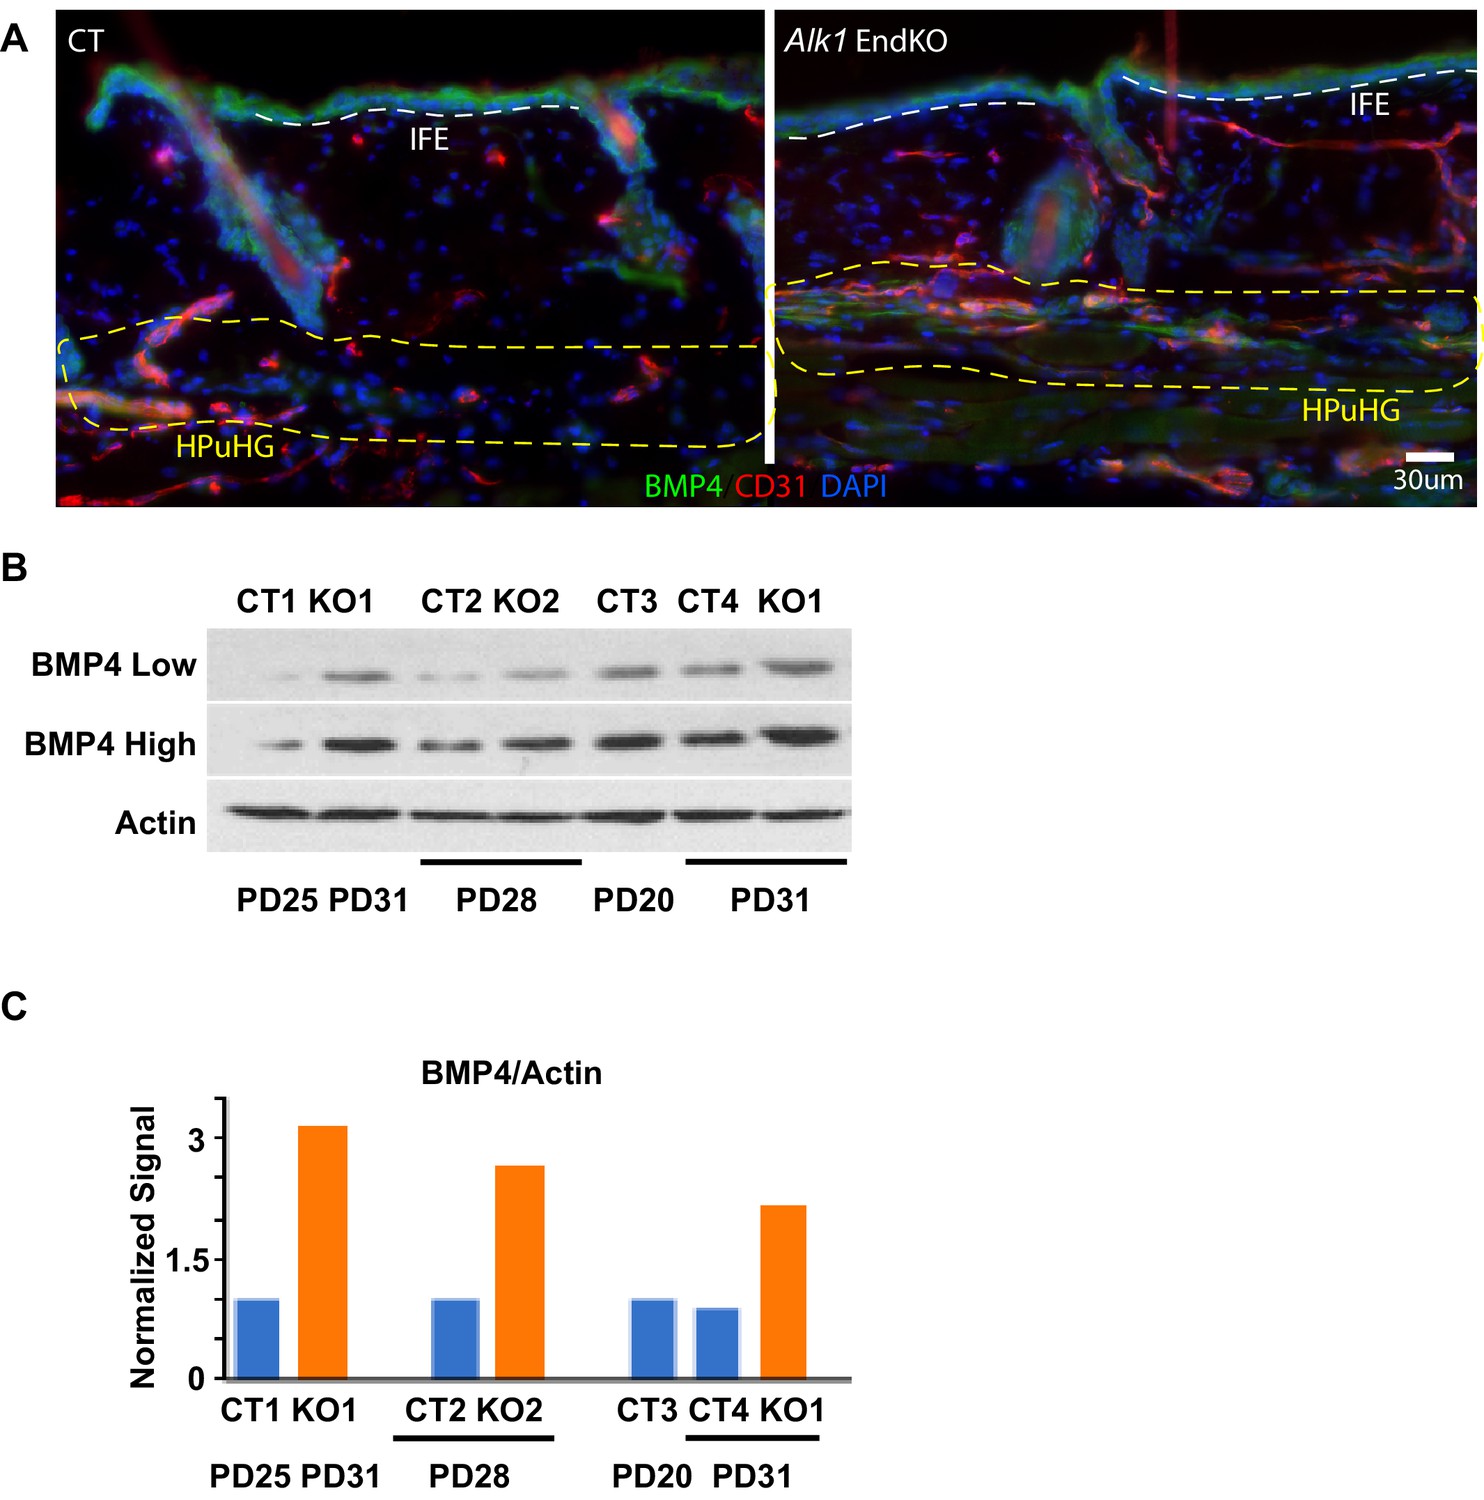
(A) Example of Cdh5-CreERT2 x Alk1flox/flox mouse skin (Alk1 EndKO) from mice injected with TM at PD17 and sacrificed at PD28 stage matched at Tel-Ana I, with regions of interest analyzed in Figure 6. Dotted yellow line indicated the ‘selected region’ under the hair germ (HG) where the HPuHG is located, and white line delineated the lower edge of the interfollicular epidermis (IFE). (B) Western blot of additional mice at different stages complement analysis in Figure 6. (C) Quantification of bands in B, and normalization of BMP4 signal to active signal.
Figure 7
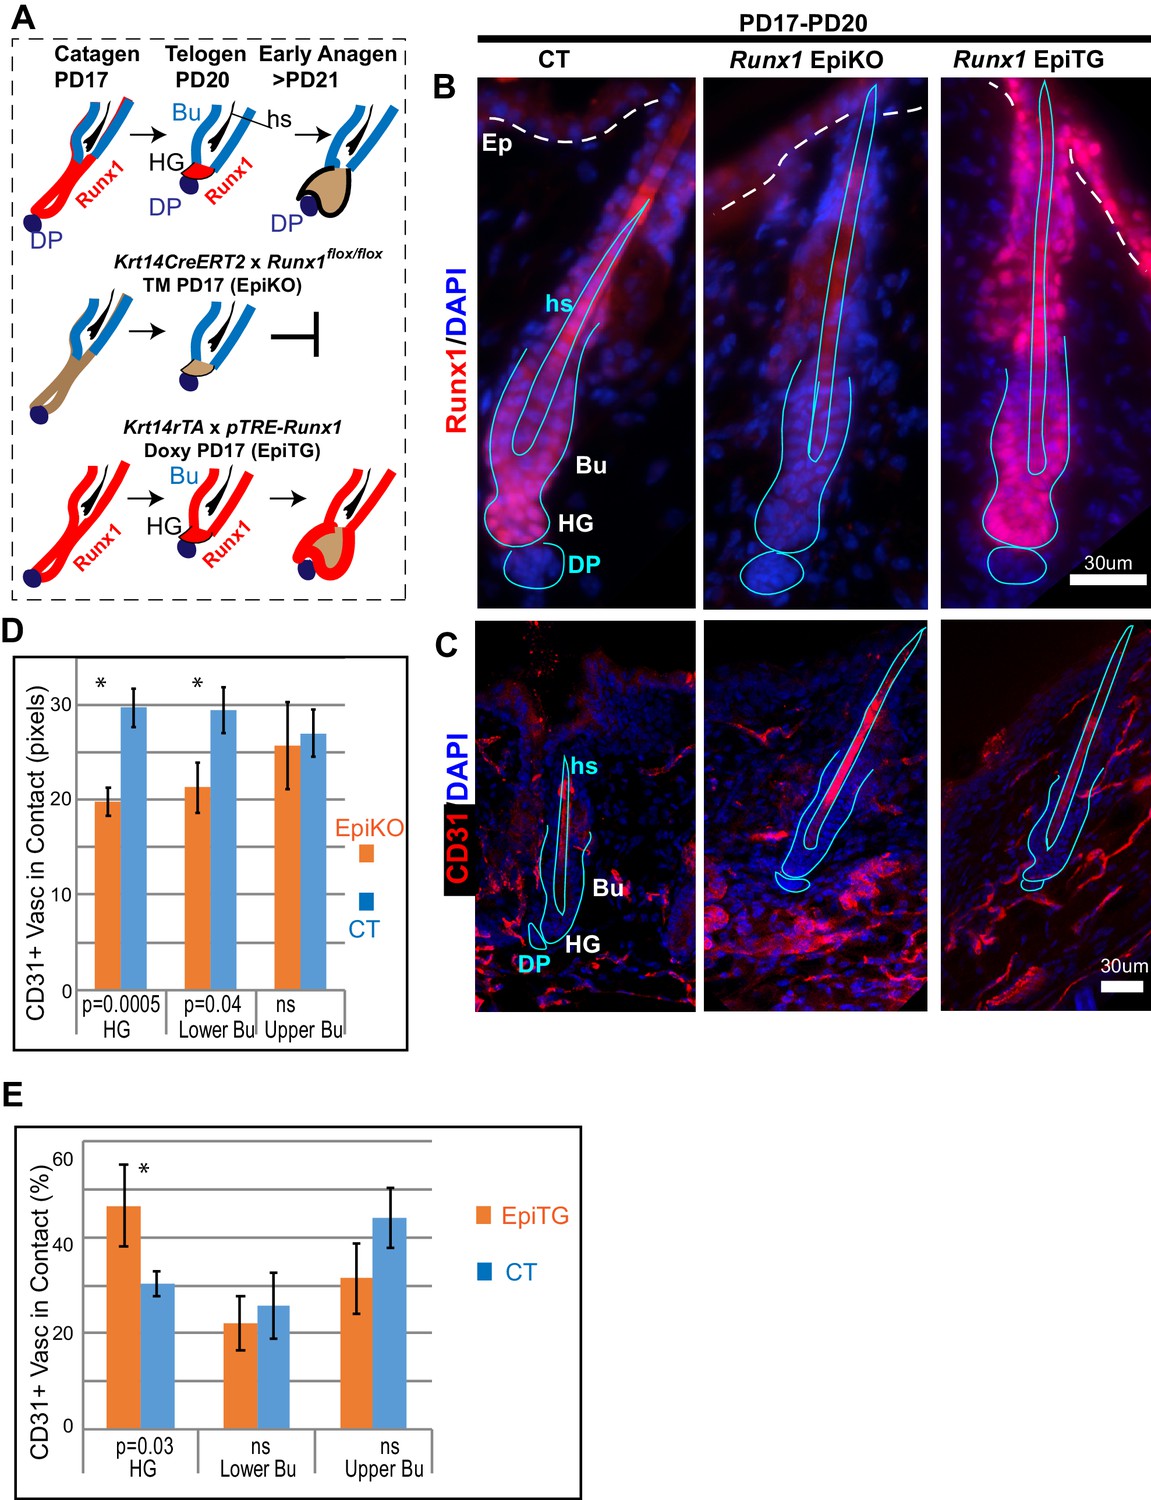
Varying level of the transcription factor Runx1 in skin epithelium results in rearrangement of CD31+ vasculature around the hair follicle.
(A) Schematics of Runx1 mutant inductions in genetic mouse models to create varying levels of Runx1 in the hair follicle (HF). Runx1 expression in HF is shown in red in wild type follicles (top) and in mutant mice. Bulge (Bu) is residence of quiescent hair follicle stem cells (HFSCs). Hair germ (HG) forms at late catagen/telogen from migrating bulge HFSC and under Runx1-influence adopt the ‘primed’ HFSCs state. The hair germ cells are activated to proliferate by signals from environment and execute a new hair growth cycle in anagen. DP, dermal papillae. Hs, hair shaft. (B) Skin sections immunofluorescence-stained for Runx1 show noticeable signal in HG in normal conditions, lack of signal in EpiKO mice after TM induction, and broader expression patterns including the upper hair follicle and epidermis (Ep) in EpiTG mice, 4 days after TM and doxy induction. We have previously documented in detail and reported the high efficiency of our induction experiments (Hoi et al., 2010; Lee et al., 2014; Scheitz et al., 2012). (C) Staining for CD31 reveals patterns of vasculature arrangement in control and mutant mice (genotype shown at top of panel B). Note aggregated vasculature below hair germ lacking direct contact with the hair germ in EpiKO and more dispersed vasculature contacting the hair germ in the EpiTG. (D–E) Quantification of data in C reveals differences in the organization of vasculature around the hair germ, as defined by length of contact (in pixels) and frequency of contact between CD31+ endothelial cells and the epithelium. N = 4 mice per group with 40–60 hair follicle in each genotype matched for hair cycle stage at telogen. Student T test of the WT and mutant groups showed significant differences in average contact length (D) and in frequency of CD31+ vasculature around the hair follicle found in contact with the hair germ (E). Controls were distinct groups of littermate mice from either EpiKO or EpiTG mouse crossings.
Figure 8 with 1 supplement
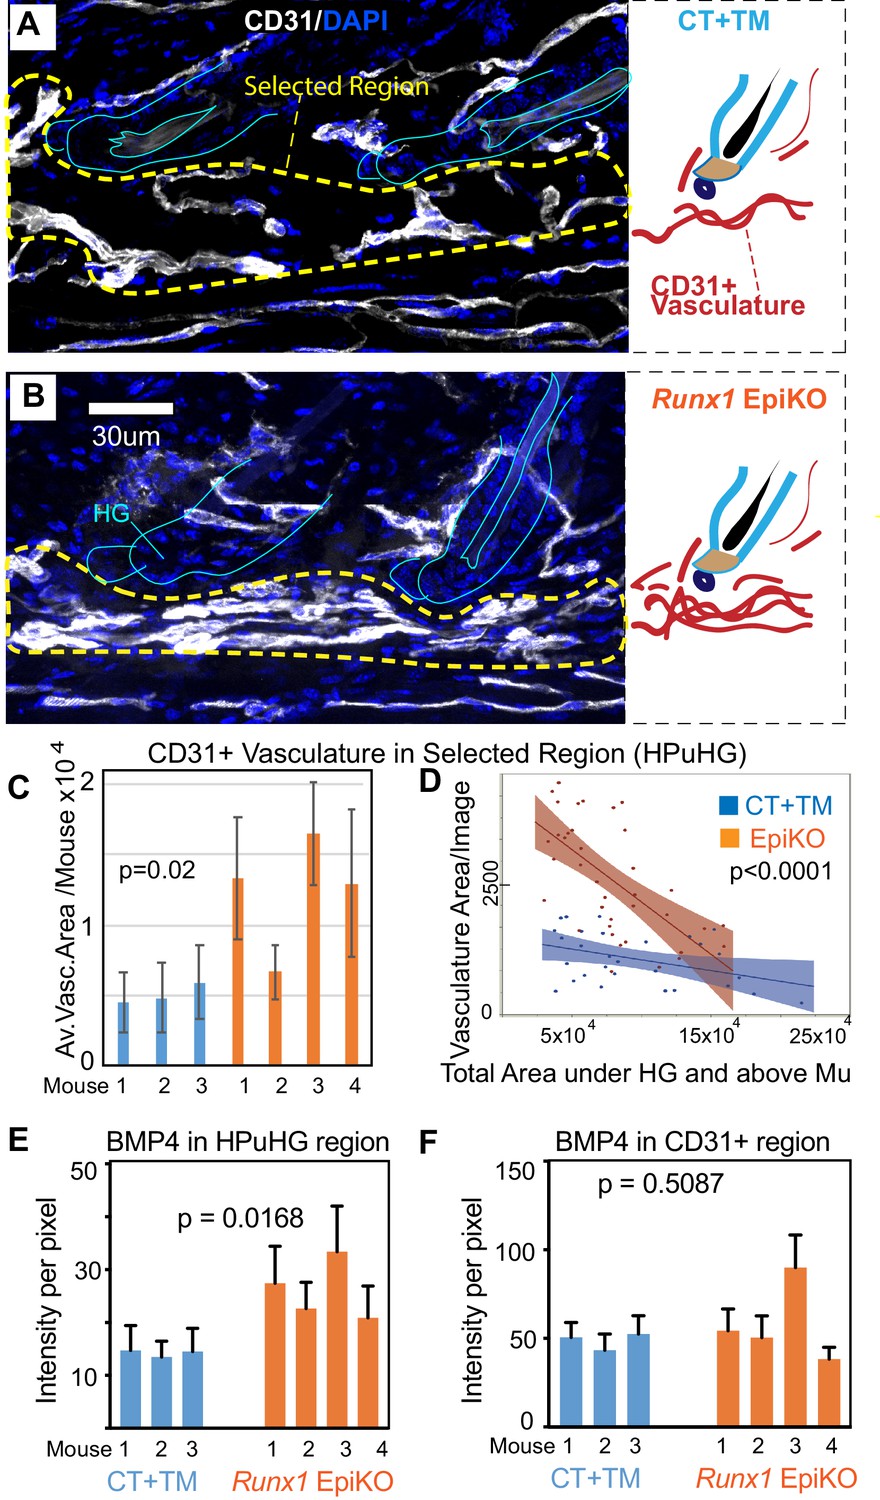
Epithelial Runx1 knockout results in increased CD31+ vasculature and hence increased BMP4 concentration in the HPuHG region.
(A–B) Runx1flox/flox mice with Krt14-CreERT2 (EpiKO) or without (CT) were injected with tamoxifen (TM) at PD17, sacrificed at ~PD20. Skin sections were DAPI stained, inspected for hair morphology and CT and EpiKO samples were stage matched at catagen VIII. Images are maximum projections through confocal Z-stacks of 70 µm sections and show denser horizontal cables of CD31+ vasculature in the horizontal plexus under the hair germ (HPuHG) in the Runx1 EpiKO. This is schematized in the corresponding right panels. (C–D) The HPuHG is quantified as the area of CD31+ vasculature in ‘selected regions’, as shown in A and B and Figure 8—figure supplement 1A, and is plotted as average among images per mouse (C). (D) Images pooled from all mice in CT and Runx1 EpiKO groups are plotted against the total skin area under hair germ (HG) and above the muscle (Mu). See also Figure 8—figure supplement 1A–E for more detail and additional quantification. N = 10 images/mouse. Error bars represent standard deviation. (E) Quantification of average BMP4 intensity in selected HPuHG region. Same quantification method was used as in Figure 6B. Runx1 EpiKO have significantly higher average intensity in the HPuHG area when compared to CT+TM. P-value was obtained using REML approach in the JMP software. N = 8–10 images/mouse. Error bars represent standard deviation. (F) Quantification of BMP4 intensity specifically in CD31+ HPuHG vasculature does not reveal a significant difference in signal between CT+TM and Runx1 EpiKO. Same quantification method was used as in Figure 6C. P-value was obtained using REML approach. N = 8–10 images/mouse. Error bars represent standard deviation.
-
Figure 8—source data 1
Spreadsheet of original quantification on Runx1 EpiKO skin (Figure 8C and D).
- https://doi.org/10.7554/eLife.45977.023
-
Figure 8—source data 2
Spreadsheet of original quantification of BMP4 in Runx1 EpiKO skin (for Figure 8E and F).
- https://doi.org/10.7554/eLife.45977.024
Figure 8—figure supplement 1
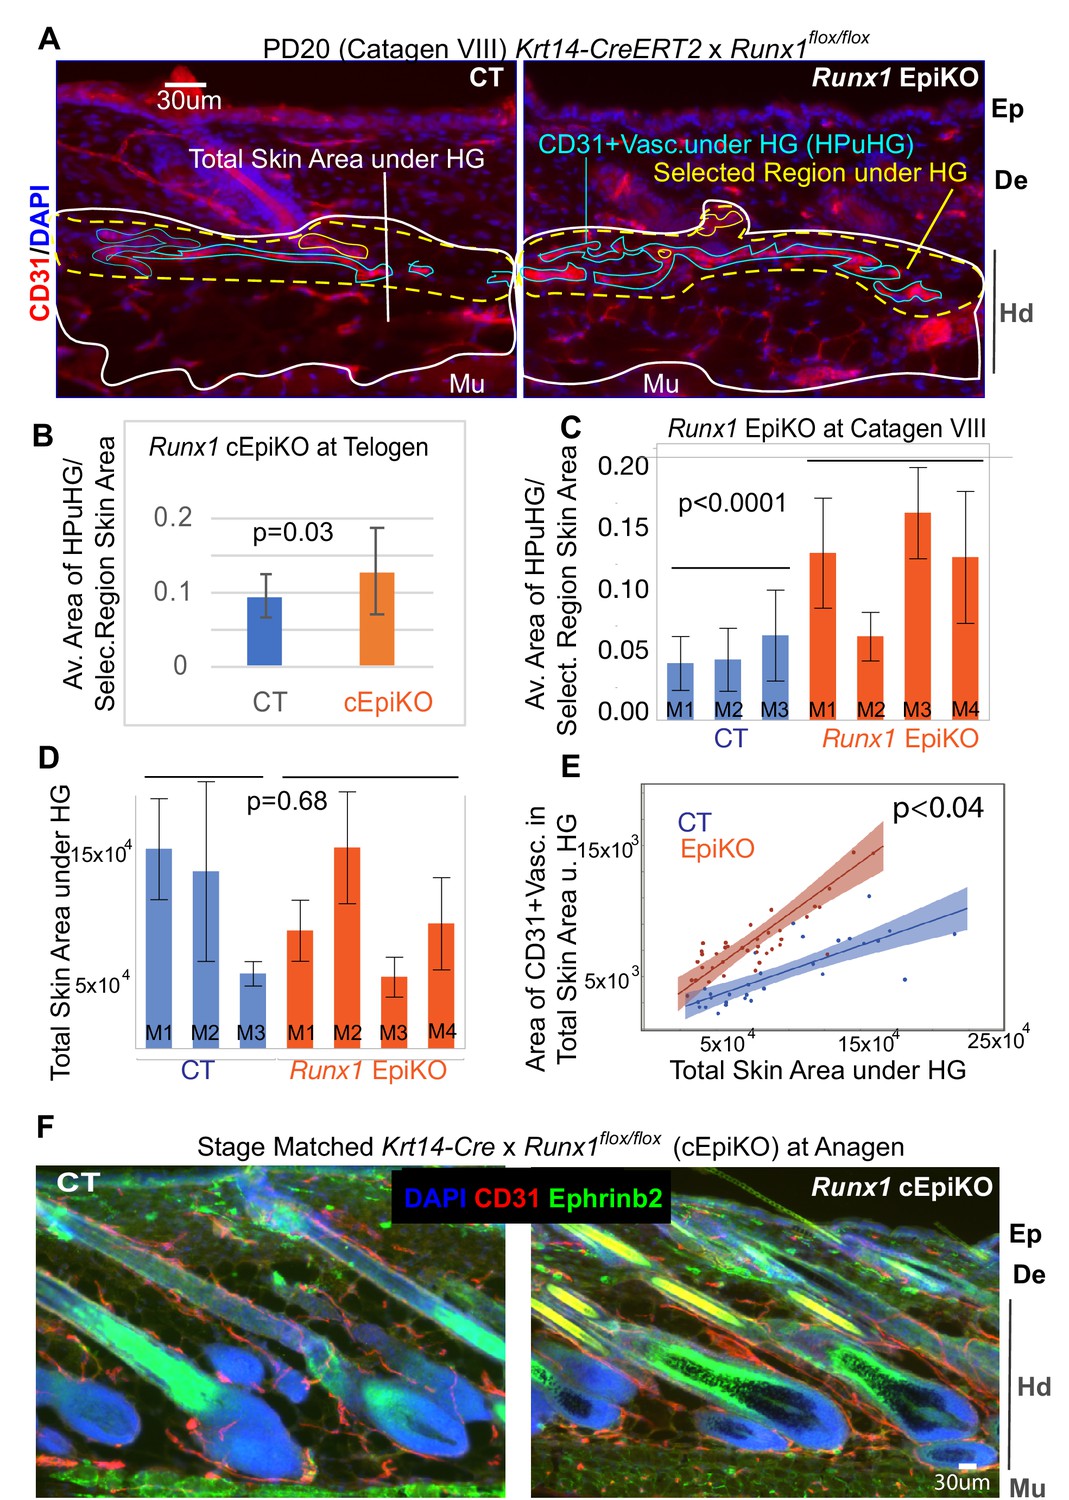
Runx1 EpiKO skin shows increased vasculature in horizontal plexus under hair germ (HPuHG) at late catagen/telogen and normal vasculature at anagen.
(A) Examples of images from Krt14-CreERT2 x Runx1flox/flox mice (Runx1 EpiKO) and littermate control mice without Cre allele (CT) that were analyzed in Figure 7. Light blue line shows how the CD31+ vasculature was delineated, dotted yellow line indicates the ‘selected region’ under the hair germ (HG) used for most measurements, which encompasses the characteristic horizontal plexus under hair germ (HPuHG). White line encompasses the ‘total skin area’ under the hair germ and above the muscle. Ep, epidermis; De, dermis; Hd, hypodermis; Mu, muscle. (B) Density of HPuGH is shown as ratio of the area of CD31 vasculature in the ‘selected region’ divided by the actual area of the selected region in each mouse. Skin from constitutive Krt14-Cre x Runx1flox/flox mice (cEpiKO) whose hair cycle stage was matched with control littermates at telogen was quantified in the same way shown in A. This analysis accounts for any variations in the area of the selected region under the hair germ, and demonstrate higher density in the HPuHG in the cEpiKO at telogen. N = 10 images/mouse. Error bars represent standard deviation. (C) Density of HPuGH is shown as ratio of the area of CD31 vasculature in the ‘selected region’ divided by the actual area of the selected region from skin of Krt14-CreERT2 x Runx1flox/flox (EpiKO) at catagen VIII. Significant increase in the density of HPuHG was found in the Runx1 EpiKO at catagen VIII. N = 10 images/mouse. Error bars represent standard deviation. (D) Total skin area under hair germ shows variations from mouse to mouse with no significant differences between control (CT) and Runx1 Epi KO mouse groups. N = 10 images/mouse. Error bars represent standard deviation. (E) REML analysis shows that CD31+ vasculature in ‘total skin area under germ’ shows significant differences between CT and Runx1 EpiKO that are independent of the actual size of the ‘total skin area under the hair germ’. N = 10 images/mouse. (F) Images of skin from Krt14-Cre x Runx1flox/flox (Runx1 cEpiKO) mice whose hair cycle stage were matched with control littermates at anagen. Inspection of n = 3 mice per group showed no apparent differences in vasculature organization. This suggests that once the Runx1 EpiKO skin overcomes the prolonged telogen and eventually enters anagen, the vasculature remodels properly around the hair follicle.
Figure 9
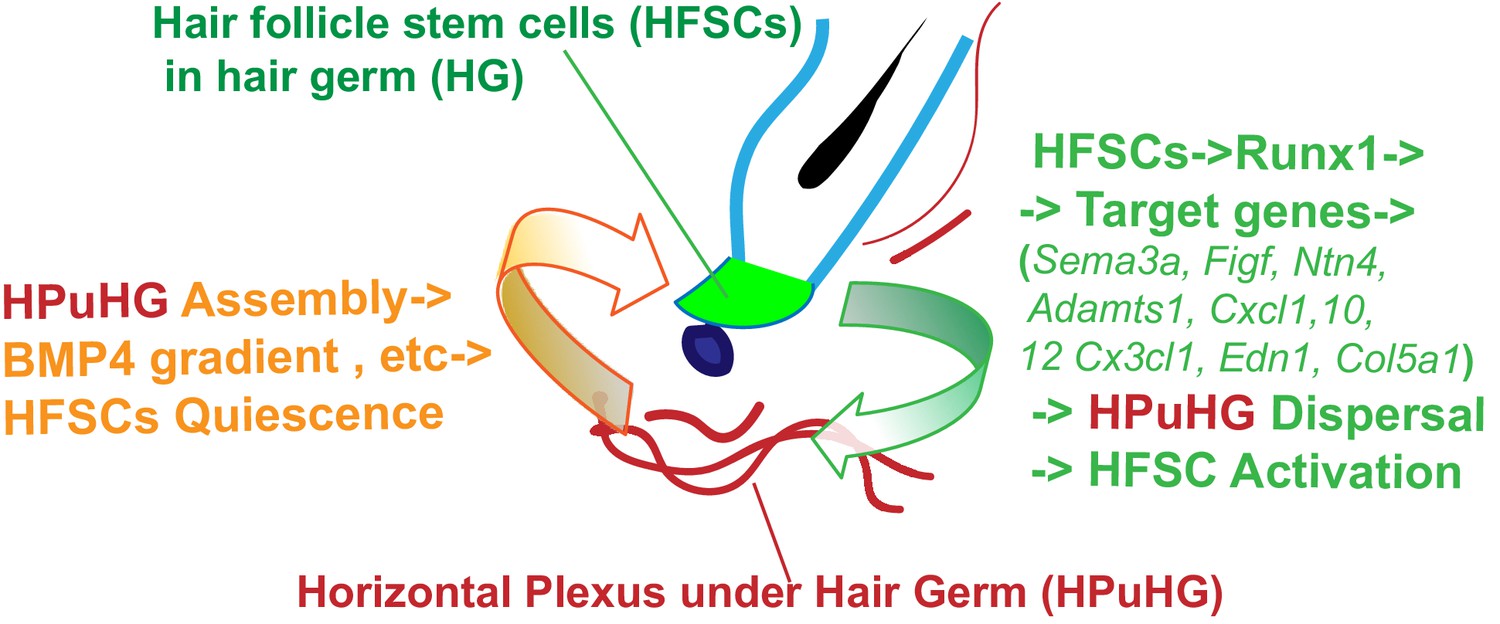
Hypothetical model of HFSCs and vasculature cross-talking in hair cycle.
Left side: During late stages of HFSC quiescence (late catagen/telogen) remodeling of skin vasculature results in assembly of the horizontal plexus under hair germ HPuHG. This results in high concentrations of BMP4, a HFSC-quiescence inducing factor, near the hair germ, which may enforce telogen maintenance. Right side: HFSCs in the hair germ produce Runx1, a factor that promotes their activation. Through its target genes encoding secreted proteins with know function in vasculature remodeling, Runx1 shapes the microenvironment at late catagen/telogen to produce a less dense HPuHG. This in turn would be more permissive to HFSC activation and progression from telogen to anagen.
Tables
Table 1
Cdh5CreERT2 x Alk1flox/flox KO (EndKO) mice and hair cycle
https://doi.org/10.7554/eLife.45977.012| Mouse ID | Genotype | Sex | Hair cycle stage |
|---|---|---|---|
| PD17-20 | |||
| F520.01 | CT | M | Tel |
| F520.04 | CT | F | Tel |
| F520.05 | CT | M | Tel |
| F520.06 | CT | F | Tel |
| PD17-22 | |||
| F167.02 | CT | M | Ana I |
| F64.02 | CT | F | Tel - AnaI |
| F64.01 | KO | F | Tel |
| PD17-25 | |||
| F81.06 | CT | F | Tel- Ana I |
| F146.05 | CT | M | Ana I - IIa |
| F167.05 | CT | M | Ana I - IIa |
| F433.03 | CT | F | Tel- Ana I |
| F433.04 | CT | F | Tel- Ana I |
| F81.07 | KO | F | Tel |
| F86.02 | KO | F | Ana I |
| F86.04 | KO | M | Tel |
| F99.01 | KO | M | Tel |
| F433.06 | KO | F | Tel |
| PD17-28 | |||
| E963.02 | CT | M | Ana IIIc |
| F80.04 | CT | F | Tel - Ana I |
| F90.01 | CT | M | Ana I - Ana IIa |
| F146.02 | CT | F | Ana IIa-c |
| F333.01 | CT | M | Ana I - IIa |
| F333.03 | CT | M | Tel - Ana I |
| F333.04 | CT | M | Tel - Ana I |
| F11.04 | KO | F | Tel - Ana IIa |
| F89.01 | KO | M | Ana I-IIa |
| F80.03 | KO | M | Tel - Ana I |
| F90.02 | KO | F | Tel - Ana I |
| F333.02 | KO | F | Tel - Ana I |
| PD17-31 | |||
| F3.01 | CT | M | Ana II - Ana III |
| F3.03 | CT | M | Ana II |
| F90.05 | CT | M | Ana II-III |
| F146.06 | CT | M | Ana III |
| E906.01 | KO | M | Tel-Ana I |
| F90.07 | KO | F | Tel-Ana I |
| PD17-34/35 | |||
| E928.03 | CT | F | Ana III |
| E928.05 | CT | F | Ana IV |
| E960.01 | KO | F | Ana I - Ana II |
| E928.01 | KO | F | Ana I-Ana II |
| PD21-26 | |||
| F218.01 | CT | M | Ana I - Ana III |
| F218.05 | KO | M | Ana III |
| PD21-31 | |||
| F218.02 | CT | F | Ana I - Ana II |
| F218.04 | KO | F | Tel - Ana I |
| PD23-26 | |||
| F273.02 | CT | F | Ana III |
| F273.01 | KO | M | Ana III |
Table 2
Epithelial-specific Runx1-target genes in hair follicle stem cells with known function in vasculature remodeling.
https://doi.org/10.7554/eLife.45977.019| Gene abbreviation | Full gene name | Known function | Fold change bu Runx1 TG/WT | Fold change in WT HG vs bu |
|---|---|---|---|---|
| Figf | c-fos induced growth factor | Agiogenesis, VEGF signaling | 2x | 16x |
| Col5a1 | Colagen five type a1 | Ehlers‐Danlos syndrome with lethal arterial events | −11x | −2.7x |
| Adamts1 | A disintegrin-like and metallopeptidase thrombospondin type 1 | Negative regulation of angiogenesis | 2x | 2x |
| Cxcl1 | chemokine (C-X-C motif) ligand1 | Inflammatory response | 2x | 3x |
| Cxcl10 | chemokine (C-X-C motif) ligand10 | Negative regulation of angiogenesis | 6x | 16x |
| Edn1 | endothelin 1 | Patterning of blood vessels | 2x | 2x |
| Cxcl12 | chemokine (C-X-C motif) ligand 12 | Patterning of blood vessels | 2x | 2x |
| Cx3cl1 | chemokine (C-X3-C motif) ligand1 | Angiogenesis | 2x | 4x |
| Cxcl9 | chemokine (C-X-C motif) ligand9 | Inflammatory response | 7x | 10x |
| Pla2g7 | phospholipase A2, group VII (platelet-activating factor acetylhydrolase, plasma) | Inflammatory response | 10x | 6x |
| Sema3a | semaphorin 3A | Blood vessel patterning | 9x | 3x |
Key resources table
| Reagent type (species) or resource | Designation | Source or reference | Identifiers | Additional information |
|---|---|---|---|---|
| Genetic reagent (M. musculus) | Krt14-CreERT2 | PMID: 11034212 | RRID: MGI:2177426 | |
| Genetic reagent (M. musculus) | Cdh5-CreERT2 | PMID: 20445537 | RRID: MGI:3848982 | Dr. Anne Eichmann (Yale University) |
| Genetic reagent (M. musculus) | Alk1flox | PMID: 17911384 | RRID: MGI:4398901 | Dr. Anne Eichmann (Yale University) |
| Genetic reagent (M. musculus) | Runx1flox | PMID: 15784726 | RRID: MGI:3043614 | |
| Genetic reagent (M. musculus) | Rosa26-tdTomato | Jackson Laboratory | RRID: MGI:3809523 | |
| Genetic reagent (M. musculus) | C57BL/6 | Jackson Laboratory | RRID:MGI:3715241 | |
| Antibody | Anti-mouse-CD31 (Purified rat monoclonal) | BD Biosciences | BD Cat#: 550274, RRID: AB_393571 | 1:100 |
| Antibody | Anti-Ki67 (Rabbit polyclonal) | Abcam | Abcam Cat# ab15580, RRID:AB_443209 | 1:1000 |
| Antibody | Anti-Caspase-3 (Rabbit polyclonal) | R and D Systems | R and D Cat# AF835, RRID:AB_2243952 | 1:300 |
| Antibody | Anti-neurofilament-1 (Chicken polyclonal) | Millipore | Millipore Cat# AB5539, RRID:AB_11212161 | 1:1000 |
| Antibody | Anti-BMP4 (Rabbit polyclonal) | Abcam | Abcam Cat# ab39973, RRID:AB_2063523 | 1:1000 |
| Antibody | Anti-EphrinB2 (Rabbit monoclonal) | Abcam | Abcam Cat #: ab201512, RRID:AB_2810831 | 1:500 |
| Antibody | Anti-P-Cadherin (Rat monoclonal) | Thermo Fisher Scientific | Thermo Fisher Scientific Cat# 13-2000Z, RRID:AB_2533006 | 1:200 |
| Chemical compound, drug | Tamoxifen | Millipore | Millipore Cat#: T5648 | |
| Software, algorithm | ImageJ | ImageJ | RRID:SCR_003070 | |
| Software, algorithm | JMP Pro | SAS | RRID: SCR_014242 |
Additional files
-
Transparent reporting form
- https://doi.org/10.7554/eLife.45977.026
Download links
A two-part list of links to download the article, or parts of the article, in various formats.
Downloads (link to download the article as PDF)
Open citations (links to open the citations from this article in various online reference manager services)
Cite this article (links to download the citations from this article in formats compatible with various reference manager tools)
Skin vasculature and hair follicle cross-talking associated with stem cell activation and tissue homeostasis
eLife 8:e45977.
https://doi.org/10.7554/eLife.45977


