How prolonged expression of Hunchback, a temporal transcription factor, re-wires locomotor circuits
- University of Chicago, United States
Figures
Figure 1 with 1 supplement
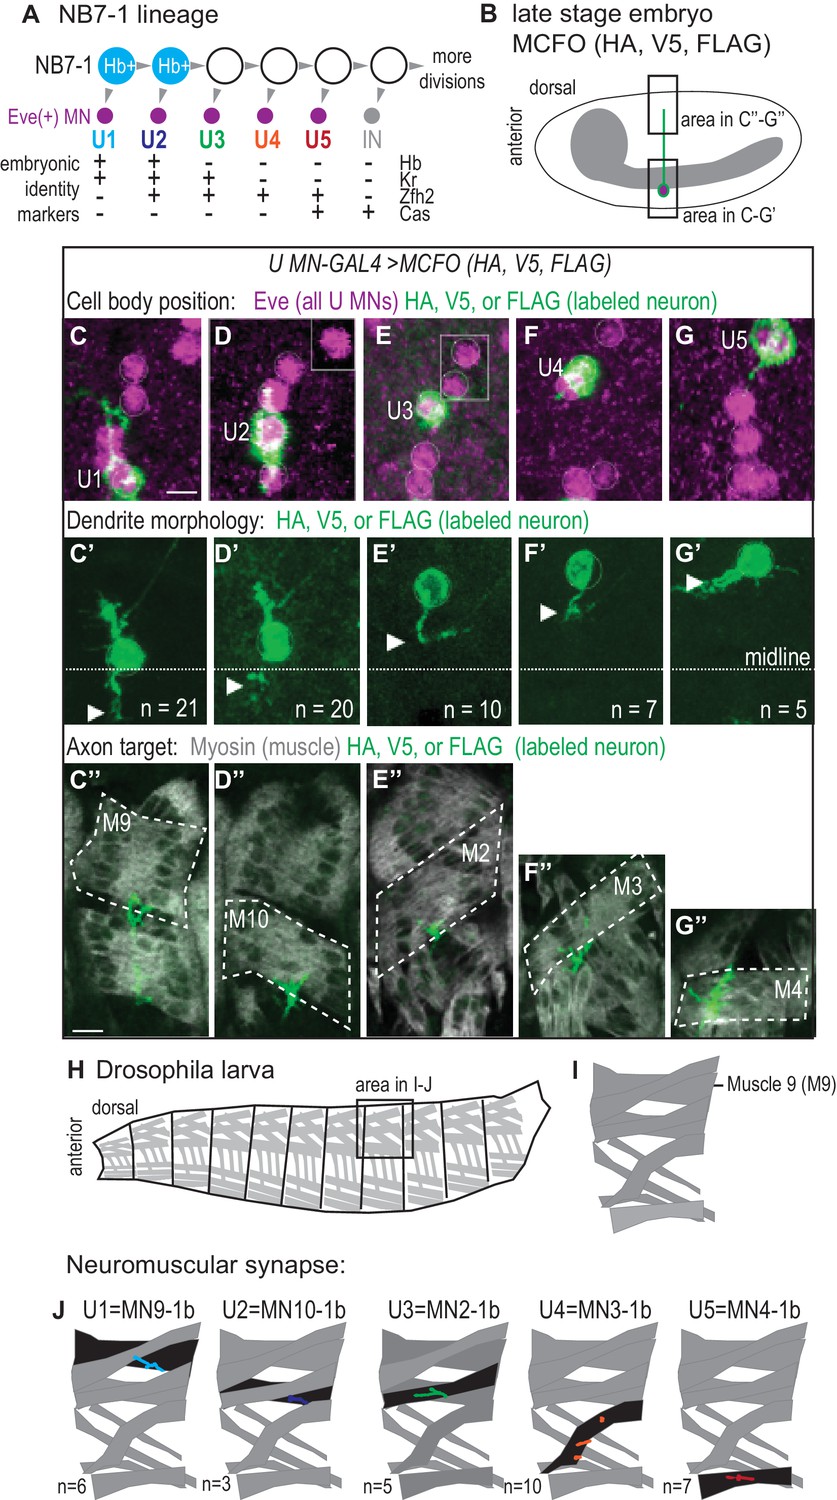
U motor neurons have unique embryonic molecular identities and unique terminal features.
(A) Illustration of the divisions of NB7-1. Each gray arrowhead represents cell division. Abbreviations: MN is motor neuron, IN is interneuron, Eve is Even-skipped, Hb is Hunchback, Kr is Kruppel, Zfh2 is Zinc finger homeodomain 2, and Cas is Castor. (B) Illustration of a Drosophila late stage embryo, CNS in gray, motor neuron in green, with cell body in magenta. (C–G’’) Images of individually labeled U motor neuron cell bodies in the CNS of late stage embryos. The same cell is shown in ventral view (C–G’) or lateral view (C”–G”). Multi-Color Flip Out (MCFO) transgenes were used to stochastically label neurons within a GAL4 pattern with membrane tethered epitope tags (HA, V5, FLAG). (C–G) Boxes are insets from a different focal plane. (C’–G’) U1/U2 motor neurons dendrite tips (arrowhead) cross the midline (dotted white line), whereas U3-U5 neurons do not. n = number of single-labeled Eve(+) cells. (C”–G”) Axons project to unique dorsal muscles (dotted outline, M stands for muscle, for example M9 is muscle 9). (H–I) Illustrations of Drosophila larval muscles. (H) The larval body is organized into repeated left-right, mirror image hemisegments. (I) In a hemisegment, individual muscles are identified and named by characteristic morphology. (J) Illustration of individual U motor neuron neuromuscular synapses onto dorsal muscles in larvae. Embryonic motor neuron (e.g., U1) and larval motor neuron synapse (e.g. MN9-1b) names are shown. n = number of single-labeled Eve(+) cells. Color code as in A. For sample of larval image data see Figure 1—figure supplement 1. Images in (C–G’) are shown anterior to the left. Scale bars represent five microns (C’–G’) and 10 microns (C”–G”). MCFO transgenes were driven with a U MN-GAL4 line, CQ2-GAL4 (hsFLP; CQ2-GAL4/+; UAS(FRT.stop)myr::smGdP-HA, UAS(FRT.stop)myr::smGdP-V5-THSUAS(FRT.stop)myr::smGdP-FLAG/+).
Figure 1—figure supplement 1
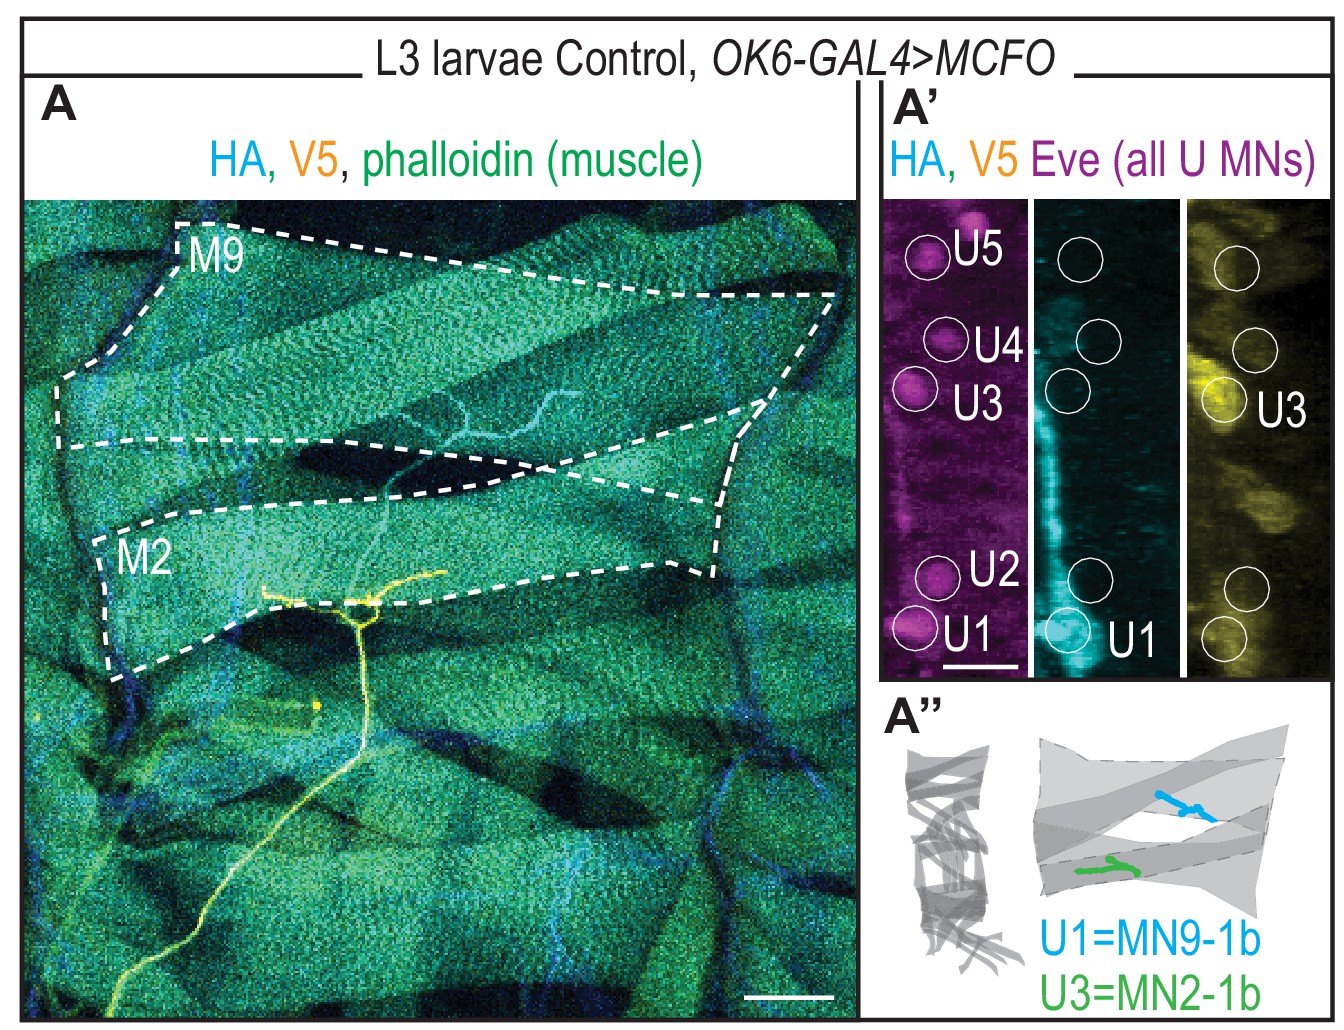
U Motor Neuron axon projection in third instar (L3) Drosophila larva.
(A) Image of individually labeled U motor neuron axons. The dorsal-most region in a body wall segment of a L3 fillet dissected larva is shown. MCFO transgenes were driven with a pan motor neuron-GAL4 line, OK6-GAL4 (hsFLP; OK6-GAL4/+; UAS(FRT.stop)myr::smGdP-HA, UAS(FRT.stop)myr::smGdP-V5-THSUAS(FRT.stop)myr::smGdP-FLAG/+). Axons project to unique dorsal muscles (dotted). Midline is down. (A’) Image of individually labeled U motor neuron cell bodies (in white circles) from A in the CNS of L3 larvae. (A’’) Illustration of a Drosophila L3 bodywall segment imaged in A. Embryonic (e.g., U1) and larval (e.g. MN9-1b) motor neuron names are color coded with neuromuscular synapse location. Color code as in Figure 1. Image in (A) shown with dorsal up, anterior to the left. Image in (A’) shown with lateral up, anterior to the left. Scale bars represent 50 microns (A) and five microns (A’).
Figure 2 with 1 supplement
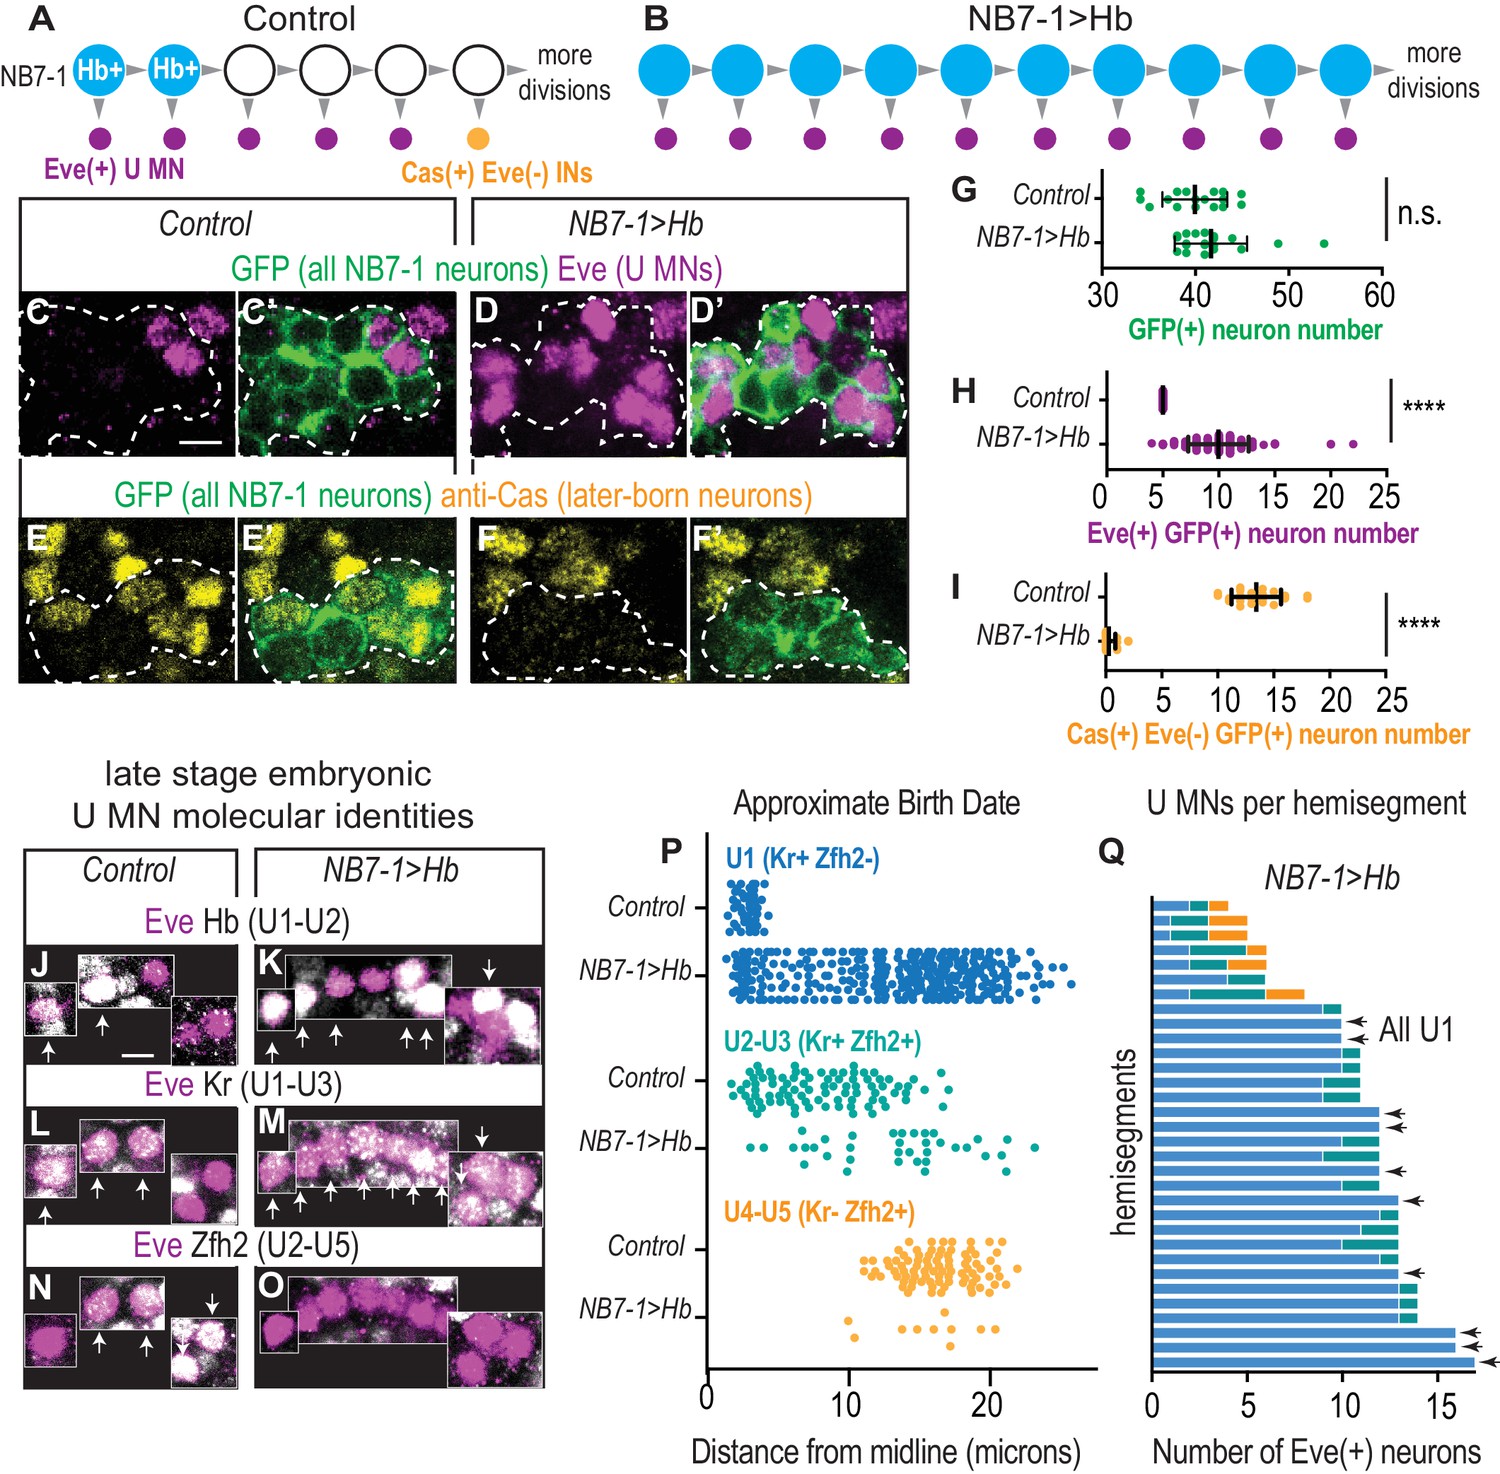
In embryos with prolonged Hb expression, U motor neurons are produced at abnormally late times in development.
(A–B) Illustrations of NB7-1 lineage progression. Each gray arrowhead represents cell division. Large circles are neuroblasts, and smaller circles are neurons. In NB7−1>Hb, ectopic Eve(+) neurons (magenta) are produced when later-born Cas(+) NB7-1 interneurons (yellow) are normally produced. (C–F’) Images of late stage embryonic CNSs show distribution of Eve(+) and Cas(+) neurons. Data quantified in (G–I). GFP (+) neurons from NB7-1 are outlined in white dotted lines. (G–I) Quantification of NB7-1 neurons in Control and NB7−1>Hb. (G) Total neurons (H) Eve(+) neurons (I) Cas(+) neurons. For Controls n = 17, 23, 19 and for NB7−1>Hb n=20, 30, 14 for (G–I), respectively. (J–O) Images of embryonic molecular identity marker expression in Eve(+) cells in late stage embryonic CNSs. In NB7−1>Hb, extra Eve(+) cells are produced, most of which have U1 molecular identities. Boxes are neurons from different z-planes. Arrows indicate co-expression. (P) Quantification of distance from midline is a proxy for neuronal birth time. In NB7−1>Hb, Eve(+) cells co-labeled with U1 molecular markers are born at abnormally late times in lineage progression. Control n = 44, 88, 88, NB7−1>Hb n=301, 40, 10. (Q) Quantification of Eve(+) neuron molecular identity in single hemisegments. In NB7−1>Hb, there is hemisegment by hemisegment variability. Arrows point to hemisegments in which all Eve(+) neurons have U1 molecular identity. Color code follows (P). All images are shown in ventral view, anterior up and midline to the left. Scale bars represent five microns. For quantifications each dot represents single neuron cell bodies in abdominal hemisegments. Average and standard deviation are overlaid. Un-paired t-Test.’ n.s.’ not significant, ‘****’p<0.0001. In C-I, Control is NB7-1-GAL4/+; UAS-myr-GFP/+ and NB7−1>Hb is NB7-1-GAL4/UAS-Hb; UAS-myr-GFP/UAS-Hb. In J-Q, Control is w1118 and NB7−1>Hb is NB7-1-GAL4/UAS-Hb; UAS-Hb/+.
-
Figure 2—source data 1
Source Data for Figure 2.
- https://doi.org/10.7554/eLife.46089.006
Figure 2—figure supplement 1
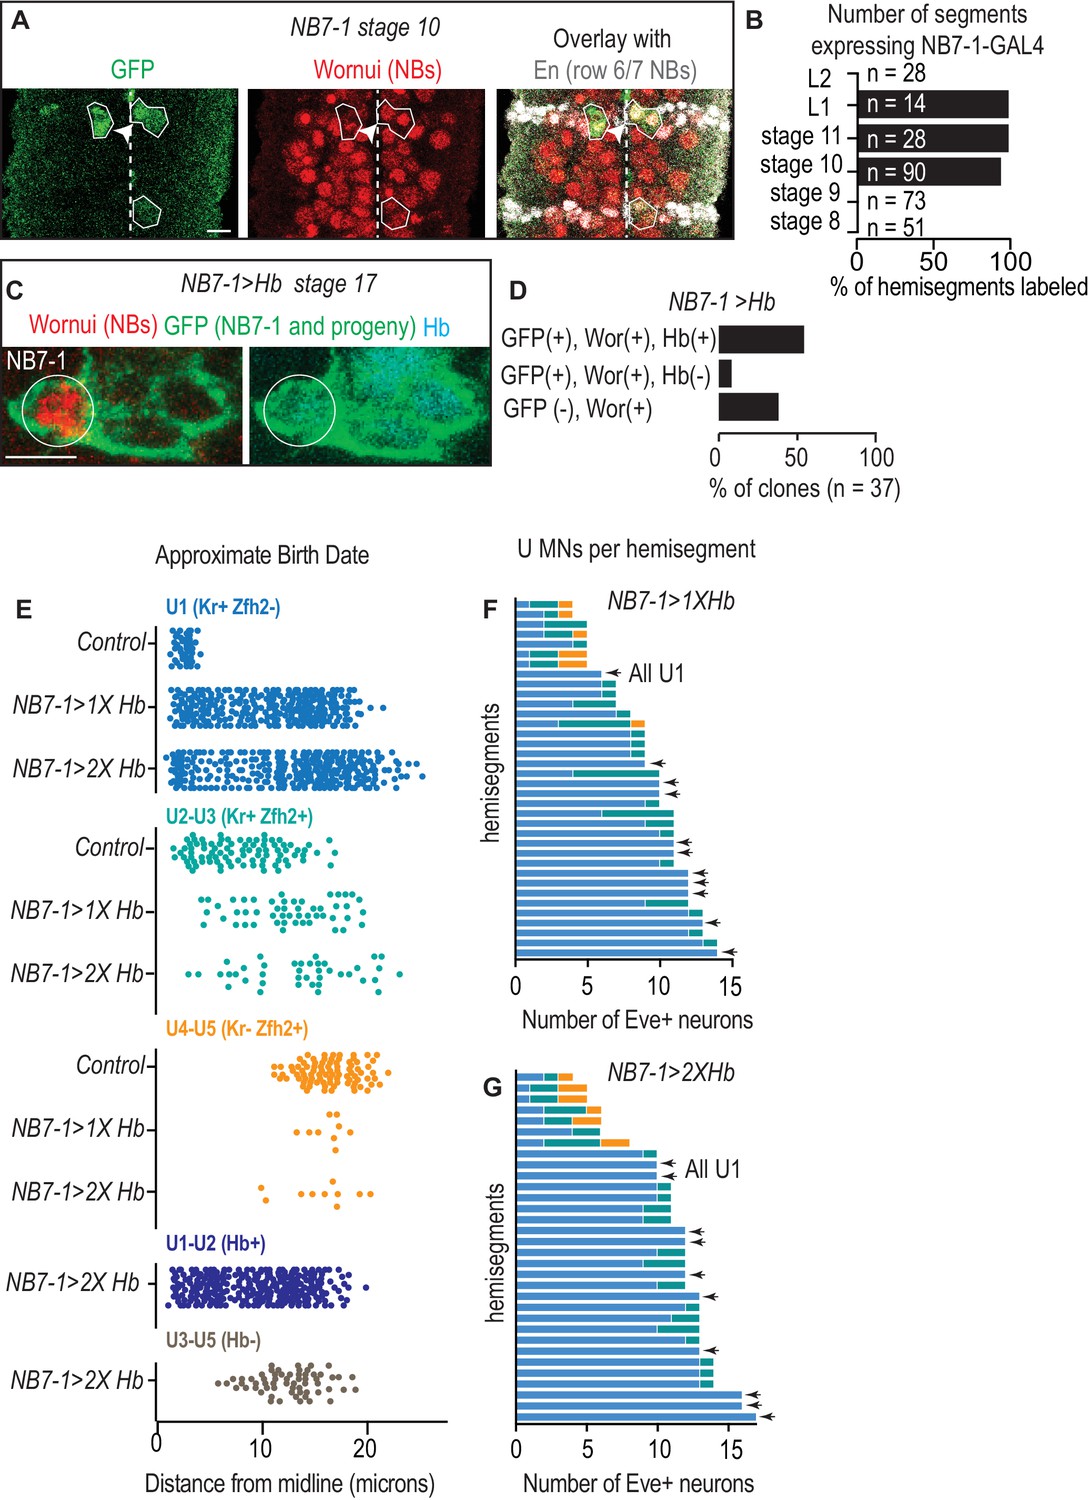
Characterization of NB7-1-GAL4.
(A) Image of GFP in NB7-1 as a reporter of NB7-1-GAL4 activity. NB7-1 is gooseberry-DBD, achaete-VP16/+; UAS-nls-GFP/+. NB is neuroblast. Arrowhead points to NB6-1, which is occasionally labeled. One complete abdominal segment is shown with anterior up, and midline dotted. (B) Quantification of percent of hemisegments expressing GFP under the control of NB7-1-GAL4 at different stages. n = number of hemisegments scored per stage. (C) Image of a late stage embryo showing NB7-1 and its latest born progeny in NB7−1>Hb. Genotype is gooseberry-DBD, achaete-VP16/UAS-Hb; UAS-nls-GFP/UAS-Hb. NB7-1 is circled. (D) Quantification of Hb expression in NB7-1 in late stage embryos. In a majority of segments, there are GFP(+) Wor(+) Hb(+) cells, showing Hb is expressed throughout neurogenesis in NB7-1. In fewer segments, there are GFP(+) Wor(+) Hb(-) cells, in which GFP expression persists but Hb expression does not, suggesting NB7-1-GAL4 is no longer active, or there are GFP(-) Wor (+) cells in which no GFP expression exists, again suggesting that NB7-1-GAL4 is not active in NB7-1. Genotype is the same as C. (E–G) Quantification of Eve(+) neuron molecular identities in NB7−1>Hb with different levels of Hb. (E) Quantification of distance from midline, which is a proxy for neuronal birth time, for Eve(+) cells with different molecular markers. For Control n = 44, 88, 283, NB7−1>1X Hb n = 284, 51, 9, NB7−1>2X Hb n = 301, 40,10, 283, 61. (F–G) Quantification of Eve(+) neurons in single hemisegments. Color code as in E. Control is w1118, NB7−1>1X Hb is NB7-1 GAL4/+; UAS-Hb/+, and NB7−1>Hb is NB7-1-GAL4/UAS-Hb; UAS-Hb/+. All images are shown in ventral view, anterior up, and lateral to the left. Scale bars represents five microns.
Figure 3
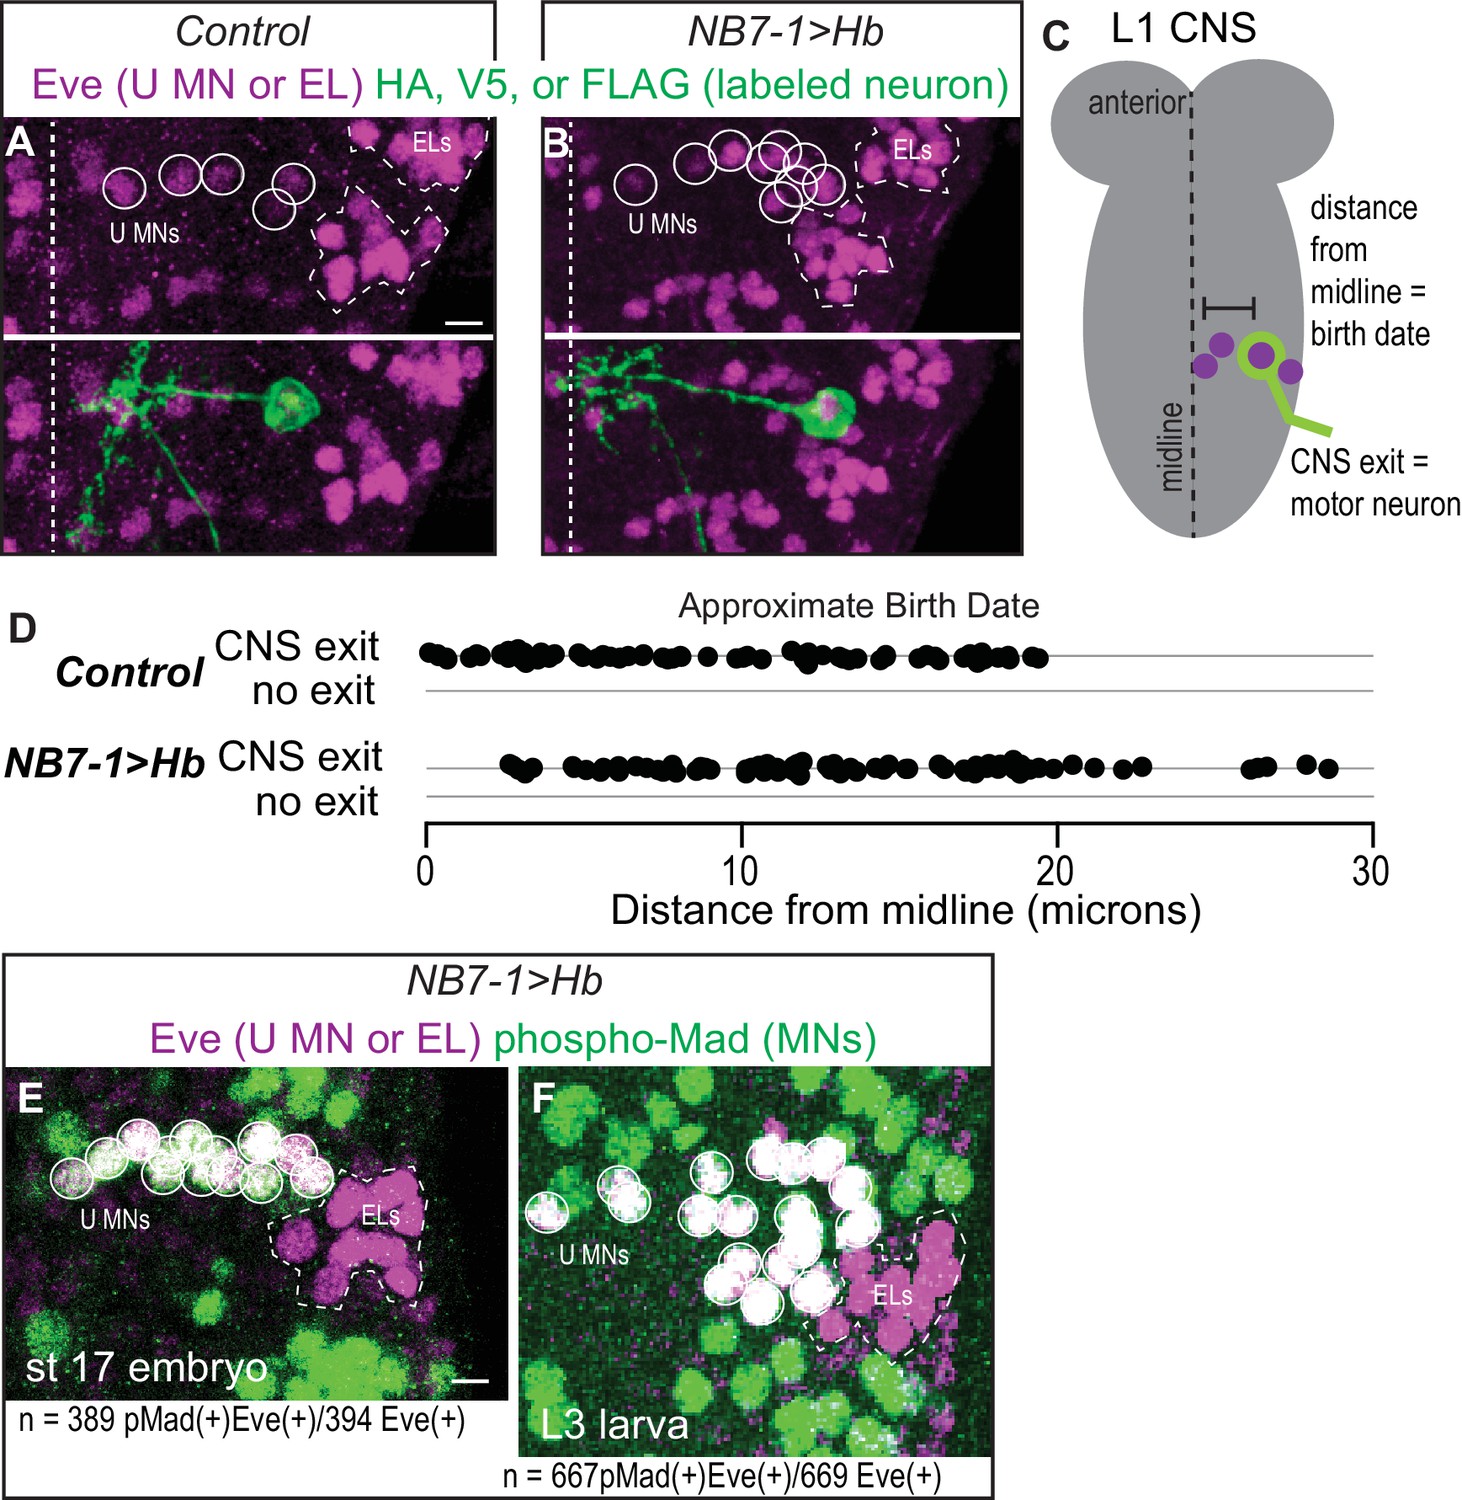
Prolonged expression of Hb in NB7-1 produces more U motor neurons.
(A–B) Images of individually-labeled Eve(+) neurons in isolated first instar larvae (L1) CNSs. U motor neurons from NB7-1 are circled in white. Dotted line outlines EL interneurons (from NB3-3). Midline is dashed. (C) Illustration of isolated L1 CNS shows how data plotted in D were generated. Distance from the midline of stochastically labeled (green) motor neurons was measured. (D) Quantification of distance from midline, which is a proxy for neuronal birth time, for stochastically labeled Eve(+) cells in Control and NB7−1>Hb. Each dot represents a single neuron. Every Eve(+) neuron sends a process out of the CNS regardless of birth time. For Control n = 75, for NB7−1>Hb n=78. (E–F) Images of co-expression of Eve and the pan-motor neuron marker, pMad in NB7−1>Hb CNS of various stages. Eve(+) neurons in NB7-1 are motor neurons that survive until late larval stages. White circles outline individual U motor neurons and dotted white lines outline EL interneurons. All images are shown in ventral view, anterior up and midline to the left. Scale bars represent five microns. (A–D) Control is hsFLP; NB7-1-GAL4/+; UAS(FRT.stop)myr::smGdP-HA, UAS(FRT.stop)myr::smGdP-V5-THSUAS(FRT.stop)myr::smGdP-FLAG/+ and NB7−1>Hb is hsFLP; NB7-1-GAL4/UAS Hb; UAS(FRT.stop)myr::smGdP-HA, UAS(FRT.stop)myr::smGdP-V5-THSUAS(FRT.stop)myr::smGdP-FLAG/UAS Hb. (E–F) NB7−1>Hb is NB7-1-GAL4/UAS-Hb; UAS-Hb/+.
Figure 4
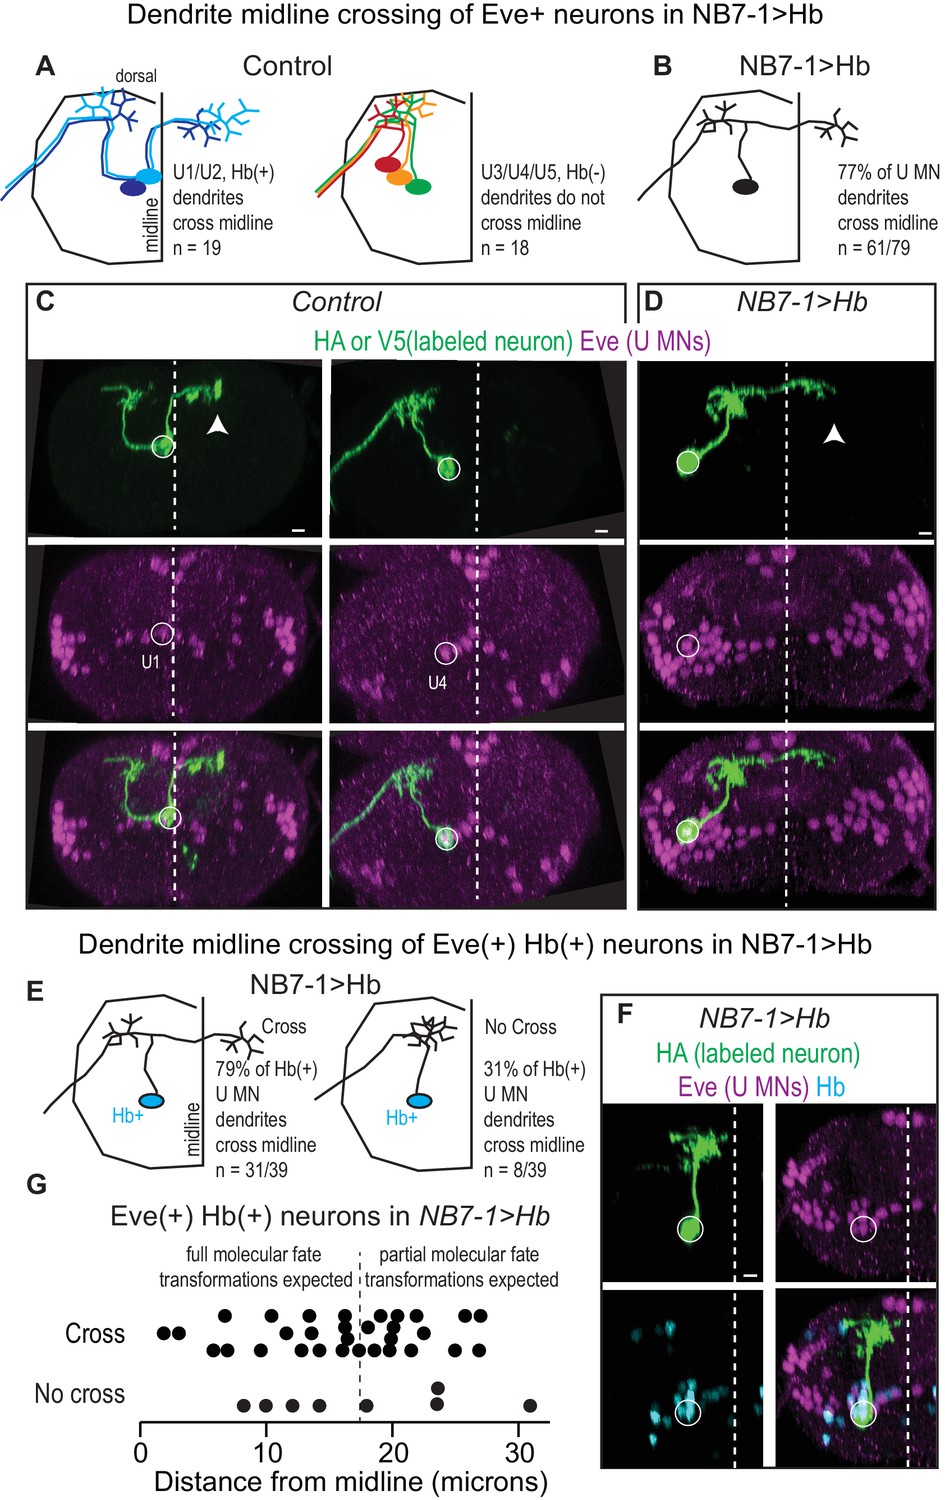
Prolonged expression of Hb in NB7-1 alters U motor neuron dendritic arbors.
(A–B) Illustrations of U motor neuron dendrite morphology in Control and NB7−1>Hb shown in transverse view. In Control, light blue is U1, dark blue is U2, green is U3, orange is U4, and red is U5. In NB7−1>Hb, black is a Eve(+) U motor neuron. (C–D) Images of individually-labeled U motor neurons in the L1 CNS of Control and NB7−1>Hb. In Control, U1 has contralateral dendrites (white arrow) crossing the midline (white dotted line), whereas U4 has ipsilateral dendrites. In this NB7−1>Hb example, a contralaterally projecting U motor neuron is shown (white arrow). (E) Illustrations of different dendrite morphologies in NB7−1>Hb, for Hb(+) U motor neurons (blue). Most, but not all are contralateral. (G) Quantification of distance from midline for Eve(+) Hb(+) U MN neurons in L1 CNS of NB7−1>Hb. Black dotted line marks the distance from the midline for the lateral-most Eve(+) U motor neuron in Control (W1118), which is produced by the fifth division of NB7-1. After the fifth division of NB7-1 a nuclear remodeling event occurs. When Hb expression is prolonged in NB7-1 this remodeling event restricts the molecular fate transformations of U motor neurons born after the fifth division (Kohwi et al., 2013). (F) Image of Hb(+) U MN neuron dendrite morphology in L1 CNS of NB7−1>Hb. Here, in NB7−1>Hb, a Hb(+) U MN has an ipsilateral dendrite that does not cross the midline (white dotted line). All images are shown in transverse view, dorsal up, arrowheads pointing to dendrites crossing midline (white dotted line). The cell body location for labeled neurons are circled. Scale bar represents five microns. Control is hsFLP; NB7-1-GAL4/+; UAS(FRT.stop)myr::smGdPHA, UAS(FRT.stop)myr::smGdP-V5-THS-UAS(FRT.stop)myr::smGdP-FLAG/+ and NB7−1>Hb MCFO is hsFLP; NB7-1-GAL4/UAS-Hb; UAS(FRT.stop)myr::smGdP-HA, UAS(FRT.stop)myr::smGdP-V5-THS-UAS(FRT.stop)myr::smGdP-FLAG/UAS-Hb.
Figure 5 with 1 supplement
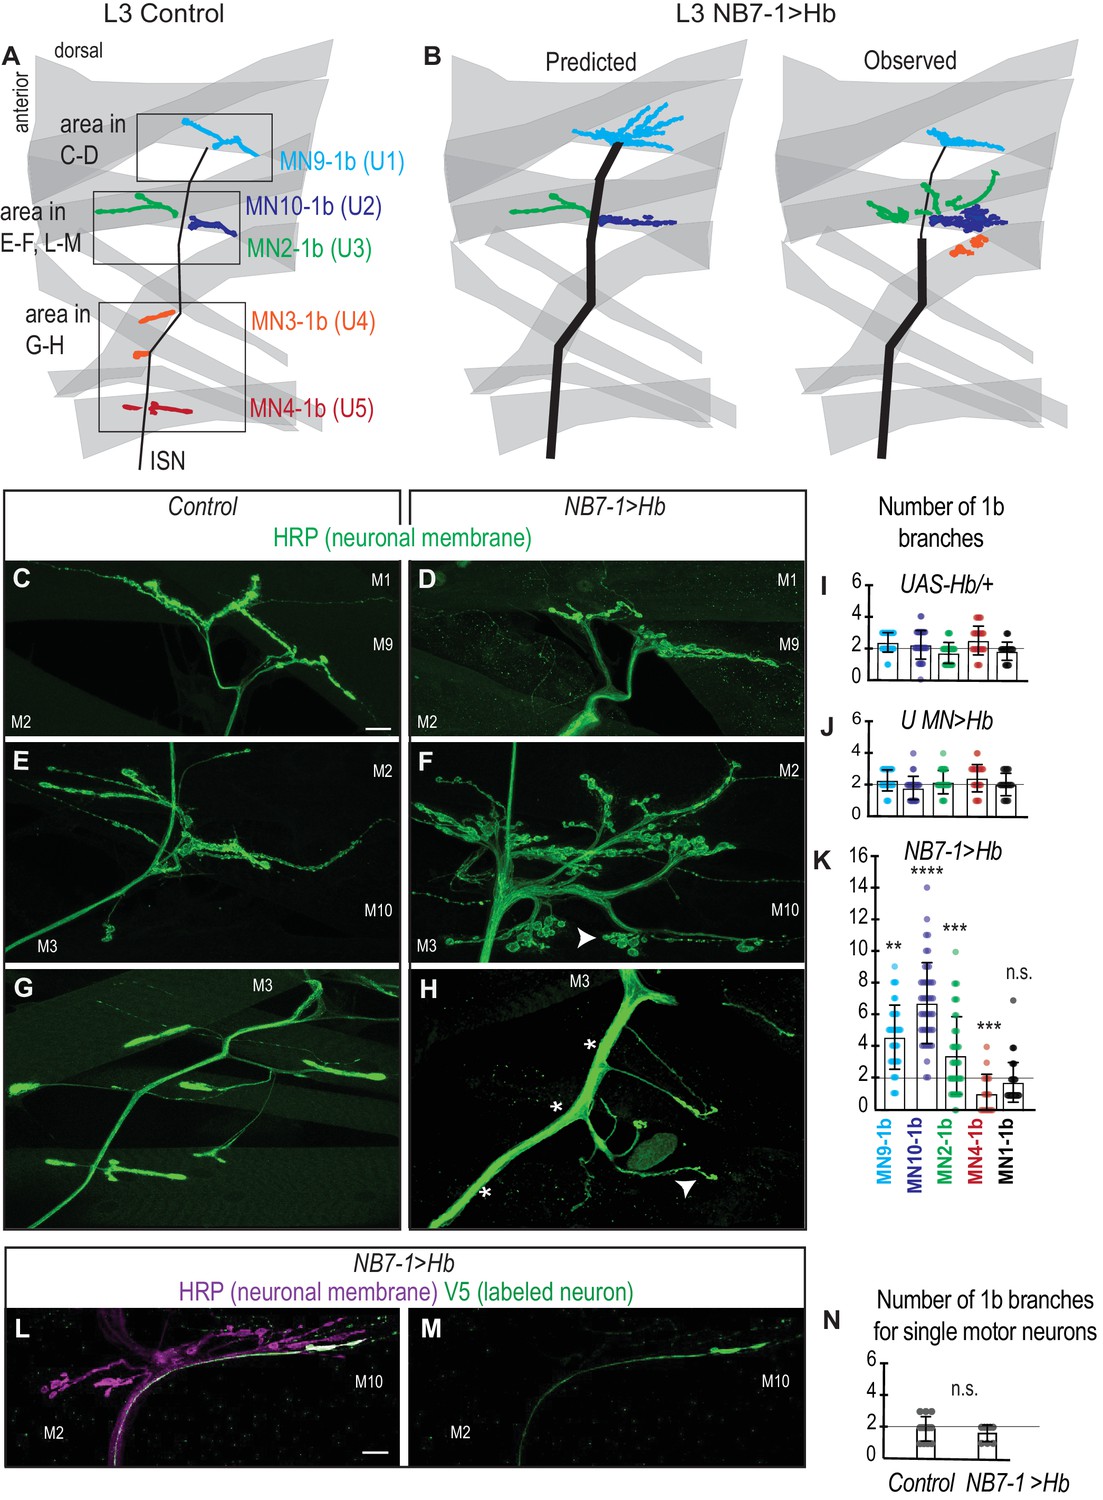
Prolonged expression of Hb in NB7-1 alters U motor neuromuscular synapses.
(A–B) Illustrations of neuromuscular synapses on dorsal muscles in a L3 body wall segment. Control synapses are based on third instar larval MCFO data (see Figure 1—figure supplement 1). In NB7−1>Hb, predicted neuromuscular synapses are inferred from Control neuromuscular wiring patterns and from NB7−1>Hb embryonic molecular identity data (see Figure 2). Observed neuromuscular synapses are described in C-H. ISN is intersegmental nerve. (C–H) Images of neuronal membrane—both axons and neuromuscular synapses—on dorsal muscles in L3 bodywall segments. Arrow indicates branching onto M3. An asterisk * indicates missing synapses. Data quantified in (I–K). (I–K) Quantification of the number of 1b branches on L3 muscles. Color code as in (A). Line intersects the y-axis at 2. Each dot represents the number of branches onto a single muscle. (I) For UAS-Hb/+ n = 32, 35, 33, 36, 36, (J) For U MN >Hb n=11, 11, 11, 12, 11, (K) For NB7−1>Hb n=39, 46, 44, 18, 46, numbers listed from MN9-1b to MN1-1b. (L–M) Images of all neuronal membrane (magenta) on dorsal muscles in L3 bodywall segments of NB7−1>Hb with a single U motor neuron labeled (green). (N) Quantification of the number of 1b branches from individual U motor neurons on dorsal L3 muscles in Control and NB7−1>Hb. Line intersects the y-axis at two branch number. For WT n = 13, NB7−1>Hb n=8. All images are shown dorsal up, anterior left. Scale bars represent 10 microns. Control is w1118 (C, E, G), or hsFLP; OK6-GAL4/+; UAS-MCFO/+ (N). UAS-Hb/+ is UAS-Hb/+, UAS-Hb/+. U MN>Hb is CQ2-GAL4/UAS-Hb; CQ2-GAL4/UAS-Hb. NB7−1>Hb is NB7-1-GAL4/UAS-Hb; UAS-Hb/+ (D–H, K) ands hsFLP; Vglut-lexA/NB7-1-GAL4; lexAop-FRT-stop-FRT-EGFP/UAS-Hb (L–N). For quantifications average and standard deviation are overlaid. ANOVA, corrected for multiple samples ‘ns’ not significant, ‘**’ p<0.05, ‘***’ p<0.001, ‘****’ p<0.0001.
-
Figure 5—source data 1
Source Data for Figure 5.
- https://doi.org/10.7554/eLife.46089.011
Figure 5—figure supplement 1
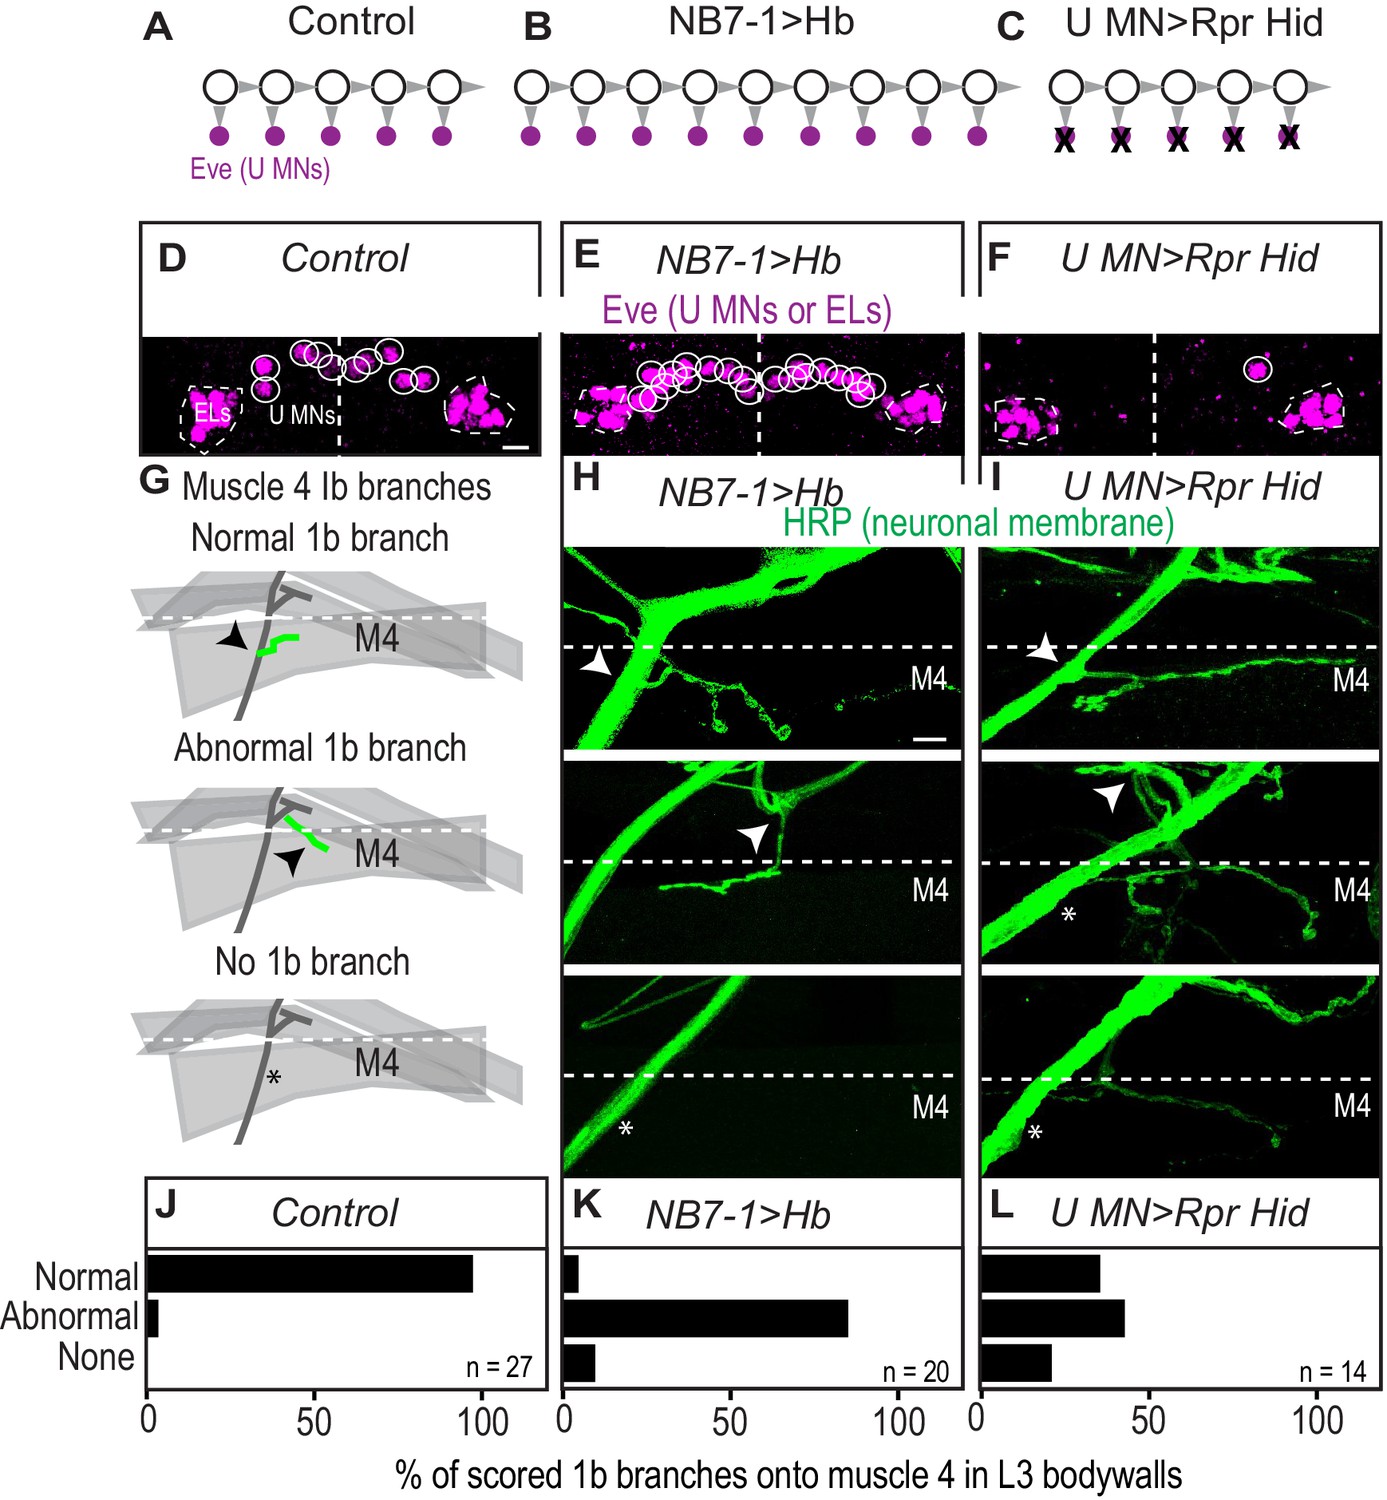
U Motor neuron ablation.
(A–C) Illustration of the number of Eve(+) U motor neurons in (A) Control, (B) NB7−1>Hb and (C) U motor neuron ablated genotype, U MN>Rpr Hid. NB7-1 is represented by large circles. Each gray arrowhead represents cell division. Small magenta circles represent Eve(+) U motor neurons. Black Xs represent cell death. (D–F) Images of Eve(+) U motor neurons in late stage embryo CNS segments with midline running through the middle (white dotted line). U motor neurons from NB7-1 are circled in white. Dotted line, outlines EL interneurons (from NB3-3). (G) Illustration of scored branch point of 1b branches on L3 muscle 4 (M4). Arrow indicates branch point from intersegmental nerve on m 4.* indicates missing branches. Dotted line represents dorsal edge of muscle 4 (see H-I). (H–I) Images of neuronal membrane on L3 muscle 4 (M4). Markings same as in G. (J–L) Quantification of the percentage of total 1b branches that were scored as either normal, abnormal, or absent on L3 muscle 4 (see G-I). n = number of total branches that were scored. Images in (D–F) are shown in ventral view, anterior up, lateral left. Scale bar represents five microns. Images in (H–I) are shown dorsal up, anterior left. Scale bar represents 10 microns. Control is w1118. NB7−1>Hb is NB7-1/+; NB7-1/UAS-Hb. U MN>RPR HID is UAS-Rpr Hid; CQ2-GAL4/+; CQ2-GAL4/+.
Figure 6 with 1 supplement
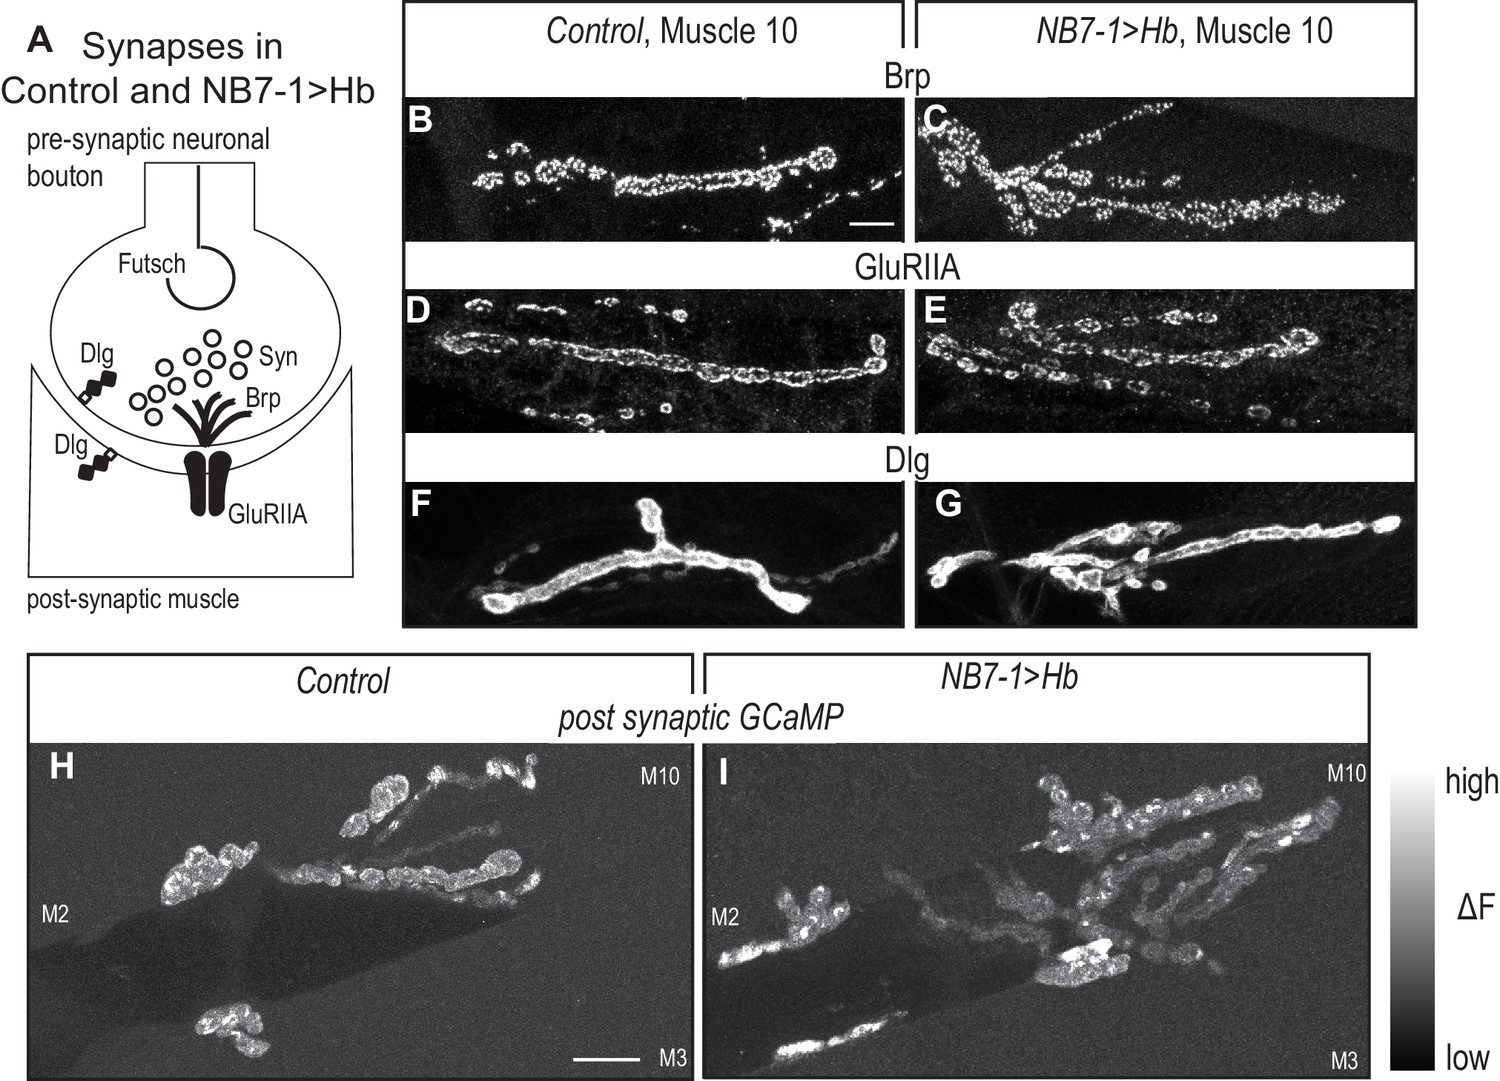
Altered synaptic arbors on dorsal muscles contain functional synapses.
(A) Illustration of subcellular localization of neuromuscular synapse markers. Futsch labels microtubules; Synapsin (Syn) labels neurotransmitter filled synaptic vesicles; Brunchpilot (Brp) labels active zones; Glutamate Receptor IIA (GluRIIA) labels neurotransmitter receptors; Discs large (Dlg) is a scaffolding protein. (B–G) Images of neuromuscular synapses on L3 muscle 10. There is no difference in distribution or abundance of synaptic markers between Control (w1118) and NB7−1>Hb (NB7-1-GAL4/UASHb, UAS-Hb/+). (H–I) Images of fluorescence intensity changes in a calcium indicator of synaptic activity. GCaMP was targeted to the post-synaptic density for example (DLG in F-G). When pre-synaptic vesicles are released from active zones (Brp in B-C) post-synaptic neurotransmitter receptors respond (GluRIIA in D-E), increasing GCaMP fluorescence intensity (see Figure 6—figure supplement 1 for details). Images show post-synaptic responses (delta F) in L3 muscles 2, 3, and 10 (M2, M3, M10) in Control (NB7-1-GAL4/+; MHC-CD8-GCaMP6f-Sh/+) and NB7−1>Hb (NB7-1 GAL4/UAS Hb; MHC-CD8-GCaMP6f-Sh/UAS Hb) over a 5 min imaging period. All images are shown dorsal up, anterior to the left. Scale bar represents 10 microns.
Figure 6—figure supplement 1
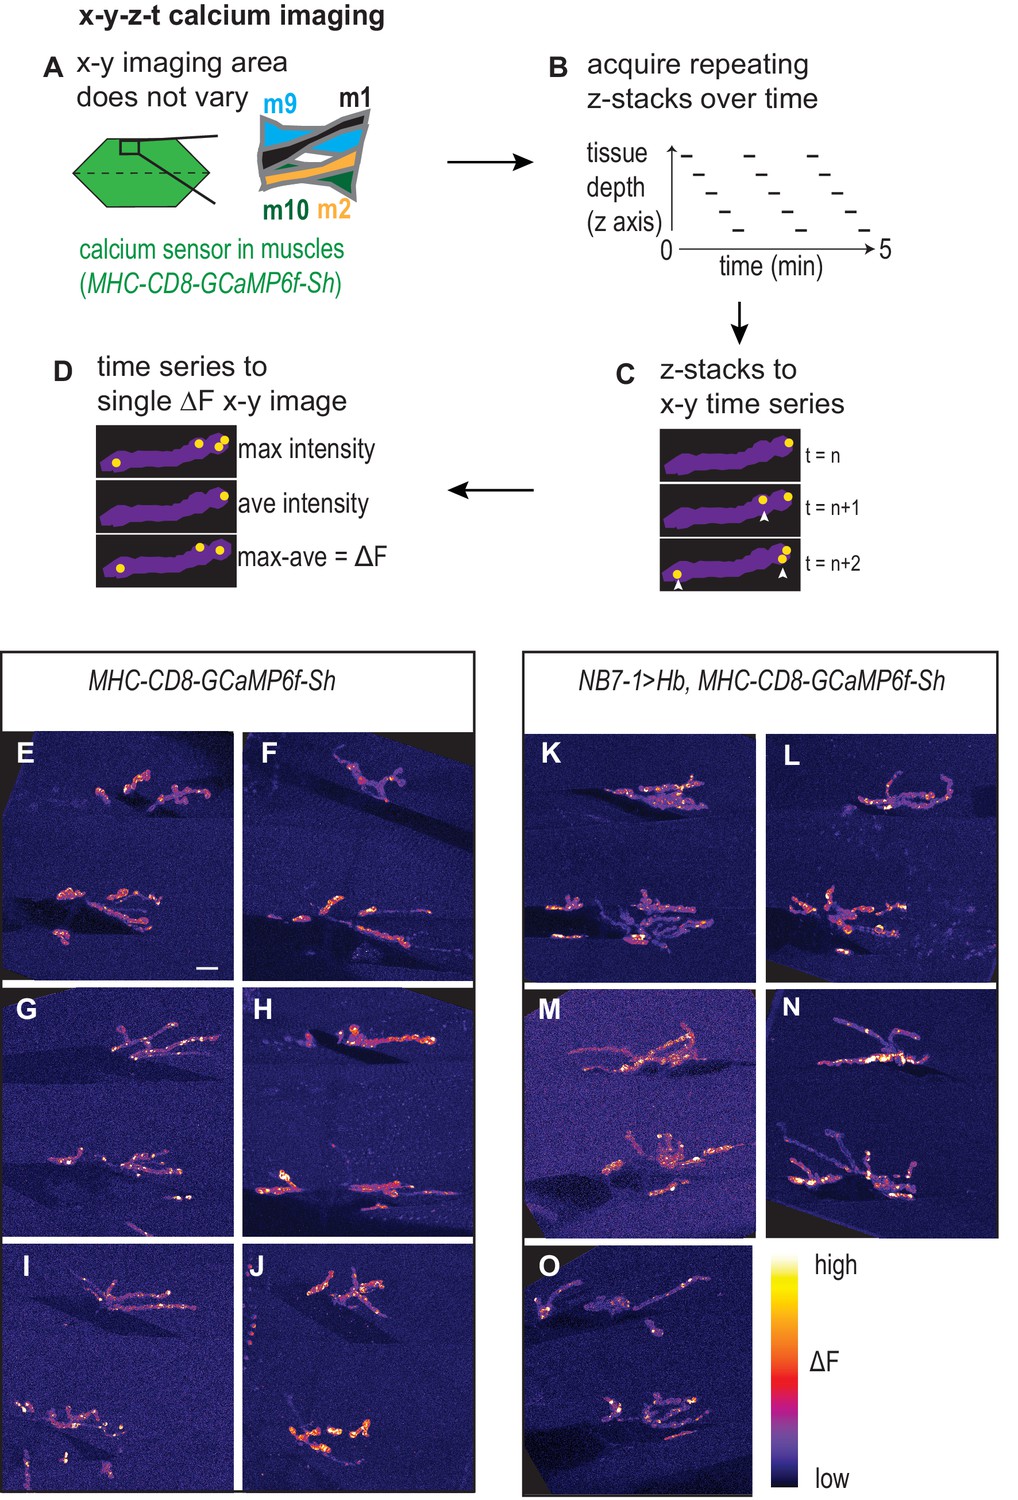
Calcium imaging protocol, analysis, and examples.
(A–D) Illustration of calcium imaging protocol and analysis are shown. See Materials and methods for details. (E–O) Images of calcium signals on L3 muscles 1, 2, 9, 10 for Control (NB7-1-GAL4/+; MHC-CD8-GCaMP6f-Sh/+) and NB7−1>Hb (NB7-1 GAL4/UAS Hb; MHC-CD8-GCaMP6f-Sh/UAS Hb). Images are dorsal up, anterior to the left. Scale bar represents five microns.
Figure 7
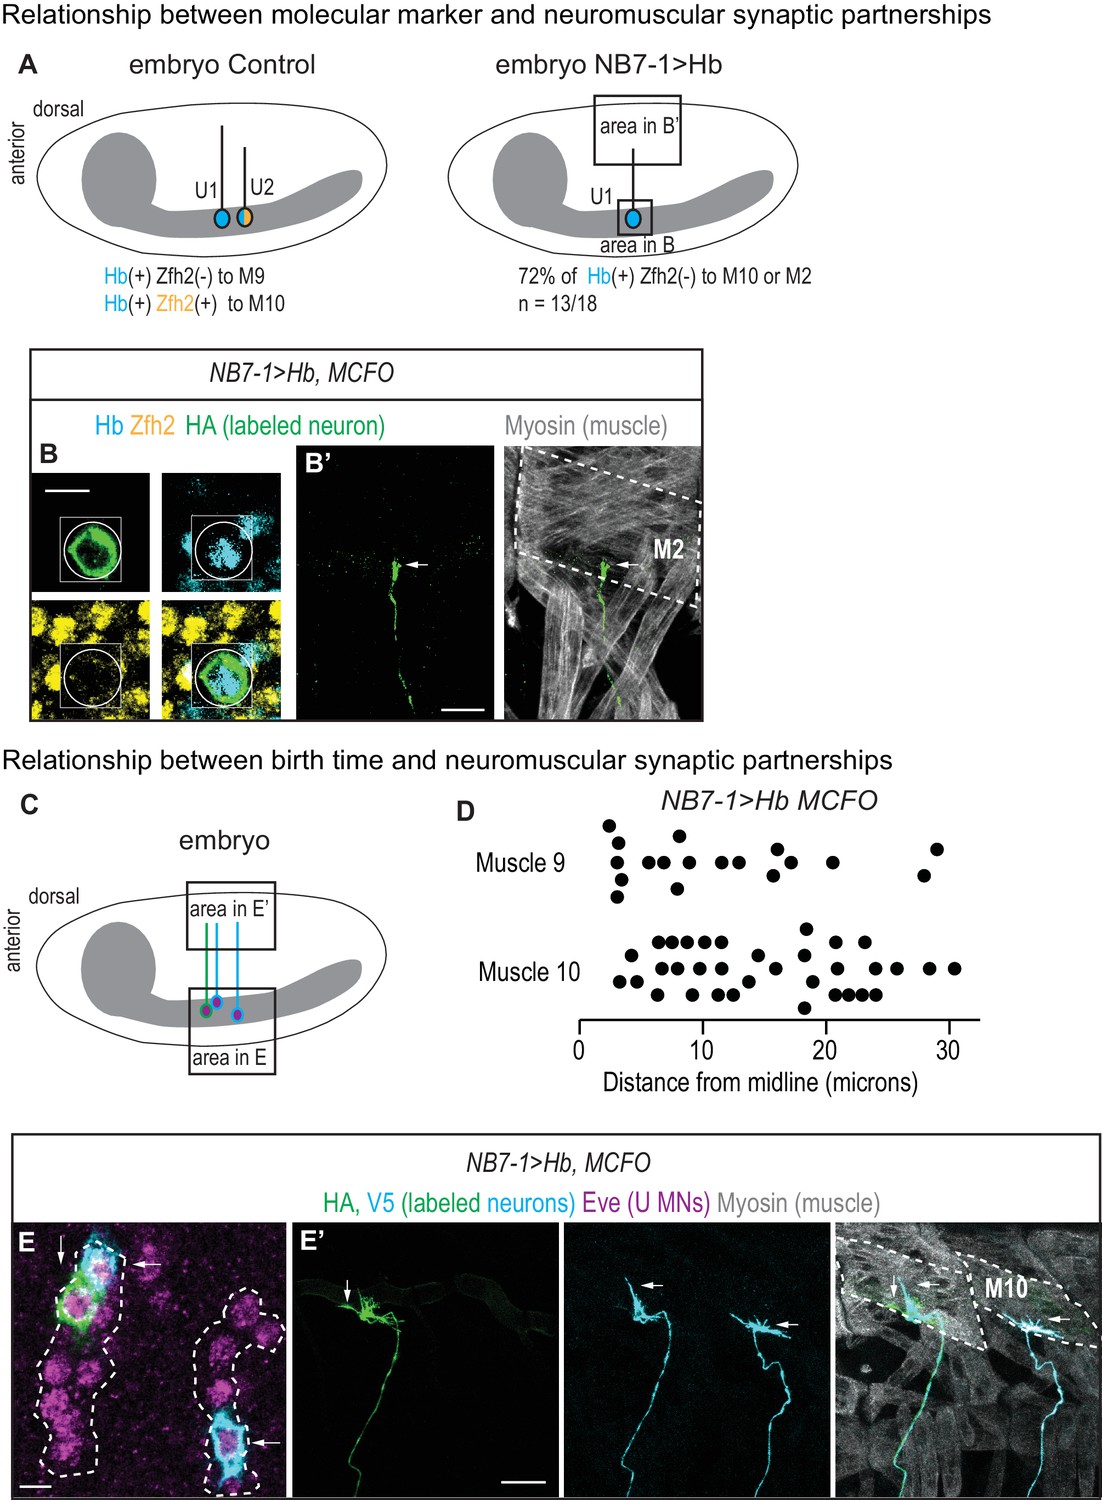
U motor neuron axonal trajectories are not accurately predicted by embryonic molecular identity or birth timing.
(A) Illustrations of Drosophila late stage embryos, CNS is gray. In Control, Hb(+) and Zfh2(-) neurons (U1) send axons to muscle 9, and Hb(+) Zfh2(+) neurons (U2) send axons to muscle 10. Whereas in NB7−1>Hb, Hb(+) Zfh2(-) (U1) neurons often send axons to muscle 10 or muscle 2. (B–B’) Images of an individually-labeled U motor neuron in a late stage, whole-mount, NB7−1>Hb embryo in ventral (B) and lateral views (B’). An individual Hb(+) (cyan) Zfh2(-) (yellow) cell is labeled with MCFO (circled). Boxes are neurons from different z-planes. (B’) The labeled U motor neuron axon projects (arrow) to muscle 2 (M2, dotted). (C) Illustration of a Drosophila late stage embryo. In NB7−1>Hb, U motor neurons at different positions along the medio-lateral axis all send axons to dorsal-most muscles, muscles 9 and 10. (D) Quantification of distance from midline, which is a proxy for neuronal birth time, for individual Eve(+) U motor neurons labeled with MCFO. Dots represent single neurons. For muscle 9 and muscle 10, n = 18, 34, respectively. (E–E’) Images of a late stage, whole-mount, NB7−1>Hb embryo shown in ventral (E) and lateral (E’) views. (E) There are >5 U motor neurons from NB7-1 in each hemisegment (dotted line), three of which are labeled by MCFO. (E’) Axons from Eve(+) cells project to muscle 10 (M10, dotted). Vertical and horizontal arrows point to the same HA(+) and V5(+) cells, respectively (E–E’). Images in (B,E) are shown lateral up, anterior to the left. Images in (B’,E’’) are shown with dorsal up, anterior to the left. Scale bar represents five microns for B and E. Scale bar represents 10 microns for B’ and E’. NB7−1>Hb, MCFO is hsFLP; NB7-1-GAL4/UASHb; UAS(FRT.stop)myr::smGdP-HA, UAS(FRT.stop)myr::smGdP-V5 THSUAS(FRT.stop)myr::smGdP-FLAG/UAS-Hb.
Figure 8

In NB7−1>Hb, U1 motor neuron identity is only transiently specified.
(A–B) Illustrations of the divisions of NB7-1 in Control and in NB7−1>Hb. Each gray arrowhead represents cell division, large circles represent NB7-1. The top row of small circles represent U motor neurons in late stage embryos and the bottom row represent U motor neurons in L3. In Control, two neurons are Hb(+) (blue) at both stages, whereas in NB7−1>Hb many neurons are Hb(+) in embryos, but by late L3 there only two or three Hb(+) neurons. (C) Quantification of Eve(+) Hb(+) U motor neurons at two different stages: late stage embryos (Em) and late stage larvae (L3), n = 36, 28, 38, 84 from left to right. (D–F) Images of molecular identity, Hb(+), expression in isolated third instar larvae (L3) CNS. Eve(+) U motor neurons from NB7-1 are circled in white and co-localization with Hb(+) is shown (arrows). Dotted line outlines EL interneurons (from NB3-3). Data quantified in (G). (G) Quantification of Eve(+) Hb(+) U motor neuron (blue) number and total Eve(+) U motor neurons (white) neuron number at L3. Altering Hb expression level in NB7-1 by changing transgene copy number and temperature has little effect on the total number of Eve(+) neurons and has no effect on the number of Hb(+) Eve(+) neurons. For Control n = 28, NB7−1>1X Hb n = 68, NB7−1>2X Hb n = 84, NB7−1>2X Hb 29 °C n = 27, NB7−1>4X Hb n = 12. (H) Quantification of the number of 1b branches onto L3 muscle 9 and muscle 10 in NB7−1>Hb manipulations with either 2 or 3 Hb(+) Eve(+) U motor neurons. Line intersects the y-axis at two branch number. For MN9-1b 2 Hb(+) neurons n = 98, MN9-1b 3 Hb(+) neurons n = 16, MN10-1b 2 Hb(+) neurons n = 98, MN10-1b 3 Hb(+) neurons n = 16. (I) Illustration of neuromuscular synapses on dorsal L3 muscles in NB7−1>Hb. Black box marks area in J. A single labeled Hb(+) Eve(+) neuron projects to muscle 9, whereas seven single-labeled Hb(-) Eve(+) neurons project to muscle 10. (J–K) Images of a single-labeled U motor neuron in NB7−1>Hb. Eve(+) Hb(-) U motor neuron (K) projects to muscle 10 (J). Boxes are insets from a different focal plane (K). U motor neurons are circled. Images in (D–F,K) are shown in ventral view, anterior up, and midline to the left. Image in (J) are shown dorsal up anterior to the left. Scale bar represents five microns (D–F, K), and 10 microns for (J). Genotypes: Control is w1118. NB7−1>1X Hb is NB7-1-GAL4/+; UAS-Hb/+. NB7−1>2X Hb is NB7-1-GAL4/UAS-Hb; UAS-Hb/+, and NB7−1>4X Hb is NB7-1-GAL4/UAS-Hb; NB7-1-GAL4/UAS-Hb (for C-H). For I-K NB7−1>Hb is hsFLP; Vglut-lexA/NB7-1-GAL4; lexAop-FRT-stop-FRT-EGFP/UAS-Hb. For quantifications dot is number of 1b branches onto a specified muscle within a bodywall hemisegment. Average and standard deviation are overlaid. ANOVA, corrected for multiple samples. Un-paired t-tests. ‘**’ p<0.05.
-
Figure 8—source data 1
Source Data for Figure 8.
- https://doi.org/10.7554/eLife.46089.016
Figure 9
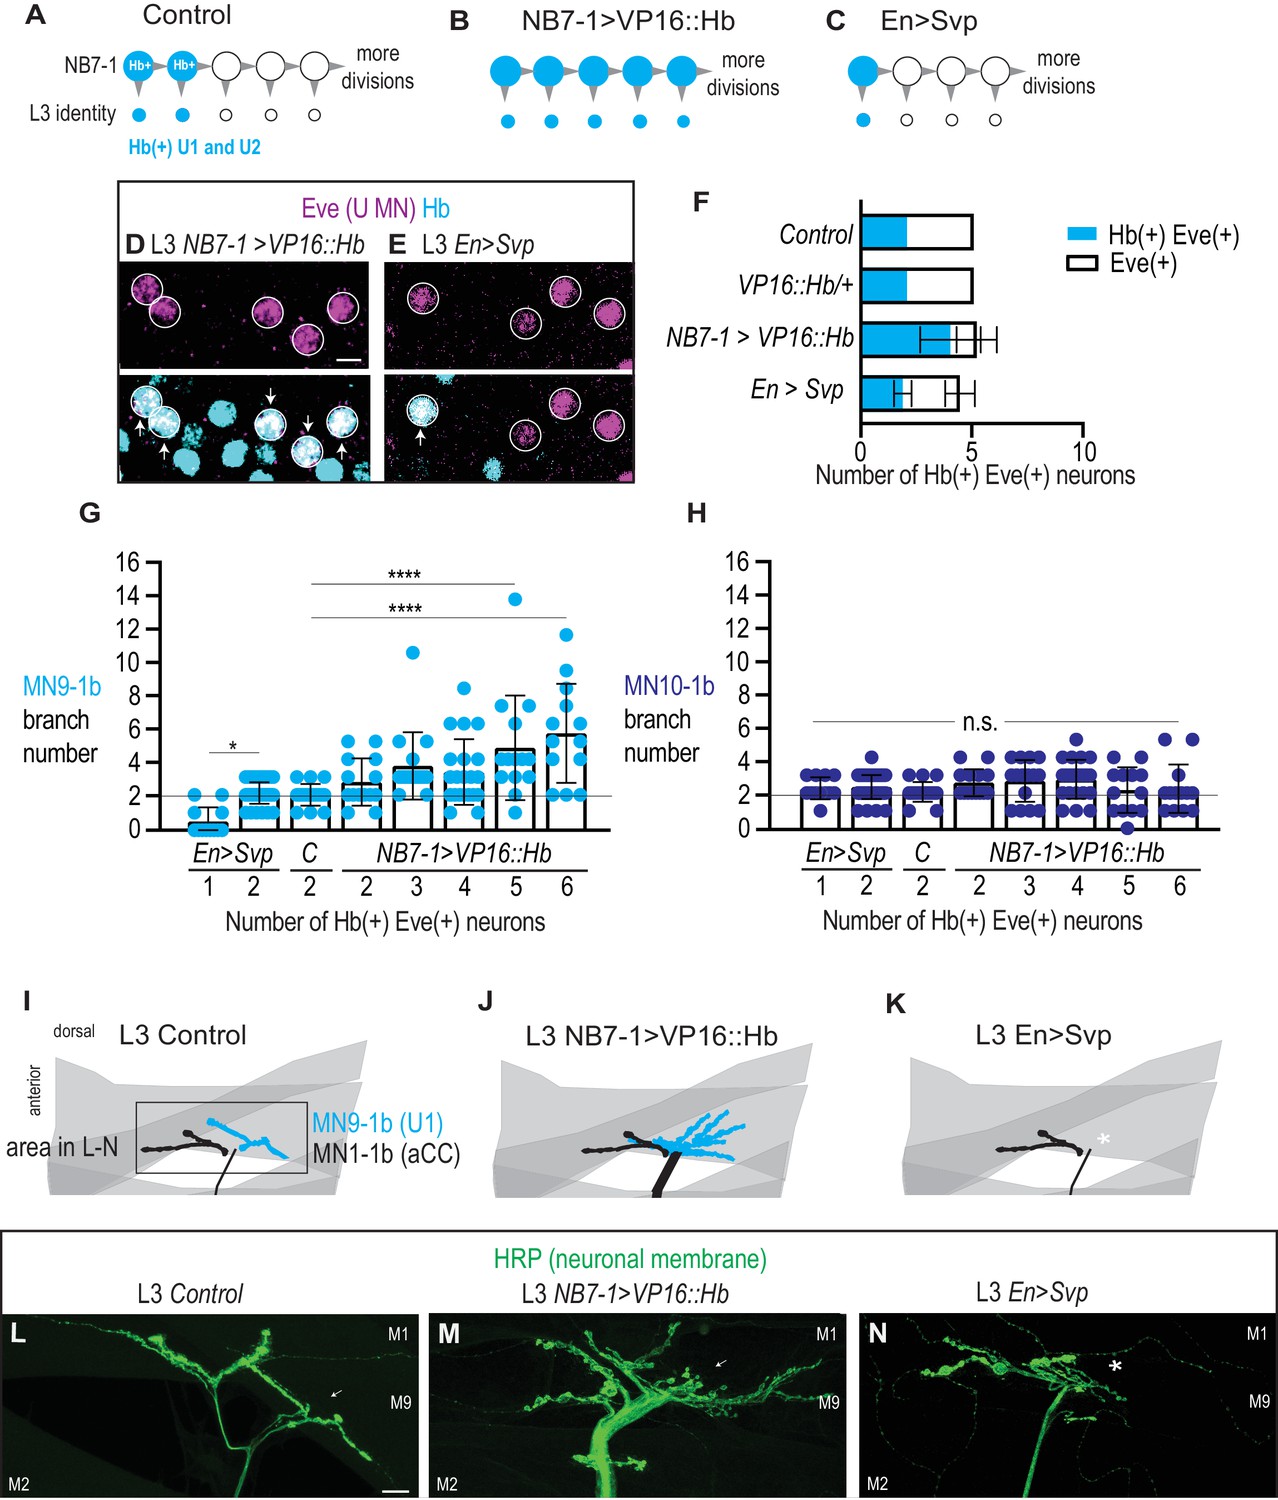
Altering the number of Hb(+) U motor neurons at L3 is correlated with synaptic partnerships.
(A–C) Illustrations of the divisions in NB7-1 in Control, NB7−1>VP16::Hb, and En>Svp. Each gray arrowhead represents cell division, large circles represent NB7-1. Row of small circles represent U motor neuron identity at L3. In Control, two neurons are Hb(+) (blue), in NB7−1>VP16::Hb most neurons are Hb(+), and in En>Svp, only one Hb(+) remains. (D–E) Images of molecular identity, Hb(+), expression in isolated third instar larvae (L3) CNS, shown in ventral view, anterior up, and midline to the left. Eve(+) U motor neurons from NB7-1 are circled in white and co-localization with Hb(+) is shown (arrows). In NB7−1>VP16::Hb there are five Hb(+) Eve(+), whereas in En>Svp there are two (arrows). Data quantified in (F). (F) Quantification of Eve(+) Hb(+) U motor neuron (blue) number and total Eve(+) U motor neurons (white) neuron number at L3. Expressing an activated form of Hb in NB7-1 (NB7−1>VP16::Hb) has little effect on the total number of Eve(+) neurons but increases the number of Hb(+) Eve(+) neurons. Expressing a switching factor, Svp in NB7-1 (En>Svp) can decrease the total number of Eve (+) neurons by one and decrease the total number of Hb(+) Eve(+) neurons by one. For Control n = 28, VP16::Hb n = 29, NB7−1>VP16::Hb n = 65, En>Svp n=70. (G–H) Quantification of the number of 1b branches onto muscle 9 and muscle 10. C. stands for Control. Line intersects the y-axis at two branch number. Number of Eve-expressing neurons are shown below each genotype. For columns left to right n = 12,44,16,14,16,21,14,13, (G) n = 12,43,17,14,15,21,13,13 (H). (I–K) Illustrations of neuromuscular synapses on L3 dorsal muscles 1 and 9. Black box marks area imaged in L-N. MN1-1b (black) comes from a non-U Motor neuron called aCC. (L–N) Images of neuronal membrane—both axons and neuromuscular synapses—on L3 dorsal muscles shown dorsal up, anterior left of Control (W1118) (L), NB7−1>vp16::Hb (NB7-1-GAL4/UAS-vp16::Hb; UAS-vp16::Hb/+) (M), and En>Svp1 (Engrailed-GAL4/UAS-svp1) (N). Arrow indicates branching onto muscle 9 (M9). An asterisk * indicates missing synapse. Scale bar represents five microns for E-F. Scale bar represents 10 microns for L-N. Control (W1118), vp16::Hb (UAS-vp16::Hb/+; UAS-vp16::Hb/+), NB7−1>vp16::Hb (NB7-1-GAL4/UAS-vp16::Hb; UAS-vp16::Hb/+), En>Svp1 (Engrailed-GAL4/UAS-svp1). For quantifications, each dot represents the number of 1b branches onto a specified muscle within a bodywall hemisegment that corresponds to a hemisegment with specified number of Hb(+) neurons. Black bars are averages. Error bars represent standard deviation. ANOVA, corrected for multiple samples. Un-paired t-tests. ‘*’ p=0.02, ‘****’ p<0.0001, n.s. (not significant).
-
Figure 9—source data 1
Source Data for Figure 9.
- https://doi.org/10.7554/eLife.46089.018
Figure 10
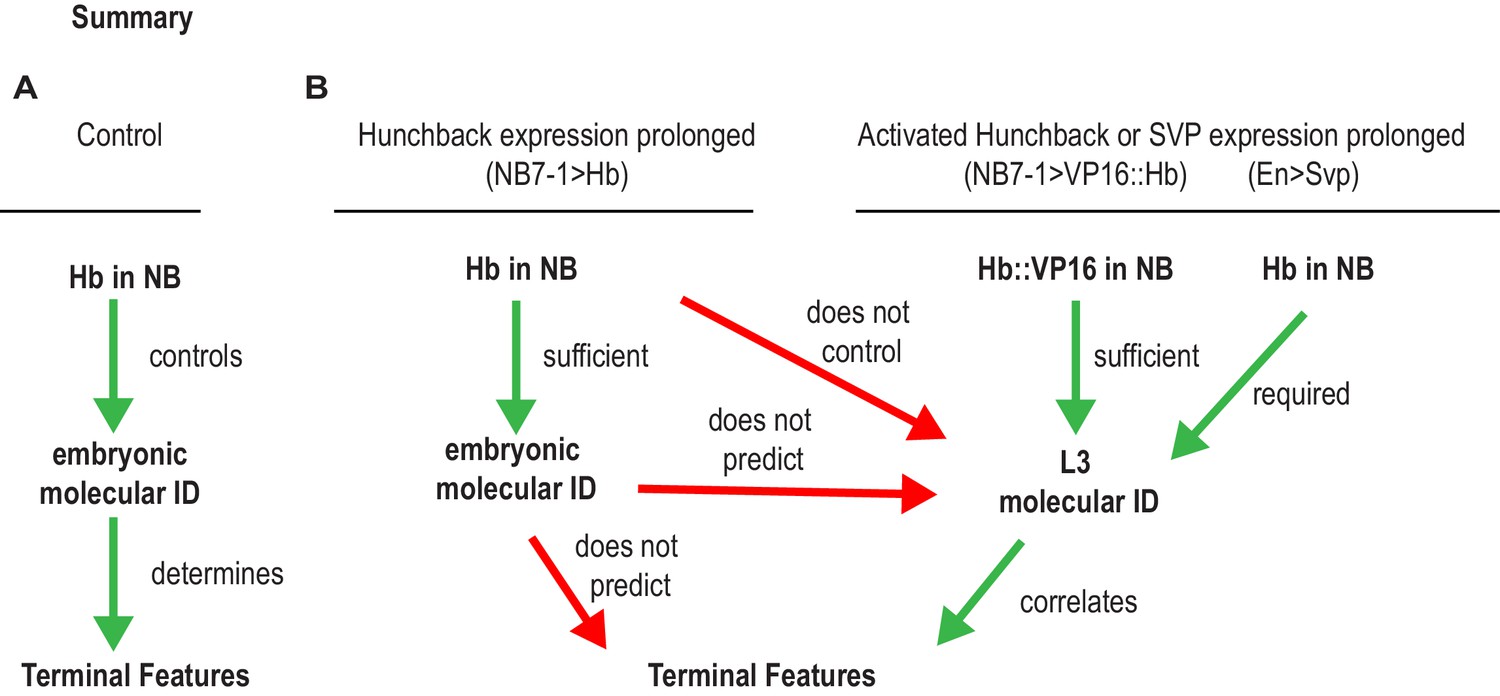
Summary of Hunchback control on circuit wiring.
(A–B) Illustration summary of findings reported in this study. In Wildtype (WT) conditions, NB7-1 expresses Hunchback (Hb), Hb is involved in establishing U1/U2 motor neuron embryonic identities which was proposed to determine terminal features (dendrite morphology, axonal trajectory, and functional synaptic partnerships) (A). When Hb is overexpressed in NB7−1>Hb, Hb expression in NB7-1 is prolonged (Figure 2). The overwhelming majority of embryonic identities seen in motor neurons resemble U1 (Figure 2) however the terminal features do not entirely resemble U1 (Figures 5–7). We find that prolonging Hb expression in NB7-1 produces, in a majority of cases, the same number or, infrequently, one additional neuron possessing molecular identity that resembles U1 at late larval stage (L3), therefore we conclude that prolonging Hb expression in NB7-1 does not control L3 identities (Figure 8). Similarly, in this background, we learn that U1 embryonic identities do not predict U1 L3 identities. We find that if we overexpress an activated form of Hb (VP16::Hb) or the switching factor, Seven-up (Svp1), U1 L3 identities can be controlled. We find that L3 identities in these manipulations are correlated to terminal features of U motor neurons (Figure 9).
Tables
Key resources table
| Reagent type (species) or resource | Designation | Source or reference | Identifiers | Additional information |
|---|---|---|---|---|
| Genetic reagent (D. melanogaster) | CQ2-GAL4 | Bloomington stock center [BL] 7468 | BDSC Cat# 7468, RRID:BDSC_7468 | |
| Genetic reagent (D. melanogaster) | OK6-GAL4 | Bloomington stock center [BL] 64199 | BDSC Cat# 64199, RRID:BDSC_6419 | |
| Genetic reagent (D. melanogaster) | hsFLP; UAS(FRT.stop)myr::smGdP-HA, UAS(FRT.stop)myr::smGdP-V5-THS UAS(FRT.stop)myr::smGdP-FLAG | Bloomington stock center [BL] 64085 | BDSC Cat# 64085, RRID:BDSC_64085 | |
| Genetic reagent (D. melanogaster) | UAS-myr-GFP | Bloomington stock center [BL] 32198 | BDSC Cat# 32198, RRID:BDSC_32198 | |
| Genetic reagent (D. melanogaster) | UAS-nls-GFP | Bloomington stock center [BL] 32198 | BDSC Cat# 6452, RRID:BDSC_6452 | |
| Genetic reagent (D. melanogaster) | UAS-Hb; UAS-HB/TM2 | Bloomington stock center [BL] 8504 | BDSC Cat# 8504, RRID:BDSC_8504 | |
| Genetic reagent (D. melanogaster) | w1118 | Bloomington stock center [BL] 36005 | BDSC Cat# 36005, RRID:BDSC_36005 | |
| Genetic reagent (D. melanogaster) | MHC-CD8-GCaMP6f-Sh | Bloomington stock center [BL] 67739 | BDSC Cat# 67739, RRID:BDSC_67739 | |
| Genetic reagent (D. melanogaster) | ac:VP16, gsb:v8v (aka NB7-1-GAL4) | Minoree Kohwi (Columbia) | ||
| Genetic reagent (D. melanogaster) | VGlut-lexA/cyo | Bloomington stock center [BL] 60314 | BDSC Cat# 60314, RRID:BDSC_60314 | |
| Genetic reagent (D. melanogaster) | lexA(stop.FRT)mCD8.GFP | Bloomington stock center [BL] 57588 | BDSC Cat# 57588, RRID:BDSC_57588 | |
| Genetic reagent (D. melanogaster) | UAS-VP16::Hb/-;UAS-VP16::Hb | Chris Doe (Oregon) | ||
| Genetic reagent (D. melanogaster) | UAS-svp1 1.12 | Minoree Kowhi (Columbia) | DGGR Cat# 116195, RRID:DGGR_116195 | |
| Genetic reagent (D. melanogaster) | Engrailed-GAL4 | Bloomington stock center [BL] 1973 | BDSC Cat# 1973, RRID:BDSC_1973 | |
| Genetic reagent (D. melanogaster) | UAS-hid,rpr | Zhou et al., 1997 | ||
| Antibody | rabbit anti-Eve (polyclonal) | Heckscher Lab | 1:1000 | |
| Antibody | chicken anti-GFP (polyclonal) | Aves #GFP-1020 | Aves Labs Cat# GFP-1020, RRID:AB_10000240 | 1:1000 |
| Antibody | chicken anti-V5 (polyclonal) | Bethyl #A190-118A | Bethyl Cat# A190-118A, RRID:AB_66741 | 1:300 |
| Antibody | mouse anti-HA (monclonal) | BioLegend #901501 | BioLegend Cat# 901501, RRID:AB_2565006 | 1:100 |
| Antibody | rat anti-FLAG (monoclonal) | Novus #NBP1-06712 | Novus Cat# NBP1-06712, RRID:AB_1625981 | 1:300 |
| Antibody | rat anti-Worniu (monoclonal) | Abcam #ab196362 | 1:250 | |
| Antibody | goat anti-HRP-Cy3 (polyclonal) | Jackson ImmunoResearch 123-165-021 | Jackson ImmunoResearch Labs Cat# 123-165-021, RRID:AB_2338959 | 1:300 |
| Antibody | rat anti-Runt (polyclonal) | John Rientz (UChicago) | 1:300 | |
| Antibody | guinea pig anti-Hb (polyclonal) | John Rientz (UChicago) | 1:1000 | |
| Antibody | guinea pig anti-Kruppel (polyclonal) | John Rientz (UChicago) | 1:1000 | |
| Antibody | rat anti-Zfh2 (polyclonal) | Chris Doe (Oregon) | 1:800 | |
| Antibody | rabbit anti-Castor (polyclonal) | Chris Doe (Oregon) | 1:1000 | |
| Antibody | guinea pig anti-Dbx (polyclonal) | Heather Broiher (Case Western | 1:500 | |
| Antibody | guinea pig anti-HB9 (polyclonal) | Heather Broiher (Case Western) | 1:1000 | |
| Antibody | rabbit anti-Smad3 (pMad) (polyclonal) | Abcam #52903 | Abcam Cat# ab52903, RRID:AB_882596 | 1:300 |
| Antibody | mouse anti-myosin (monoclonal) | 3E8-3D3 | DSHB Cat# 3E8-3D3, RRID:AB_2721944 | 1:100 |
| Antibody | mouse anti-Futsch (monoclonal) | 22C10 | DSHB Cat# 22c10, RRID:AB_528403 | 1:50 |
| Antibody | mouse anti-Brp (monoclonal) | NC82 | Creative Diagnostics Cat# DMAB9116MD, RRID:AB_2392664 | 1:50 |
| Antibody | mouse anti-DLG (monoclonal) | 4F3 | DSHB Cat# 4F3 anti-discs large, RRID:AB_528203 | 1:500 |
| Antibody | mouse anti-GluRIIA (monoclonal) | 8B4D2 | DSHB Cat# 8B4D2 (MH2B), RRID:AB_52826 | 1:25 |
| Antibody | mouse anti-En (monoclonal) | 4D9 | DSHB Cat# 4D9 anti-engrailed/invected, RRID:AB_528224 | 1:5 |
| Antibody | Cy3-HRP (polyclonal) | Jackson ImmunoResearch 123-025-021 | Jackson ImmunoResearch Labs Cat# 123-025-021, RRID:AB_2338954 | 1:400 |
| Antibody | 647-Phalliodin | Thermofisher A22287 | Thermo Fisher Scientific Cat# A22287, RRID:AB_2620155 | 1:600 |
Additional files
-
Transparent reporting form
- https://doi.org/10.7554/eLife.46089.020
Download links
A two-part list of links to download the article, or parts of the article, in various formats.
Downloads (link to download the article as PDF)
Open citations (links to open the citations from this article in various online reference manager services)
Cite this article (links to download the citations from this article in formats compatible with various reference manager tools)
How prolonged expression of Hunchback, a temporal transcription factor, re-wires locomotor circuits
eLife 8:e46089.
https://doi.org/10.7554/eLife.46089


