Expansion microscopy of C. elegans
- Department of Biological Engineering, Massachusetts Institute of Technology, United States
- Media Lab, Massachusetts Institute of Technology, United States
- McGovern Institute, Massachusetts Institute of Technology, United States
- Division of Health Sciences and Technology, Massachusetts Institute of Technology, United States
- Department of Biological Sciences, Howard Hughes Medical Institute, Columbia University, United States
- Broad Institute of MIT and Harvard, United States
- Department of Molecular and Cellular Physiology, Stanford University, United States
- Federated Department of Biological Sciences, New Jersey Institute of Technology and Rutgers University-Newark, United States
- The Brain Research Institute, New Jersey Institute of Technology, United States
- Koch Institute, Massachusetts Institute of Technology, United States
- Department of Brain and Cognitive Sciences, Massachusetts Institute of Technology, United States
Figures
Figure 1
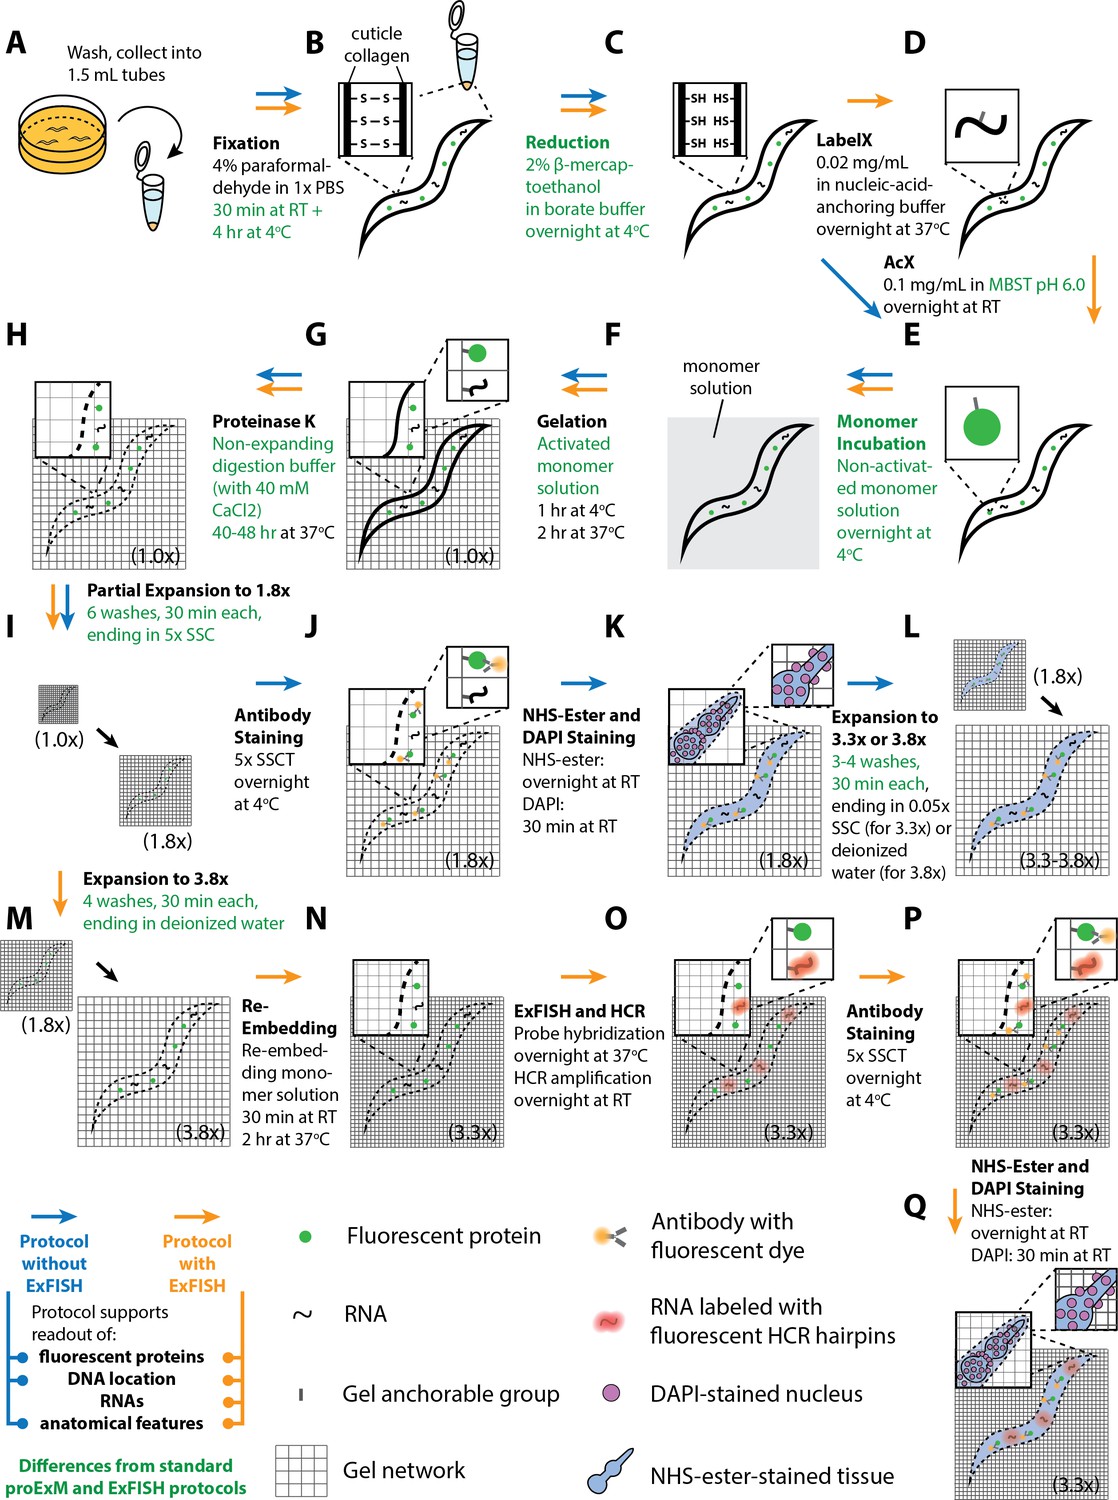
Workflow for expansion of C. elegans (ExCel) sample processing.
A method for expanding cuticle-enclosed intact C. elegans, extending published proExM and ExFISH protocols with specific modifications (shown in green text; full key in lower left). Depending on whether the user intends to visualize RNAs or not, the protocol branches into two forms. The protocol without ExFISH, which supports the readout of fluorescent proteins, DNA location (in the form of DAPI staining), and anatomical features, is indicated with blue arrows, ending in Panel L. The protocol with ExFISH, which additionally supports readout of RNAs, is indicated with orange arrows, ending in panel Q. For all steps after hydrogel formation (Panels G-Q), the linear expansion factor of the hydrogel-specimen composite is shown in parentheses. (A–Q) Steps of the protocol, with the bold text indicating the title of the step; see text for details of each step.
Figure 2
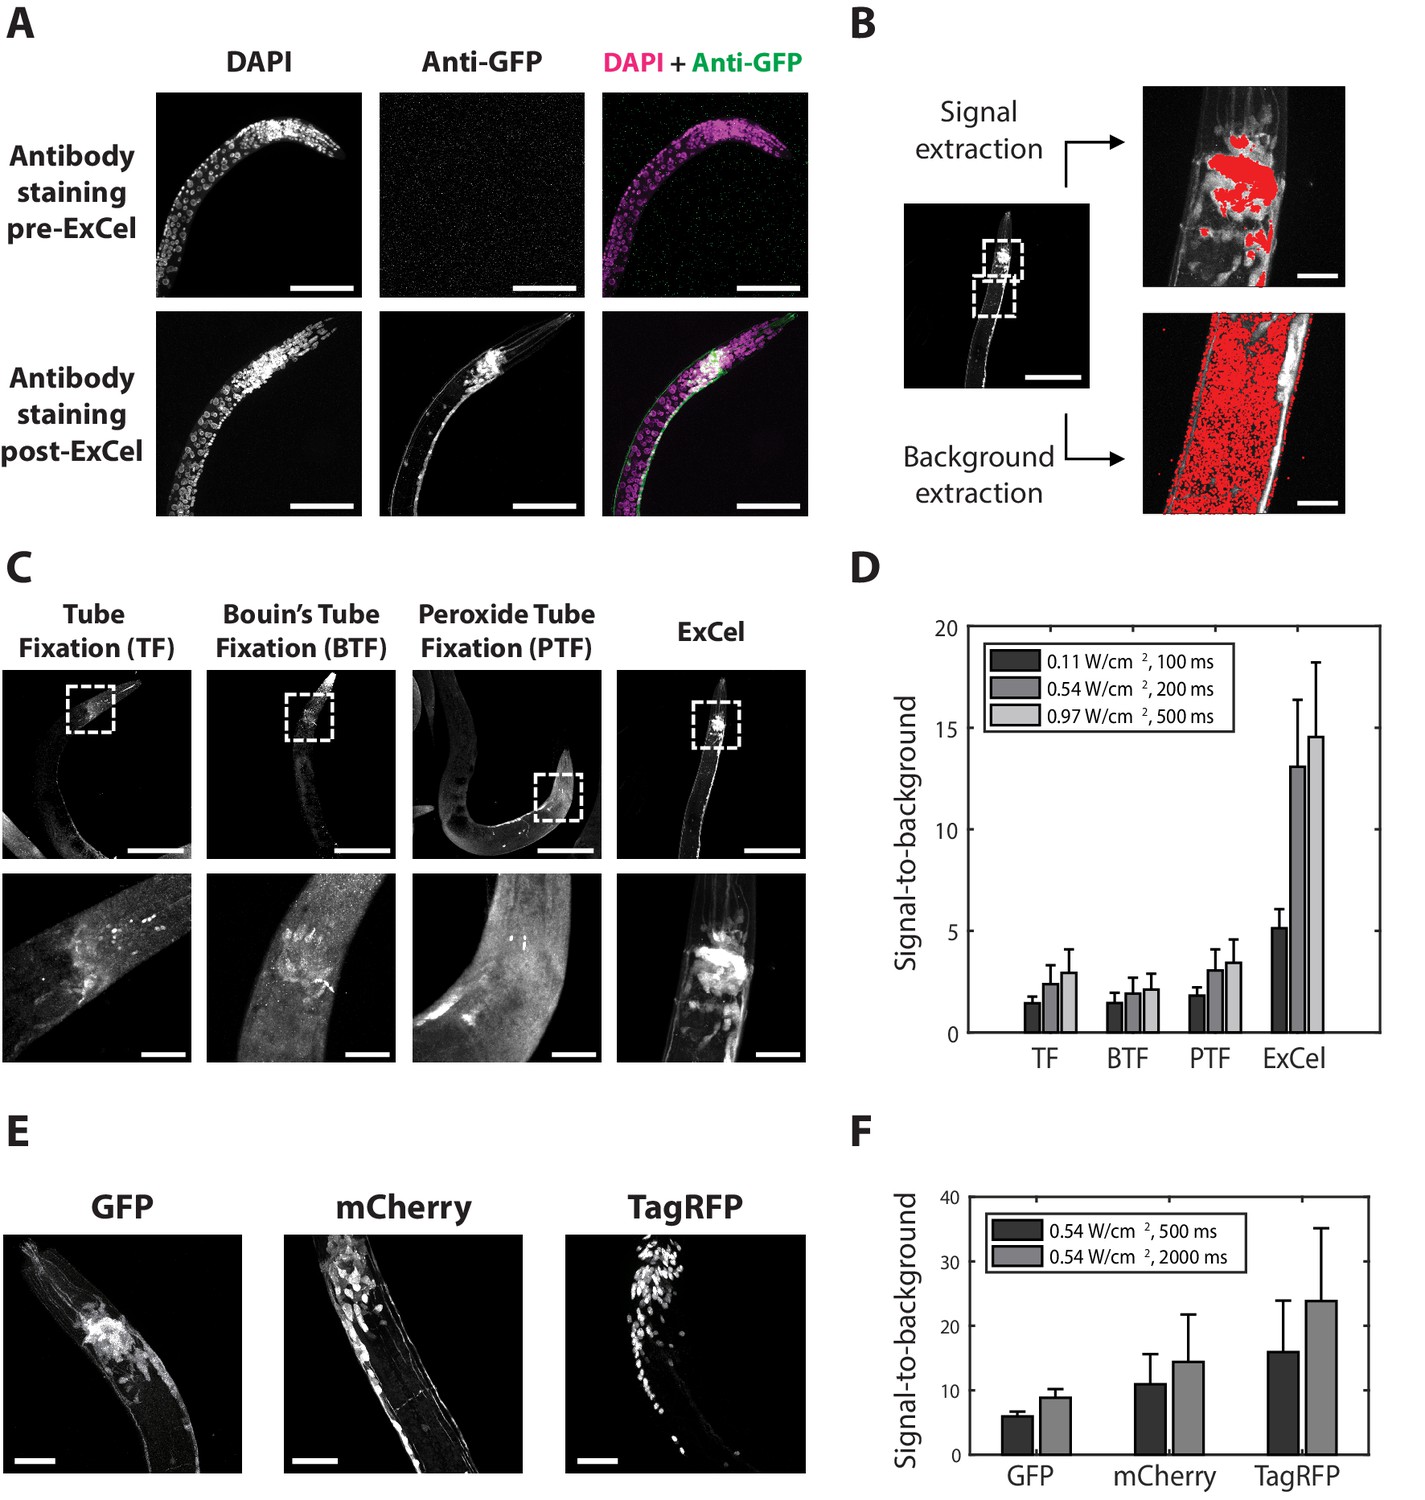
ExCel enables antibody-mediated visualization of fluorescent proteins.
(A) Representative images of immunohistochemistry against GFP in paraformaldehyde-fixed, β-mercaptoethanol-reduced (as in Figure 1A–C) hermaphrodite animals, on which the antibody staining was performed without AcX treatment, hydrogel-embedding, Proteinase K digestion and partial expansion (‘pre-ExCel’) or with such treatments (‘post-ExCel’). The strain used had pan-neuronal cytosolic expression of GFP (tag-168p::GFP). Images throughout this figure are max-intensity projections of confocal stacks acquired through the entire animal. Brightness and contrast settings: DAPI (left) and the post-ExCel anti-GFP (lower center) images, individually set by the automatic adjustment function in Fiji; the pre-ExCel anti-GFP image (upper center), has the same settings as the post-ExCel anti-GFP image, to facilitate direct comparison. Linear expansion factor: lower images, 3.1x. Scale bars: 50 μm (in biological units, e.g. post-expansion lengths are divided by the expansion factor, used throughout this study unless otherwise noted). (B) Quantification of signal-to-background ratio for immunohistochemistry. Image shows a representative transgenic hermaphrodite animal (tag-168p::GFP), immunostained with anti-GFP post-ExCel, as in lower images of A. For quantitation, specimens were shrunk back to original size after antibody staining. Images at right are magnified views of the boxed regions at left (centered on the nerve ring and the upper body). Area masks (red) were generated to capture areas corresponding to neurons in the nerve ring region (representing the signal) and non-neuronal tissue (representing the background), using a semi-automated algorithm (see Methods for details). Scale bars: left image, 50 μm; right images, 10 μm. (C) Representative images of transgenic hermaphrodite C. elegans (tag-168p::GFP), immunostained with anti-GFP after various immunohistochemistry protocols (n = 11–17 animals from 3 separately fixed-and-stained populations for each protocol). For purposes of quantitation, the ExCel-processed sample was shrunk back to its original size after antibody staining. Lower panels are magnified views of the boxed regions (centered on the nerve ring) in upper panels. Brightness and contrast settings: each panel is individually set by the automatic adjustment function in Fiji. Scale bars: upper images, 100 μm; lower images, 20 μm. (D) Signal-to-background ratio of anti-GFP, computed as in B, for the immunohistochemistry methods performed on worms as in C, for various laser intensities (561 nm, since Alexa Fluor 546 was being imaged) and camera exposure times. Bars indicate mean + / - standard deviation. n = 15, 17, 15, 11 animals, from 3 separately fixed-and-stained populations for each protocol. Source data of the intensity measurements (signal and background), whose population statistics are summarized with the bar graph, are available in Figure 2—source data 1. (E) Representative images for post-ExCel immunohistochemistry against different fluorescent proteins (n = 7 animals from 2 separately processed sets of animals for each strain) in hermaphrodite animals. The strains expressed one of the following gene constructs: tag-168p::GFP, rab-3p::mCherry, or rab-3p::NLS::TagRFP (NLS, nuclear localization sequence). Signals were from antibody staining (Alexa Fluor 546 for anti-GFP; Alexa Fluor 647 for anti-mCherry and anti-TagRFP). Brightness and contrast settings: individually set by the automatic adjustment function in Fiji. Linear expansion factors: 3.0–3.2x. Scale bars: 20 μm. (F) Signal-to-background ratio, plotted as in D (except with 561 and 647 nm lasers as appropriate, and using post-expansion images), of post-ExCel immunohistochemistry against fluorescent proteins from worms stained as in E. Linear expansion factors, 3.0–3.2x. n = 7 animals from 2 separately stained groups of animals for each strain. Source data of the intensity measurements (signal and background), whose population statistics are summarized with the bar graph, are available in Figure 2—source data 2.
-
Figure 2—source data 1
Intensity measurements for the signal-to-background ratios shown in Figure 2D.
- https://cdn.elifesciences.org/articles/46249/elife-46249-fig2-data1-v1.mat
-
Figure 2—source data 2
Intensity measurements for the signal-to-background ratios shown in Figure 2F.
- https://cdn.elifesciences.org/articles/46249/elife-46249-fig2-data2-v1.mat
Figure 3 with 2 supplements
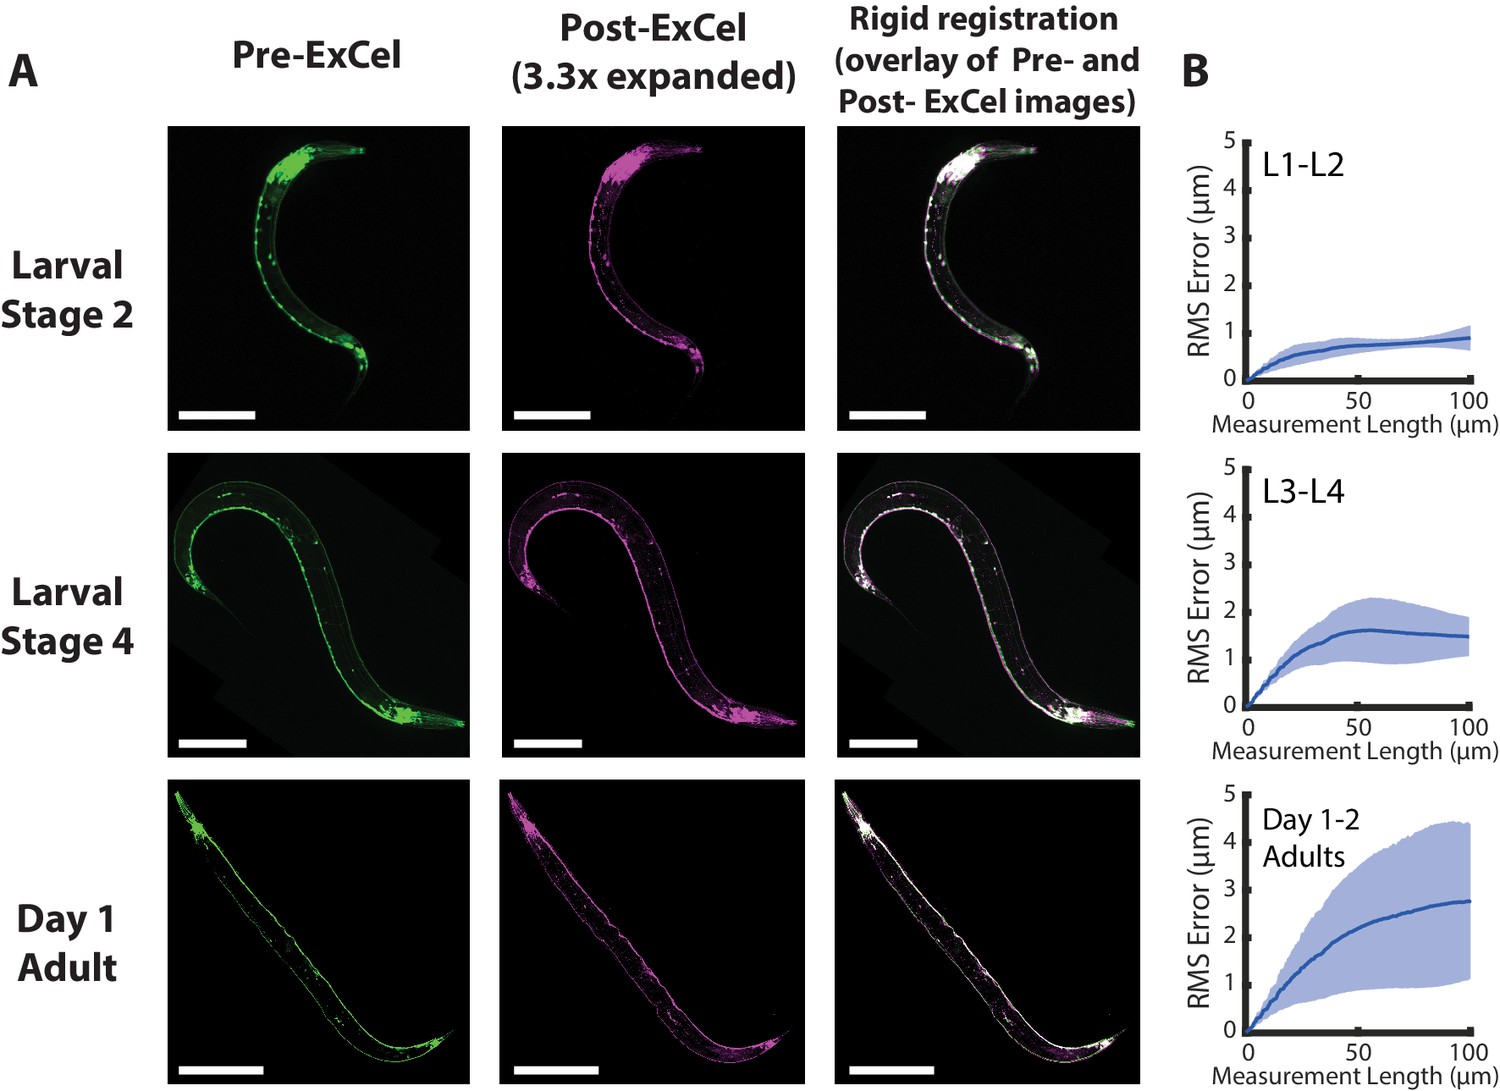
Isotropy of ExCel.
(A) Representative images of paraformaldehyde-fixed, β-mercaptoethanol-reduced, AcX-treated, and hydrogel-embedded (as in Figure 1A–C, E–G) hermaphrodite animals in the second larval stage (‘Larval Stage 2’; L2), the fourth larval stage (‘Larval Stage 4’; L4) and day 1 adulthood (‘Day 1 Adult’) before Proteinase K digestion, partial expansion to 1.8x, antibody staining, and expansion to 3.3x (‘pre-ExCel’) or after such treatments (‘post-ExCel’). Pre- and post- ExCel images were rigidly registered with scaled rotation. Strain expressed tag-168p::GFP. Signals in the pre-ExCel images were from native GFP; signals in the post-ExCel images were from antibody staining against GFP. Images are max-intensity projections of confocal stacks acquired through the entire animal. Brightness and contrast settings: pre- and post-ExCel images (left and center), first individually set by the automatic adjustment function in Fiji, and then manually adjusted (raising the minimum-intensity threshold and lowering the maximum-intensity threshold) to improve contrast. Linear expansion factor: post-ExCel images, 3.3x. Scale bars: L2, 50 μm; L4, 100 μm; day 1 adult, 200 μm. (B) Root-mean-square length measurement error (‘RMS Error’) computed from pre- and post- ExCel images, as acquired in A, for L1-L2 larvae (top), L3-L4 larvae (middle), and day 1 – day 2 adults (bottom). Blue line, mean; shaded area, standard deviation. n = 3, 4, 2 animals, from 2 separately processed populations for each age group. Source data of the RMS length measurement errors are available in Figure 3—source data 1.
-
Figure 3—source data 1
Root-mean-square (RMS) length measurement errors plotted in Figure 3B.
- https://cdn.elifesciences.org/articles/46249/elife-46249-fig3-data1-v1.mat
Figure 3—figure supplement 1
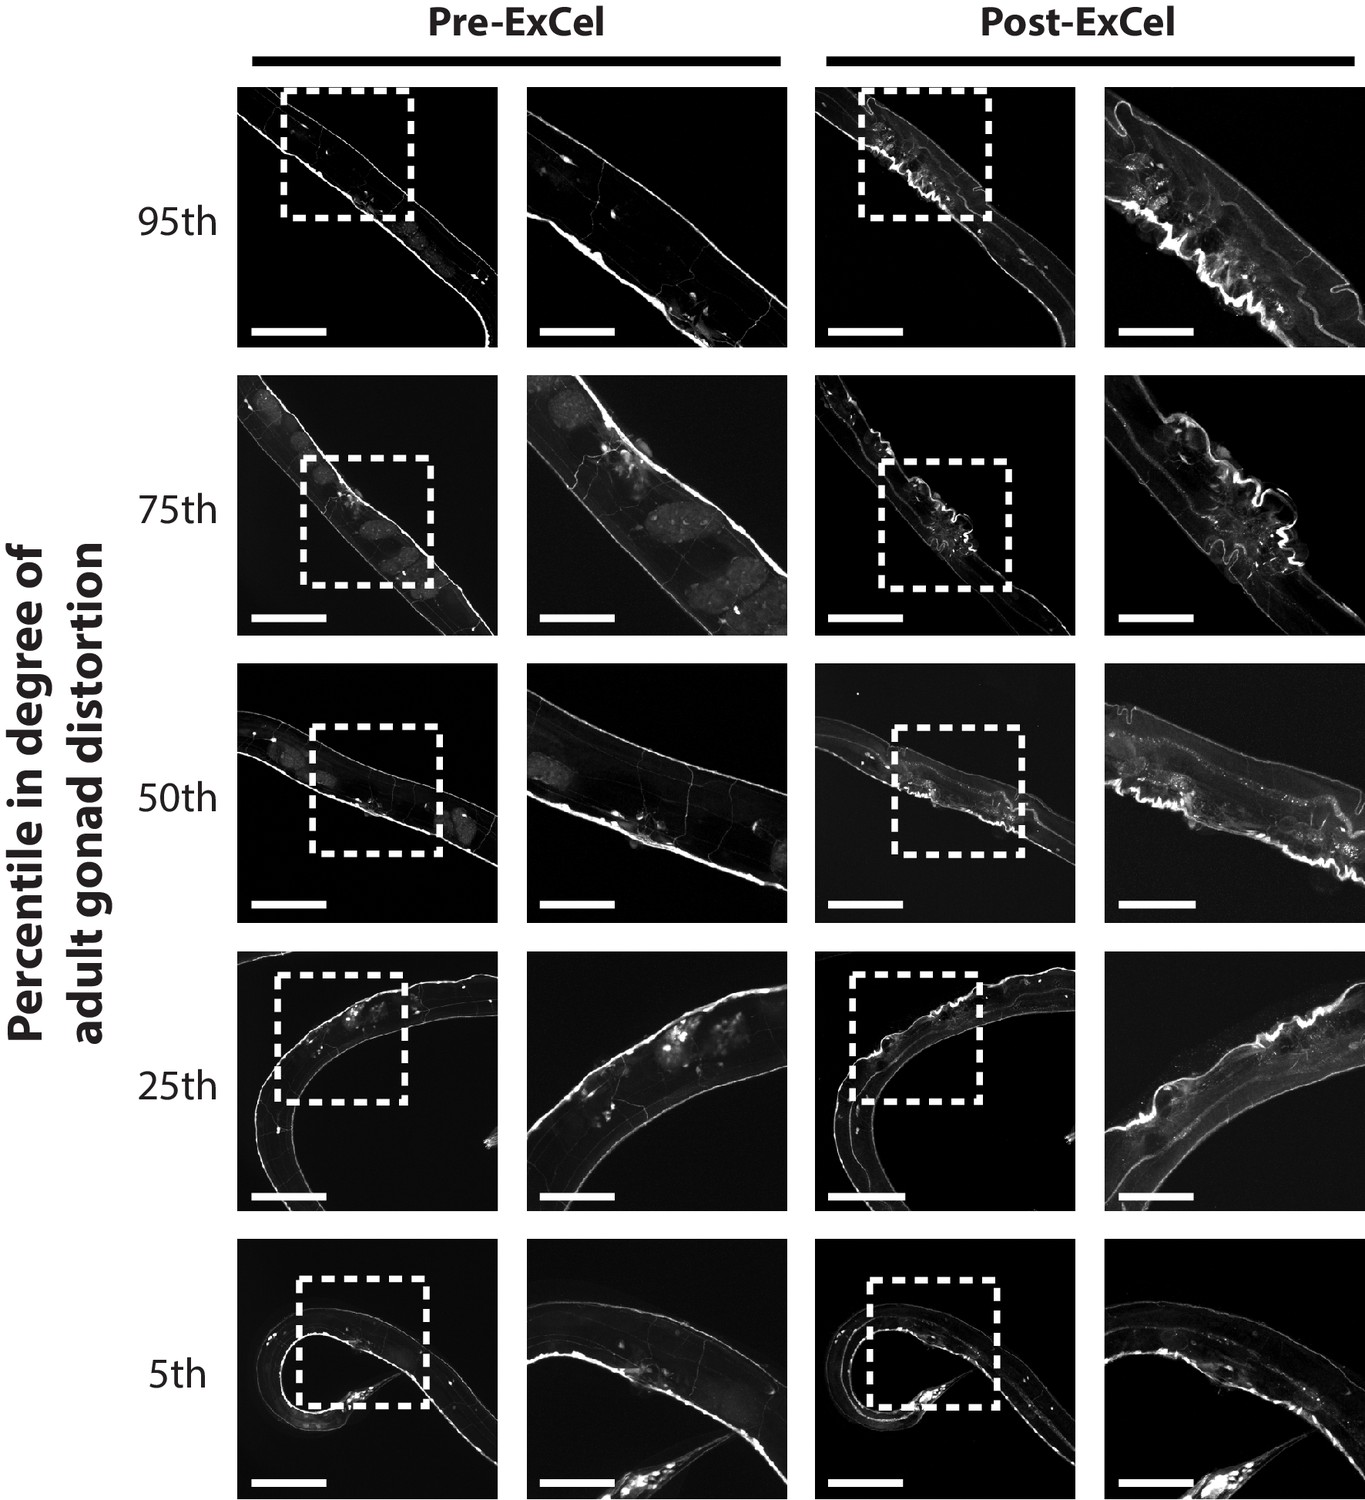
Local distortion at the gonad region of day 1 – day 2 adult hermaphrodites.
Representative images of adult gonad regions of paraformaldehyde-fixed, β-mercaptoethanol-reduced, AcX-treated, and hydrogel-embedded (as in Figure 1A–C, E–G) hermaphrodite animals before Proteinase K digestion, partial expansion to 1.8x, antibody staining, and expansion to 3.3x (‘pre-ExCel’) or after such treatments (‘post-ExCel’). Right images are magnified views of the boxed regions (centered on the vulvae) in the left images. For each adult in this analysis (n = 20 animals from 2 separately processed populations), a score of distortion is manually assigned based on the perceived differences between the pre- and post- ExCel images of the gonad region. Images show adult animals whose distortion scores were ranked at the 5th, 25th, 50th, 75th and 95th percentile, to represent the distribution of the local distortion. The strain used had pan-neuronal cytosolic expression of GFP (tag-168p::GFP). Signals in the pre-ExCel images were from native GFP; signals in the post-ExCel images were from antibody staining against GFP. Images are max-intensity projections of confocal stacks acquired through the entire animal. Brightness and contrast settings: individually set by the automatic adjustment function in Fiji. Linear expansion factors: post-ExCel images, 3.2x. Scale bars: left images (i.e. images with boxed regions), 100 μm; right images (i.e. images without boxed regions), 50 μm.
Figure 3—figure supplement 2
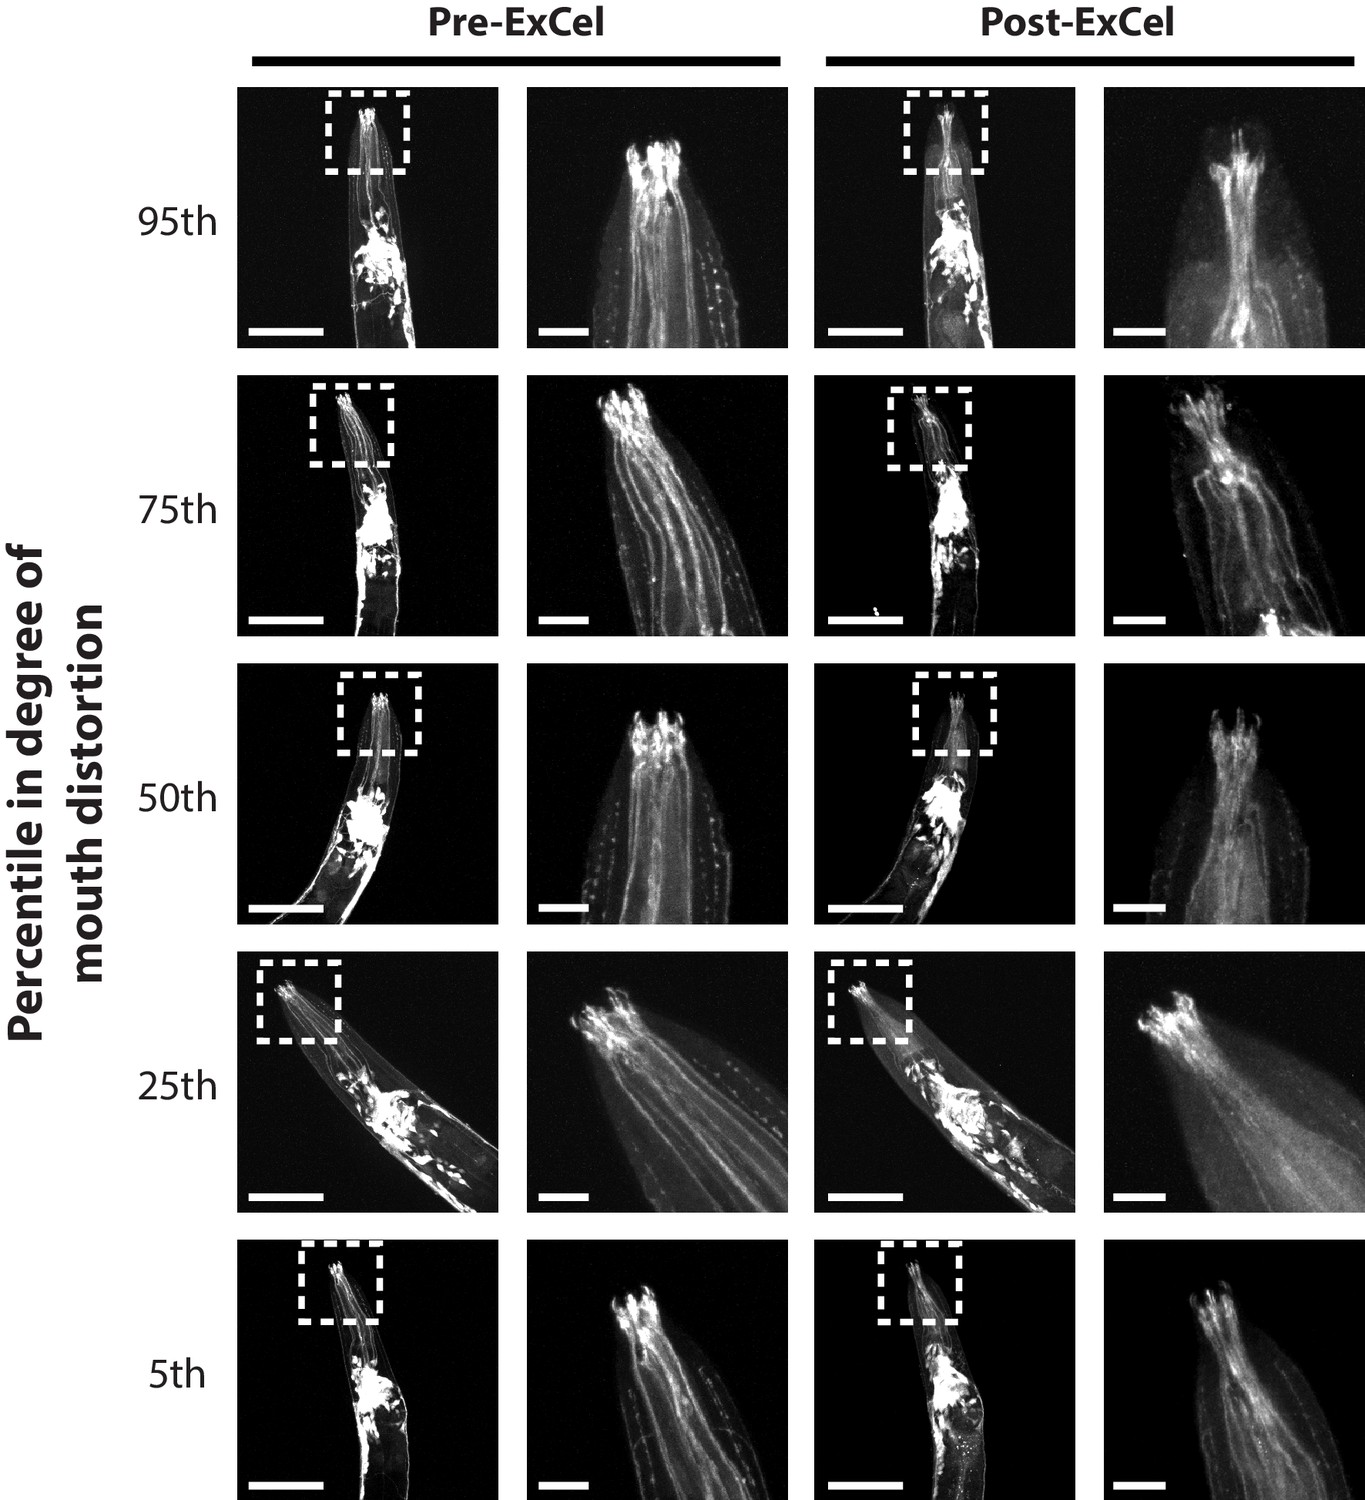
Local distortion at the mouth region.
Representative images of mouth regions of paraformaldehyde-fixed, β-mercaptoethanol-reduced, AcX-treated, and hydrogel-embedded L1 – day 2 adult hermaphrodite C. elegans animals (as in Figure 1A–C, E–G) before Proteinase K digestion, partial expansion to 1.8x, antibody staining, and expansion to 3.3x (‘pre-ExCel’) or after such treatments (‘post-ExCel’). Right images are magnified views of the boxed regions (centered on the mouth) in the left images. For each animal in this analysis (n = 20 animals from 2 separately processed populations), a score of distortion is manually assigned based on the perceived differences between the pre- and post- ExCel images of the mouth region. Images show animals whose distortion scores were ranked at the 5th, 25th, 50th, 75th and 95th percentile, to represent the distribution of the local distortion. The strain used had pan-neuronal cytosolic expression of GFP (tag-168p::GFP). Signals in the pre-ExCel images were from native GFP; signals in the post-ExCel images were from antibody staining against GFP. Images are max-intensity projections of confocal stacks acquired through the entire animal. Brightness and contrast settings: individually set by the automatic adjustment function in Fiji. Linear expansion factors: post-ExCel images, 3.2x. Scale bars: left images (i.e. images with boxed regions), 50 μm; right images (i.e. images without boxed regions), 10 μm.
Figure 4
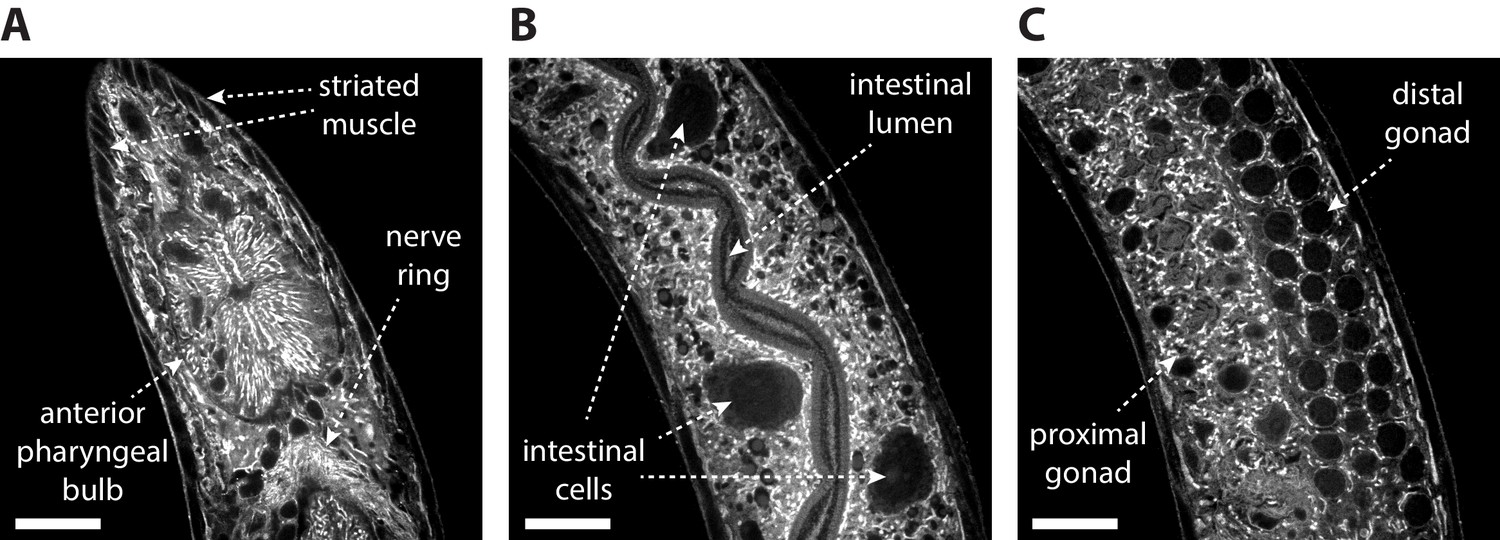
Post-ExCel NHS-ester staining reveals anatomical structures.
Representative images of (A) pharyngeal region, (B) intestinal tissue and (C) gonad tissue of ExCel-processed (formaldehyde-fixed, β-mercaptoethanol-reduced, AcX-treated, hydrogel-embedded, Proteinase-K digested, partially expanded; as in Figure 1A–C, E–G) L3-L4 hermaphrodite animals, stained with Atto 647N NHS ester, which is an NHS ester of a fluorescent dye (as in Figure 1K), and then expanded in deionized water (as in Figure 1L). The strain used had pan-neuronal expression of RAB-3::GFP (rab-3p::GFP::rab-3); not visualized in this specific set of images. Images are confocal micrographs at a single z-plane. Brightness and contrast settings: first set by the automatic adjustment function in Fiji, and then manually adjusted (raising the minimum-intensity threshold and lowering the maximum-intensity threshold) to improve contrast. Linear expansion factor: 4.1–4.2x. Scale bars: 10 μm.
Figure 5
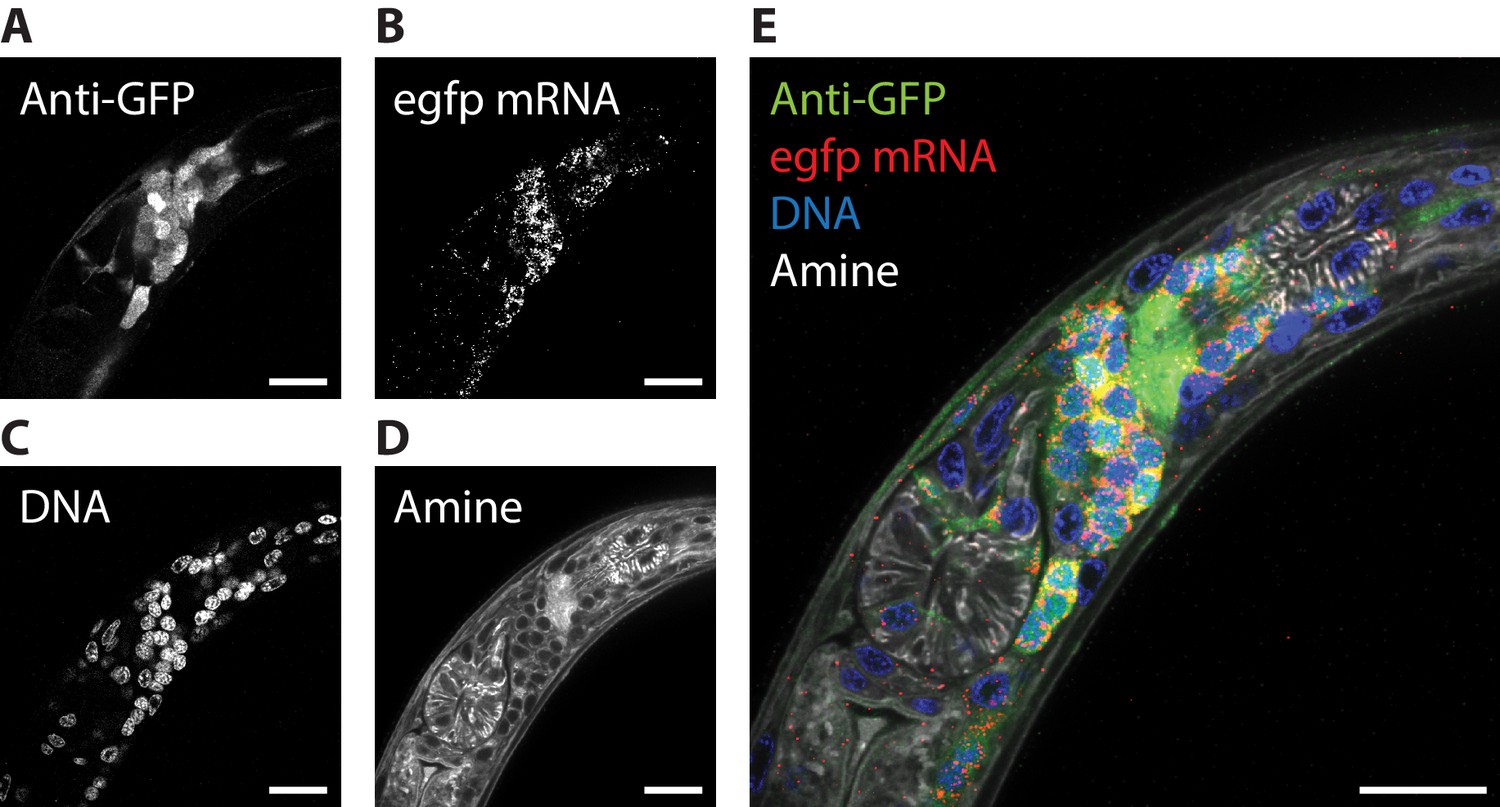
ExCel enables simultaneous readout of fluorescent proteins, RNA, DNA location, and anatomical features.
The pharyngeal region of a representative ExCel-processed (formaldehyde-fixed, β-mercaptoethanol-reduced, LabelX- and AcX-treated, hydrogel-embedded, Proteinase-K digested and re-embedded; as in Figure 1A–I, M, N) L2 hermaphrodite animal, stained sequentially with ExFISH-HCR against the egfp mRNA, antibody against GFP, NHS ester of a fluorescent dye (Atto 647N NHS ester; against amines; for anatomical features) and DAPI (for DNA location), as schematized in Figure 1N–Q. (A–D) Single-channel images of each staining modality. (E) Merged composite image from combining A-D. Strain expressed tag-168p::GFP. Images are single-z-plane confocal micrographs. Brightness and contrast settings: each channel was first set by the automatic adjustment function in Fiji, and then manually adjusted (raising the minimum-intensity threshold and lowering the maximum-intensity threshold) to improve contrast. Linear expansion factor: 3.3x. Scale bars: 10 μm.
Figure 6
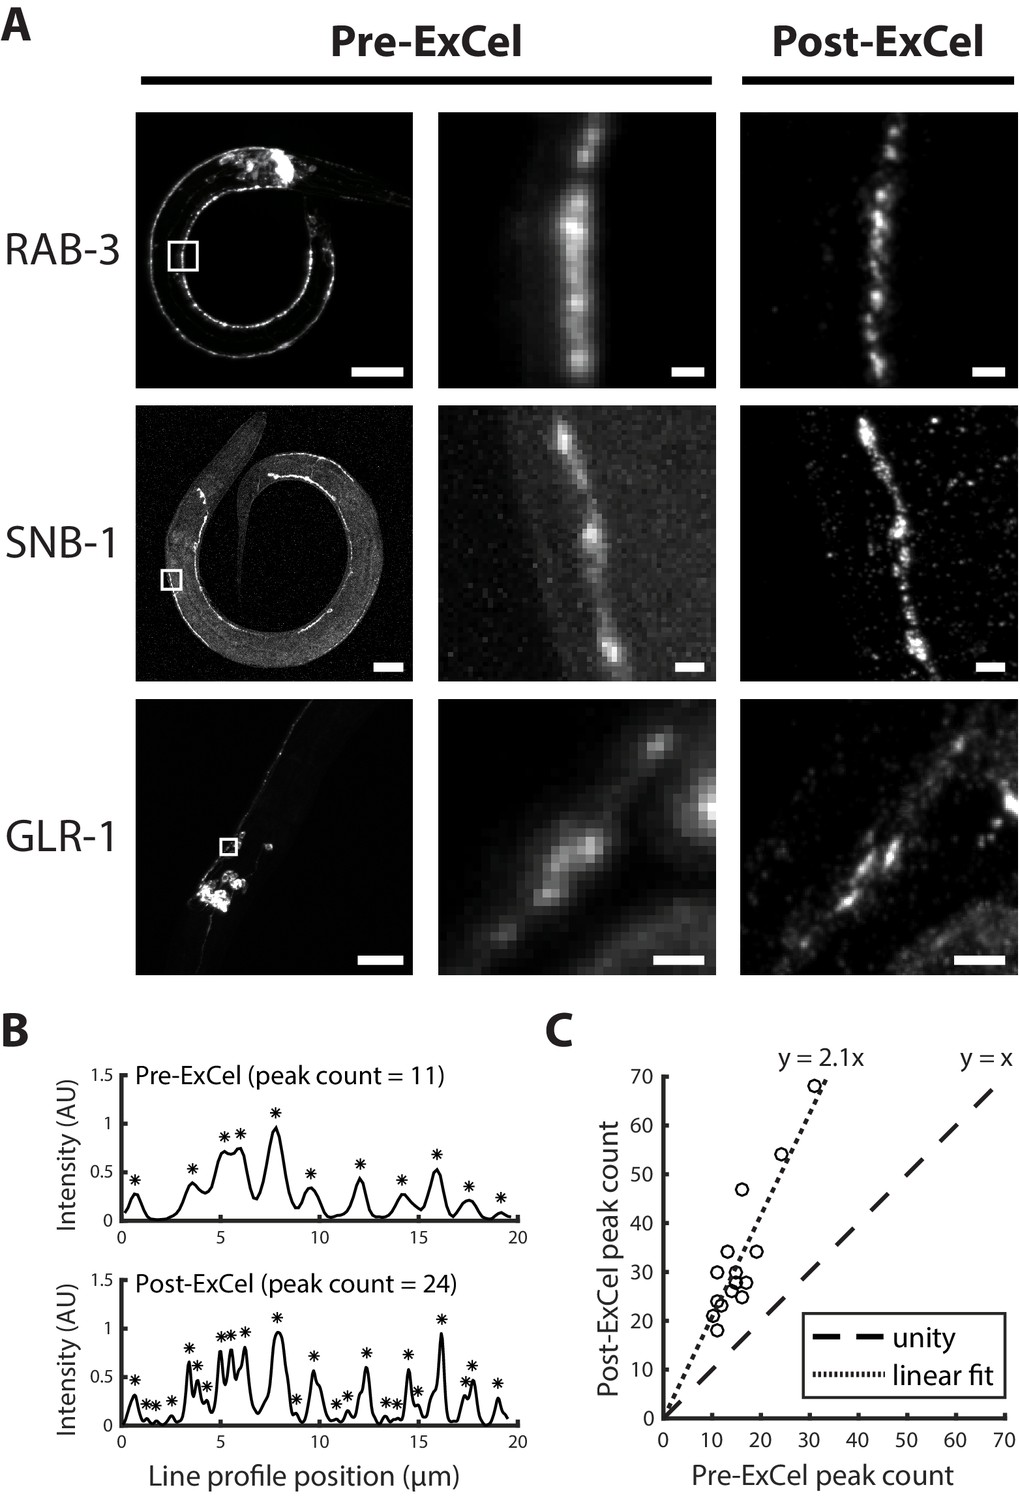
Super-resolution imaging of synaptic proteins with ExCel.
(A) Representative images of GFP-fused synaptic proteins RAB-3, SNB-1 and GLR-1 in paraformaldehyde-fixed, β-mercaptoethanol-reduced, AcX-treated, and hydrogel-embedded (as in Figure 1A–C, E–G) hermaphrodite animals, before Proteinase K digestion, partial expansion to 1.8x, antibody staining, and expansion to 3.8x (‘pre-ExCel’) or after such treatments (‘post-ExCel’). Middle images are magnified views of the boxed regions in the left images. Strains express GFP fusions of pre-synaptic proteins RAB-3 (rab-3p::GFP::rab-3) or SNB-1 (unc-25p::snb-1::GFP), or post-synaptic protein GLR-1 (glr-1p::glr-1::GFP). Signals in the pre-ExCel images were from native GFP; signals in the post-ExCel images were from antibody staining against GFP. Images are max-intensity projections of confocal stacks acquired through the regions of interest. Brightness and contrast settings: left images, individually set by the automatic adjustment function in Fiji; center and right images, first set by the automatic adjustment function in Fiji, and then manually adjusted (raising the minimum-intensity threshold and lowering the maximum-intensity threshold) to improve contrast for the synaptic puncta. Linear expansion factors: post-ExCel images, 3.8x. Scale bars: left images, 20 μm; middle and right images, 1 μm. (B) Representative line intensity profiles of RAB-3::GFP along a section of the ventral nerve cord, from pre- (top) and post- (bottom) ExCel images acquired as in the top row of A (except that the last wash in deionized water is skipped, resulting in improved stability of antibody stained signal and 3.3x linear expansion, as discussed in Main Text). Fluorescent intensity values were linearly normalized to arbitrary units between 0 and 1. Expansion factors of the analyzed post-ExCel image: 3.3x. Asterisks, detected peaks. (C) Peak counts of the line intensity profiles of RAB-3::GFP along sections of ventral nerve cord or SAB axonal processes, pre- and post-ExCel, as plotted in B. Each dot represents a single line profile. Expansion factors of the analyzed post-ExCel images: 3.3x. Dashed line, unity; dotted line, linear fit. n = 16 line profiles from 7 animals in 2 separately processed populations. Source data of the line intensity profiles and their peak counts are available in Figure 6—source datas 1 and 2, respectively.
-
Figure 6—source data 1
Line intensity profiles for all data points plotted in Figure 6C.
- https://cdn.elifesciences.org/articles/46249/elife-46249-fig6-data1-v1.mat
-
Figure 6—source data 2
Peak counts for all data points plotted in Figure 6C.
- https://cdn.elifesciences.org/articles/46249/elife-46249-fig6-data2-v1.xlsx
Figure 7
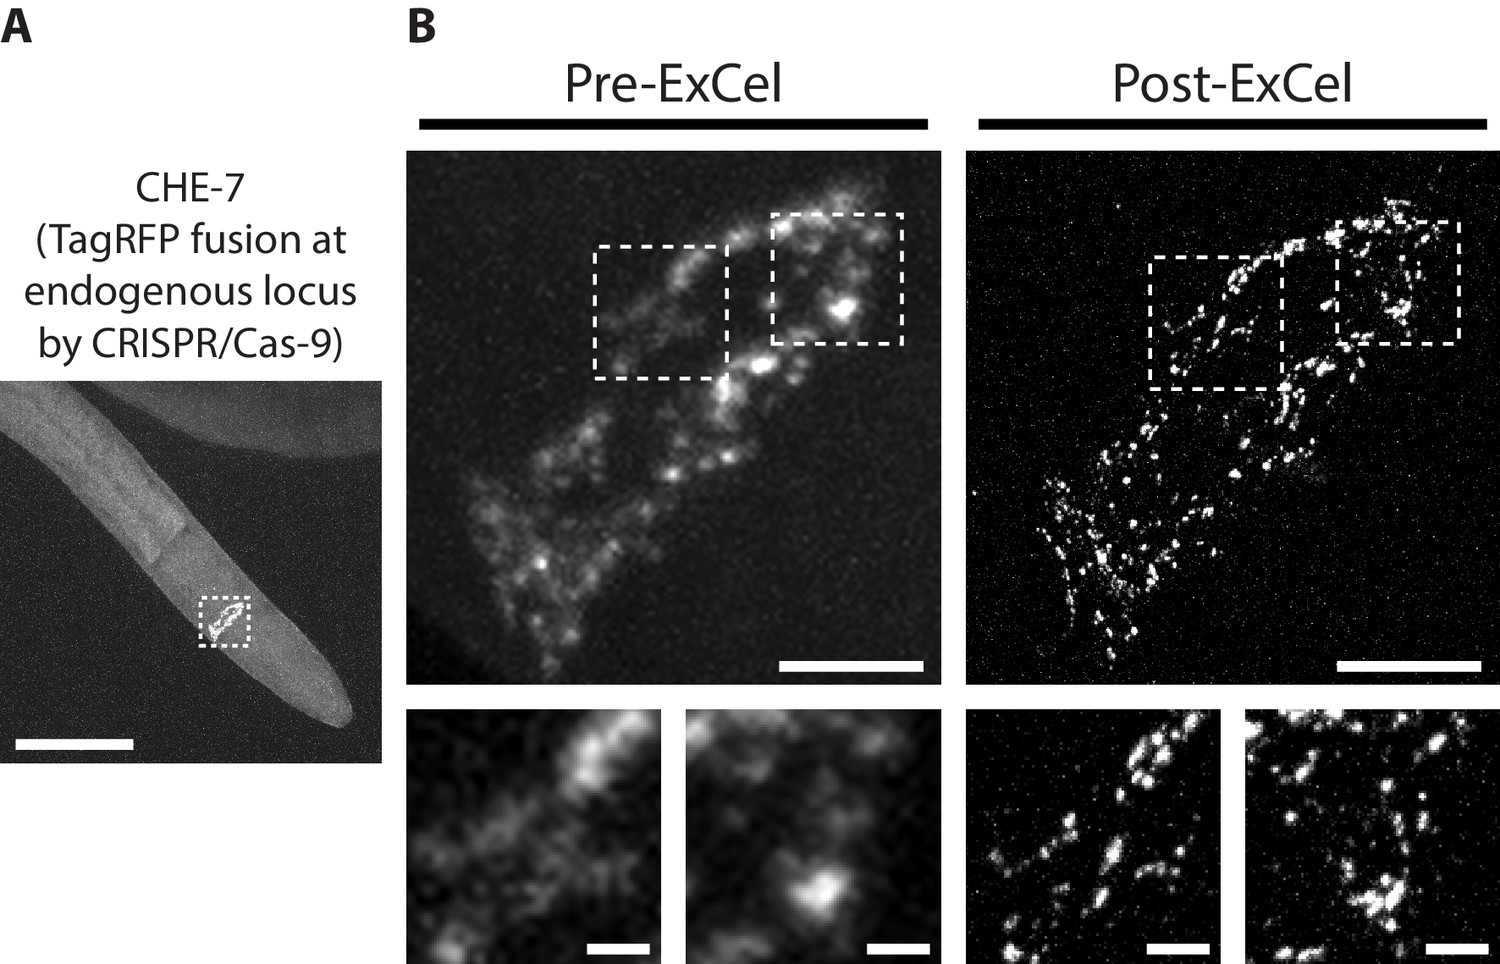
Super-resolution imaging of electrical synapses with ExCel.
Representative images of TagRFP-fused innexin protein CHE-7 in a paraformaldehyde-fixed, β-mercaptoethanol-reduced, AcX-treated, and hydrogel-embedded (as in Figure 1A–C, E–G) L4 hermaphrodite animal, before Proteinase K digestion, partial expansion to 1.8x, antibody staining, and expansion to 3.8x (‘pre-ExCel’) or after such treatments (‘post-ExCel’). Strain expresses innexin protein CHE-7 that is fused to TagRFP at its endogenous locus, via CRISPR-Cas9-mediated homologous recombination. (A) Pharyngeal region of the animal. The nerve ring is marked by the dotted box and shown in magnified views in the top panels of B. (B) Top panels, nerve ring of the animal, as marked in the dotted box in A. Lower panels, magnified views of the dotted regions in the top panels. Signals in the pre-ExCel images were from native TagRFP; signals in the post-ExCel images were from antibody staining against TagRFP. Images are max-intensity projections of confocal stacks acquired through the depth of the entire animal. Brightness and contrast settings: first set by the automatic adjustment function in Fiji, and then manually adjusted (raising the minimum-intensity threshold and lowering the maximum-intensity threshold) to improve contrast for the synaptic puncta. Linear expansion factors: post-ExCel images, 4.0x. Scale bars: (A) 50 μm; (B) top panels, 5 μm; bottom panels, 1 μm.
Figure 8
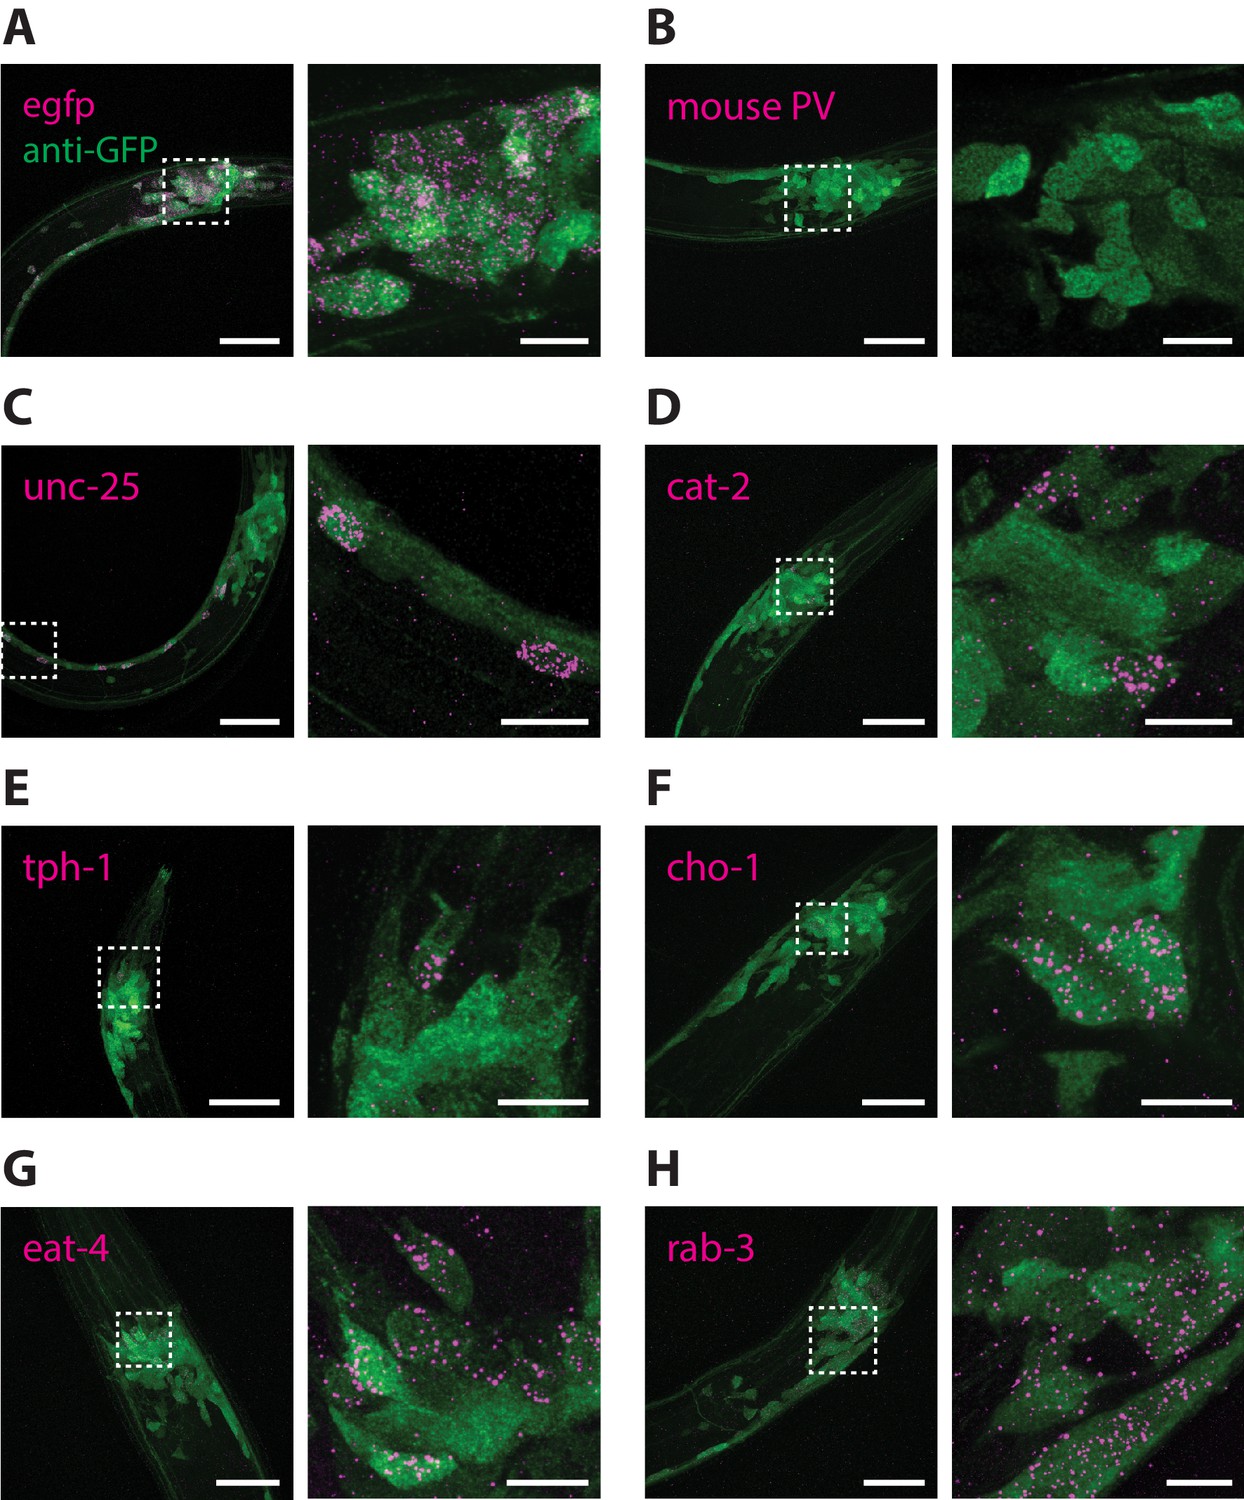
RNA detection in neurons.
ExCel-processed (formaldehyde-fixed, β-mercaptoethanol-reduced, LabelX- and AcX-treated, hydrogel-embedded, Proteinase-K digested and re-embedded; as in Figure 1A–I, M, N) hermaphrodite animals labeled with antibody staining against GFP (green) and ExFISH-HCR (magenta) against the following RNA transcripts: (A) egfp (as a positive control), (B) mouse parvalbumin (no known ortholog in C. elegans; as a negative control), (C) unc-25, a GABAergic neuronal marker, (D) cat-2, a dopaminergic neuronal marker, (E) tph-1, a serotoninergic neuronal marker, (F) cho-1, a cholinergic neuronal marker, (G) eat-4, a glutamatergic neuronal marker, (H) rab-3, a pre-synaptic protein with pan-neuronal expression. Right images are magnified views of the boxed regions in the left images. Strain expressed tag-168p::GFP. Images are max-intensity projections of confocal stacks acquired through the entire animal (left images) or just the expressing cells (right images). Brightness and contrast settings: first set by the automatic adjustment function in Fiji, and then manually adjusted (raising the minimum-intensity threshold and lowering the maximum-intensity threshold) to improve contrast for cellular morphology and ExFISH puncta. Selection of displayed image: (A–B) both localization and density are representative, (C–H) localization is representative; density is close to exemplar, because the authors selected images from animals that have relatively strong expression levels, within the 3–5 animals imaged per transcript target, to facilitate visualization of the expressing cells. Nearly all of the selected images are from L2-L4 stage larvae, which have generally greater expression levels than adults, for the transcript targets that we investigated in these panels. Linear expansion factors: 3.4–3.6x. Scale bars: left images, 20 μm; right images, 5 μm.
Figure 9
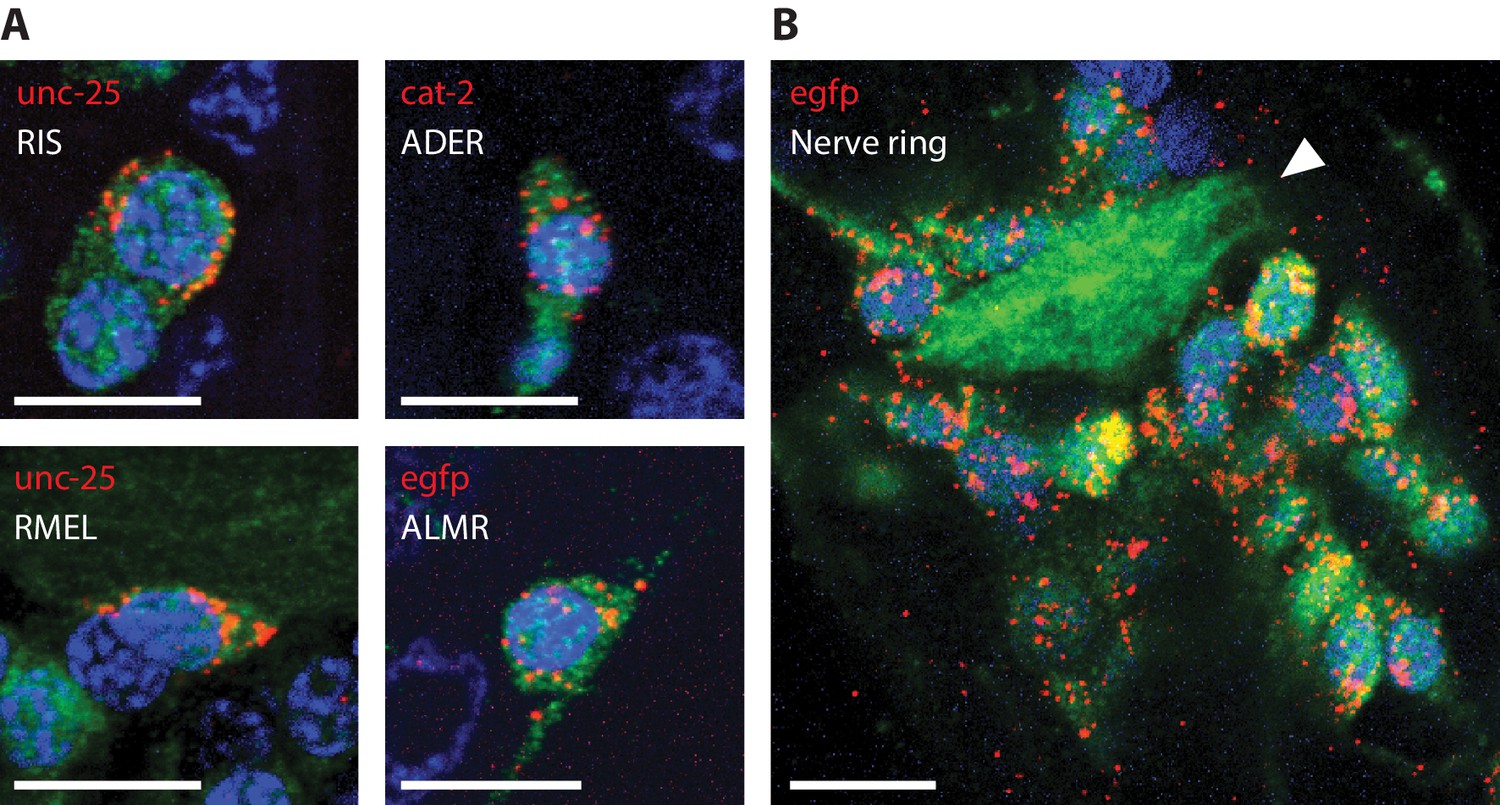
RNA detection in neurons, at sub-cellular resolution.
Representative images of ExCel-processed (formaldehyde-fixed, β-mercaptoethanol-reduced, LabelX- and AcX-treated, hydrogel-embedded, Proteinase-K digested and re-embedded; as in Figure 1A–I, M, N) hermaphrodite animals labeled with anti-GFP (green), DAPI (blue) and ExFISH-HCR (red) against specified mRNA transcripts (red text). Strain expressed tag-168p::GFP. Brightness and contrast settings: first set by the automatic adjustment function in Fiji, and then manually adjusted (raising the minimum-intensity threshold and lowering the maximum-intensity threshold) to improve contrast for cellular morphology and ExFISH puncta. Linear expansion factors: 3.1–3.3x. Scale bars: 5 μm. (A) Sub-cellular localization of mRNA transcripts in identified single neurons. White text indicates the identity of the displayed neuron, which was determined based on stereotypical somatic location (via GFP signal) and prior knowledge of the expression patterns (via ExFISH signal). Images are max-intensity projections over 5 z-planes (with step size of 0.4 μm, in absolute distance, i.e. post-expansion distance) centered (in z-dimension) at the centerline of the imaged cell. (B) Localization of egfp mRNA transcript in the head region of an L2 larval animal. White arrowhead, nerve ring.
Figure 10
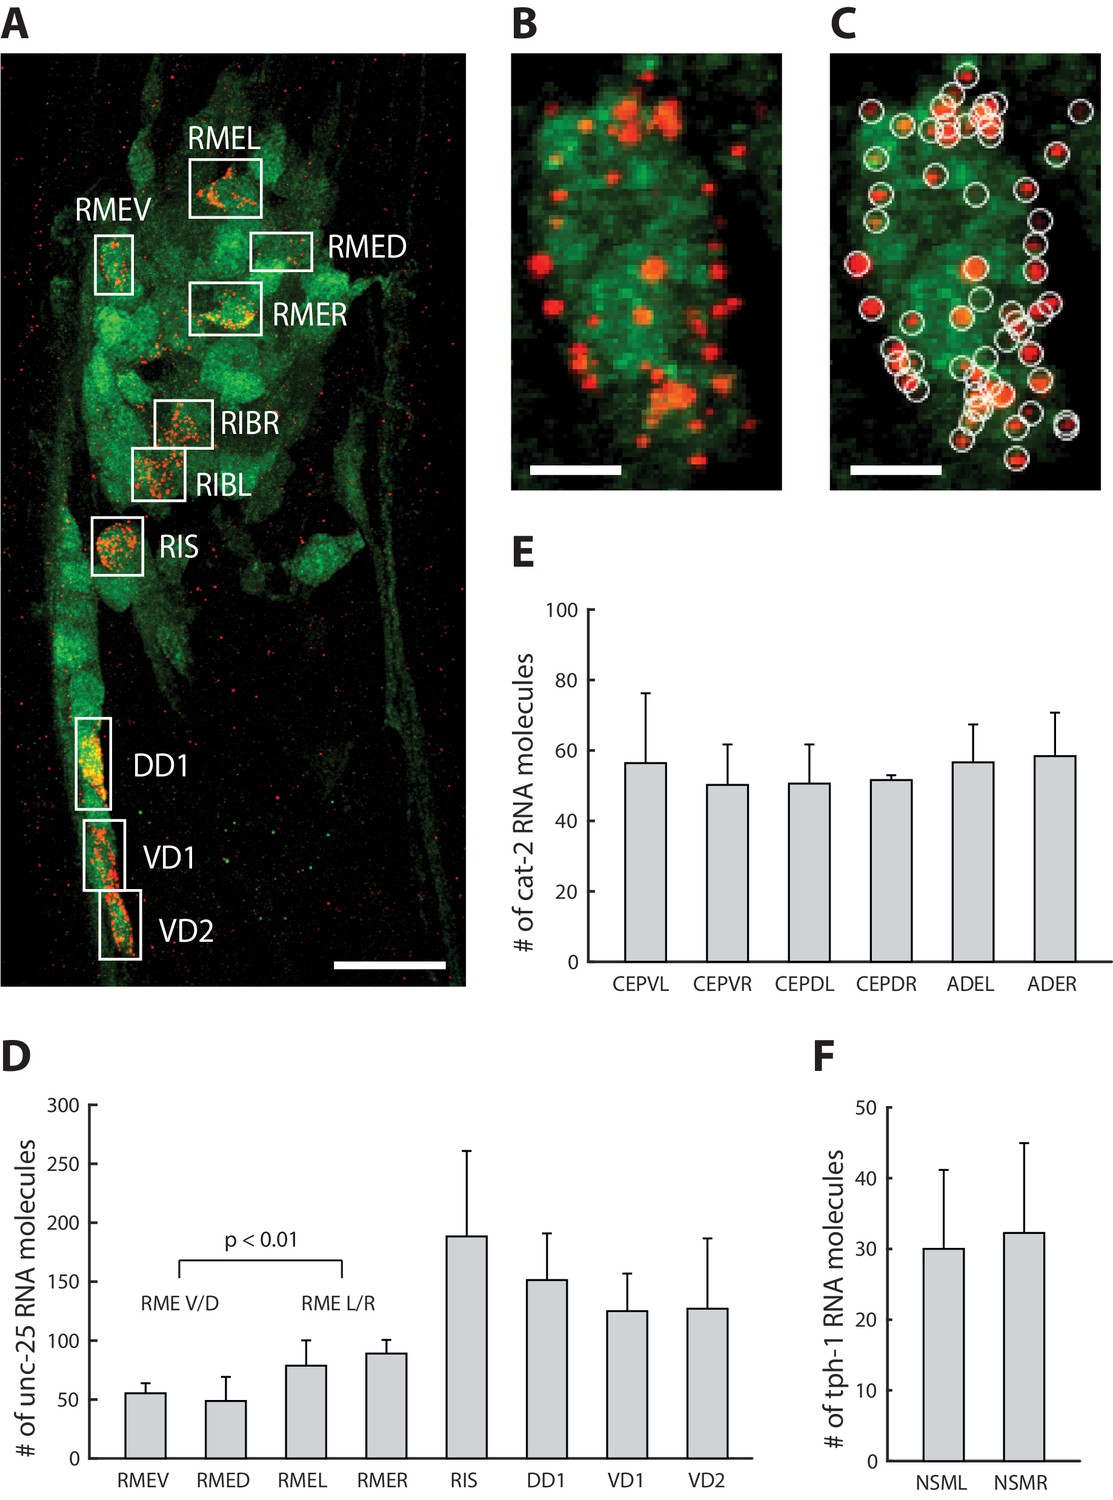
Single-neuron resolution RNA quantification.
(A) A representative ExCel-processed (formaldehyde-fixed, β-mercaptoethanol-reduced, LabelX- and AcX-treated, hydrogel-embedded, Proteinase-K digested and re-embedded; as in Figure 1A–I, M, N) L4 hermaphrodite animal labeled with anti-GFP (green), ExFISH-HCR against unc-25 mRNA transcript (red) and DAPI (not shown for image clarity). Boxes are manually selected ROIs enclosing single neurons that were identified based on stereotypical somatic location (via GFP and DAPI signal) and prior knowledge of unc-25 expression pattern (via ExFISH signal). Strain expressed tag-168p::GFP. Image is a max-intensity projection of a confocal stack acquired through the entire animal. Brightness and contrast settings: first set by the automatic adjustment function in Fiji, and then manually adjusted (raising the minimum-intensity threshold and lowering the maximum-intensity threshold) to improve contrast for cellular morphology and ExFISH puncta. Linear expansion factor: 3.2x. Scale bar: 10 μm. (B) Magnified view of the region of interest enclosing RMEV from A. Scale bar: 1 μm. (C) Same image as in B, with detected ExFISH-HCR spots (white circle) that correspond to unc-25 mRNA molecules. Spot detection was performed on the confocal stack by a 3D spot-finding algorithm (see Methods for details). (D–F) mRNA molecule count of (D) unc-25, (E) cat-2 and (F) tph-1 in each expressing neuron around the nerve ring, by applying the analytical workflow shown in A-C to separate groups of ExCel-processed animals singly labeled for each specified transcript target. Bar height, mean; error bars, standard deviation. Analyzed animals were between L2-L4 stages. n = 3–7 animals from 1 population, for each transcript-neuron combination. Values for neurons with n < 3 (due to cases in which a neuron cannot be confidently identified) were not shown. The RMEV/D group pools single-neuron mRNA molecule count of unc-25 from RMEV and RMED (n = 6 neurons from 3 animals from 1 population), whereas the RMEL/R group pools from RMEL and RMER (n = 6 neurons from 3 animals from 1 population). P-value, two-sided Wilcoxon rank sum test. Source data of the single-neuron RNA counts, whose population statistics are summarized with the bar graphs shown in D-F, are available in Figure 10—source data 1.
-
Figure 10—source data 1
Count of unc-25, cat-2 and tph-1 RNA molecules within single neurons, whose population statistics are shown in Figure 10D-F.
- https://cdn.elifesciences.org/articles/46249/elife-46249-fig10-data1-v1.xlsx
Figure 11

Screen of post-gelation treatments that confer tissue expandability and general stainability of epitopes.
(A) Representative transillumination images of paraformaldehyde-fixed, β-mercaptoethanol-reduced, AcX-treated, and hydrogel-embedded hermaphrodite animals, (left column) right after hydrogel embedding and prior to any hydrogel expansion, (middle column) after 1.9x-2.1x hydrogel expansion, by incubating the gelled sample in 1x PBS, or (right column) after 3.3–3.7x hydrogel expansion, by sequentially washing the gelled sample with 0.5x PBS, 0.1x PBS, and 0.01x PBS. After hydrogel embedding, gelled samples either are left in TNT buffer (top row; no treatment), processed with a 2 day 37°C Proteinase K digestion, as in the standard ExCel protocol (middle row), or processed with a 5 day 37°C collagenase type II digestion (bottom row). Transillumination images provide visualization to both the contour of the worm (traced under high digital magnification in black dotted lines, in cases where direct observation is difficult due to reduced tissue scattering after hydrogel expansion), and also the contour of the mold in the embedding hydrogel (traced in white dotted lines, in cases where direct observation is difficult to reduced gel-boundary scattering after hydrogel expansion). For each treatment, the expansion factor of the worm (measured as the length ratio of a worm in the pre-expansion and the post-3.5x-expansion (hydrogel) state) is normalized by the expansion factor of the embedding hydrogel, which results in a normalized expansion factor (abbreviated as nExF), to remove the variation on worm expansion factor due to inter-sample variation in the hydrogel expansion factor. For the no-treatment condition (top row) and the collagenase type II condition (bottom row), where the normalized expansion factors are markedly less than unity (0.40 and 0.66, respectively), the hydrogel-embedded worm tissue detaches from the surrounding hydrogel, due to tissue mechanical hindrances against expansion that are incompletely removed by the post-hydrogel-embedding treatment, and can be visualized by the extent of mismatch between the worm contour and the hydrogel-mold contour. Images are single-plane wide-field acquisitions. For post-2.0x- and 3.5x- images, in cases where uneven illumination from the bright-field light source strongly affects contour visualization, a band-pass filtering with the boundary of 3 and 30 pixels was performed with the Fiji function ‘Bandpass Filter’ to remove the illumination artifact, and to improve contour visualization. Brightness and contrast settings: first set by the automatic adjustment function in Fiji, and then manually adjusted (raising the minimum-intensity threshold and lowering the maximum-intensity threshold) to improve contrast for the boundaries of the worm and the mold. Scale bars: 300 μm in actual units (not converting to biological units here, since the two features (worm and hydrogel-mold) are associated with different expansion factors). (B) Representative images of the immunostaining of hydrogel-embedded animals in (A), via a panel of 5 primary antibodies with known patterns of staining. Due to spectral limitation, the five antibodies were separated into four spectrally separable channels (DyLight 405 for anti-GFP, Alexa 488 for anti-LMN1, Alexa 546 for anti-myotactin and anti-DLG1, Alexa 647 for anti-acetylated tubulin). An IHC score from 0 to 1 was manually assigned to each channel, based on the estimated signal-to-noise ratio of the expected pattern of staining, and thereby provides a rough quantification for the quality of immunostaining of each antibody (or pair of antibodies) following the specified post-hydrogel-embedding treatment. The strain used had pan-neuronal cytosolic expression of GFP (tag-168p::GFP). A few patterns of channel crosstalk, such as the anti-GFP signal observed in the anti-myotactin + anti-DLG1 channel, were observed but do not affect the scoring process, because the known patterns of staining for each of the five antibodies were spatially separable (GFP, pan-neuronal by promoter choice; LMN1 (lamin), nuclear; myotactin, periphery of pharyngeal muscle and beneath cuticle; DLG1 (disc large), adherens junctions that form characteristic thread-like patterns across the length of the worm; acetylated tubulin, touch-receptor neurons). Images are max-intensity projections of confocal stacks acquired through the entire animal. Brightness and contrast settings: individually set by the automatic adjustment function in Fiji. Linear expansion factors of the hydrogel: 1.9–2.1x (after immunostaining, the samples were left in 1x PBS and imaged in that state, without further expansion in deionized water; we decided to use this procedure here, because we observed that even at this partially expanded state, we could already evaluate whether the staining against protein targets yielded the expected patterns of localization, as demonstrated by the images in this panel, without the additional improvements in resolution that would result from further expansion of the samples). Linear expansion factors of the worm: no treatment, 1.1x; Proteinase K (standard ExCel), 1.9x, Collagenase Type II, 1.6x. Scale bars: left images, 50 μm (in biological units, i.e. post-expansion lengths are divided by the expansion factor of the worm). (C) Summary of the screen of 22 post-hydrogel-embedding treatments, each of which is characterized by (X axis) the post-treatment expandability of the worms, as quantified by the normalized expansion factor analysis as performed in A, and (Y axis) the post-treatment quality of immunohistochemistry, as quantified by the average of IHC scores across the four channels in the immunostaining assay as performed in B. Each dot represents a single treatment. See Methods for the protocol performed for each treatment. Treatments are grouped based on the nature of the protocol, and colored according to the group they belong to (legend). X- and Y- coordinates of each treatment represent the mean values of all animals analyzed in the expandability assay (which quantifies the normalized expansion factor, as in A) and the immunostaining assay (which quantifies the IHC score, as in B), respectively. Number of animals analyzed in the assay: expandability assay, 3–4 animals from 1 hydrogel sample; 4-channel immunostaining assay, 2–4 animals from 1 hydrogel sample, except for the papain treatment (1 animal). The condition displayed as MAP5 18-18-2 (heat denaturation in MAP5 buffer for 18 hr at 37°C, 18 hr at 70°C, and 2 hr at 95°C) is abbreviated as simply ‘MAP5’ in later figures. Source data of the measurements made in the expandability and the stainability assays are available in Figure 11—source data 1.
-
Figure 11—source data 1
Measurements for the expandabiliy and stainability assays, whose population statistics are summarized in Figure 11C.
- https://cdn.elifesciences.org/articles/46249/elife-46249-fig11-data1-v1.mat
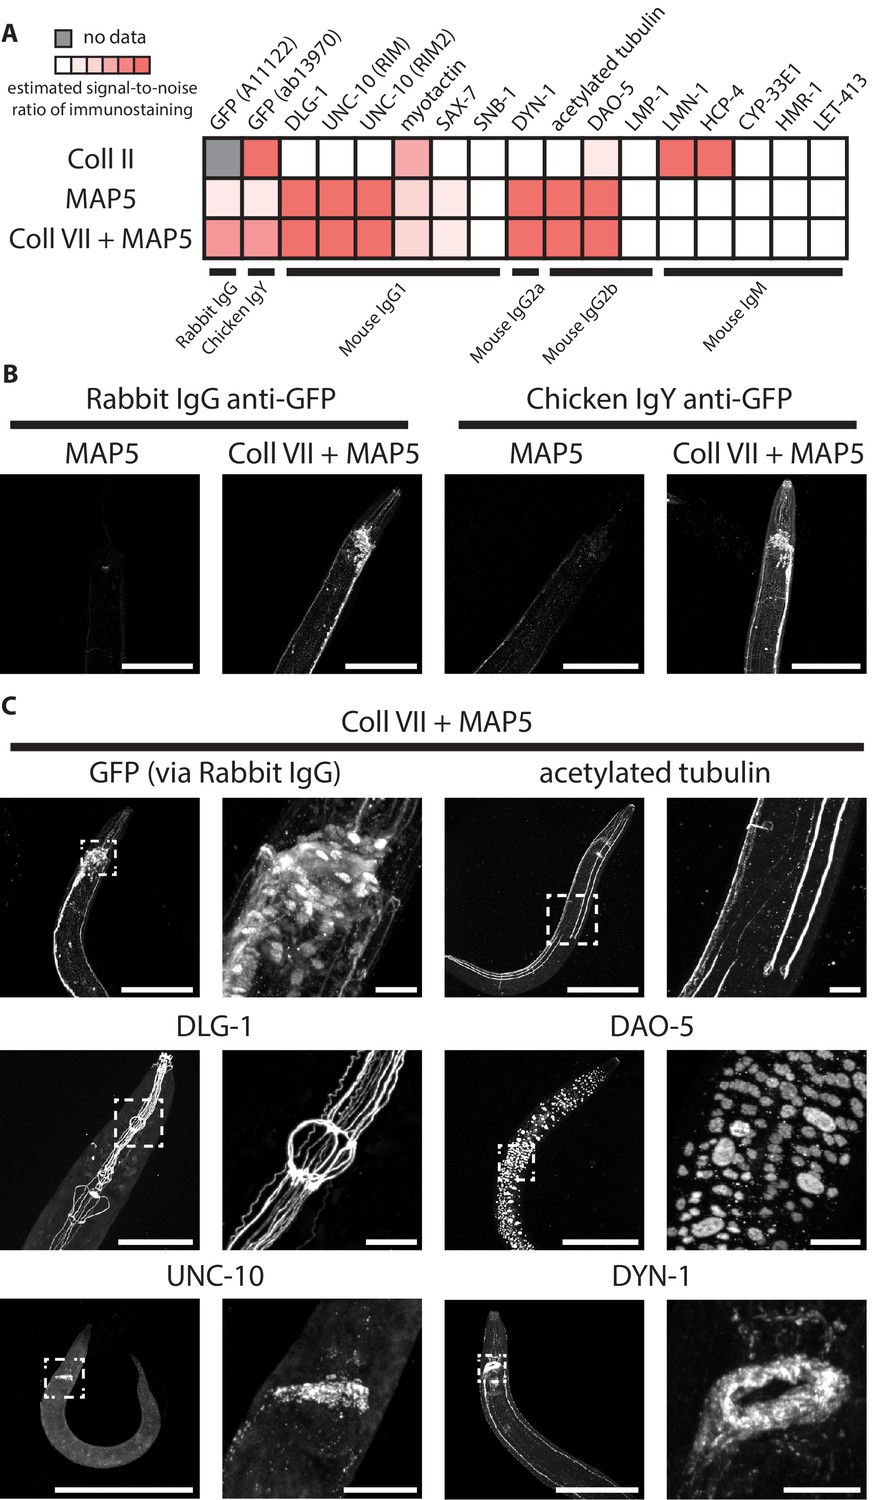
Figure 12
Immunohistochemistry after selected post-gelation treatments.
(A) Estimated signal-to-noise ratio of immunostaining in paraformaldehyde-fixed, β-mercaptoethanol-reduced, AcX-treated, and hydrogel-embedded hermaphrodite animals, where the immunostaining was performed after the gel-embedded sample was processed with either a collagenase type II treatment (Coll II; 24 hr at 37°C), a denaturation treatment in MAP5 buffer (MAP5; 18 hr at 37°C + 18 hr at 70°C + 2 hr at 95°C), or the same denaturation treatment but additionally preceded by a collagenase type VII treatment (Coll VII + MAP5; the collagenase VII treatment was performed for 24 hr at 37°C). See Methods for detailed descriptions of each treatment. Top labels, target of the antibody; bottom labels, class of the antibody. Signal intensities were manually scored from confocal stacks acquired from at least three animals from one or more gel samples. (B) Representative images of anti-GFP staining on paraformaldehyde-fixed, β-mercaptoethanol-reduced, AcX-treated, and hydrogel-embedded hermaphrodite animals, where the immunostaining was performed after the gel-embedded sample was processed with either a denaturation treatment in MAP5 buffer (MAP5; 18 hr at 37°C + 18 hr at 70°C + 2 hr at 95°C), or the same denaturation treatment but additionally preceded by a collagenase type VII treatment (Coll VII + MAP5; the collagenase VII treatment was performed for 24 hr at 37°C). The strain used had pan-neuronal cytosolic expression of GFP (tag-168p::GFP). Images are max-intensity projections of confocal stacks acquired through the entire animal. Brightness and contrast settings: Coll VII + MAP5 images (right), individually set by the automatic adjustment function in Fiji; MAP5 images (left), have the same settings as the corresponding Coll VII + MAP5 image, to facilitate direct comparison. Linear expansion factors: worm, 1.1–1.3x; surrounding hydrogel, 1.9–2.1x. Scale bars: 100 μm (in biological units, i.e. post-expansion lengths are divided by the expansion factor of the worm). (C) Representative images of immunostaining on paraformaldehyde-fixed, β-mercaptoethanol-reduced, AcX-treated, and hydrogel-embedded hermaphrodite animals, where the immunostaining was performed after the gel-embedded sample was processed first with a collagenase type VII treatment (24 hr at 37°C) and then with a denaturation treatment in MAP5 buffer (18 hr at 37°C + 18 hr at 70°C + 2 hr at 95°C) (Coll VII + MAP5). The strain used had pan-neuronal cytosolic expression of GFP (tag-168p::GFP). Applied antibodies were against (upper left) GFP, (upper right) acetylated tubulin, a marker of touch-receptor neurons, (middle left) DLG-1, a scaffolding protein that localizes to adherens junctions, (middle right) DAO-5, a nuclear protein, (lower left) UNC-10, a homolog of the vertebrate Rim protein that involves in synaptic vesicle release, and (lower right) DYN-1, a dynamin, which is involved in clathrin-mediated endocytosis. Images are max-intensity projections of confocal stacks acquired through the entire animal. Right images are magnified views of the boxed regions in the left images. Brightness and contrast settings: first set by the automatic adjustment function in Fiji, and then manually adjusted (raising the minimum-intensity threshold and lowering the maximum-intensity threshold) to improve contrast for stained structures. Linear expansion factors: worm, 1.1–1.3x; surrounding hydrogel, 1.9–2.1x. Scale bars: left images, 100 μm; right images, 10 μm (in biological units, i.e. post-expansion lengths are divided by the expansion factor of the worm).
Figure 13 with 1 supplement
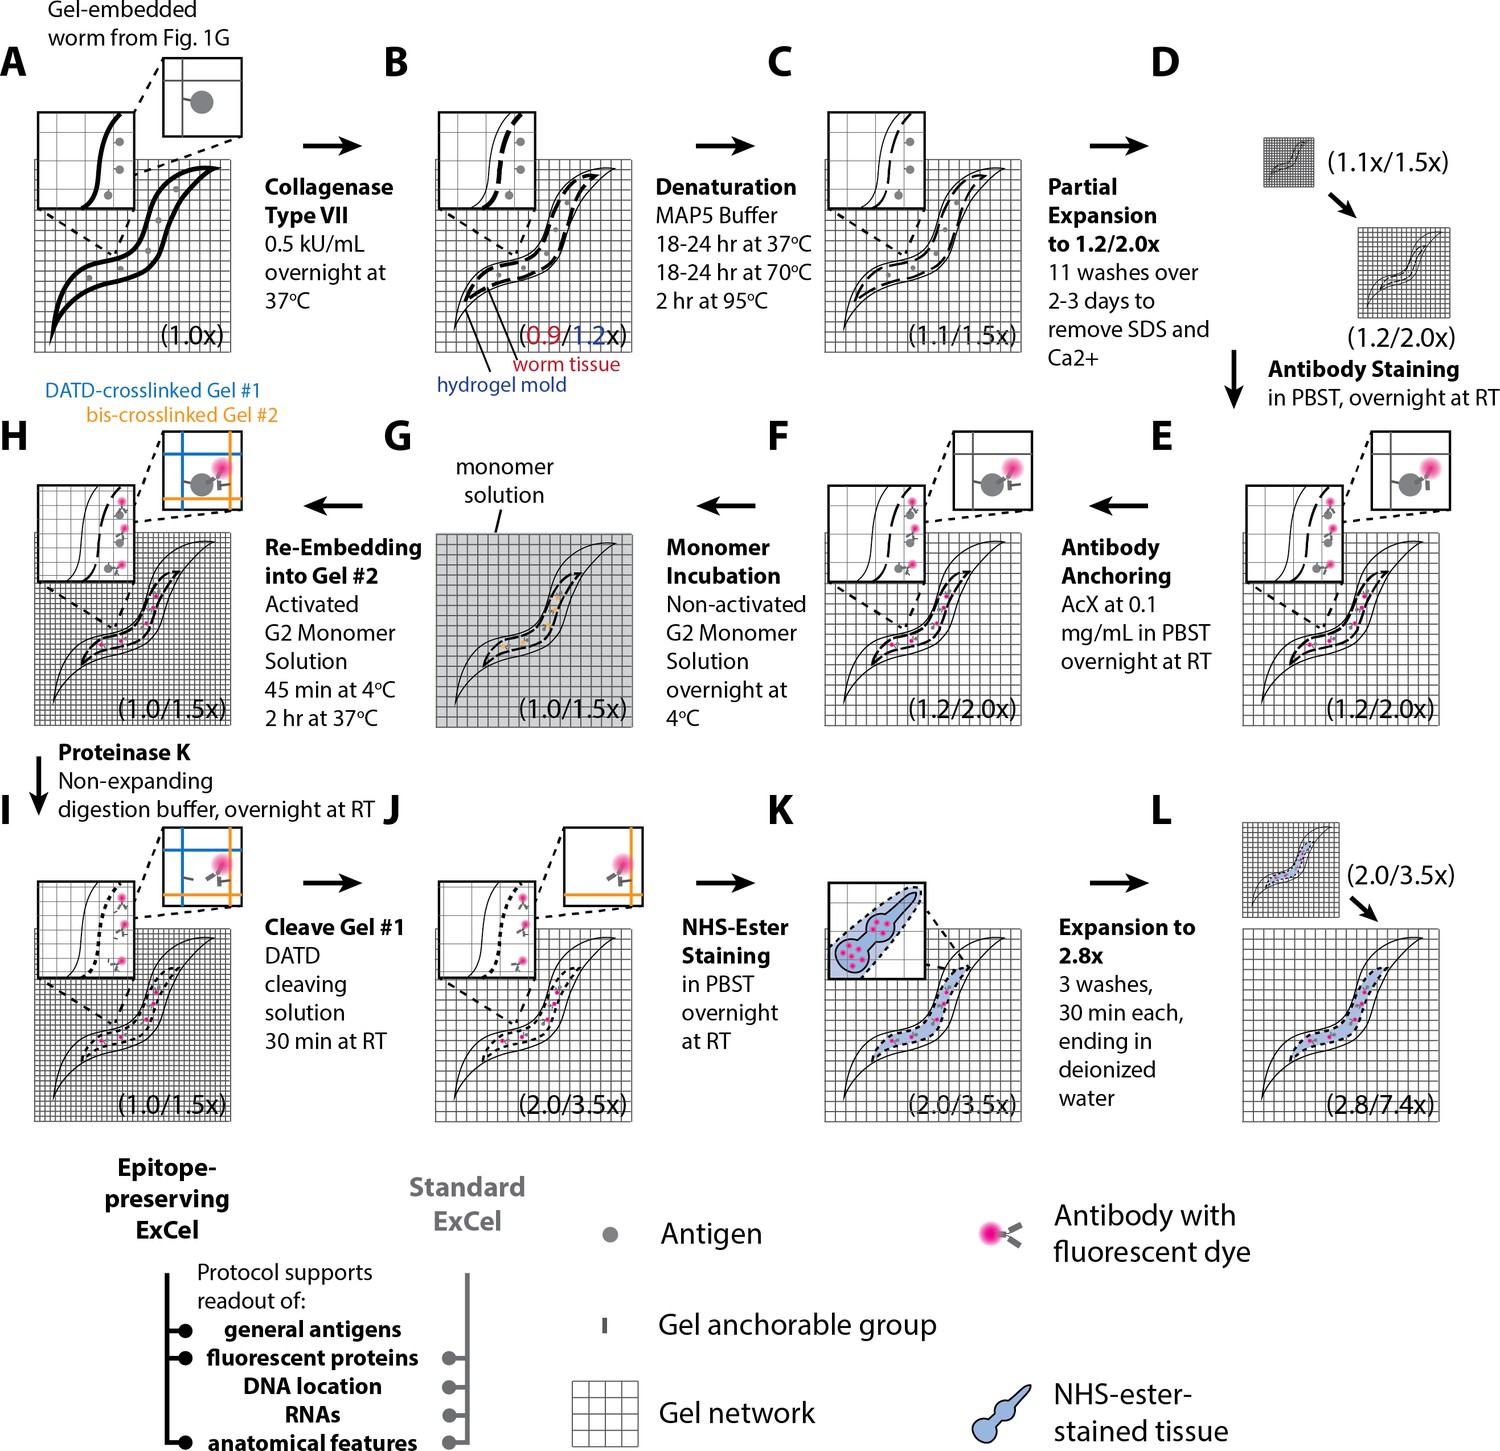
Workflow for epitope-preserving expansion of C. elegans (epitope-preserving ExCel) sample processing.
A method for expanding cuticle-enclosed intact C. elegans, while permitting readout of a majority of antigens that are detectable through non-IgM-class antibodies (~70%; estimated from the immunostaining results from the panel of 12 non-IgM antibodies in Figure 12A). Sample processing prior to Panel A is identical to the workflow for the standard ExCel protocol without ExFISH (as shown in blue arrows in Figure 1) until, and including, the gelation step (Figure 1A–C, E–G). The linear expansion factor of the hydrogel-specimen composite is shown in parentheses. For stages in which the worm tissue expands to a less extent than the surrounding hydrogel, which occurs due to incomplete homogenization of mechanical strength of the fixed worm tissue, the expansion factors of the worm and of the hydrogel are shown in front of and after a slash sign, respectively. (A–L) Steps of the protocol, with the bold text indicating the title of the step. (A) Hydrogel polymerization is performed on the specimen, by first incubating the specimens in activated monomer solution (0.015% 4-hydroxy-TEMPO, 0.2% TEMED, 0.2% APS, in addition to the non-activated monomer solution) for 1 hr at 4°C, transferring the specimens into a gelation chamber, and incubating the chamber for 2 hr at 37°C. During polymerization, AcX-modified proteins are covalently anchored to the hydrogel network. (B) Specimens are treated with chromatography-purified collagenase type VII at 0.5 kU/mL, in a calcium-containing tris-buffered saline (100 mM Tris pH 8.0, 500 mM NaCl, 40 mM CaCl2) overnight (18–24 hr) at 37°C. During this treatment, the hydrogel expands by ~1.2x linearly, whereas the worm slightly reduces in size to ~0.9x linearly. Due to the mismatch in expansion factor between the worm and the gel, the worm tissue detaches from the surrounding hydrogel, but physically remains in the hydrogel mold that was made of its own shape during the gelation step in A. (C) Specimens are processed with a denaturation treatment, in which they are incubated in a minimally-expanding protein-denaturing buffer (MAP5 buffer; 50 mM Tris pH 9.0, 5.72% (w/w) sodium dodecyl sulfate (SDS), 400 mM NaCl, 20 mM CaCl2) overnight (18–24 hr) at 37°C, overnight (18–24 hr) at 70°C, and 2 hr at 95°C. Reduced calcium and NaCl concentrations are used in this buffer, compared to other non-expanding buffers designed in this paper, due to their incompatible solubility with SDS at higher concentrations. (D) Specimens are washed four times in a tris-buffered saline (TNC40020 (acronyms are used in the supplementary protocols in Appendix 1) buffer; 50 mM Tris pH 8.0, 400 mM NaCl, 20 mM CaCl2) to remove SDS from the hydrogel sample. Specimens are then washed four times in tris buffered saline with reducing calcium concentration (once with TNT Buffer + 10 mM CaCl2, and then three times with TNT Buffer; TNT Buffer is 50 mM Tris pH 8.0, 1M NaCl, 0.1% Triton X-100) to remove calcium ions from the hydrogel sample. Finally, specimens are washed with phosphate-buffer saline with reducing NaCl concentration (once with PBST + 500 mM NaCl, twice with PBST; PBST is 1x PBS + 0.1% Triton X-100). (E) Specimens are immunostained with fluorescent antibodies against the target antigens. (F) Specimens are incubated with AcX at a concentration of 0.1 mg/mL in PBST (1x PBS + 0.1% Triton X-100) overnight at RT. This step equips proteins, including the fluorescent antibodies introduced in E, with a polymer-anchorable moiety. (G) Specimens are incubated in non-activated G2 monomer solution (50 mM MOPS pH 7.0, 2 M NaCl, 7.5% (w/w) sodium acrylate, 2.5% (w/w) acrylamide, 0.15% (w/w) N,N’-methylene-bis-acrylamide) overnight at 4°C, to ensure complete diffusion of the monomer solution throughout the specimen, prior to the gelation reaction. (H) Specimens are re-embedded into a second expandable hydrogel, by incubating the specimens in activated monomer solution (0.015% 4-hydroxy-TEMPO, 0.2% TEMED, 0.2% APS, in addition to the non-activated monomer solution) for 45 min at 4°C, transferring the specimens into a gelation chamber, and incubating the chamber for 2 hr at 37°C. During polymerization, AcX-modified fluorescent antibodies are covalently anchored to the hydrogel network of the second hydrogel (orange grids). We use blue grids to represent the hydrogel network of the first, DATD-crosslinked hydrogel (i.e., the network synthesized in Panel A), to differentiate it from the network of the re-embedding second hydrogel. (I) Specimens are treated with Proteinase K at 8 U/mL, in non-expanding digestion buffer (50 mM Tris pH 8.0, 500 mM NaCl, 40 mM CaCl2, 0.1% Triton X-100) overnight (18–24 hr) at RT, to further reduce the mechanical strength of the original worm tissue and permit greater expansion. During this proteolytic treatment, most proteins lose antigenicity, but some of the fluorescent signals from AcX-anchored fluorescent proteins are retained, as utilized by the original ProExM protocol. (J) Specimens are treated with DATD cleaving solution (20 mM sodium meta-periodate in 1x PBS, pH 5.5) for 30 min at RT, to chemically disintegrate the first hydrogel, which contains the periodate-cleavable crosslinker N,N'-diallyl-tartardiamide (DATD), while sparing the second hydrogel, which contains a periodate-resistant crosslinker, N,N’-methylene-bis-acrylamide (bis). (K) To visualize anatomical features, specimens can be stained with an N-hydroxysuccinimide ester (NHS ester) of fluorescent dye (introduced in Main Text, Figure 4, Videos 1 and 2). NHS-ester staining is performed at 5 μM in PBST (1x PBS + 0.1% Triton X-100) overnight at RT. DAPI staining can be applied at this stage, but the result does not correspond to the expected nuclear pattern as observed in Figures 2, 5 and 9 (see Figure 13—figure supplement 1). (L) Specimens are expanded with one wash in 0.1x PBS and two washes in deionized water. At this stage, the hydrogel expands by ~7.4x linearly, whereas the worm tissue expands by ~2.8x linearly, within a range from 2.5 to 3.5x (median, 2.78x; mean, 2.83x; n = 10 independently processed hydrogels from 2 sets of experiments). After expansion, specimens are ready for imaging.
Figure 13—figure supplement 1
DAPI staining after epitope-preserving ExCel.
Representative images of epitope-preserving-ExCel-processed (formaldehyde-fixed, β-mercaptoethanol-reduced, AcX-treated, hydrogel-embedded, collagenase-digested, denaturation-processed, antibody-stained and re-embedded; as in Figure 13A–J) hermaphrodite animals, stained with 5 μg/mL DAPI in 1x PBS for 2 hr at RT, and fully expanded (as in Figure 13K–L). (A) Pharyngeal region of an L1 animal. Boxed region marks several cells near the anterior pharyngeal bulb, and is shown in magnified view in Panel B. (B) Magnified view of the boxed region in A. (C) A portion of the intestine (left side of the image, which contains the larger cells; refer to Figure 4B) and gonad (right side of the image, which contains the smaller cells; refer to Figure 4C) of an L2 animal. Boxed region marks an intestinal cell, and is shown in magnified view in Panel D. (D) Magnified view of the boxed region in C. Images are max-intensity projections of confocal stacks acquired through a portion (~5 μm, in biological units) of the tissue, and not across the entire animal, in order to facilitate visualization of the pattern of staining (since the max projection across the entire animal would contain signals from overlapping layers of nuclei, which hinders interpretation). Brightness and contrast settings: first set by the automatic adjustment function in Fiji, and then manually adjusted (raising the minimum-intensity threshold and lowering the maximum-intensity threshold) to improve contrast. Linear expansion factor: worm, 3.0–3.2x; surrounding hydrogel, 7.6x. Scale bars: (A, C) 5 μm; (B, D) 1 μm (in biological units, i.e. post-expansion lengths are divided by the expansion factor of the worm).
Figure 14
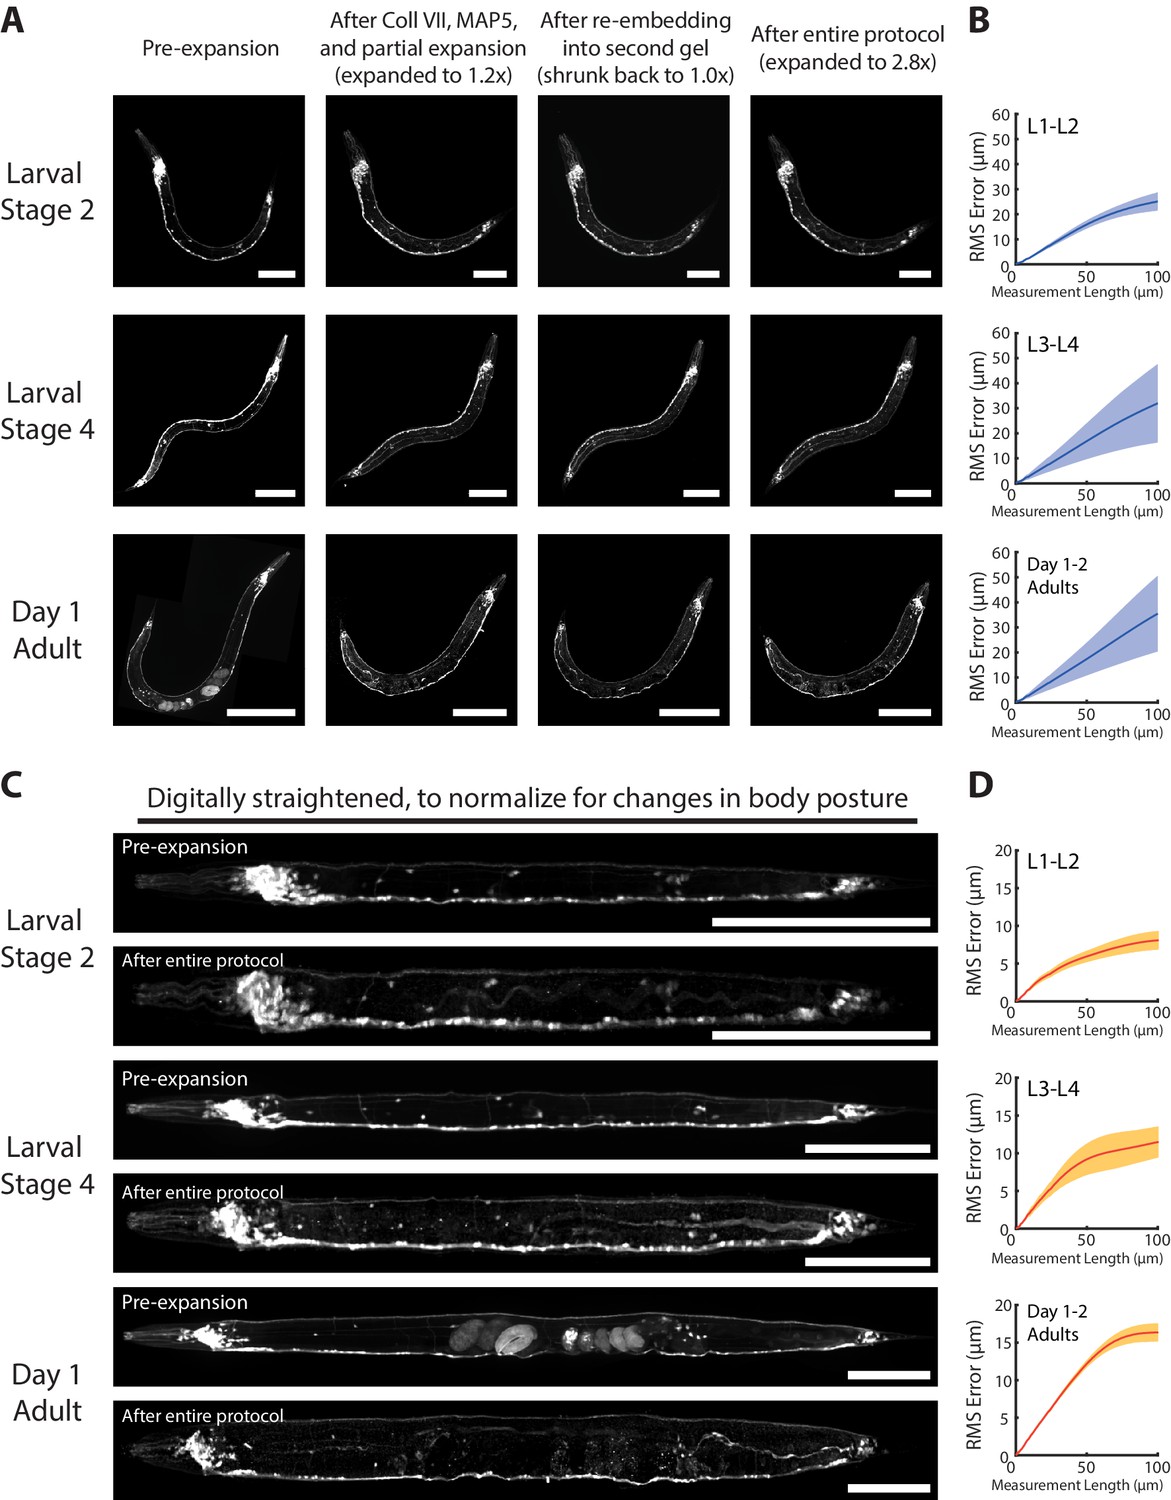
Isotropy of epitope-preserving ExCel.
(A) Representative images of paraformaldehyde-fixed, β-mercaptoethanol-reduced, AcX-treated, and hydrogel-embedded (as in Figure 1A–C, E–G) hermaphrodite animals in the second larval stage (‘Larval Stage 2’; L2), the fourth larval stage (‘Larval Stage 4’; L4) and day 1 adulthood (‘Day 1 Adult’) at various stages of the epitope-preserving ExCel workflow. These stages include: right after hydrogel embedding (‘Pre-expansion’; as in Figure 13A), after collagenase type VII digestion, denaturation, partial expansion and anti-GFP staining (‘After Coll VII, MAP5, and partial expansion’; as in Figure 13A–E), after re-embedding into the second gel (‘After re-embedding into second gel’; as in Figure 13A–H), or after the entire epitope-preserving ExCel protocol (‘After entire protocol’; as in Figure 13A–L). Strain expressed tag-168p::GFP. Signals in the Pre-expansion images were from native GFP; signals in images from all later stages were from antibody staining against GFP. Images are max-intensity projections of confocal stacks acquired through the entire animal. Brightness and contrast settings: pre- and post-ExCel images (left and center), first individually set by the automatic adjustment function in Fiji, and then manually adjusted (raising the minimum-intensity threshold and lowering the maximum-intensity threshold) to improve contrast. Linear expansion factors (of the worm and of the surrounding hydrogel, shown before and after the slash sign): pre-expansion (first column), 1.0x/1.0x; after Coll VII, MAP5 and partial expansion (second column), 1.1–1.2x/2.2–2.3x; after re-embedding into second gel (third column), 0.9–1.1x/1.4–1.5x; after entire protocol (fourth column), 2.5–2.8x/7.4–7.5x. Scale bars: L2, 50 μm; L4, 100 μm; day 1 adult, 200 μm (in biological units, i.e. post-expansion lengths are divided by the expansion factor of the worm). (B) Root-mean-square length measurement error (‘RMS Error’) computed from pre-expansion (first column) and post-entire-protocol (fourth column) images, as acquired in A, for L1-L2 larvae (top), L3-L4 larvae (middle), and day 1 – day 2 adults (bottom). Blue line, mean; shaded area, standard deviation. n = 3 animals for each age group, from a single mixed-age population processed on a single hydrogel sample. Source data of the RMS length measurement errors are available in Figure 14—source data 1. (C) Animals shown in A, but digitally straightened, by performing the ImageJ function Straighten on manually selected spline control points along the body midline of each worm. Images show animals right after hydrogel embedding expansion (top; ‘Pre-expansion’, as in Figure 13A) or after the entire protocol (bottom; ‘After entire protocol’, as in Figure 13A–L). Scale bars: 100 μm. (D) Same analysis as in B, but performed on digitally straightened animals as in C. Orange line, mean; shaded area, standard deviation. n = 3 animals for each age group, from a single mixed-age population processed on a single hydrogel sample. Source data of the RMS length measurement errors are available in Figure 14—source data 2.
-
Figure 14—source data 1
Root-mean-square (RMS) length measurement errors plotted in Figure 14B.
- https://cdn.elifesciences.org/articles/46249/elife-46249-fig14-data1-v1.mat
-
Figure 14—source data 2
Root-mean-square (RMS) length measurement errors plotted in Figure 14D.
- https://cdn.elifesciences.org/articles/46249/elife-46249-fig14-data2-v1.mat
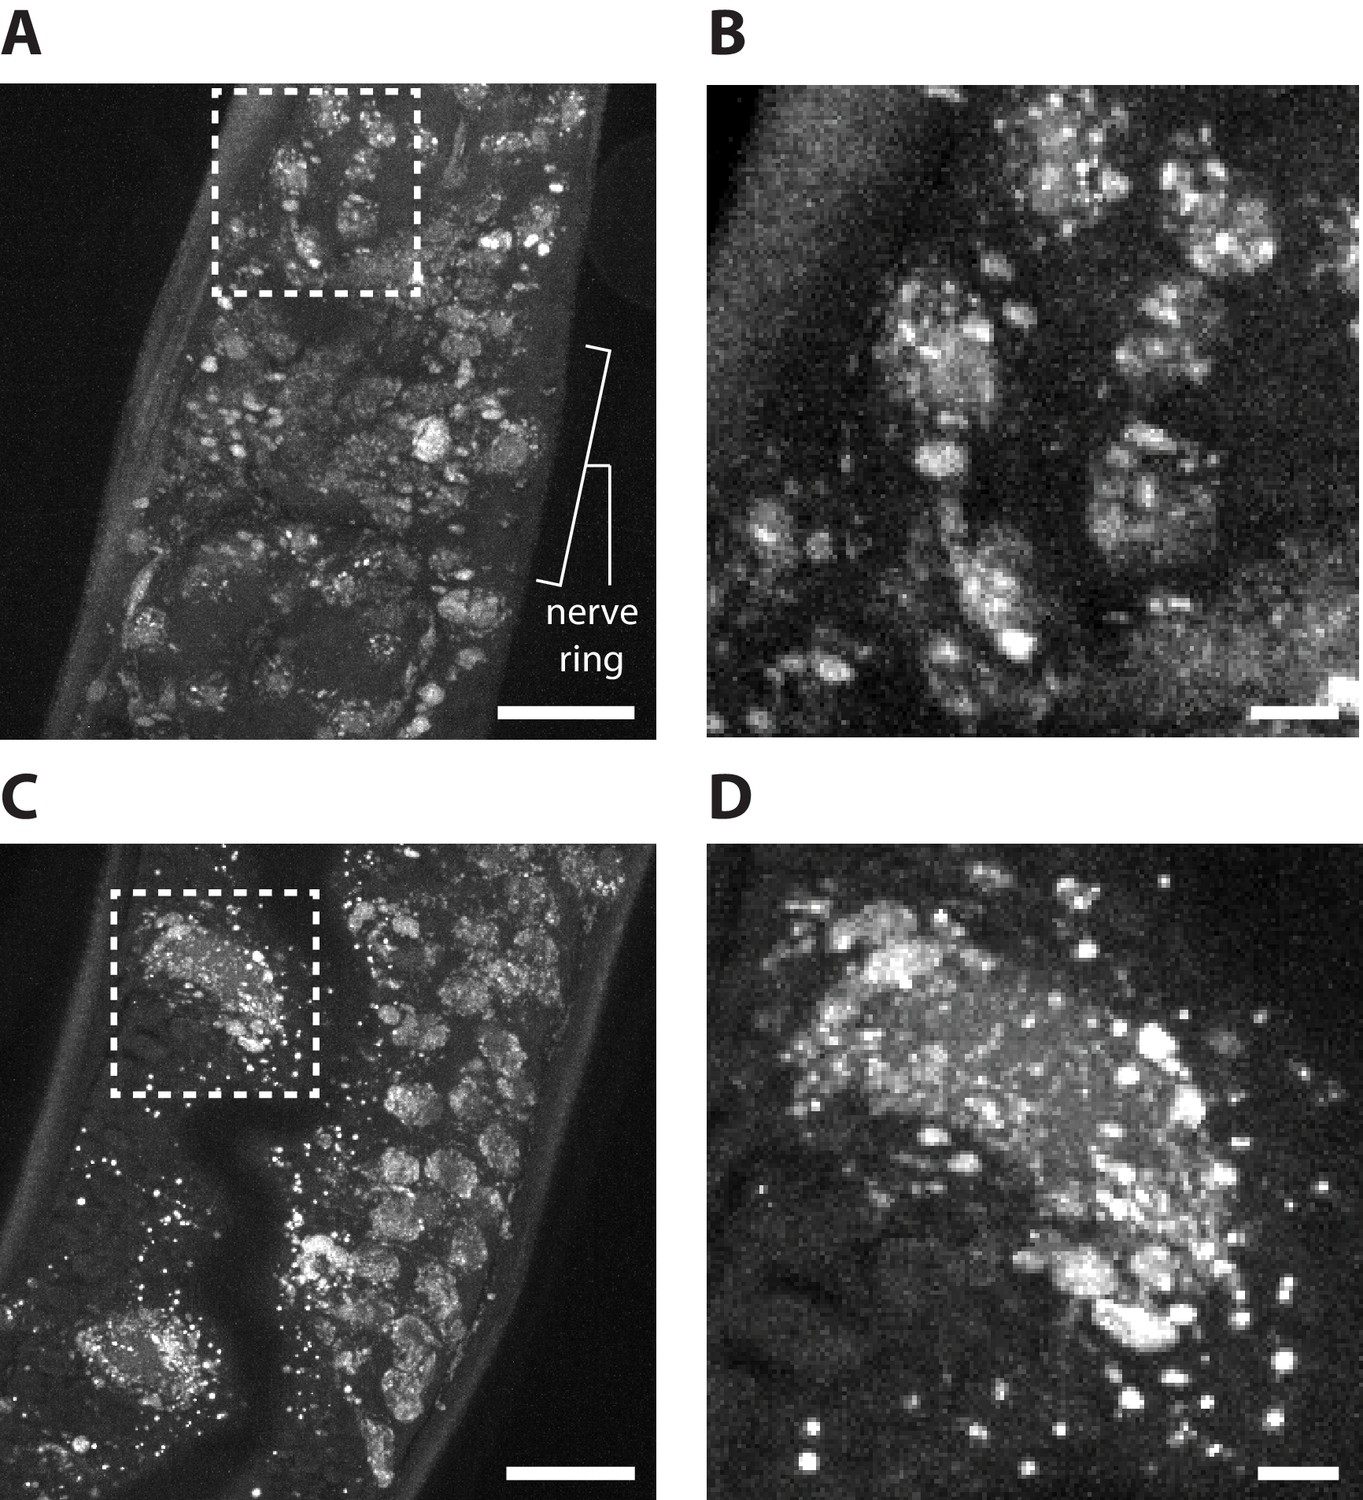
Figure 15
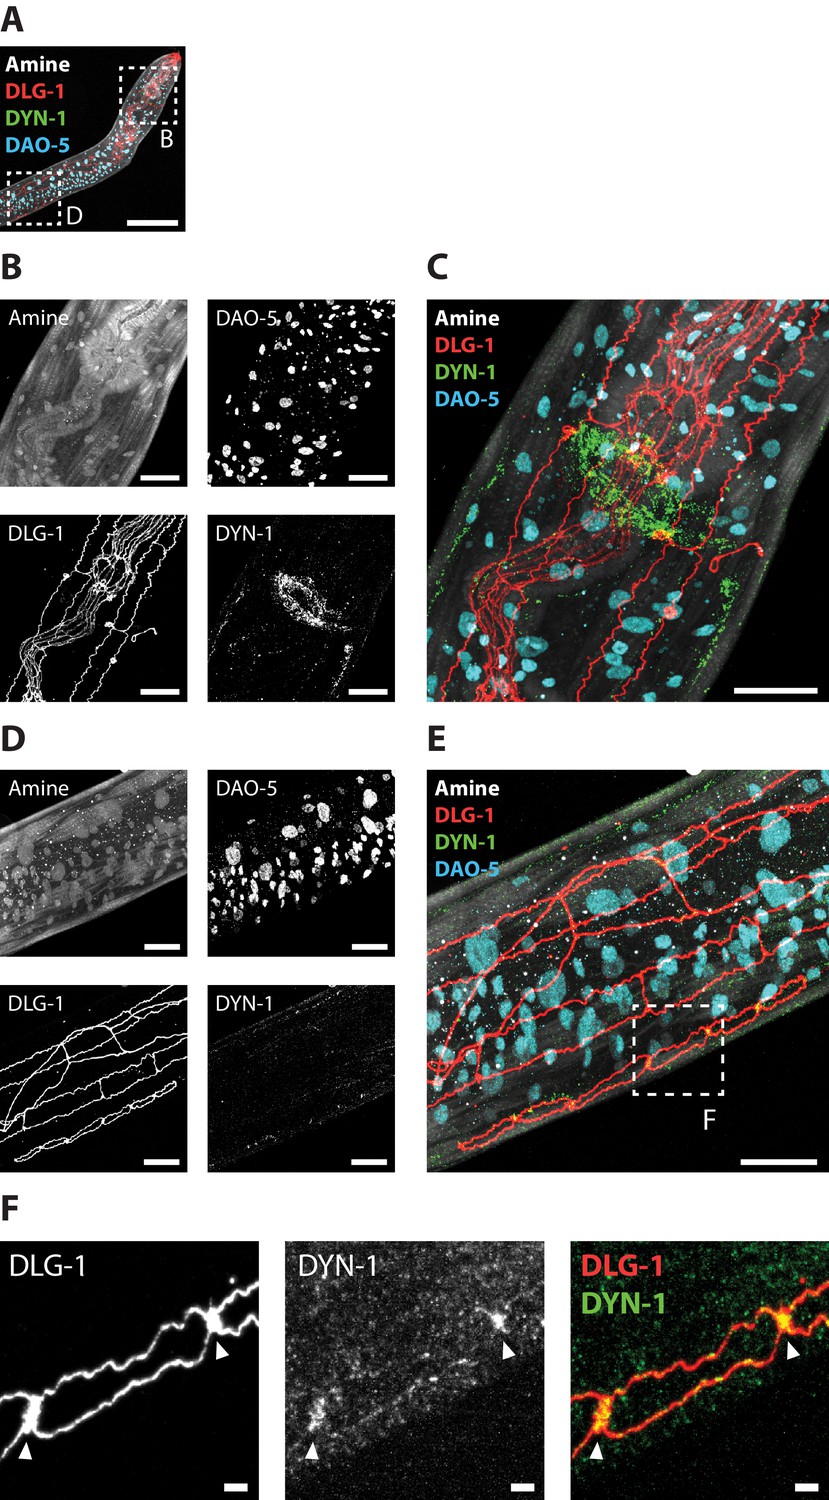
Epitope-preserving ExCel allows multiplexed imaging of endogenous proteins at nanoscale resolution.
A representative epitope-preserving-ExCel-processed (formaldehyde-fixed, β-mercaptoethanol-reduced, AcX-treated, hydrogel-embedded, collagenase-digested, denaturation-processed, antibody-stained, re-embedded and fully expanded; as in Figure 13A–L) L2 hermaphrodite animal, stained with antibodies against DLG-1 (disc large; a scaffolding protein that localizes to adherens junctions), DYN-1 (dynamin; localizes to clathrin-mediated endocytic sites), DAO-5 (a nuclear protein) and an NHS ester of a fluorescent dye (Alexa 405 NHS ester; against amines; for anatomical features). (A) Merged composite image of the upper body, from the four staining modalities. Boxed regions mark the nerve ring and the developing vulva, and are shown in magnified views in Panels B and D, respectively. (B) Single-channel images of each staining modality, centered at the nerve ring (upper boxed region in A). (C) Merged composite image from combining images in B. (D) Single-channel images of each staining modality, centered nearby the developing vulva (lower boxed region in A). (E) Merged composite image from combining images in D. Boxed region marks one of the six vulval progenitor cells, as delineated by the adherens junction marker DLG-1, and is shown in magnified views in Panel F. (F) Magnified view of the boxed region in E, as single-channel images of DLG-1 (left) or DYN-1 (middle) staining, or merged composite image between these two channels (right). Arrows, sites of contact between vulval progenitor cells. Images are max-intensity projection of a confocal stack acquired through the entire animal (for Panels A-E), or only through the DLG-1 marked structure (for Panel F; to reduce the noise coming from planes outside of the structure of interest; i.e. the DLG-1 marked adherens junctions of the developing vulva). Brightness and contrast settings: each channel was first set by the automatic adjustment function in Fiji, and then manually adjusted (raising the minimum-intensity threshold and lowering the maximum-intensity threshold) to improve contrast. Linear expansion factor: worm, 3.2x; surrounding hydrogel, 7.9x. Scale bars: Panel A, 50 μm; Panels B-E, 10 μm; Panel E, 1 μm (in biological units, i.e. post-expansion lengths are divided by the expansion factor of the worm).
Figure 16

Super-resolution imaging of pre-synaptic active and peri-active zones with epitope-preserving ExCel.
A representative epitope-preserving-ExCel-processed (formaldehyde-fixed, β-mercaptoethanol-reduced, AcX-treated, hydrogel-embedded, collagenase-digested, denaturation-processed, antibody-stained, re-embedded and fully expanded; as in Figure 13A–L) L2 hermaphrodite animal, stained with antibodies against GFP (the strain used had pan-neuronal cytosolic expression of GFP, under tag168p::GFP), DYN-1 (dynamin; localizes to clathrin-mediated endocytic sites, which mark peri-active zones of pre-synapses), UNC-10 (a homolog of the vertebrate Rim protein, which regulates synaptic vesicle release, and localizes to active zones of pre-synapses) and an NHS ester of a fluorescent dye (Alexa 405 NHS ester; against amines; for anatomical features). (A) Single-channel images of each staining modality, centered at the pharyngeal region of the animal. (B) Merged composite image from combining images in A. Boxed regions mark parts of the nerve ring, pharyngeal motor neurons, and the dorsal nerve cord, and are shown in magnified views in Panels C, D, and E, respectively. (C) Magnified view of a part of the nerve ring (as shown in the boxed region in B), as single-channel images of DYN-1 (left) or UNC-10 (middle) staining, or merged composite image between these two channels (right). (D) Magnified view of pharyngeal motor neuron projections (as shown in the boxed regions in B) located along the outer surface of the pharyngeal muscles, shown as merged composite images between the DYN-1 and the UNC-10 images. (E) Magnified view of a segment of the dorsal nerve cord (as shown in the rectangular boxed region in B), as single-channel images of DYN-1, UNC-10 and GFP (lower images), and as merged composite image between the DYN-1 and the UNC-10 image (top image). Arrow, the dorsal side of the worm. (For the dorsal nerve cord, the dorsal side is facing the cuticle, whereas the ventral side is facing the internal tissues of the worm.) Images are either max-intensity projections of a confocal stack acquired through the entire animal (for Panels A-B), or only through the thickness of the dorsal nerve cord (for Panel E; to reduce the noise coming from planes outside of the structure of interest), or confocal images at a single z-plane (Panels C-D). Brightness and contrast settings: each channel was first set by the automatic adjustment function in Fiji, and then manually adjusted (raising the minimum-intensity threshold and lowering the maximum-intensity threshold) to improve contrast. Linear expansion factor: worm, 3.5x; surrounding hydrogel, 7.5x. Scale bars: Panel A-B, 30 μm; Panels C-E, 1 μm (in biological units, i.e. post-expansion lengths are divided by the expansion factor of the worm).
Figure 17
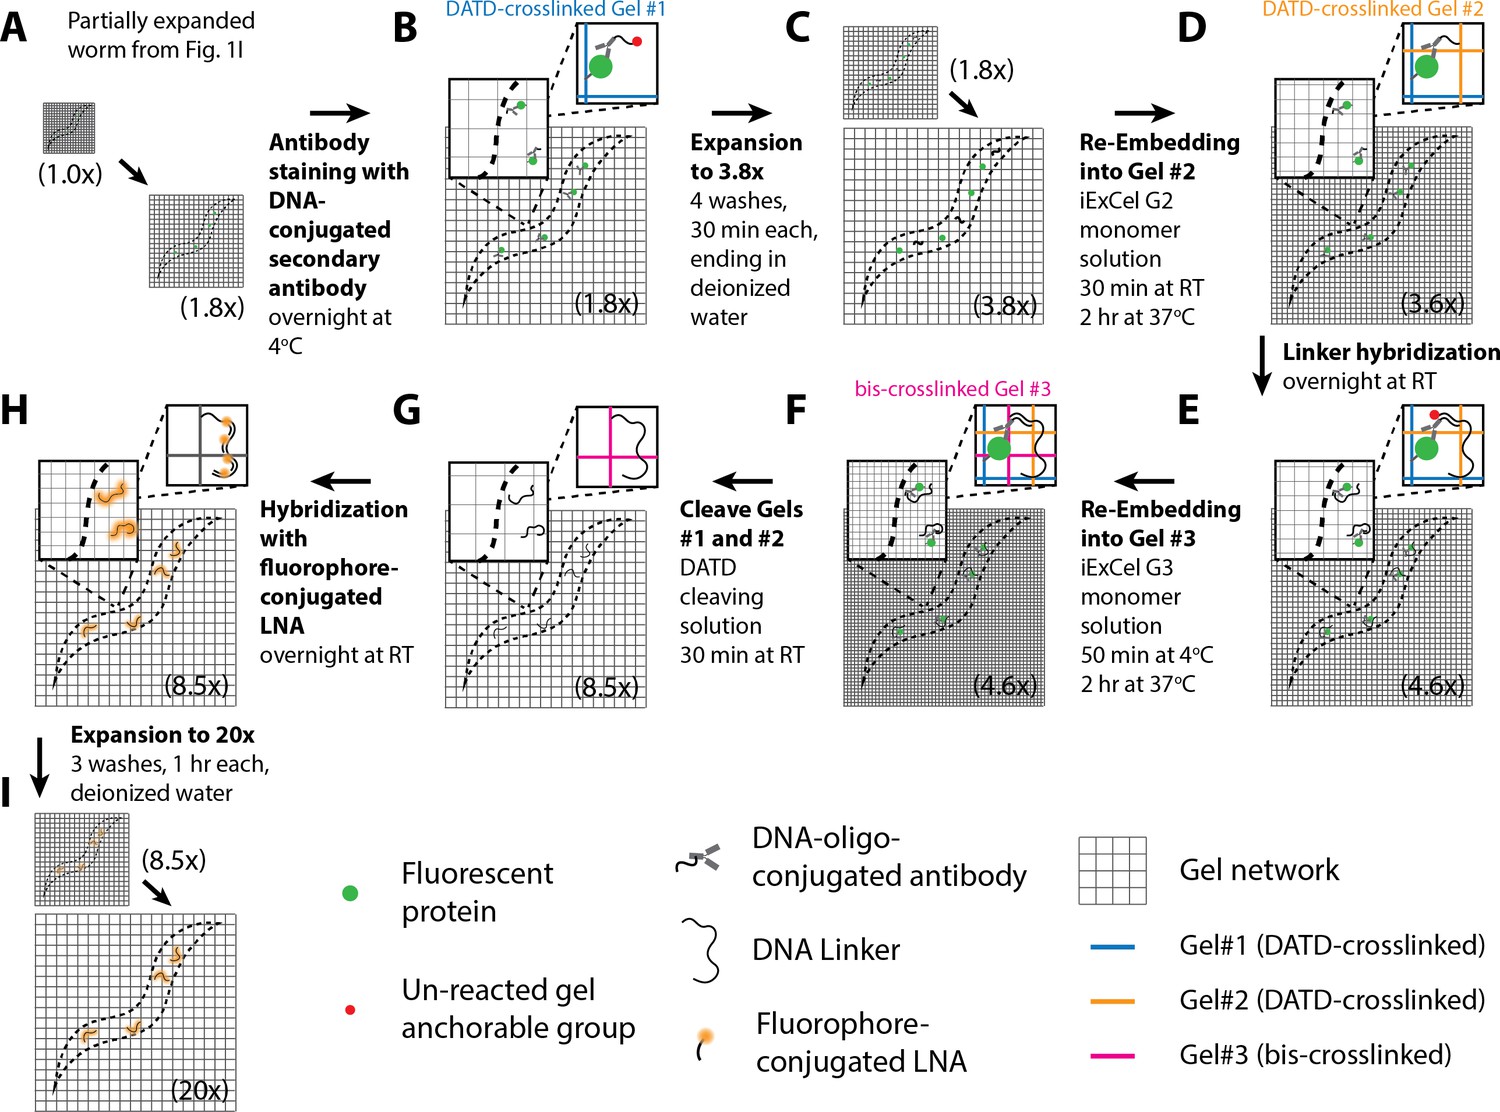
Workflow for iterative expansion of C. elegans (iExCel) sample processing.
A method for iteratively expanding cuticle-enclosed intact C. elegans, for a final linear expansion factor of ~20x. Sample processing prior to Panel A is identical to the workflow for the standard ExCel protocol without ExFISH (as shown in blue arrows in Figure 1) until, and including, the post-Proteinase-K partial expansion step (Figure 1A–C, E–G). The linear expansion factor of the hydrogel-specimen composite is shown in parentheses. (A–I) Steps of the protocol, with the bold text indicating the title of the step. (A) Specimens are partially expanded from a linear expansion factor of 1.0x to 1.8x, with the same protocol as shown in Figure 1I. (B) Specimens are immunostained first with primary antibodies against fluorescent proteins in 5x SSCT overnight at 4°C, and then with secondary antibodies that have been conjugated to a 24-base DNA oligonucleotide, in DNA-conjugated Antibody Staining Buffer (2x SSC, 2% (w/v) dextran sulfate, 1 mg/mL yeast tRNA, 5%(v/v) normal donkey serum, 0.1% Triton X-100) overnight at 4°C. The DNA oligo is conjugated to the antibody at the 3’ end, and contains a gel anchorable group at the 5’ end. (C) Specimens are expanded from a linear expansion factor of 1.8x to 3.8x, with the same protocol as shown in Figure 1M. (D) Specimens are re-embedded into another non-expandable hydrogel (‘Gel #2’) to lock up its size at the expanded state, as shown in Figure 1N, except that the monomer solution is replaced by DATD-crosslinked re-embedding monomer solution (10% acrylamide, 1% N,N'-diallyl-tartardiamide (DATD), 0.05% TEMED, 0.05% APS), which results in a hydrogel that can be later disintegrated via crosslinker cleavage, to allow full expansion of the final expandable gel. The DATD-crosslinked re-embedding monomer solution contains a charged molecule APS. Therefore, the linear expansion factor slightly drops from 3.8x to 3.6x during this step. During hydrogel polymerization, the DNA oligo on the antibody, which contains a gel-anchorable group, is covalently anchored to the second hydrogel network (orange grids). (E) Specimens are incubated with a 100-base DNA oligonucleotide (‘Linker’), which hybridizes to the 24-base DNA oligo on the secondary antibodies, and which contains a gel anchorable group on its 5’ end, in iExCel hybridization buffer (4x SSC, 20% (v/v) formamide) overnight at RT. (F) Specimens are re-embedded into another expandable hydrogel (‘Gel #3’), by incubating the specimens in activated Gel #3 monomer solution (1x PBS pH 7.4, 7.5% (w/w) sodium acrylate, 2.5% (w/w) acrylamide, 0.15% (w/w) N,N’-methylene-bis-acrylamide, 2M NaCl, 0.015% 4-hydroxy-TEMPO, 0.2% TEMED, 0.2% APS) for 50 min at 4°C, transferring the specimens into a gelation chamber, and incubating the chamber for 2 hr at 37°C. During polymerization, the linker DNA oligo, which contains a gel-anchorable group, is covalently anchored to the hydrogel network of the third hydrogel (magenta grids). (G) Specimens are treated with DATD cleaving solution (20 mM sodium meta-periodate in 1x PBS, pH 5.5) for 30 min at RT, to chemically disintegrate the first and the second hydrogels, which contain a periodate-cleavable crosslinker N,N'-diallyl-tartardiamide (DATD), while sparing the third hydrogel, which contains a periodate-resistant crosslinker N,N’-methylene-bis-acrylamide (bis). (H) Specimens are incubated with a fluorophore-conjugated 15-base locked nucleic acid (LNA) oligonucleotide, which hybridizes to the 100-base linker DNA oligo at four locations, in iExCel hybridization buffer (4x SSC, 20% (v/v) formamide) overnight at RT. (I) Specimens are expanded to a linear expansion factor of ~20x, with three washes in deionized water. After expansion, specimens are ready for imaging.
Figure 18 with 1 supplement
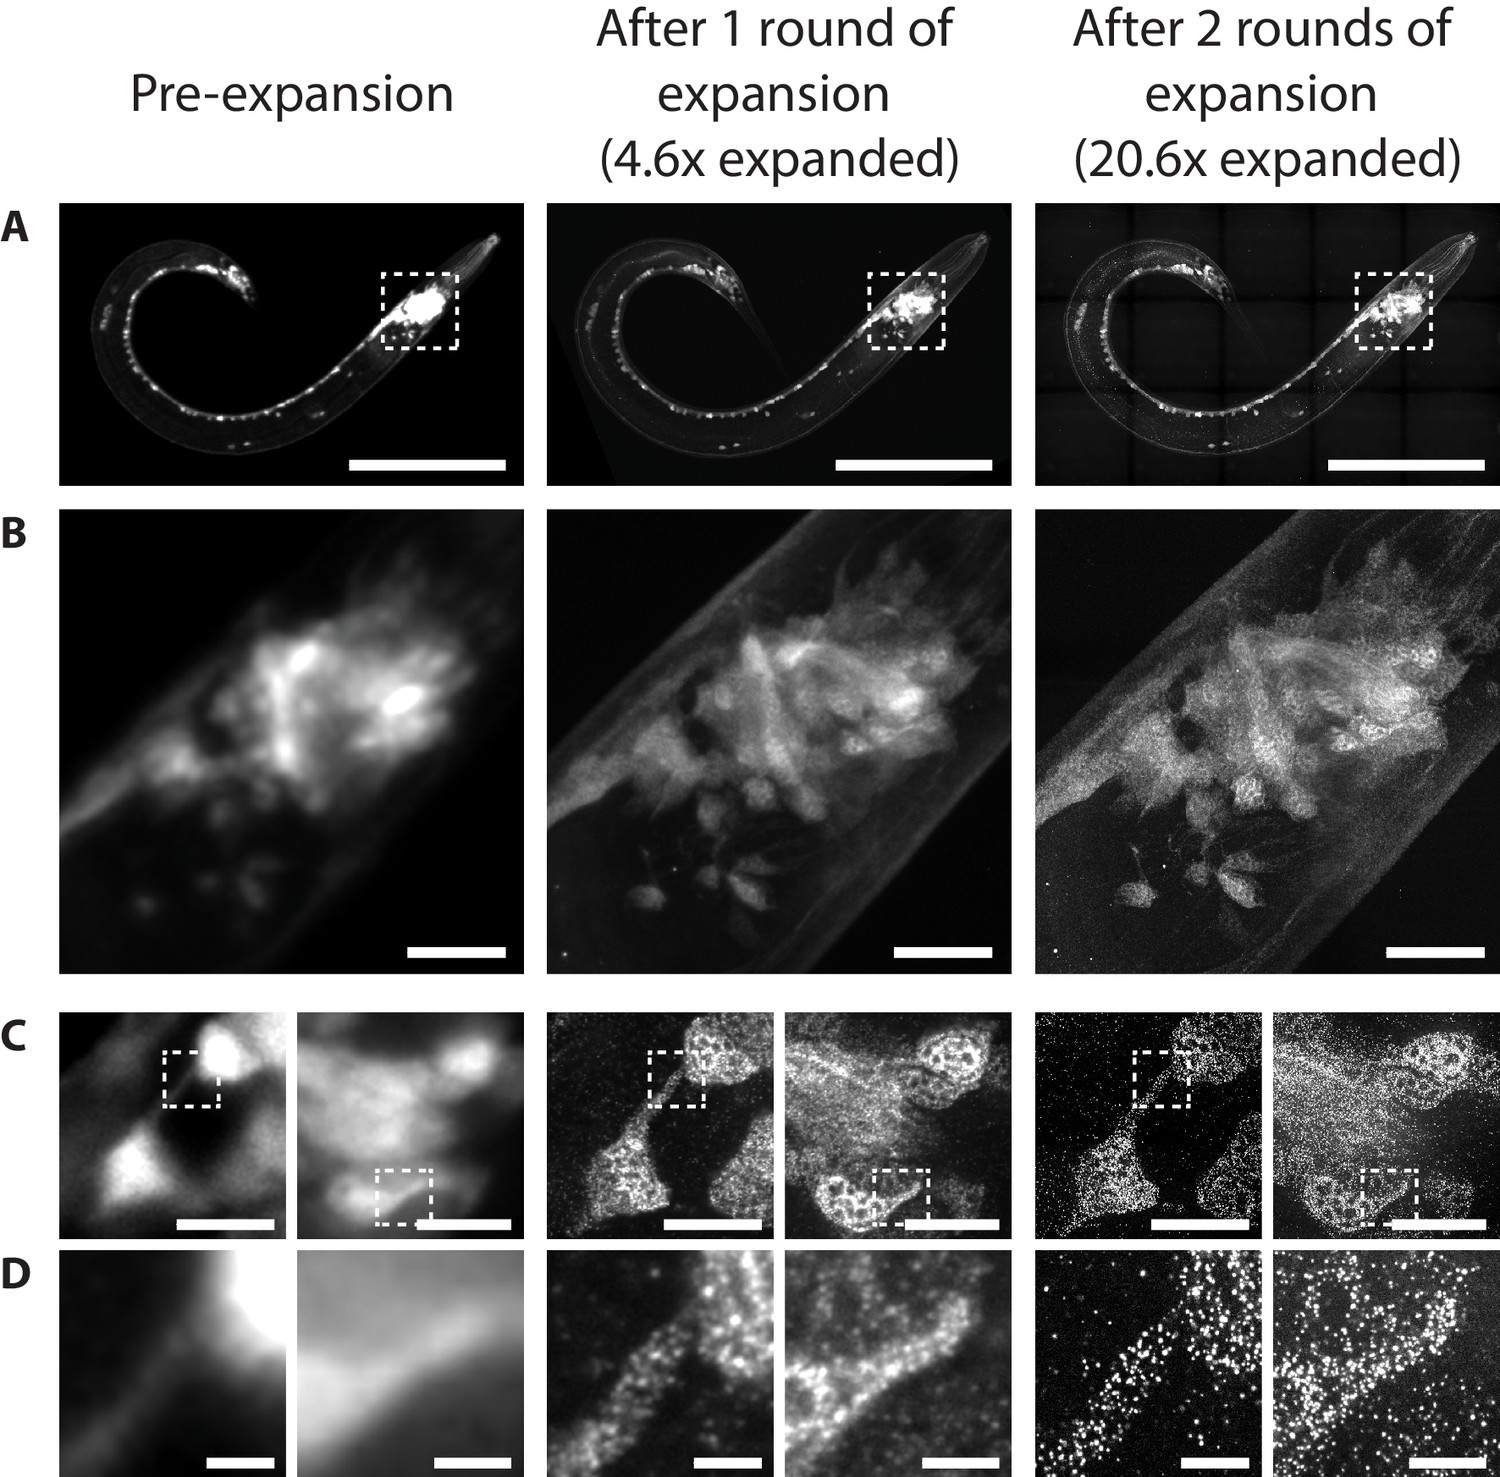
iExCel-expanded whole C. elegans.
A representative iExCel-processed (formaldehyde-fixed, β-mercaptoethanol-reduced, AcX-treated, hydrogel-embedded, Proteinase-K digested, antibody-stained, second-gel-re-embedded, linker-hybridized, third-gel-re-embedded, LNA-hybridized, as in Figure 17A–I) L3 hermaphrodite animal at various stages along the iExCel protocol. These stages include: (left column) right after first hydrogel embedding, (middle column) after re-embedding into the second hydrogel, and (right column) after full expansion with the third hydrogel. The strain used had pan-neuronal cytosolic expression of GFP, under tag-168p::GFP. Pre-expansion images were acquired from native GFP fluorescence. Post-1-round-expansion images were acquired after linker hybridization and before re-embedding into the third gel (as in Figure 17E), accompanied by the following additional steps (not included in the standard protocol shown in Figure 17, because we performed this intermediate readout only for the purpose of method validation): specimens were incubated with a fluorophore-conjugated 15-base DNA oligo that hybridizes to the 100-base linker, imaged, incubated in de-hybridization buffer (80% formamide, 0.1% Triton X-100) at 37°C for 6 hr to remove the fluorophore-conjugated-DNA-bound linker, and re-hybridized with a fresh set of linker, using the same hybridization protocol shown in Figure 17E. This linker refreshment ensures that the linkers have completely unoccupied binding sites for the downstream LNA hybridization. Post-2-round-expansion images were acquired after full iExCel protocol (as in Figure 17I). (A–D) The animal at various optical and digital magnifications. (A) Entire worm. White dotted box marks the pharyngeal region of the worm, which is shown in greater magnification in B. (B) Pharyngeal region of the worm, as marked by the white dotted box in A. (C) Two regions within the pharyngeal region of the worm, as shown in B. Corresponding regions were not marked in B, because the single-confocal-plane images shown in C do not clearly register to regions in B, which is a maximum-intensity projection acquired through the entire thickness of the animal. White dotted box marks subcellular features that are shown in greater magnification in D. (D) Subcellular features of neurons, such as a neuronal process (right) and a portion of the neuronal soma (left), as marked by the white dotted box in C. Objective used: (A–B) 10x, NA 0.50; (C–D) 40x, NA 1.15. Image depth: (A–B) max-intensity projections of confocal stacks acquired through the entire thickness of the animal. (C–D) single z-position confocal images, except for post-2-round-expansion images (right column), which are max-intensity projections of 2 consecutive images within the confocal stack, because the expansion-mediated improvement in the axial resolution causes each z-plane image to capture a reduced tissue thickness. Thus, a combination of features captured across two consecutive z-planes was required to register to all perceptible, z-distributed features in the pre-expansion and the post-1-round-expansion images. Brightness and contrast settings: each panel was first set by the automatic adjustment function in Fiji, and then manually adjusted (raising the minimum-intensity threshold and lowering the maximum-intensity threshold) to improve contrast. Linear expansion factor: post-1-round expansion, 4.6x; post-2-round expansion, 20.6x. Scale bars: (A) 100 μm; (B) 10 μm; (C) 5 μm; (D) 1 μm.
-
Figure 18—source data 1
Root-mean-square (RMS) length measurement errors plotted in Figure 18—figure supplement 1.
- https://cdn.elifesciences.org/articles/46249/elife-46249-fig18-data1-v1.mat
Figure 18—figure supplement 1
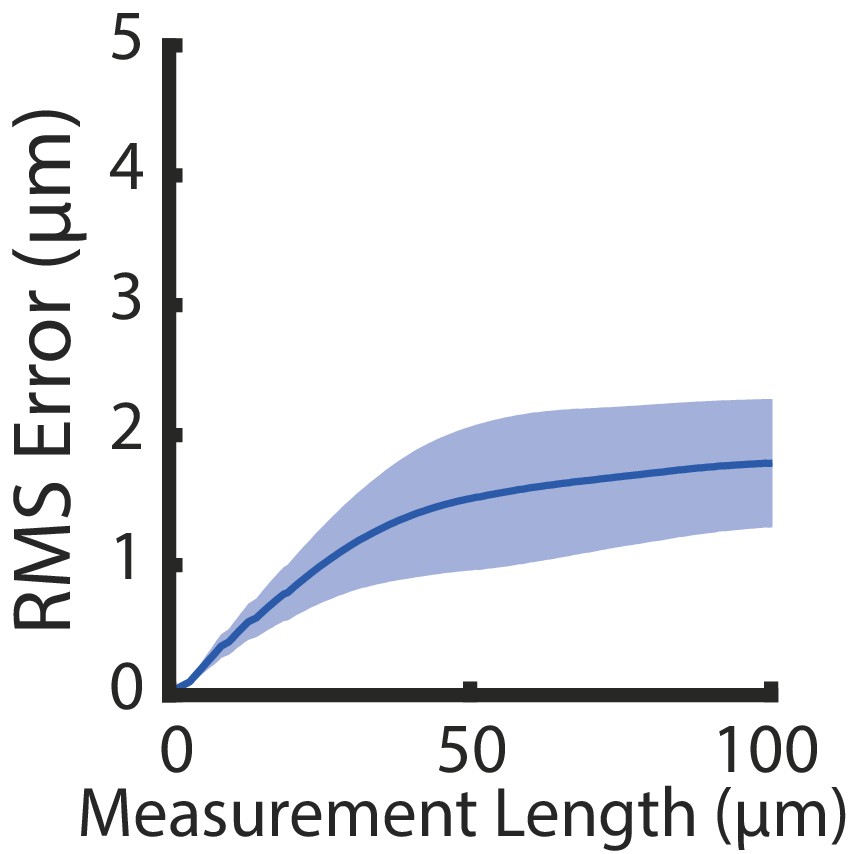
Isotropy of iExCel.
Root-mean-square length measurement error (‘RMS Error’) computed from pre-expansion images (as acquired in the left panel of Figure 18A) and post-2nd-round-expansion images (as acquired in the right panel of Figure 18A) of entire worms. Blue line, mean; shaded area, standard deviation. n = 6 animals from a single mixed-age population, which is distributed and separately processed over 2 hydrogel samples. Source data of the RMS length measurement errors are available in Figure 18—source data 1.
Appendix 1—figure 1
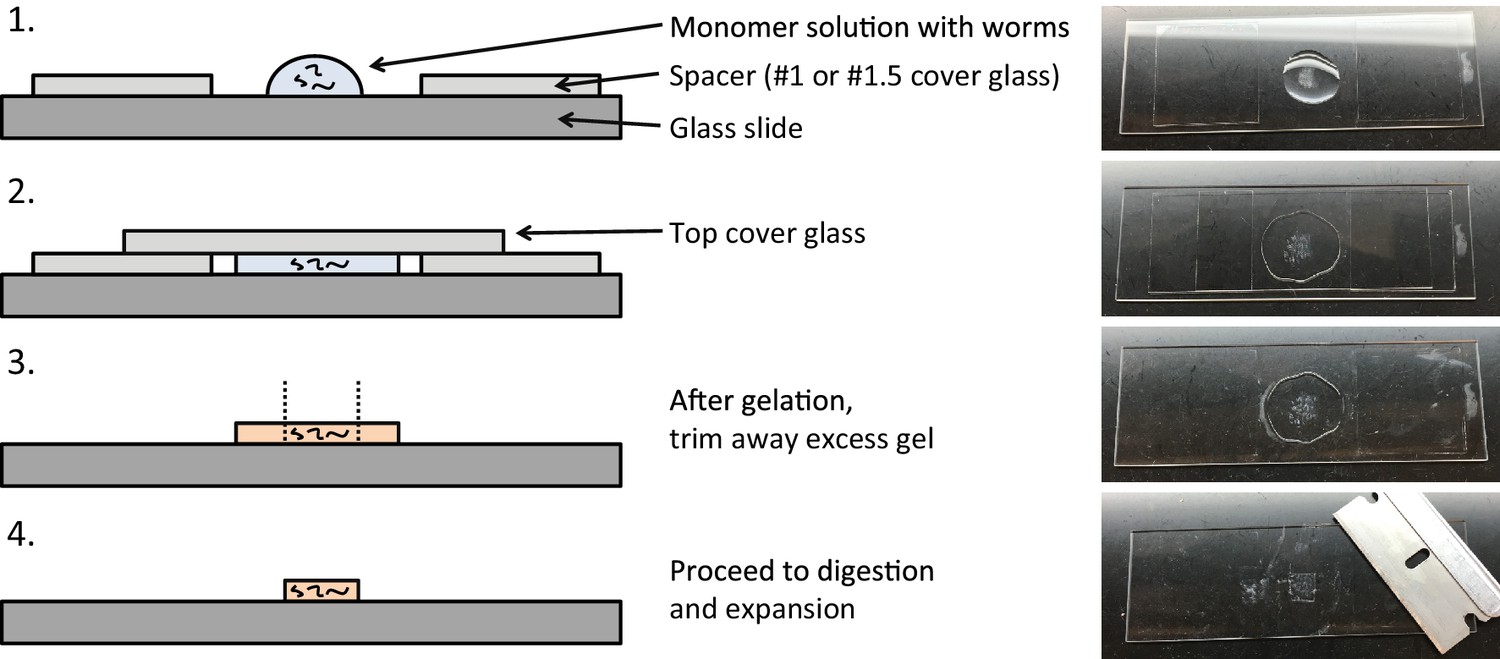
Construction of the gelling chamber.
Videos
Video 1
Post-ExCel NHS-ester staining of the pharyngeal region.
Confocal stack of the pharyngeal region of the L3 hermaphrodite animal shown in Figure 4A. Scale bar: 20 μm.
Video 2
Post-ExCel NHS-ester staining of the gut and germline tissue.
Confocal stack of the upper body region (between the pharynx and the vulva) of the L4 hermaphrodite animal shown in Figure 4B–C. Scale bar: 20 μm.
Video 3
ExCel 4-color readout.
Full confocal stack of the L2 hermaphrodite shown in Figure 5. Scale bars: 10 μm.
Video 4
Sub-cellular localization of unc-25 transcripts in motor neurons.
The retrovesicular ganglion of a representative ExCel-processed (formaldehyde-fixed, β-mercaptoethanol-reduced, LabelX- and AcX-treated, hydrogel-embedded, Proteinase-K digested and re-embedded; as in Figure 1A–I, M, N) L4 hermaphrodite animal labeled with anti-GFP (green), DAPI (blue) and ExFISH-HCR (red) against unc-25. The unc-25-expressing cells are motor neurons DD1 (bottom), VD1 (center) and VD2 (top). Strain expressed tag-168p::GFP. Brightness and contrast settings: first set by the automatic adjustment function in Fiji, and then manually adjusted (raising the minimum-intensity threshold and lowering the maximum-intensity threshold) to improve contrast for cellular morphology and ExFISH puncta. Linear expansion factor: 3.2x. Scale bar: 5 μm.
Video 5
iExCel-expanded nerve ring.
Full confocal stack of the pharyngeal region of the 2nd-round-expanded L3 hermaphrodite shown in the right panel of Figure 18B. Scale bar: 10 μm.
Tables
Table 1
Screened post-gelation treatments.
Experimental parameters used for each post-hydrogel-embedding treatment that was screened and shown in Figure 11C.
| Treatment type | Treatment name | Treatment buffer | Buffer pH | Protease concentration | Duration (triple numbers, times at 37oC-70oC-95oC, in hr) |
|---|---|---|---|---|---|
| No treatment | No treatment | TNT (Tris, 1M NaCl, Triton) | 8.0 | N/A | 0-0-0 (kept at RT) |
| Proteinase K | Proteinase K (standard ExCel) | 50 mM Tris pH 8 + 0.5M NaCl + 40 mM CaCl2 + 0.1% Triton | 8.0 | 8 U/mL | 2 days 37oC* |
| Non-Proteinase-K proteases | Trypsin (standard) | 50 mM Tris pH 8 + 0.5M NaCl + 40 mM CaCl2 | 8.0 | 1 mg/mL | 5 days 37oC* |
| Trypsin (seq grade) | 50 mM Tris pH 8 + 0.5M NaCl + 40 mM CaCl2 | 8.0 | 0.1 mg/mL | 5 days 37oC** | |
| Elastase | 50 mM Tris pH 9 + 0.5M NaCl + 40 mM CaCl2 | 9.0 | 0.5 mg/mL | 5 days 37oC* | |
| Pepsin | 3 mM HCl + 0.5M NaCl + 40 mM CaCl2 | 2.5 | 1 mg/mL | 5 days 37oC* | |
| Thermolysin | 50 mM Tris pH 8 + 0.5M NaCl + 40 mM CaCl2 | 8.0 | 0.5 mg/mL | 5 days 70oC* | |
| Papain | 1x PBS pH 6.5 + 5 mM L-cysteine + 5 mM EDTA + 2M NaCl | 6.5 | 1 mg/mL | 5 days 70oC* | |
| Alpha-chymotrypsin | 50 mM Tris pH 8 + 0.5M NaCl + 40 mM CaCl2 | 8.0 | 1 mg/mL | 5 days 25oC* | |
| Collagenase Type II | 50 mM Tris pH 8 + 0.5M NaCl + 40 mM CaCl2 | 8.0 | 1 U/mL | 5 days 37oC* | |
| Antigen retrieval | EDTA pH 8 | 10 mM Tris + 1 mM EDTA + 2M NaCl | 8.0 | N/A | 18-18-2 |
| EDTA-Tris pH 9 | 50 mM Tris + 1 mM EDTA + 0.05% Tween + 2M NaCl | 9.0 | N/A | 18-18-2 | |
| Citrate pH 6 | 10 mM citrate pH 6 + 0.05% Tween + 2M NaCl | 6.0 | N/A | 18-18-2 | |
| VC low | 5% (w/v) ascorbic acid + 2M NaCl | 3.0 | N/A | 1-1-1 | |
| VC high | 5% (w/v) ascorbic acid + 2M NaCl | 3.0 | N/A | 3-24-2 | |
| Heat denaturation in MAP-based buffers | MAP1 18-18-2 | 50 mM Tris + 200 mM SDS + 200 mM NaCl | 9.0 | N/A | 18-18-2 |
| MAP5 18-18-2 | 50 mM Tris + 200 mM SDS + 400 mM NaCl + 20 mM CaCl2 | 9.0 | N/A | 18-18-2 | |
| MAP5 120-18-2 | 50 mM Tris + 200 mM SDS + 400 mM NaCl + 20 mM CaCl2 | 9.0 | N/A | 120-18-2 | |
| MAP5 18-120-2 | 50 mM Tris + 200 mM SDS + 400 mM NaCl + 20 mM CaCl2 | 9.0 | N/A | 18-120-2 | |
| MAP5 18-18-120 | 50 mM Tris + 200 mM SDS + 400 mM NaCl + 20 mM CaCl2 | 9.0 | N/A | 18-18-120 | |
| MAP5 18-18-18 | 50 mM Tris + 200 mM SDS + 400 mM NaCl + 20 mM CaCl2 | 9.0 | N/A | 18-18-18 | |
| MAP5 18-18-2-2 | 50 mM Tris + 200 mM SDS + 400 mM NaCl + 20 mM CaCl2 | 9.0 | N/A | 18-18-2, and 2 hr at 121oC |
-
* Multi-day protease treatments are refreshed with newly prepared solutions every day, to partially compensate for loss of enzyme activity over time.
** Refreshment for Trypsin (seq grade) was performed only on Day 1, 3, 5, instead of daily, due to limits on reagent availability.
Key resources table
| Reagent type (species) or resource | Designation | Source or reference | Identifiers | Additional information |
|---|---|---|---|---|
| Strain, strain background (Caenor-habditis elegans) | N2 | Caenorhabditis Genetics Center | RRID:WB-STRAIN:WBStrain00000001 | Genotype: wild-type |
| Strain, strain background (C. elegans) | CX16682 | This paper | Genotype: kyIs700 [tag-168p::GFP; tag-168p::rpl-22-3xHA] ? (‘?” denotes that the chromosome where the construct got integrated is unknown) | |
| Strain, strain background (C. elegans) | CZ1632 | Caenorhabditis Genetics Center | RRID:WB-STRAIN:WBStrain00005366 | Genotype: juIs76 [unc-25p::GFP + lin-15(+)] II |
| Strain, strain background (C. elegans) | NM2415 | Caenorhabditis Genetics Center | RRID:WB-STRAIN:WBStrain00029065 | Genotype: jsIs682 [rab-3p::GFP::rab-3 + lin-15(+)] III |
| Strain, strain background (C. elegans) | KP1148 | Caenorhabditis Genetics Center | RRID:WB-STRAIN:WBStrain00023626 | Genotype: nuIs25 [glr-1p::glr-1::GFP + lin-15(+)] ? |
| Strain, strain background (C. elegans) | CZ333 | Caenorhabditis Genetics Center | RRID:WB-STRAIN:WBStrain00005345 | Genotype: juIs1 [unc-25p::snb-1::GFP + lin-15(+)] IV |
| Strain, strain background (C. elegans) | CF702 | Caenorhabditis Genetics Center | RRID:WB-STRAIN:WBStrain00004831 | Genotype: muIs32 [mec-7p: :GFP + lin-15(+)] II |
| Strain, strain background (C. elegans) | NQ570 | Caenorhabditis Genetics Center | RRID:WB-STRAIN:WBStrain00029098 | Genotype: qnIs303 [hsp-16.2p::flp-13 + hsp-16.2p::GFP + rab-3p::mCherry] IV |
| Strain, strain background (C. elegans) | AML32 | Caenorhabditis Genetics Center | RRID:WB-STRAIN:WBStrain00000192 | Genotype: wtfIs5 [rab-3p::NLS::GCaMP6s + rab-3p::NLS::TagRFP] ? |
| Strain, strain background (C. elegans) | OH16372 | This paper | Genotype: che-7(ot866[che-7::TagRFP)] | |
| Antibody | anti-GFP (chicken polyclonal) | Abcam | Cat#: ab13970; RRID:AB_300798 | IHC (1:100) |
| Antibody | anti-GFP (rabbit polyclonal) | Thermo Fisher Scientific | Cat#: A11122; RRID:AB_221569 | IHC (1:200) |
| Antibody | anti-mCherry (rabbit polyclonal) | Kerafast | Cat#: EMU106 | IHC (1:500 – 1:2000) |
| Antibody | anti-TagRFP (guinea pig polyclonal) | Kerafast | Cat#: EMU108 | IHC (1:500 –1:2000) |
| Antibody | anti-RFP (rabbit polyclonal) | Thermo Fisher Scientific | Cat#: R10367; RRID:AB_2315269 | IHC (1:100) |
| Antibody | anti-DLG-1 (mouse monoclonal) | Developmental Studies Hybridoma Bank | Cat#: DLG1; RRID:AB_2314321 | IHC (5 μg/mL) |
| Antibody | anti-UNC-10 (mouse monoclonal) | Developmental Studies Hybridoma Bank | Cat#: RIM; RRID:AB_579790 | IHC (5 μg/mL) |
| Antibody | anti-UNC-10 (mouse monoclonal) | Developmental Studies Hybridoma Bank | Cat#: RIM2; RRID:AB_10570332 | IHC (5 μg/mL) |
| Antibody | anti-myotactin (mouse monoclonal) | Developmental Studies Hybridoma Bank | Cat#: MH46; RRID:AB_528387 | IHC (5 μg/mL) |
| Antibody | anti-SAX-7 (mouse monoclonal) | Developmental Studies Hybridoma Bank | Cat#: CeSAX7; RRID:AB_10567266 | IHC (5 μg/mL) |
| Antibody | anti-SNB-1 (mouse monoclonal) | Developmental Studies Hybridoma Bank | Cat#: SB1; RRID:AB_579792 | IHC (5 μg/mL) |
| Antibody | anti-DYN-1 (mouse monoclonal) | Developmental Studies Hybridoma Bank | Cat#: DYN1; RRID:AB_10572297 | IHC (5 μg/mL) |
| Antibody | anti-acetylated-tubulin (mouse monoclonal) | Millipore Sigma | Cat#: T7451; RRID:AB_609894 | IHC (5 μg/mL) |
| Antibody | anti-DAO-5 (mouse monoclonal) | Developmental Studies Hybridoma Bank | Cat#: DAO5; RRID:AB_10573805 | IHC (5 μg/mL) |
| Antibody | anti-LMP-1 (mouse monoclonal) | Developmental Studies Hybridoma Bank | Cat#: LMP1; RRID:AB_2161795 | IHC (5 μg/mL) |
| Antibody | anti-LMN-1 (mouse monoclonal) | Developmental Studies Hybridoma Bank | Cat#: LMN1; RRID:AB_10573809 | IHC (5 μg/mL) |
| Antibody | anti-HCP-4 (mouse monoclonal) | Developmental Studies Hybridoma Bank | Cat#: HCP4; RRID:AB_2078913 | IHC (5 μg/mL) |
| Antibody | anti-CYP-33E1 (mouse monoclonal) | Developmental Studies Hybridoma Bank | Cat#: CYP33E1; RRID:AB_10571938 | IHC (5 μg/mL) |
| Antibody | anti-HMR-1 (mouse monoclonal) | Developmental Studies Hybridoma Bank | Cat#: HMR1; RRID:AB_2153752 | IHC (5 μg/mL) |
| Antibody | anti-LET-413 (mouse monoclonal) | Developmental Studies Hybridoma Bank | Cat#: LET413; RRID:AB_10571452 | IHC (5 μg/mL) |
| Antibody | anti-chicken-IgY (donkey polyclonal) | Jackson Immuno-Research | Cat#: 703-005-155; RRID:AB_2340346 | IHC (10 μg/mL) |
Additional files
Download links
A two-part list of links to download the article, or parts of the article, in various formats.
Downloads (link to download the article as PDF)
Open citations (links to open the citations from this article in various online reference manager services)
Cite this article (links to download the citations from this article in formats compatible with various reference manager tools)
Expansion microscopy of C. elegans
eLife 9:e46249.
https://doi.org/10.7554/eLife.46249


